business plan pro sample - palo alto software
TRANSCRIPT
Busin
ess P
lan
Pro
Sam
ple
Mike's Trucking Service — Sample Plan
This sample business plan was created using Business Plan Pro®—business planning software published by Palo Alto Software.
This plan may be edited using Business Plan Pro and is one of 500+ sample plans available from within the software.
To learn more about Business Plan Pro and other planning products for small and medium sized businesses, visit us at www.paloalto.com.
————————————————————————————————————————
This is a sample business plan and the names, locations and numbers may have been changed, and substantial portions of the original plan text may have been omitted to preserve confidentiality and proprietary information.
You are welcome to use this plan as a starting point to create your own, but you do not have permission to reproduce, publish, distribute or even copy this plan as it exists here.
Requests for reprints, academic use, and other dissemination of this sample plan should be emailed to the marketing department of Palo Alto Software at [email protected]. For product information visit our Website: www.paloalto.com or call: 1-800-229-7526.
Copyright © Palo Alto Software, Inc., 1995-2006. All rights reserved.
Busin
ess P
lan
Pro
Sam
ple
Confidentiality Agreement
The undersigned reader acknowledges that the information provided by _________________________ in this business plan is confidential; therefore, reader agrees not to disclose it without the express written permission of _________________________.
It is acknowledged by reader that information to be furnished in this business plan is in all respects confidential in nature, other than information which is in the public domain through other means and that any disclosure or use of same by reader, may cause serious harm or damage to _________________________.
Upon request, this document is to be immediately returned to _________________________.
___________________ Signature
___________________Name (typed or printed)
___________________Date
This is a business plan. It does not imply an offering of securities.

Busin
ess P
lan
Pro
Sam
ple
1.0 Executive Summary . . . . . . . . . . . . . . . . . . . . . . . . . . . . . . . . . . . . . . . . . . . . . . . . 11.1 Mission . . . . . . . . . . . . . . . . . . . . . . . . . . . . . . . . . . . . . . . . . . . . . . . . . . . . . 2
2.0 The Company . . . . . . . . . . . . . . . . . . . . . . . . . . . . . . . . . . . . . . . . . . . . . . . . . . . . . 22.1 Company History . . . . . . . . . . . . . . . . . . . . . . . . . . . . . . . . . . . . . . . . . . . . . . 3
3.0 Services . . . . . . . . . . . . . . . . . . . . . . . . . . . . . . . . . . . . . . . . . . . . . . . . . . . . . . . . . 4
4.0 Market Analysis Summary . . . . . . . . . . . . . . . . . . . . . . . . . . . . . . . . . . . . . . . . . . . 44.1 Market Segmentation . . . . . . . . . . . . . . . . . . . . . . . . . . . . . . . . . . . . . . . . . . . 54.2 Target Market Segment Strategy . . . . . . . . . . . . . . . . . . . . . . . . . . . . . . . . . . . 64.3 Service Business Analysis . . . . . . . . . . . . . . . . . . . . . . . . . . . . . . . . . . . . . . . . 6
4.3.1 Business Participants . . . . . . . . . . . . . . . . . . . . . . . . . . . . . . . . . . . . . . 74.3.2 Competition and Buying Patterns . . . . . . . . . . . . . . . . . . . . . . . . . . . . . 84.3.3 Risks . . . . . . . . . . . . . . . . . . . . . . . . . . . . . . . . . . . . . . . . . . . . . . . . . 8
5.0 Strategy . . . . . . . . . . . . . . . . . . . . . . . . . . . . . . . . . . . . . . . . . . . . . . . . . . . . . . . . . 95.1 Value Propositions . . . . . . . . . . . . . . . . . . . . . . . . . . . . . . . . . . . . . . . . . . . . . 95.2 Competitive Edge . . . . . . . . . . . . . . . . . . . . . . . . . . . . . . . . . . . . . . . . . . . . . . 95.3 Marketing Strategy . . . . . . . . . . . . . . . . . . . . . . . . . . . . . . . . . . . . . . . . . . . . 10
5.3.1 Pricing . . . . . . . . . . . . . . . . . . . . . . . . . . . . . . . . . . . . . . . . . . . . . . . . 105.3.2 Marketing Plan . . . . . . . . . . . . . . . . . . . . . . . . . . . . . . . . . . . . . . . . . . 11
5.4 Sales Strategy . . . . . . . . . . . . . . . . . . . . . . . . . . . . . . . . . . . . . . . . . . . . . . . . 11
6.0 Management Summary . . . . . . . . . . . . . . . . . . . . . . . . . . . . . . . . . . . . . . . . . . . . . . 136.1 Organization . . . . . . . . . . . . . . . . . . . . . . . . . . . . . . . . . . . . . . . . . . . . . . . . . 136.2 Officers and Key Employees . . . . . . . . . . . . . . . . . . . . . . . . . . . . . . . . . . . . . . 13
7.0 Finance . . . . . . . . . . . . . . . . . . . . . . . . . . . . . . . . . . . . . . . . . . . . . . . . . . . . . . . . . . 147.1 Significant Assumptions . . . . . . . . . . . . . . . . . . . . . . . . . . . . . . . . . . . . . . . . . 147.2 Break-even Analysis . . . . . . . . . . . . . . . . . . . . . . . . . . . . . . . . . . . . . . . . . . . . 157.3 Income Statements - Projected . . . . . . . . . . . . . . . . . . . . . . . . . . . . . . . . . . . . 167.4 Projected Cash Flow . . . . . . . . . . . . . . . . . . . . . . . . . . . . . . . . . . . . . . . . . . . . 177.5 Balance Sheets - Projected . . . . . . . . . . . . . . . . . . . . . . . . . . . . . . . . . . . . . . . 197.6 Business Ratios . . . . . . . . . . . . . . . . . . . . . . . . . . . . . . . . . . . . . . . . . . . . . . . 19
Table of Contents
Busin
ess P
lan
Pro
Sam
ple
1.0 Executive Summary
Mike's Trucking Service is a Dallas, TX based trucking company that aims to be one of the largest trucking companies in the USA. Mike's is initially focusing on the food industry with plans to diversify with new industries served. Mike's has chosen the trucking industry as the growth prospects are encouraging and stable, with trucking dominating the freight industry in this country.
Services
Mike's will offer both for-hire trucking as well as private carriers. Most of their business will be derived from the private carriers. For the private carrier segment, both truck load (TL) and less than truck load (LTL) will be offered. Mike's services will be especially attractive to the food industry, as participants in that industry typically use referrals, reputation, and customer service as purchasing variables.
Customer Segments
Mike's will serve four different market segments. The first, as mentioned earlier is the food industry. This segment is growing at an annual rate of 3% with 3000 potential customers identified. The second segment is the computer industry with a 5 % growth rate and 1500 possible customers. The retail industry is the third with a 2% growth rate and 1500 customers. The last segment is a catch all "other" segment growing at 2% and 500 customers.
Management
Mike's Trucking is lead by Mike Smith, a 15 year industry veteran. After college Mike went to work for C&F trucking as a driver for two years. Mike felt that it was instrumental to have experience within an industry at all levels. It was quickly obvious that Mike has skills beyond driving trucks and moved into management for three years. After five years at C&F it was time for a change and Mike went to Yellow to manage their Southwest region operations. It was ten years of experience at Yellow that provided Mike with the skill sets, experience, and confidence to decide to open his own trucking company business.
Marketing
Mike's will employ three distinct marketing efforts to raise awareness about the company and generate new customers. The first strategy is the use of promotions. This will focus on press releases and advertising using various different medias. The second effort will be the use of incentives. The incentives will be offered to existing customers. The last effort will be printed brochures. These will be distributed to new and existing customers.
Mike's Trucking Service is a customer-centric organization looking to become one of the premier trucking companies in the USA. Profitability is forecasted to occur at month three. Mike's has conservatively projected sales of $6151 for year one and $112,230 for year three.
Mike's Trucking Service — Sample Plan
Copyright © Palo Alto Software, Inc. 2002 All rights reserved. www.paloalto.com Not for reproduction, publication, or distribution. Pg 1
Busin
ess P
lan
Pro
Sam
ple
$0
$50,000
$100,000
$150,000
$200,000
$250,000
$300,000
$350,000
$400,000
2000 2001 2002
Sales
Gross Margin
Net Profit
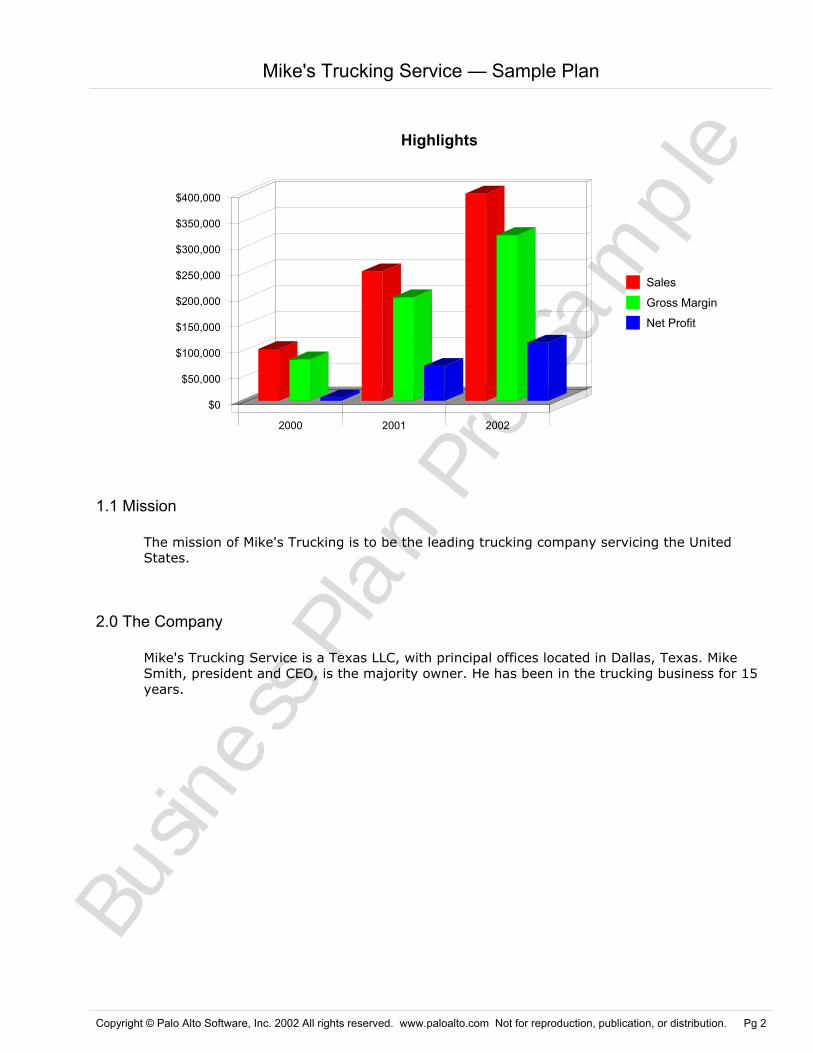
Highlights
1.1 Mission
The mission of Mike's Trucking is to be the leading trucking company servicing the United States.
2.0 The Company
Mike's Trucking Service is a Texas LLC, with principal offices located in Dallas, Texas. Mike Smith, president and CEO, is the majority owner. He has been in the trucking business for 15 years.
Mike's Trucking Service — Sample Plan
Copyright © Palo Alto Software, Inc. 2002 All rights reserved. www.paloalto.com Not for reproduction, publication, or distribution. Pg 2
Busin
ess P
lan
Pro
Sam
ple
2.1 Company History
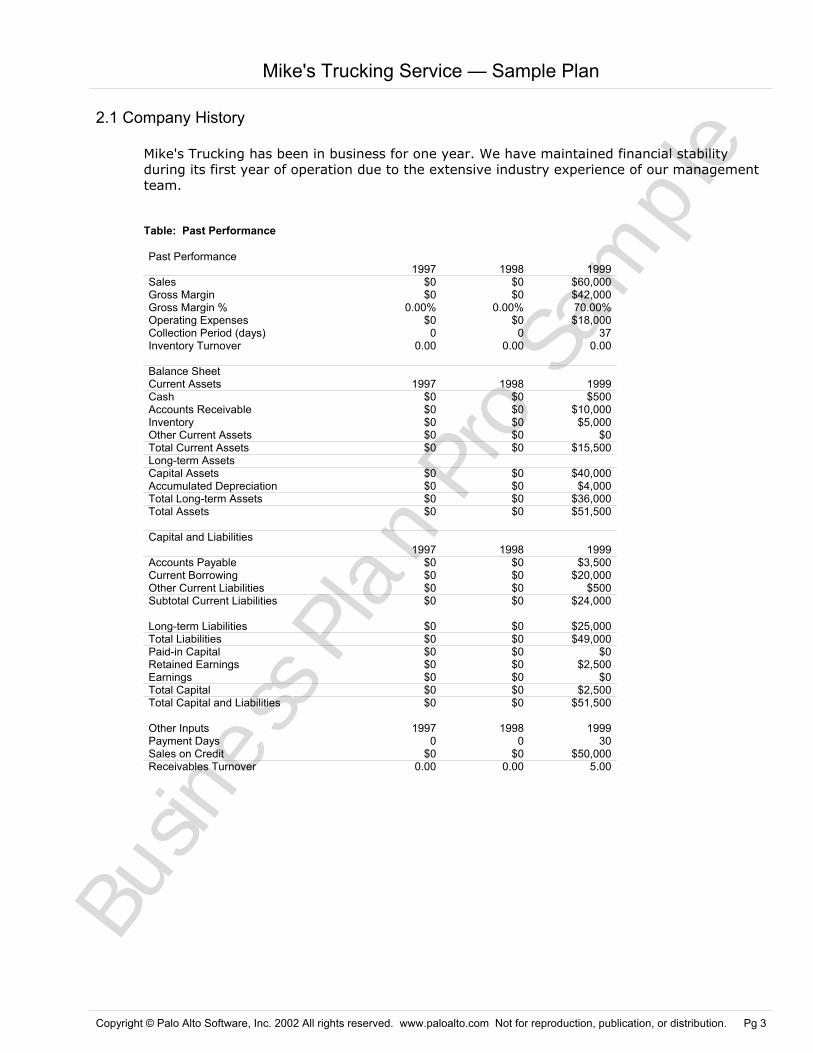
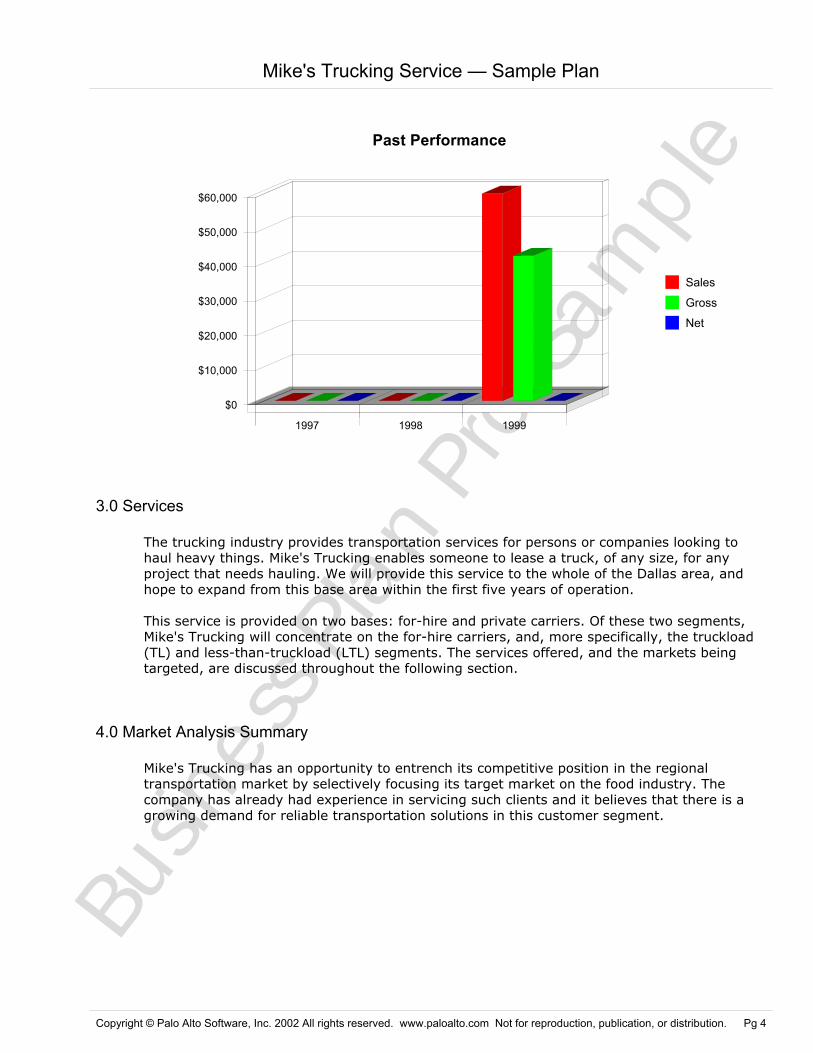
Mike's Trucking has been in business for one year. We have maintained financial stability during its first year of operation due to the extensive industry experience of our management team.
Table: Past Performance
Past Performance1997 1998 1999
Sales $0 $0 $60,000Gross Margin $0 $0 $42,000Gross Margin % 0.00% 0.00% 70.00%Operating Expenses $0 $0 $18,000Collection Period (days) 0 0 37Inventory Turnover 0.00 0.00 0.00
Balance SheetCurrent Assets 1997 1998 1999Cash $0 $0 $500Accounts Receivable $0 $0 $10,000Inventory $0 $0 $5,000Other Current Assets $0 $0 $0Total Current Assets $0 $0 $15,500Long-term AssetsCapital Assets $0 $0 $40,000Accumulated Depreciation $0 $0 $4,000Total Long-term Assets $0 $0 $36,000Total Assets $0 $0 $51,500
Capital and Liabilities1997 1998 1999
Accounts Payable $0 $0 $3,500Current Borrowing $0 $0 $20,000Other Current Liabilities $0 $0 $500Subtotal Current Liabilities $0 $0 $24,000
Long-term Liabilities $0 $0 $25,000Total Liabilities $0 $0 $49,000Paid-in Capital $0 $0 $0Retained Earnings $0 $0 $2,500Earnings $0 $0 $0Total Capital $0 $0 $2,500Total Capital and Liabilities $0 $0 $51,500
Other Inputs 1997 1998 1999Payment Days 0 0 30Sales on Credit $0 $0 $50,000Receivables Turnover 0.00 0.00 5.00
Mike's Trucking Service — Sample Plan
Copyright © Palo Alto Software, Inc. 2002 All rights reserved. www.paloalto.com Not for reproduction, publication, or distribution. Pg 3
Busin
ess P
lan
Pro
Sam
ple
$0
$10,000
$20,000
$30,000
$40,000
$50,000
$60,000
1997 1998 1999
Sales
Gross
Net
Past Performance
3.0 Services
The trucking industry provides transportation services for persons or companies looking to haul heavy things. Mike's Trucking enables someone to lease a truck, of any size, for any project that needs hauling. We will provide this service to the whole of the Dallas area, and hope to expand from this base area within the first five years of operation.
This service is provided on two bases: for-hire and private carriers. Of these two segments, Mike's Trucking will concentrate on the for-hire carriers, and, more specifically, the truckload (TL) and less-than-truckload (LTL) segments. The services offered, and the markets being targeted, are discussed throughout the following section.
4.0 Market Analysis Summary
Mike's Trucking has an opportunity to entrench its competitive position in the regional transportation market by selectively focusing its target market on the food industry. The company has already had experience in servicing such clients and it believes that there is a growing demand for reliable transportation solutions in this customer segment.
Mike's Trucking Service — Sample Plan
Copyright © Palo Alto Software, Inc. 2002 All rights reserved. www.paloalto.com Not for reproduction, publication, or distribution. Pg 4
Busin
ess P
lan
Pro
Sam
ple
4.1 Market Segmentation
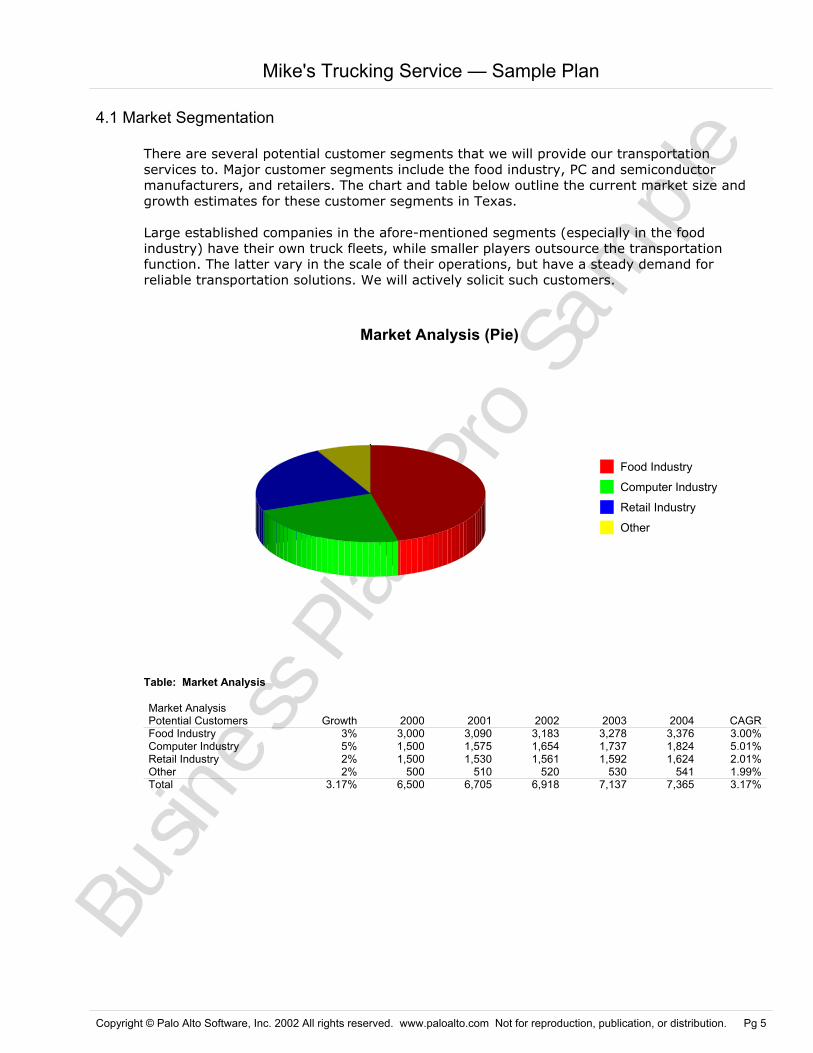
There are several potential customer segments that we will provide our transportation services to. Major customer segments include the food industry, PC and semiconductor manufacturers, and retailers. The chart and table below outline the current market size and growth estimates for these customer segments in Texas.
Large established companies in the afore-mentioned segments (especially in the food industry) have their own truck fleets, while smaller players outsource the transportation function. The latter vary in the scale of their operations, but have a steady demand for reliable transportation solutions. We will actively solicit such customers.
Food Industry
Computer Industry
Retail Industry
Other
Market Analysis (Pie)
Table: Market Analysis
Market AnalysisPotential Customers Growth 2000 2001 2002 2003 2004 CAGRFood Industry 3% 3,000 3,090 3,183 3,278 3,376 3.00%Computer Industry 5% 1,500 1,575 1,654 1,737 1,824 5.01%Retail Industry 2% 1,500 1,530 1,561 1,592 1,624 2.01%Other 2% 500 510 520 530 541 1.99%Total 3.17% 6,500 6,705 6,918 7,137 7,365 3.17%
Mike's Trucking Service — Sample Plan
Copyright © Palo Alto Software, Inc. 2002 All rights reserved. www.paloalto.com Not for reproduction, publication, or distribution. Pg 5

Busin
ess P
lan
Pro
Sam
ple
4.2 Target Market Segment Strategy
Mike's Trucking will focus its marketing budget on a selected industry niche. A narrow-served market focus will help strengthen the company's reputation of a reliable transportation services provider and will generate favorable referrals.
The major customer segment the company is focusing on is the food industry. Companies in this segment have varying needs, and Mike's Trucking has already gained valuable experience serving such customers. The company management believes that by increasing its truck fleet it can capture additional clients and provide better service to existing clients.
4.3 Service Business Analysis
Market Description Industry: Trucking, except local
Establishments that are primarily engaged in furnishing "over-the-road" trucking services or trucking and storage services for freight generally weighing more than 100 pounds. Such operations are principally outside a single municipality, group of contiguous municipalities, or municipality and its suburban areas.
Market Size Statistics
Estimated number of U.S. establishments 48,117Number of people employed in this industry 812,712Total annual sales in this industry $139 millionAverage employees per establishment 17Average sales per establishment $3.6 million
Standard & Poor's estimates that the U.S. commercial freight transportation market had aggregate revenues of $436 billion in 1998. In other words, five cents of every dollar of U.S. gross domestic product that year was spent on transportation.
Industry trends
While a driver shortage continues to plague the TL sector, the LTL carriers have adapted to changing market conditions in order to capitalize on growth opportunities. Intermodal shippers also stand to benefit from market trends. And the evolution of electronic commerce stands to intensify competition among all carriers.
Truckers Dominate Freight Market
Based on value of service, trucking (excluding warehousing and logistics) accounted for 79%, or some $344 billion, of U.S. commercial freight revenues in 1998, but only 45% of total ton miles. This is because products transported by truck tend to be lightweight, manufactured goods that move short distances, rather than the heavy, long haul, bulk commodities that travel by rail and barge.
Motor carriers specialize in higher-value freight that moves 750 miles or less and for which delivery is required within three days. Some 36% of truck freight (measured by shipping cost) never crosses state lines. Examples of this type of freight are food and consumer staples delivered locally, and manufactured goods shipped between commercial establishments or delivered to consumers or retail outlets.
Mike's Trucking Service — Sample Plan
Copyright © Palo Alto Software, Inc. 2002 All rights reserved. www.paloalto.com Not for reproduction, publication, or distribution. Pg 6
Busin
ess P
lan
Pro
Sam
ple
Truckers have the largest share of the freight market. Unlike railroads, pipelines, or water carriers, they don't face geographic limits caused by physical constraints, and can offer door-to-door service. They also pay relatively little to use the nation's highway system. Railroads, by contrast, must build, maintain, and police their rights-of-way.
The trucking industry consists of two broad segments: private and for hire. In turn, for-hire truckers fall into two broad categories: truckload and less-than-truckload carriers.
4.3.1 Business Participants
Trucking
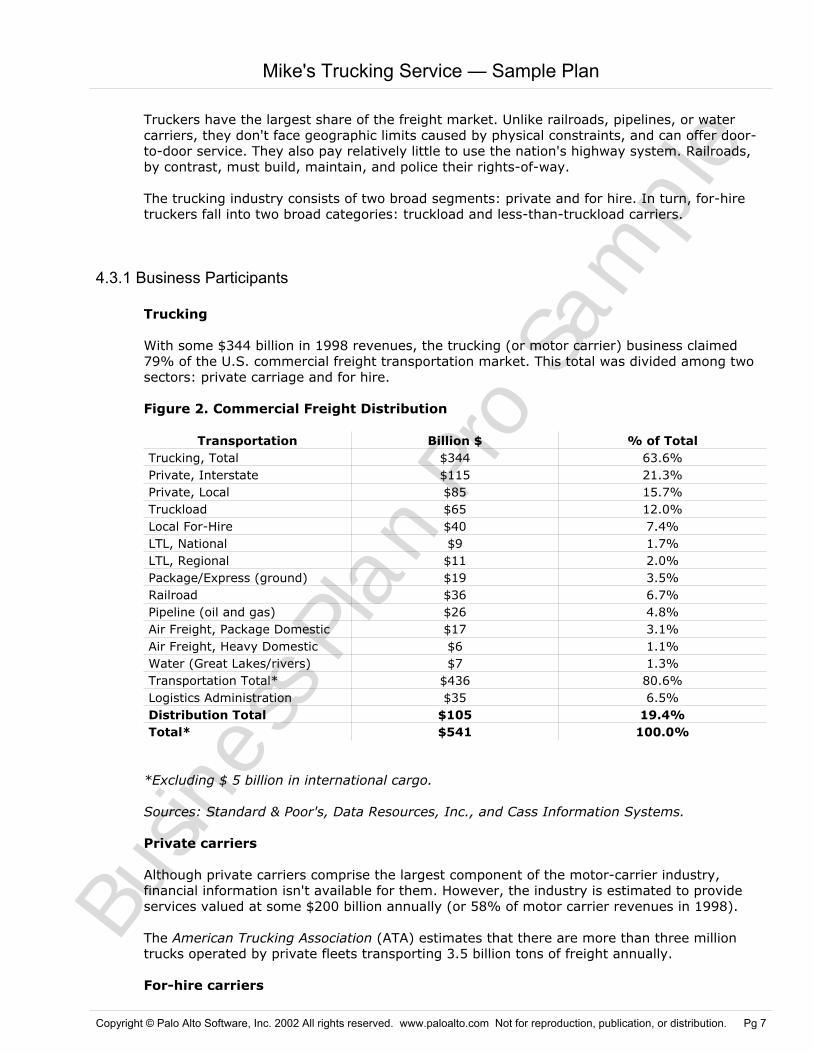
With some $344 billion in 1998 revenues, the trucking (or motor carrier) business claimed 79% of the U.S. commercial freight transportation market. This total was divided among two sectors: private carriage and for hire.
Figure 2. Commercial Freight Distribution
Transportation Billion $ % of TotalTrucking, Total $344 63.6%Private, Interstate $115 21.3%Private, Local $85 15.7%Truckload $65 12.0%Local For-Hire $40 7.4%LTL, National $9 1.7%LTL, Regional $11 2.0%Package/Express (ground) $19 3.5%Railroad $36 6.7%Pipeline (oil and gas) $26 4.8%Air Freight, Package Domestic $17 3.1%Air Freight, Heavy Domestic $6 1.1%Water (Great Lakes/rivers) $7 1.3%Transportation Total* $436 80.6%Logistics Administration $35 6.5%Distribution Total $105 19.4%Total* $541 100.0%
*Excluding $ 5 billion in international cargo.
Sources: Standard & Poor's, Data Resources, Inc., and Cass Information Systems.
Private carriers
Although private carriers comprise the largest component of the motor-carrier industry, financial information isn't available for them. However, the industry is estimated to provide services valued at some $200 billion annually (or 58% of motor carrier revenues in 1998).
The American Trucking Association (ATA) estimates that there are more than three million trucks operated by private fleets transporting 3.5 billion tons of freight annually.
For-hire carriers
Mike's Trucking Service — Sample Plan
Copyright © Palo Alto Software, Inc. 2002 All rights reserved. www.paloalto.com Not for reproduction, publication, or distribution. Pg 7
Busin
ess P
lan
Pro
Sam
ple
The for-hire category generated $144 billion in 1998, or 42% of the industry total. Of that $144 billion, some $105 billion (73% of the sector's business) came from truckload shipments, and $39 billion (27%) was from less-than-truckload and package/express delivery.
• Truckload (TL). The national for-hire truckload segment had total revenues of $65 billion in 1998. The TL sector has historically been mostly privately owned, with the exception of the top ten publicly-owned companies (For this reason, we focused on the LTL sector in this survey). Schneider National Carriers was the largest TL operator, with revenues of $2.8 billion in 1998, followed by J.B. Hunt Transport Services ($1.8 billion), and the Landstar family of truckload-carriers ($1.3 billion). Of the 50,000 truck load carriers, perhaps 95% had annual revenues of less than $1 million.
• Less-than-truckload (LTL). The ATA estimates that the less-than-truckload market garnered $20 billion in 1998. Of this amount, the fast-growing regional segment accounted for slightly more than the national market.
The largest national LTL carrier was Roadway Express Inc., with $2.32 billion in LTL revenues in 1998; the company's total revenue of $2.55 billion includes TL freight. Yellow Freight System (a unit of Yellow Corporation) was close behind, with $2.25 billion (out of $2.46 billion total). Consolidated Freightways Corporation was third, with $1.95 billion in LTL revenues.
In the regional LTL market, Con-Way Transportation (a unit of CNF Transportation Inc.) was the largest player, with $1.5 billion in LTL revenue in 1998. Second place belonged to US Freightways, whose family of five carriers generated some 41.4 billion in LTL revenue. American Freightways Corporation was third, with $928 million in less-than-truckload revenues.
4.3.2 Competition and Buying Patterns
Although there are major players in each of the commercial carrier market segments, the market remains highly fragmented. According to the Dallas Yellow Pages, there are numerous companies providing different kinds of the trucking services. Major competitors for Mike's Trucking are those companies who have comparable truck fleets and are also targeting the food industry.
Market research shows that customers in the food industry are price sensitive, and they value on-time deliveries, special handling capabilities, and less-than-truckload orders. Customer referrals and carrier's reputation are believed to strongly influence the buying decision.
4.3.3 Risks
The company recognizes that it is subject to both market and industry risks. The two primary risks to the company are:
• Industry concentration risk. The company is mainly focused on food industry businesses in the United States. This position is favorable since the industry is fairly stable. Any slow down in the food production would have negative repercussions for Mike's Trucking. To mitigate this risk, the company is looking at diversifying its trucking business to include other industries as well.
• Operational risk. Mike's Trucking recognizes the fact that there is an inherent risk in transporting cargo. Any damage to cargo may undermine the profitable of the
Mike's Trucking Service — Sample Plan
Copyright © Palo Alto Software, Inc. 2002 All rights reserved. www.paloalto.com Not for reproduction, publication, or distribution. Pg 8
Busin
ess P
lan
Pro
Sam
ple
company. To reduce this risk, the company maintains all necessary insurance.
5.0 Strategy
The strategy of Mike's Trucking is to consolidate its good customer and client service by making timely deliveries, hiring the best drivers and having a competitive pricing structure. The company's goal in the next year is to become an independently-run business entity without having any contracted services. We would like to fully manage our trucking operation, from hiring drivers to sourcing business. The company's goal within the next five years is to operate a full-service trucking business with a fleet of trucks, "hot-shot" trucks, and minifloat loads. Mike's Trucking would like to be in a position to handle any job available at this stage.
Key components of our initial strategy can be summarized as follows: • Expand fleet of trucks. The company is currently working to expand on its existing
fleet of trucks. This will enable us to increase the number of customers we are able to serve.
• Establish independent status.The company is currently operating under fee sharing, but is working to become independent and manage its own operations, from sourcing to daily management.
• Establish a complete trucking business.The company is currently working toward becoming a complete trucking business with a fleet of trucks which includes long-haul trucks. The management of the company has identified a good customer base which it can tap into once all the necessary equipment has been acquired. This will enable the company to service areas outside its current domain and increase profit levels.
5.1 Value Propositions
Mike's Trucking offers the following advantages to customers. • Quality Service. We provide our customers with courteous, prompt, and dependable
service. The company has a reputation for timely deliveries and the best drivers in the industry, and intends to build upon that.
• Competitive rates. We will provide competitive rates for our customers because we have low cost inputs.
• Package handling. By maintaining dependable and safe equipment, we will ensure that there is no damage to customer's cargo.
5.2 Competitive Edge
Our major competitive advantage is the vast industry experience and solid reputation of its owner, Mike Smith. His company is also well known among its clients for going that extra mile in the customer-service department.
Mike's Trucking Service — Sample Plan
Copyright © Palo Alto Software, Inc. 2002 All rights reserved. www.paloalto.com Not for reproduction, publication, or distribution. Pg 9
Busin
ess P
lan
Pro
Sam
ple
5.3 Marketing Strategy
We markets our services as solutions to the many companies requiring cargo to be transported promptly and efficiently. The company's future marketing plans will be nationwide, emphasizing haulage capabilities for any cargo. The overall marketing plan for services is based on the following fundamentals:
• The segment of the market(s) planned to reach. • Distribution channels planned to reach market segments: television, radio, sales
associates, and mailings. • Share of the market expected to capture over a fixed period of time.
5.3.1 Pricing
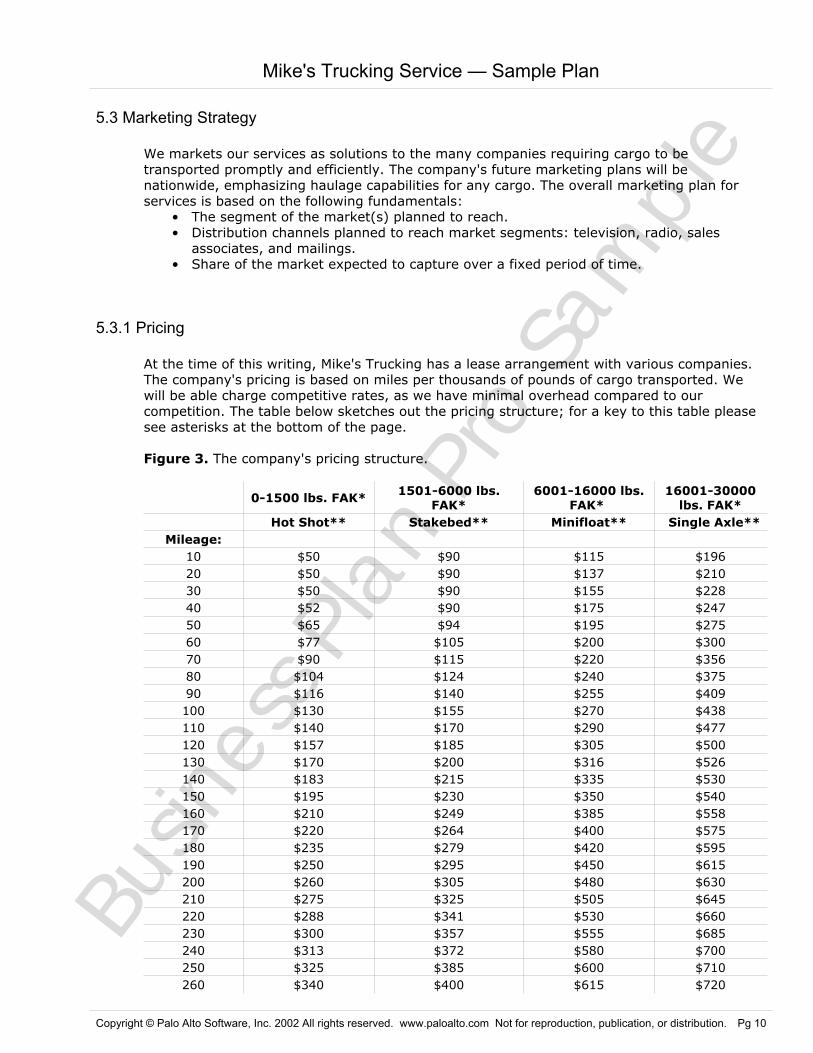
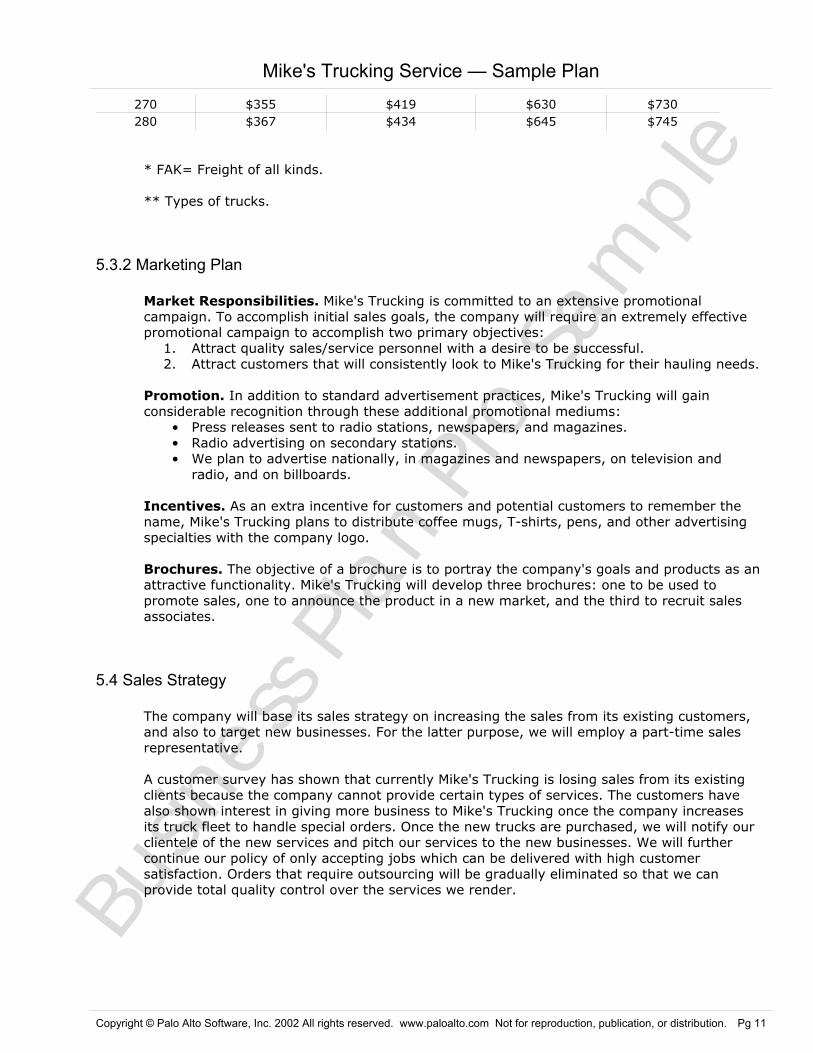
At the time of this writing, Mike's Trucking has a lease arrangement with various companies. The company's pricing is based on miles per thousands of pounds of cargo transported. We will be able charge competitive rates, as we have minimal overhead compared to our competition. The table below sketches out the pricing structure; for a key to this table please see asterisks at the bottom of the page.
Figure 3. The company's pricing structure.
0-1500 lbs. FAK* 1501-6000 lbs.FAK*
6001-16000 lbs.FAK*
16001-30000lbs. FAK*
Hot Shot** Stakebed** Minifloat** Single Axle**Mileage:
10 $50 $90 $115 $19620 $50 $90 $137 $21030 $50 $90 $155 $22840 $52 $90 $175 $24750 $65 $94 $195 $27560 $77 $105 $200 $30070 $90 $115 $220 $35680 $104 $124 $240 $37590 $116 $140 $255 $409100 $130 $155 $270 $438110 $140 $170 $290 $477120 $157 $185 $305 $500130 $170 $200 $316 $526140 $183 $215 $335 $530150 $195 $230 $350 $540160 $210 $249 $385 $558170 $220 $264 $400 $575180 $235 $279 $420 $595190 $250 $295 $450 $615200 $260 $305 $480 $630210 $275 $325 $505 $645220 $288 $341 $530 $660230 $300 $357 $555 $685240 $313 $372 $580 $700250 $325 $385 $600 $710260 $340 $400 $615 $720
Mike's Trucking Service — Sample Plan
Copyright © Palo Alto Software, Inc. 2002 All rights reserved. www.paloalto.com Not for reproduction, publication, or distribution. Pg 10
Busin
ess P
lan
Pro
Sam
ple
270 $355 $419 $630 $730280 $367 $434 $645 $745
* FAK= Freight of all kinds.
** Types of trucks.
5.3.2 Marketing Plan
Market Responsibilities. Mike's Trucking is committed to an extensive promotional campaign. To accomplish initial sales goals, the company will require an extremely effective promotional campaign to accomplish two primary objectives:
1. Attract quality sales/service personnel with a desire to be successful. 2. Attract customers that will consistently look to Mike's Trucking for their hauling needs.
Promotion. In addition to standard advertisement practices, Mike's Trucking will gain considerable recognition through these additional promotional mediums:
• Press releases sent to radio stations, newspapers, and magazines. • Radio advertising on secondary stations. • We plan to advertise nationally, in magazines and newspapers, on television and
radio, and on billboards.
Incentives. As an extra incentive for customers and potential customers to remember the name, Mike's Trucking plans to distribute coffee mugs, T-shirts, pens, and other advertising specialties with the company logo.
Brochures. The objective of a brochure is to portray the company's goals and products as an attractive functionality. Mike's Trucking will develop three brochures: one to be used to promote sales, one to announce the product in a new market, and the third to recruit sales associates.
5.4 Sales Strategy
The company will base its sales strategy on increasing the sales from its existing customers, and also to target new businesses. For the latter purpose, we will employ a part-time sales representative.
A customer survey has shown that currently Mike's Trucking is losing sales from its existing clients because the company cannot provide certain types of services. The customers have also shown interest in giving more business to Mike's Trucking once the company increases its truck fleet to handle special orders. Once the new trucks are purchased, we will notify our clientele of the new services and pitch our services to the new businesses. We will further continue our policy of only accepting jobs which can be delivered with high customer satisfaction. Orders that require outsourcing will be gradually eliminated so that we can provide total quality control over the services we render.
Mike's Trucking Service — Sample Plan
Copyright © Palo Alto Software, Inc. 2002 All rights reserved. www.paloalto.com Not for reproduction, publication, or distribution. Pg 11
Busin
ess P
lan
Pro
Sam
ple
$0
$1,000
$2,000
$3,000
$4,000
$5,000
$6,000
$7,000
$8,000
$9,000
$10,000
Jan Feb Mar Apr May Jun Jul Aug Sep Oct Nov Dec
Trucking Services
Other
Sales Monthly
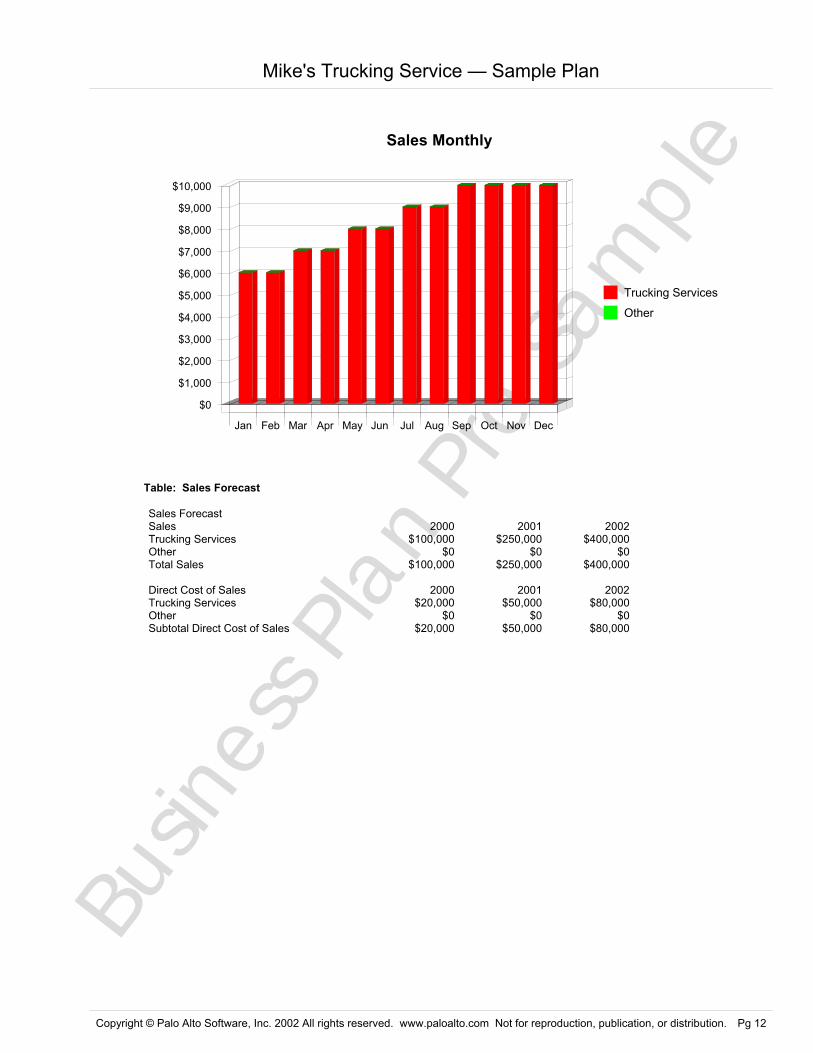
Table: Sales Forecast
Sales ForecastSales 2000 2001 2002Trucking Services $100,000 $250,000 $400,000Other $0 $0 $0Total Sales $100,000 $250,000 $400,000
Direct Cost of Sales 2000 2001 2002Trucking Services $20,000 $50,000 $80,000Other $0 $0 $0Subtotal Direct Cost of Sales $20,000 $50,000 $80,000
Mike's Trucking Service — Sample Plan
Copyright © Palo Alto Software, Inc. 2002 All rights reserved. www.paloalto.com Not for reproduction, publication, or distribution. Pg 12
Busin
ess P
lan
Pro
Sam
ple
6.0 Management Summary
The company's management is minimal in order to reduce the overhead. Mike Smith, the company owner and president, makes all executive decisions. At the moment, he also generates most of the sales leads. Joan Rose works as an executive secretary who answers phone inquiries and maintains the customer database. A part-time sales representative will be hired to solicit new business once the company acquires new trucks. In the years 2001-2002, the administrative staff is planned to increase in order to handle the higher sales volume. In the future, a sales manager will be hired to allow Mr. Smith more time to dedicate himself to company management.
Table: Personnel
Personnel Plan2000 2001 2002
Mike Smith $18,000 $20,000 $30,000Joan Rose $12,000 $15,000 $20,000Other $0 $15,000 $40,000Total People 2 3 4Total Payroll $30,000 $50,000 $90,000
6.1 Organization
The company's management philosophy is based on responsibility and mutual respect. Mike's Trucking maintains an environment that stimulates productivity and emphasizes respect for customers and fellow employees. The company structure is linear, which lends the staff responsibilities and decision-making power.
6.2 Officers and Key Employees
The management of Mike's Trucking is highly experienced and qualified. Mike Smith, president and CEO, has been involved in the trucking industry for 15 years. He is well respected by the trucking professionals with whom he has worked. All administrative functions are performed by Joan Rose, who has worked with Mr. Smith for the last seven years. She posesses extraordinary customer service and database management skills.
Mike's Trucking Service — Sample Plan
Copyright © Palo Alto Software, Inc. 2002 All rights reserved. www.paloalto.com Not for reproduction, publication, or distribution. Pg 13
Busin
ess P
lan
Pro
Sam
ple
7.0 Finance
Funding Requirements and Uses
The company is raising $125,000 for the purpose of financing equipment purchases to meet a growing demand for its services. The company management has reason to believe that an increased truck fleet wil assist the company in its effort to widen its market offering and increase sales.
7.1 Significant Assumptions
The following table highlights the important general assumptions of Mike's Trucking. Interest rates, tax rates, and personnel burden are based on conservative assumptions.
Table: General Assumptions
General Assumptions2000 2001 2002
Plan Month 1 2 3Current Interest Rate 10.00% 10.00% 10.00%Long-term Interest Rate 10.00% 10.00% 10.00%Tax Rate 25.00% 25.00% 25.00%Sales on Credit % 20.00% 20.00% 20.00%Other 0.00% 0.00% 0.00%Calculated TotalsPayroll Expense $30,000 $50,000 $90,000Sales on Credit $20,000 $50,000 $80,000New Accounts Payable $71,094 $165,676 $264,393
Mike's Trucking Service — Sample Plan
Copyright © Palo Alto Software, Inc. 2002 All rights reserved. www.paloalto.com Not for reproduction, publication, or distribution. Pg 14
Busin
ess P
lan
Pro
Sam
ple
7.2 Break-even Analysis
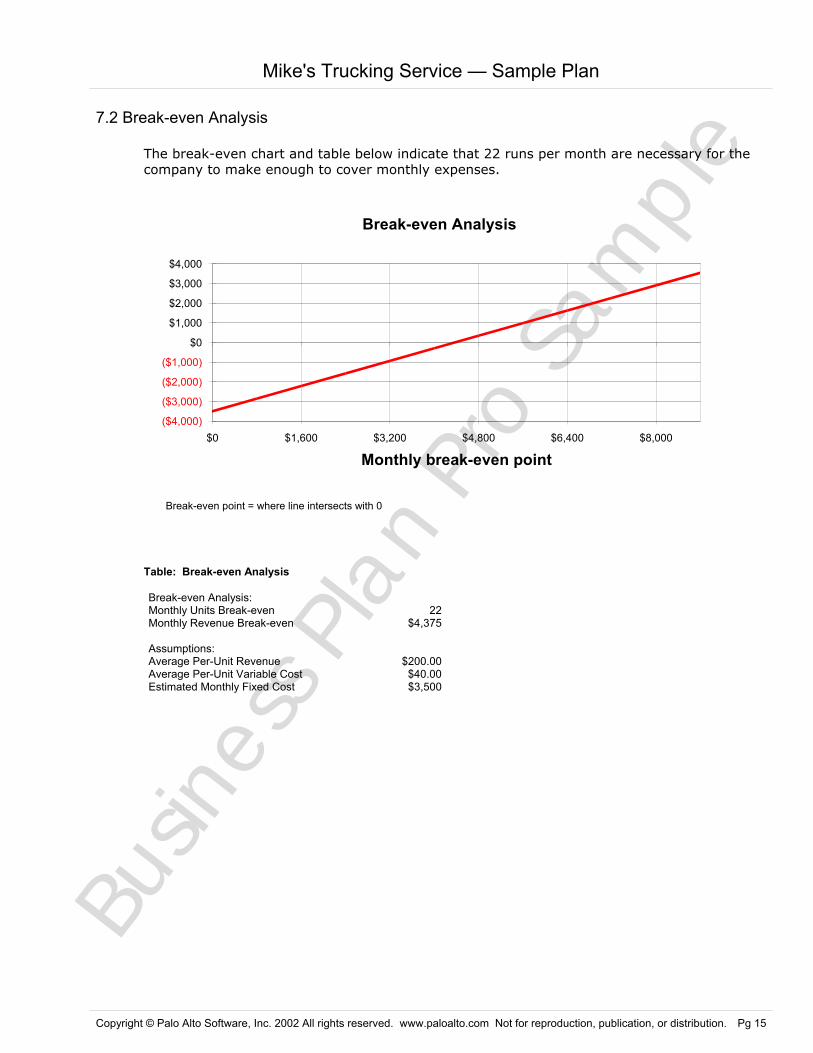
The break-even chart and table below indicate that 22 runs per month are necessary for the company to make enough to cover monthly expenses.
($4,000)
($3,000)
($2,000)
($1,000)
$0
$1,000
$2,000
$3,000
$4,000
$0 $1,600 $3,200 $4,800 $6,400 $8,000
Monthly break-even point
Break-even point = where line intersects with 0
Break-even Analysis
Table: Break-even Analysis
Break-even Analysis:Monthly Units Break-even 22Monthly Revenue Break-even $4,375
Assumptions:Average Per-Unit Revenue $200.00Average Per-Unit Variable Cost $40.00Estimated Monthly Fixed Cost $3,500
Mike's Trucking Service — Sample Plan
Copyright © Palo Alto Software, Inc. 2002 All rights reserved. www.paloalto.com Not for reproduction, publication, or distribution. Pg 15

Busin
ess P
lan
Pro
Sam
ple
7.3 Income Statements - Projected
The table below summarizes our projected income statement for the first three years of plan implementation, fiscal years 2000, 2001, and 2002. As with the other tables, the Profit and Loss table is projected to be quite conservative. The detailed monthly projection can be found in the appendices.
Table: Profit and Loss
Pro Forma Profit and Loss2000 2001 2002
Sales $100,000 $250,000 $400,000Direct Cost of Sales $20,000 $50,000 $80,000Production Payroll $0 $0 $0Other $0 $0 $0
------------ ------------ ------------Total Cost of Sales $20,000 $50,000 $80,000Gross Margin $80,000 $200,000 $320,000Gross Margin % 80.00% 80.00% 80.00%Expenses:Payroll $30,000 $50,000 $90,000Sales and Marketing and Other Expenses $7,080 $13,000 $18,500Depreciation $4,800 $5,000 $5,500Depreciation $0 $0 $0Fuel & Maintenance $6,000 $12,000 $20,000Utilities $2,400 $3,000 $3,500Insurance $4,800 $5,000 $6,000Payroll Taxes $4,500 $7,500 $13,500Other $0 $0 $0
------------ ------------ ------------Total Operating Expenses $59,580 $95,500 $157,000Profit Before Interest and Taxes $20,420 $104,500 $163,000Interest Expense $12,218 $14,760 $13,360Taxes Incurred $2,050 $22,435 $37,410Net Profit $6,151 $67,305 $112,230Net Profit/Sales 6.15% 26.92% 28.06%Include Negative Taxes TRUE TRUE TRUE
Mike's Trucking Service — Sample Plan
Copyright © Palo Alto Software, Inc. 2002 All rights reserved. www.paloalto.com Not for reproduction, publication, or distribution. Pg 16
Busin
ess P
lan
Pro
Sam
ple
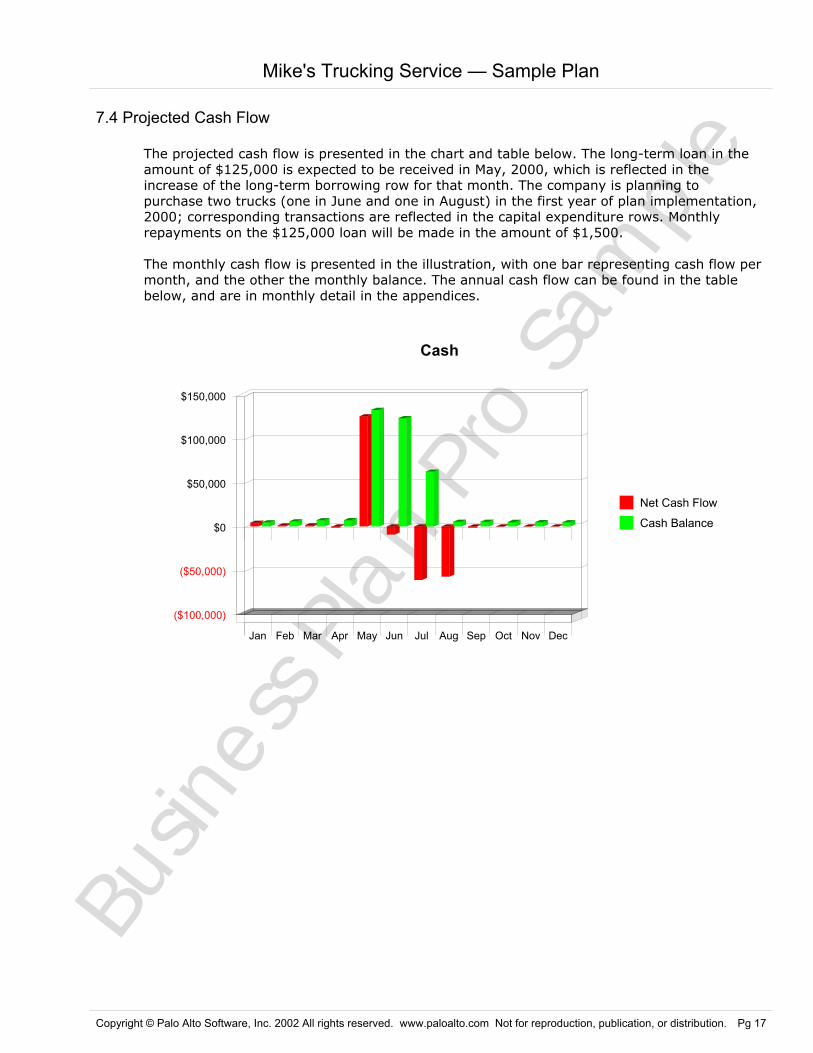
7.4 Projected Cash Flow
The projected cash flow is presented in the chart and table below. The long-term loan in the amount of $125,000 is expected to be received in May, 2000, which is reflected in the increase of the long-term borrowing row for that month. The company is planning to purchase two trucks (one in June and one in August) in the first year of plan implementation, 2000; corresponding transactions are reflected in the capital expenditure rows. Monthly repayments on the $125,000 loan will be made in the amount of $1,500.
The monthly cash flow is presented in the illustration, with one bar representing cash flow per month, and the other the monthly balance. The annual cash flow can be found in the table below, and are in monthly detail in the appendices.
($100,000)
($50,000)
$0
$50,000
$100,000
$150,000
Jan Feb Mar Apr May Jun Jul Aug Sep Oct Nov Dec
Net Cash Flow
Cash Balance
Cash
Mike's Trucking Service — Sample Plan
Copyright © Palo Alto Software, Inc. 2002 All rights reserved. www.paloalto.com Not for reproduction, publication, or distribution. Pg 17
Busin
ess P
lan
Pro
Sam
ple
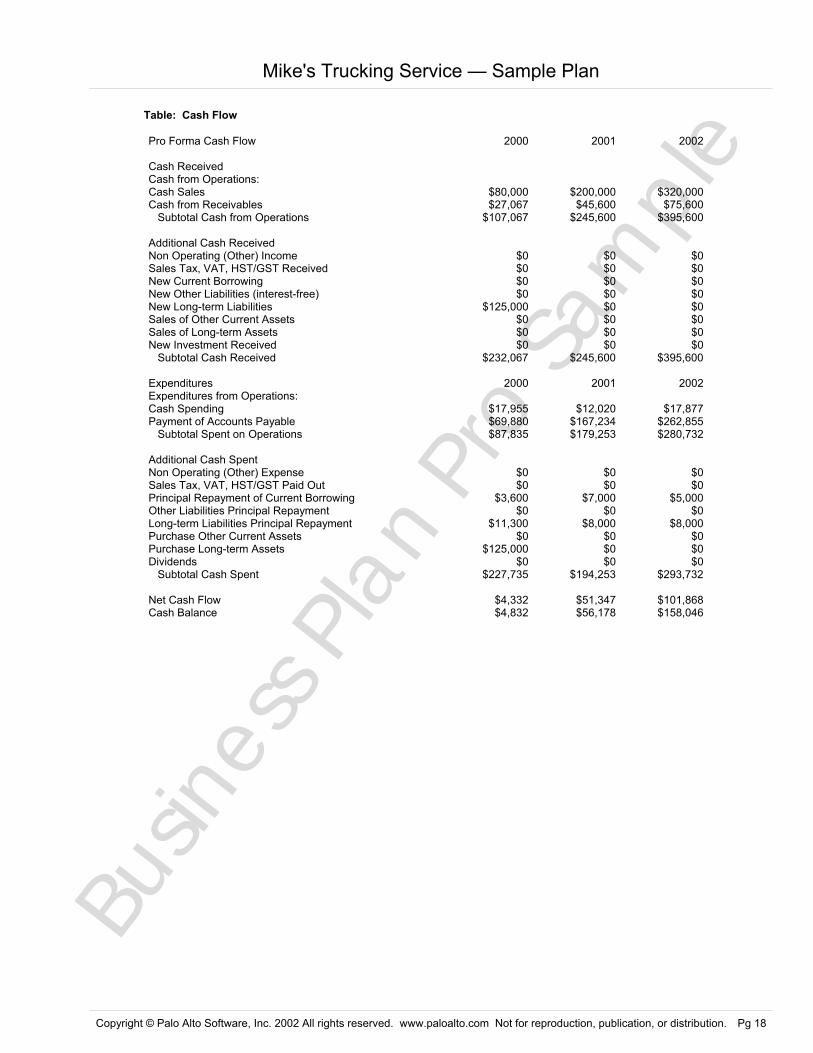
Table: Cash Flow
Pro Forma Cash Flow 2000 2001 2002
Cash ReceivedCash from Operations: Cash Sales $80,000 $200,000 $320,000Cash from Receivables $27,067 $45,600 $75,600 Subtotal Cash from Operations $107,067 $245,600 $395,600
Additional Cash ReceivedNon Operating (Other) Income $0 $0 $0Sales Tax, VAT, HST/GST Received $0 $0 $0New Current Borrowing $0 $0 $0New Other Liabilities (interest-free) $0 $0 $0New Long-term Liabilities $125,000 $0 $0Sales of Other Current Assets $0 $0 $0Sales of Long-term Assets $0 $0 $0New Investment Received $0 $0 $0 Subtotal Cash Received $232,067 $245,600 $395,600
Expenditures 2000 2001 2002Expenditures from Operations:Cash Spending $17,955 $12,020 $17,877Payment of Accounts Payable $69,880 $167,234 $262,855 Subtotal Spent on Operations $87,835 $179,253 $280,732
Additional Cash SpentNon Operating (Other) Expense $0 $0 $0Sales Tax, VAT, HST/GST Paid Out $0 $0 $0Principal Repayment of Current Borrowing $3,600 $7,000 $5,000Other Liabilities Principal Repayment $0 $0 $0Long-term Liabilities Principal Repayment $11,300 $8,000 $8,000Purchase Other Current Assets $0 $0 $0Purchase Long-term Assets $125,000 $0 $0Dividends $0 $0 $0 Subtotal Cash Spent $227,735 $194,253 $293,732
Net Cash Flow $4,332 $51,347 $101,868Cash Balance $4,832 $56,178 $158,046
Mike's Trucking Service — Sample Plan
Copyright © Palo Alto Software, Inc. 2002 All rights reserved. www.paloalto.com Not for reproduction, publication, or distribution. Pg 18
Busin
ess P
lan
Pro
Sam
ple
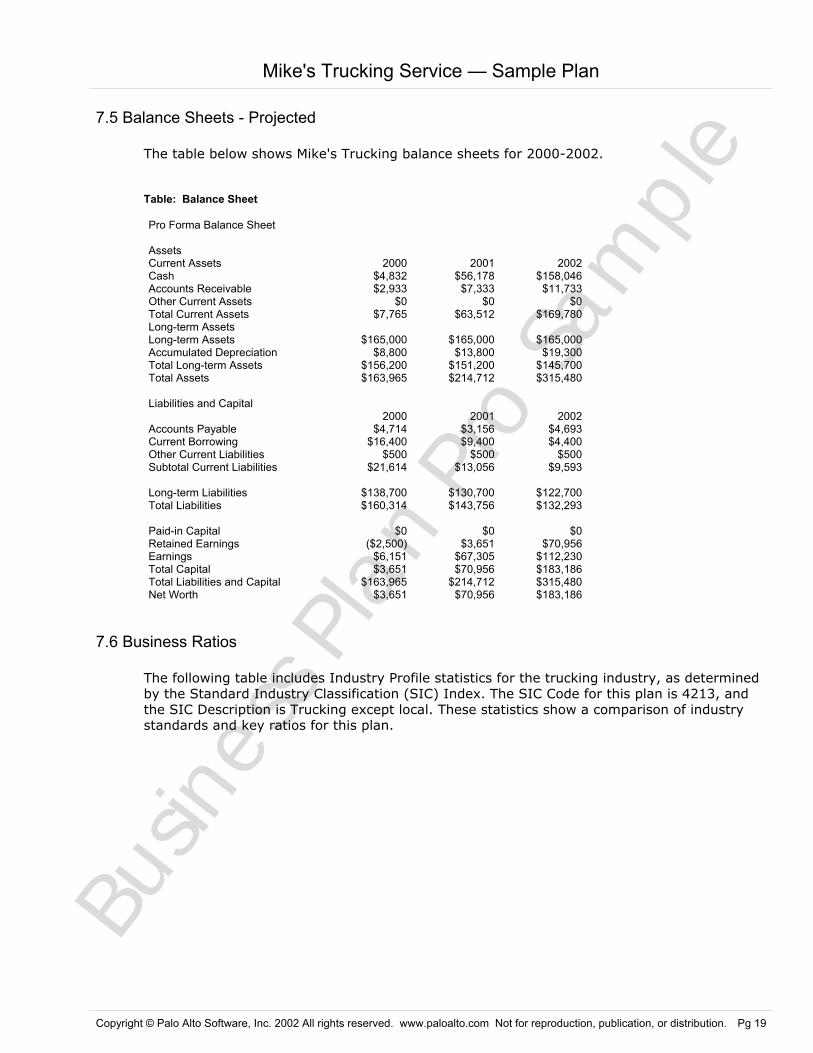
7.5 Balance Sheets - Projected
The table below shows Mike's Trucking balance sheets for 2000-2002.
Table: Balance Sheet
Pro Forma Balance Sheet
AssetsCurrent Assets 2000 2001 2002Cash $4,832 $56,178 $158,046Accounts Receivable $2,933 $7,333 $11,733Other Current Assets $0 $0 $0Total Current Assets $7,765 $63,512 $169,780Long-term AssetsLong-term Assets $165,000 $165,000 $165,000Accumulated Depreciation $8,800 $13,800 $19,300Total Long-term Assets $156,200 $151,200 $145,700Total Assets $163,965 $214,712 $315,480
Liabilities and Capital2000 2001 2002
Accounts Payable $4,714 $3,156 $4,693Current Borrowing $16,400 $9,400 $4,400Other Current Liabilities $500 $500 $500Subtotal Current Liabilities $21,614 $13,056 $9,593
Long-term Liabilities $138,700 $130,700 $122,700Total Liabilities $160,314 $143,756 $132,293
Paid-in Capital $0 $0 $0Retained Earnings ($2,500) $3,651 $70,956Earnings $6,151 $67,305 $112,230Total Capital $3,651 $70,956 $183,186Total Liabilities and Capital $163,965 $214,712 $315,480Net Worth $3,651 $70,956 $183,186
7.6 Business Ratios
The following table includes Industry Profile statistics for the trucking industry, as determined by the Standard Industry Classification (SIC) Index. The SIC Code for this plan is 4213, and the SIC Description is Trucking except local. These statistics show a comparison of industry standards and key ratios for this plan.
Mike's Trucking Service — Sample Plan
Copyright © Palo Alto Software, Inc. 2002 All rights reserved. www.paloalto.com Not for reproduction, publication, or distribution. Pg 19

Busin
ess P
lan
Pro
Sam
ple
Table: Ratios
Ratio Analysis2000 2001 2002 Industry Profile
Sales Growth 66.67% 150.00% 60.00% 5.60%
Percent of Total AssetsAccounts Receivable 1.79% 3.42% 3.72% 19.70%Inventory 0.00% 0.00% 0.00% 1.00%Other Current Assets 0.00% 0.00% 0.00% 22.30%Total Current Assets 4.74% 29.58% 53.82% 43.00%Long-term Assets 95.26% 70.42% 46.18% 57.00%Total Assets 100.00% 100.00% 100.00% 100.00%
Current Liabilities 0.30% 0.23% 0.16% 30.80%Long-term Liabilities 84.59% 60.87% 38.89% 27.00%Total Liabilities 84.59% 60.87% 38.89% 57.80%Net Worth 15.41% 39.13% 61.11% 42.20%
Percent of SalesSales 100.00% 100.00% 100.00% 100.00%Gross Margin 80.00% 80.00% 80.00% 100.00%Selling, General & Administrative Expenses 73.85% 53.08% 51.94% 82.10%Advertising Expenses 1.20% 1.20% 1.25% 0.20%Profit Before Interest and Taxes 20.42% 41.80% 40.75% 1.10%
Main RatiosCurrent 0.36 4.86 17.70 1.32Quick 0.36 4.86 17.70 1.07Total Debt to Total Assets 97.77% 66.95% 41.93% 57.80%Pre-tax Return on Net Worth 224.63% 126.47% 81.69% 2.50%Pre-tax Return on Assets 5.00% 41.80% 47.43% 6.00%
Business Vitality Profile 2000 2001 2002 IndustrySales per Employee $50,000 $83,333 $100,000 $168,959Survival Rate 64.85%
Additional Ratios 2000 2001 2002Net Profit Margin 6.15% 26.92% 28.06% n.aReturn on Equity 168.47% 94.85% 61.27% n.a
Activity RatiosAccounts Receivable Turnover 6.82 6.82 6.82 n.aCollection Days 50 37 43 n.aInventory Turnover 0.00 0.00 0.00 n.aAccounts Payable Turnover 15.08 52.50 56.33 n.aPayment Days 63 104 65Total Asset Turnover 0.61 1.16 1.27 n.a
Debt RatiosDebt to Net Worth 43.91 2.03 0.72 n.aCurrent Liab. to Liab. 0.13 0.09 0.07 n.a
Liquidity RatiosNet Working Capital ($13,849) $50,456 $160,186 n.aInterest Coverage 1.67 7.08 12.20 n.a
Additional RatiosAssets to Sales 1.64 0.86 0.79 n.aCurrent Debt/Total Assets 13% 6% 3% n.aAcid Test 0.22 4.30 16.47 n.aSales/Net Worth 27.39 3.52 2.18 n.aDividend Payout 0.00 0.00 0.00 n.a
Mike's Trucking Service — Sample Plan
Copyright © Palo Alto Software, Inc. 2002 All rights reserved. www.paloalto.com Not for reproduction, publication, or distribution. Pg 20
Busin
ess P
lan
Pro
Sam
ple
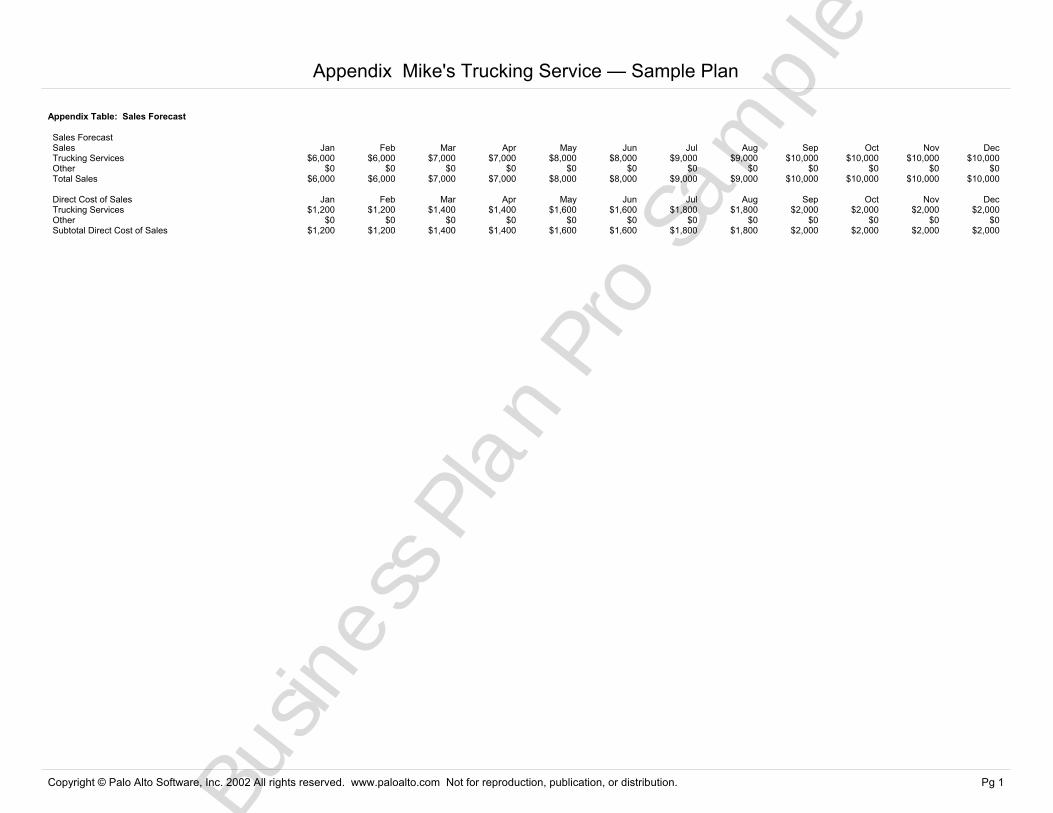
Appendix Table: Sales Forecast
Sales ForecastSales Jan Feb Mar Apr May Jun Jul Aug Sep Oct Nov DecTrucking Services $6,000 $6,000 $7,000 $7,000 $8,000 $8,000 $9,000 $9,000 $10,000 $10,000 $10,000 $10,000Other $0 $0 $0 $0 $0 $0 $0 $0 $0 $0 $0 $0Total Sales $6,000 $6,000 $7,000 $7,000 $8,000 $8,000 $9,000 $9,000 $10,000 $10,000 $10,000 $10,000
Direct Cost of Sales Jan Feb Mar Apr May Jun Jul Aug Sep Oct Nov DecTrucking Services $1,200 $1,200 $1,400 $1,400 $1,600 $1,600 $1,800 $1,800 $2,000 $2,000 $2,000 $2,000Other $0 $0 $0 $0 $0 $0 $0 $0 $0 $0 $0 $0Subtotal Direct Cost of Sales $1,200 $1,200 $1,400 $1,400 $1,600 $1,600 $1,800 $1,800 $2,000 $2,000 $2,000 $2,000
Appendix Mike's Trucking Service — Sample Plan
Copyright © Palo Alto Software, Inc. 2002 All rights reserved. www.paloalto.com Not for reproduction, publication, or distribution. Pg 1
Busin
ess P
lan
Pro
Sam
ple
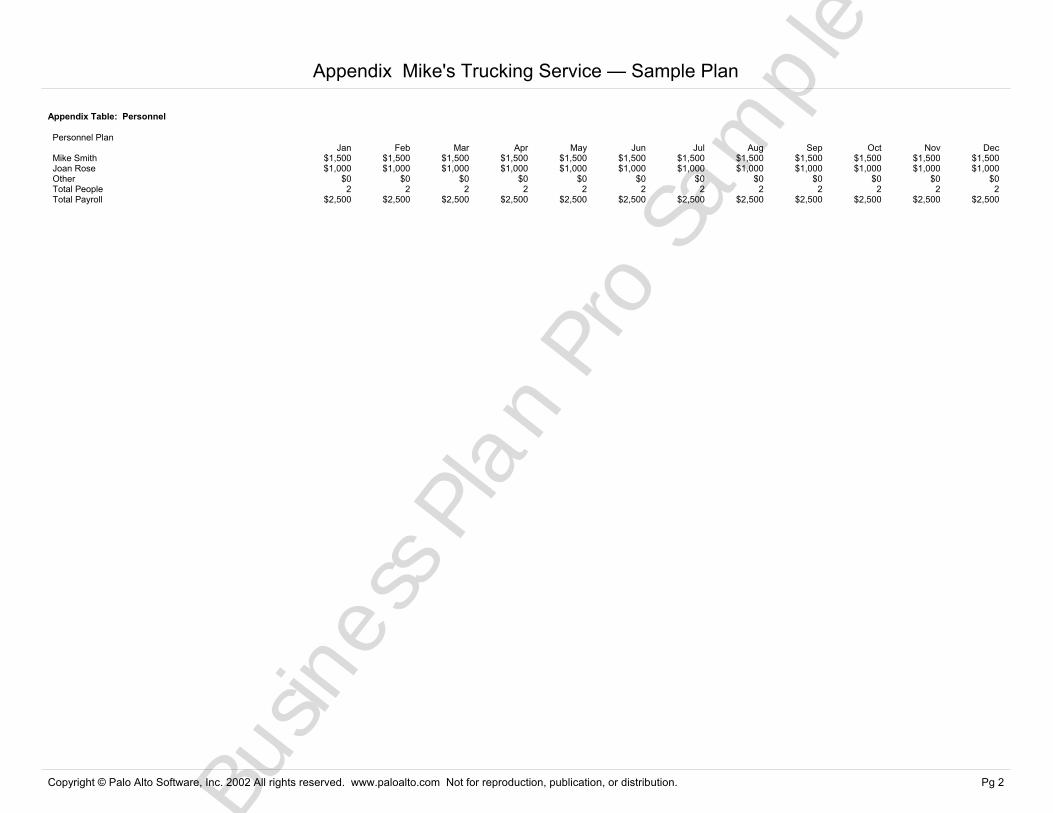
Appendix Table: Personnel
Personnel PlanJan Feb Mar Apr May Jun Jul Aug Sep Oct Nov Dec
Mike Smith $1,500 $1,500 $1,500 $1,500 $1,500 $1,500 $1,500 $1,500 $1,500 $1,500 $1,500 $1,500Joan Rose $1,000 $1,000 $1,000 $1,000 $1,000 $1,000 $1,000 $1,000 $1,000 $1,000 $1,000 $1,000Other $0 $0 $0 $0 $0 $0 $0 $0 $0 $0 $0 $0Total People 2 2 2 2 2 2 2 2 2 2 2 2Total Payroll $2,500 $2,500 $2,500 $2,500 $2,500 $2,500 $2,500 $2,500 $2,500 $2,500 $2,500 $2,500
Appendix Mike's Trucking Service — Sample Plan
Copyright © Palo Alto Software, Inc. 2002 All rights reserved. www.paloalto.com Not for reproduction, publication, or distribution. Pg 2

Busin
ess P
lan
Pro
Sam
ple
Appendix Table: General Assumptions
General AssumptionsJan Feb Mar Apr May Jun Jul Aug Sep Oct Nov Dec
Plan Month 1 2 3 4 5 6 7 8 9 10 11 12Current Interest Rate 10.00% 10.00% 10.00% 10.00% 10.00% 10.00% 10.00% 10.00% 10.00% 10.00% 10.00% 10.00%Long-term Interest Rate 10.00% 10.00% 10.00% 10.00% 10.00% 10.00% 10.00% 10.00% 10.00% 10.00% 10.00% 10.00%Tax Rate 25.00% 25.00% 25.00% 25.00% 25.00% 25.00% 25.00% 25.00% 25.00% 25.00% 25.00% 25.00%Sales on Credit % 20.00% 20.00% 20.00% 20.00% 20.00% 20.00% 20.00% 20.00% 20.00% 20.00% 20.00% 20.00%Other 0.00% 0.00% 0.00% 0.00% 0.00% 0.00% 0.00% 0.00% 0.00% 0.00% 0.00% 0.00%Calculated TotalsPayroll Expense $2,500 $2,500 $2,500 $2,500 $2,500 $2,500 $2,500 $2,500 $2,500 $2,500 $2,500 $2,500Sales on Credit $1,200 $1,200 $1,400 $1,400 $1,600 $1,600 $1,800 $1,800 $2,000 $2,000 $2,000 $2,000New Accounts Payable $5,689 $5,686 $6,044 $6,041 $7,102 $1,092 $942 $7,432 $7,782 $7,772 $7,761 $7,751
Appendix Mike's Trucking Service — Sample Plan
Copyright © Palo Alto Software, Inc. 2002 All rights reserved. www.paloalto.com Not for reproduction, publication, or distribution. Pg 3
Busin
ess P
lan
Pro
Sam
ple
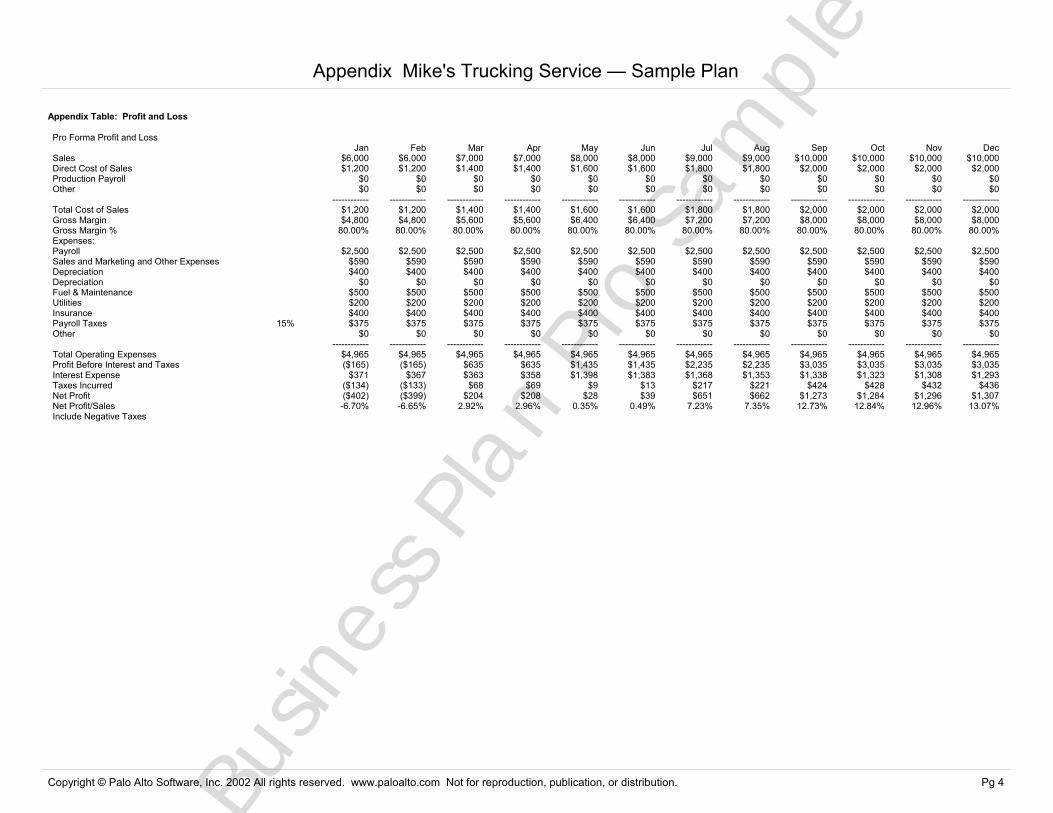
Appendix Table: Profit and Loss
Pro Forma Profit and LossJan Feb Mar Apr May Jun Jul Aug Sep Oct Nov Dec
Sales $6,000 $6,000 $7,000 $7,000 $8,000 $8,000 $9,000 $9,000 $10,000 $10,000 $10,000 $10,000Direct Cost of Sales $1,200 $1,200 $1,400 $1,400 $1,600 $1,600 $1,800 $1,800 $2,000 $2,000 $2,000 $2,000Production Payroll $0 $0 $0 $0 $0 $0 $0 $0 $0 $0 $0 $0Other $0 $0 $0 $0 $0 $0 $0 $0 $0 $0 $0 $0
------------ ------------ ------------ ------------ ------------ ------------ ------------ ------------ ------------ ------------ ------------ ------------Total Cost of Sales $1,200 $1,200 $1,400 $1,400 $1,600 $1,600 $1,800 $1,800 $2,000 $2,000 $2,000 $2,000Gross Margin $4,800 $4,800 $5,600 $5,600 $6,400 $6,400 $7,200 $7,200 $8,000 $8,000 $8,000 $8,000Gross Margin % 80.00% 80.00% 80.00% 80.00% 80.00% 80.00% 80.00% 80.00% 80.00% 80.00% 80.00% 80.00%Expenses:Payroll $2,500 $2,500 $2,500 $2,500 $2,500 $2,500 $2,500 $2,500 $2,500 $2,500 $2,500 $2,500Sales and Marketing and Other Expenses $590 $590 $590 $590 $590 $590 $590 $590 $590 $590 $590 $590Depreciation $400 $400 $400 $400 $400 $400 $400 $400 $400 $400 $400 $400Depreciation $0 $0 $0 $0 $0 $0 $0 $0 $0 $0 $0 $0Fuel & Maintenance $500 $500 $500 $500 $500 $500 $500 $500 $500 $500 $500 $500Utilities $200 $200 $200 $200 $200 $200 $200 $200 $200 $200 $200 $200Insurance $400 $400 $400 $400 $400 $400 $400 $400 $400 $400 $400 $400Payroll Taxes 15% $375 $375 $375 $375 $375 $375 $375 $375 $375 $375 $375 $375Other $0 $0 $0 $0 $0 $0 $0 $0 $0 $0 $0 $0
------------ ------------ ------------ ------------ ------------ ------------ ------------ ------------ ------------ ------------ ------------ ------------Total Operating Expenses $4,965 $4,965 $4,965 $4,965 $4,965 $4,965 $4,965 $4,965 $4,965 $4,965 $4,965 $4,965Profit Before Interest and Taxes ($165) ($165) $635 $635 $1,435 $1,435 $2,235 $2,235 $3,035 $3,035 $3,035 $3,035Interest Expense $371 $367 $363 $358 $1,398 $1,383 $1,368 $1,353 $1,338 $1,323 $1,308 $1,293Taxes Incurred ($134) ($133) $68 $69 $9 $13 $217 $221 $424 $428 $432 $436Net Profit ($402) ($399) $204 $208 $28 $39 $651 $662 $1,273 $1,284 $1,296 $1,307Net Profit/Sales -6.70% -6.65% 2.92% 2.96% 0.35% 0.49% 7.23% 7.35% 12.73% 12.84% 12.96% 13.07%Include Negative Taxes
Appendix Mike's Trucking Service — Sample Plan
Copyright © Palo Alto Software, Inc. 2002 All rights reserved. www.paloalto.com Not for reproduction, publication, or distribution. Pg 4
Busin
ess P
lan
Pro
Sam
ple
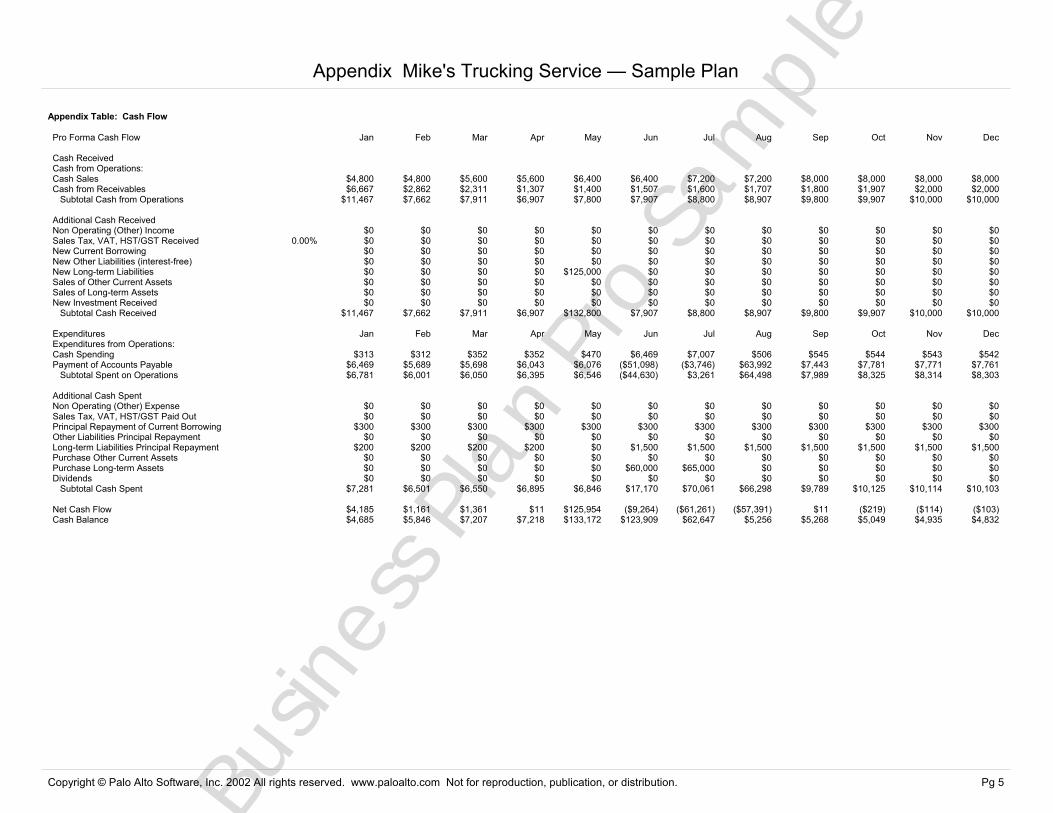
Appendix Table: Cash Flow
Pro Forma Cash Flow Jan Feb Mar Apr May Jun Jul Aug Sep Oct Nov Dec
Cash ReceivedCash from Operations: Cash Sales $4,800 $4,800 $5,600 $5,600 $6,400 $6,400 $7,200 $7,200 $8,000 $8,000 $8,000 $8,000Cash from Receivables $6,667 $2,862 $2,311 $1,307 $1,400 $1,507 $1,600 $1,707 $1,800 $1,907 $2,000 $2,000 Subtotal Cash from Operations $11,467 $7,662 $7,911 $6,907 $7,800 $7,907 $8,800 $8,907 $9,800 $9,907 $10,000 $10,000
Additional Cash ReceivedNon Operating (Other) Income $0 $0 $0 $0 $0 $0 $0 $0 $0 $0 $0 $0Sales Tax, VAT, HST/GST Received 0.00% $0 $0 $0 $0 $0 $0 $0 $0 $0 $0 $0 $0New Current Borrowing $0 $0 $0 $0 $0 $0 $0 $0 $0 $0 $0 $0New Other Liabilities (interest-free) $0 $0 $0 $0 $0 $0 $0 $0 $0 $0 $0 $0New Long-term Liabilities $0 $0 $0 $0 $125,000 $0 $0 $0 $0 $0 $0 $0Sales of Other Current Assets $0 $0 $0 $0 $0 $0 $0 $0 $0 $0 $0 $0Sales of Long-term Assets $0 $0 $0 $0 $0 $0 $0 $0 $0 $0 $0 $0New Investment Received $0 $0 $0 $0 $0 $0 $0 $0 $0 $0 $0 $0 Subtotal Cash Received $11,467 $7,662 $7,911 $6,907 $132,800 $7,907 $8,800 $8,907 $9,800 $9,907 $10,000 $10,000
Expenditures Jan Feb Mar Apr May Jun Jul Aug Sep Oct Nov DecExpenditures from Operations:Cash Spending $313 $312 $352 $352 $470 $6,469 $7,007 $506 $545 $544 $543 $542Payment of Accounts Payable $6,469 $5,689 $5,698 $6,043 $6,076 ($51,098) ($3,746) $63,992 $7,443 $7,781 $7,771 $7,761 Subtotal Spent on Operations $6,781 $6,001 $6,050 $6,395 $6,546 ($44,630) $3,261 $64,498 $7,989 $8,325 $8,314 $8,303
Additional Cash SpentNon Operating (Other) Expense $0 $0 $0 $0 $0 $0 $0 $0 $0 $0 $0 $0Sales Tax, VAT, HST/GST Paid Out $0 $0 $0 $0 $0 $0 $0 $0 $0 $0 $0 $0Principal Repayment of Current Borrowing $300 $300 $300 $300 $300 $300 $300 $300 $300 $300 $300 $300Other Liabilities Principal Repayment $0 $0 $0 $0 $0 $0 $0 $0 $0 $0 $0 $0Long-term Liabilities Principal Repayment $200 $200 $200 $200 $0 $1,500 $1,500 $1,500 $1,500 $1,500 $1,500 $1,500Purchase Other Current Assets $0 $0 $0 $0 $0 $0 $0 $0 $0 $0 $0 $0Purchase Long-term Assets $0 $0 $0 $0 $0 $60,000 $65,000 $0 $0 $0 $0 $0Dividends $0 $0 $0 $0 $0 $0 $0 $0 $0 $0 $0 $0 Subtotal Cash Spent $7,281 $6,501 $6,550 $6,895 $6,846 $17,170 $70,061 $66,298 $9,789 $10,125 $10,114 $10,103
Net Cash Flow $4,185 $1,161 $1,361 $11 $125,954 ($9,264) ($61,261) ($57,391) $11 ($219) ($114) ($103)Cash Balance $4,685 $5,846 $7,207 $7,218 $133,172 $123,909 $62,647 $5,256 $5,268 $5,049 $4,935 $4,832
Appendix Mike's Trucking Service — Sample Plan
Copyright © Palo Alto Software, Inc. 2002 All rights reserved. www.paloalto.com Not for reproduction, publication, or distribution. Pg 5
Busin
ess P
lan
Pro
Sam
ple
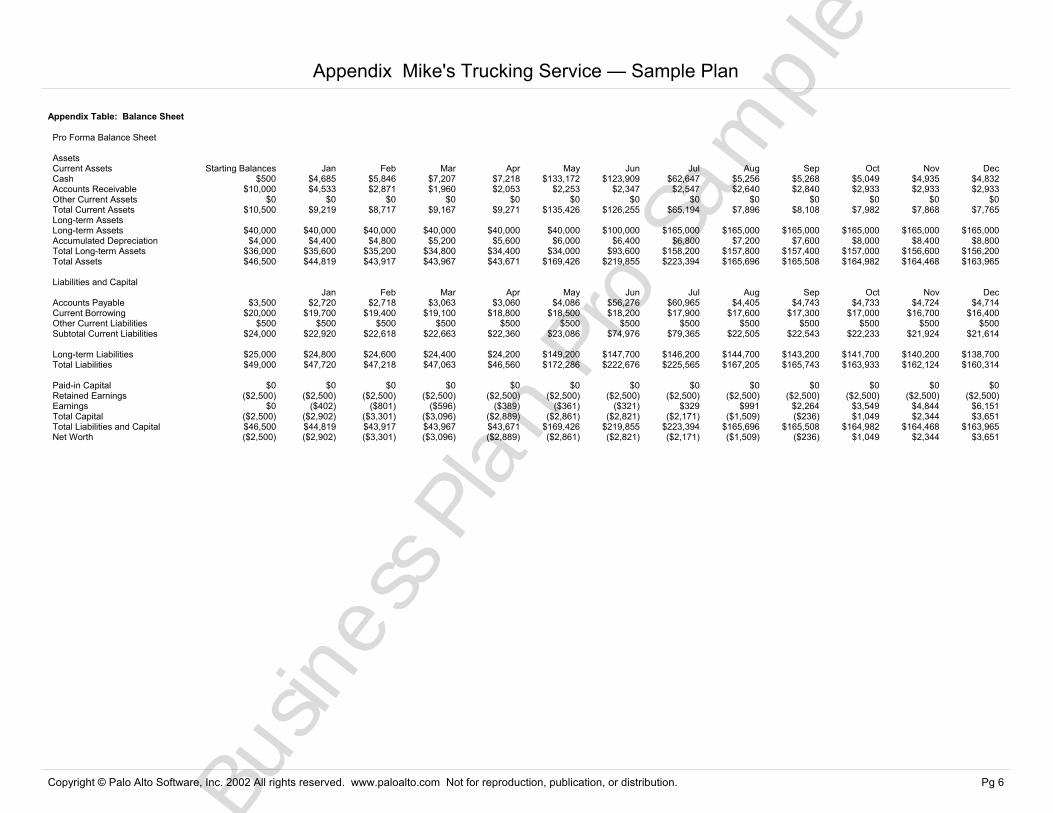
Appendix Table: Balance Sheet
Pro Forma Balance Sheet
AssetsCurrent Assets Starting Balances Jan Feb Mar Apr May Jun Jul Aug Sep Oct Nov DecCash $500 $4,685 $5,846 $7,207 $7,218 $133,172 $123,909 $62,647 $5,256 $5,268 $5,049 $4,935 $4,832Accounts Receivable $10,000 $4,533 $2,871 $1,960 $2,053 $2,253 $2,347 $2,547 $2,640 $2,840 $2,933 $2,933 $2,933Other Current Assets $0 $0 $0 $0 $0 $0 $0 $0 $0 $0 $0 $0 $0Total Current Assets $10,500 $9,219 $8,717 $9,167 $9,271 $135,426 $126,255 $65,194 $7,896 $8,108 $7,982 $7,868 $7,765Long-term AssetsLong-term Assets $40,000 $40,000 $40,000 $40,000 $40,000 $40,000 $100,000 $165,000 $165,000 $165,000 $165,000 $165,000 $165,000Accumulated Depreciation $4,000 $4,400 $4,800 $5,200 $5,600 $6,000 $6,400 $6,800 $7,200 $7,600 $8,000 $8,400 $8,800Total Long-term Assets $36,000 $35,600 $35,200 $34,800 $34,400 $34,000 $93,600 $158,200 $157,800 $157,400 $157,000 $156,600 $156,200Total Assets $46,500 $44,819 $43,917 $43,967 $43,671 $169,426 $219,855 $223,394 $165,696 $165,508 $164,982 $164,468 $163,965
Liabilities and CapitalJan Feb Mar Apr May Jun Jul Aug Sep Oct Nov Dec
Accounts Payable $3,500 $2,720 $2,718 $3,063 $3,060 $4,086 $56,276 $60,965 $4,405 $4,743 $4,733 $4,724 $4,714Current Borrowing $20,000 $19,700 $19,400 $19,100 $18,800 $18,500 $18,200 $17,900 $17,600 $17,300 $17,000 $16,700 $16,400Other Current Liabilities $500 $500 $500 $500 $500 $500 $500 $500 $500 $500 $500 $500 $500Subtotal Current Liabilities $24,000 $22,920 $22,618 $22,663 $22,360 $23,086 $74,976 $79,365 $22,505 $22,543 $22,233 $21,924 $21,614
Long-term Liabilities $25,000 $24,800 $24,600 $24,400 $24,200 $149,200 $147,700 $146,200 $144,700 $143,200 $141,700 $140,200 $138,700Total Liabilities $49,000 $47,720 $47,218 $47,063 $46,560 $172,286 $222,676 $225,565 $167,205 $165,743 $163,933 $162,124 $160,314
Paid-in Capital $0 $0 $0 $0 $0 $0 $0 $0 $0 $0 $0 $0 $0Retained Earnings ($2,500) ($2,500) ($2,500) ($2,500) ($2,500) ($2,500) ($2,500) ($2,500) ($2,500) ($2,500) ($2,500) ($2,500) ($2,500)Earnings $0 ($402) ($801) ($596) ($389) ($361) ($321) $329 $991 $2,264 $3,549 $4,844 $6,151Total Capital ($2,500) ($2,902) ($3,301) ($3,096) ($2,889) ($2,861) ($2,821) ($2,171) ($1,509) ($236) $1,049 $2,344 $3,651Total Liabilities and Capital $46,500 $44,819 $43,917 $43,967 $43,671 $169,426 $219,855 $223,394 $165,696 $165,508 $164,982 $164,468 $163,965Net Worth ($2,500) ($2,902) ($3,301) ($3,096) ($2,889) ($2,861) ($2,821) ($2,171) ($1,509) ($236) $1,049 $2,344 $3,651
Appendix Mike's Trucking Service — Sample Plan
Copyright © Palo Alto Software, Inc. 2002 All rights reserved. www.paloalto.com Not for reproduction, publication, or distribution. Pg 6