business models of successful start-up...
TRANSCRIPT

IN THE FIELD OF TECHNOLOGYDEGREE PROJECT DESIGN AND PRODUCT REALISATIONAND THE MAIN FIELD OF STUDYINDUSTRIAL MANAGEMENT,SECOND CYCLE, 30 CREDITS
, STOCKHOLM SWEDEN 2018
Business Models of Successful Start-up CompaniesA comparative study of start-ups’ business models and how these are adapted to trends and competition in the industry
KRISTINA BONDEMARK
SOFIA TORSSELL
KTH ROYAL INSTITUTE OF TECHNOLOGYSCHOOL OF INDUSTRIAL ENGINEERING AND MANAGEMENT

IN THE FIELD OF TECHNOLOGYDEGREE PROJECT MECHANICAL ENGINEERINGAND THE MAIN FIELD OF STUDYINDUSTRIAL MANAGEMENT,SECOND CYCLE, 30 CREDITS
, STOCKHOLM SWEDEN 2018
Business Models of Successful Start-up CompaniesA comparative study of start-ups’ business models and how these are adapted to trends and competition in the industry
KRISTINA BONDEMARK
SOFIA TORSSELL
KTH ROYAL INSTITUTE OF TECHNOLOGYSCHOOL OF INDUSTRIAL ENGINEERING AND MANAGEMENT

This page is intentionally left blank.

Business Models of Successful Start-up Companies
A comparative study of start-ups’ business models and how these are adapted to trends and competition in the industry
by
Kristina Bondemark Sofia Torssell
Master of Science Thesis INDEK 2018:328
KTH Industrial Engineering and Management
Industrial Management
SE-100 44 STOCKHOLM

Affärsmodeller i Framgångsrika Start-up Företag
En jämförande studie av start-ups affärsmodeller och hur dessa
anpassas till trender och konkurrens i branschen
av
Kristina Bondemark Sofia Torssell
Examensarbete INDEK 2018:328
KTH Industriell teknik och management
Industriell ekonomi och organisation
SE-100 44 STOCKHOLM


i
Master of Science Thesis INDEK 2018:328
Business Models of Successful Start-up Companies
Kristina Bondemark
Sofia Torssell
Approved
2018-06-07
Examiner
Terrence Brown
Supervisor
Esmail Salehi-Sangari
Commissioner
Contact person
Abstract
Since the majority of emerging start-ups are not able to survive on the market, this study
investigates business models in four start-up companies from two different industries in order
to better understand how their business models relates to their success. This study is
commissioned by a start-up who are about to begin their business in Stockholm. The purpose
of this study is to make an assessment of the components in the utilized business models of
growing start-ups in markets with different level of innovation. The investigation is made based
on how trends and competition in the industry affect the business model and what the
similarities are between the business model components of successful start-ups in two different
industries. This study contribute to literature on start-ups’ business models by beginning to map
differences and similarities in start-up’ business models as well as how these are affected by
and adapted to the industry. It also helps start-ups understand the importance and usage of
different business model components.
In order to make an assessment of different business models, a multiple case study approach is
adopted where each case is a start-up company. The analysis then follows a 2x2 framework and
is sorted by Business Model Canvas. Three analyses are made, one within each industry and
one between the two industries. The first analysis compares the business models of two
companies in the industry of electricity consumption measurements and finds that trends
regarding the environment and innovation affects both the industry and its’ competitors. The
second analysis compares the business models of two companies in the package deliveries
industry and trends regarding online shopping are found to affect this industry. The third
analysis compares the two industries and both differences and similarities are found. The main
findings regarding the business model components are then applied to the commissioner
company and other emerging start-ups.

ii
Findings shows that the investigated start-ups have adapted the business model components to
trends in the respective industry. The business model also adapts to the technological
development in the associated industry and in other industries as well. The use of social
channels seems to affect the customer relationships. Competition have affected the business
models’ of the investigated start-ups and it is noticed that international and national goals, such
as lowering the environmental impact, also affect the industry and the business models since
these goals can encourage and push for change. Furthermore, each of the start-ups’ business
model components have similarities even though the B2B, B2C and B2B2C strategies create
differences. Furthermore, all of the start-ups are working with the trial and error approach,
sustainability and environmental impact when developing their business model.
Key words: business models, start-ups, comparative study, Business Model Canvas

iii
Examensarbete INDEK 2018:328
Affärsmodeller i Framgångsrika Start-up Företag
Kristina Bondemark
Sofia Torssell
Godkänt
2018-06-07
Examinator
Terrence Brown
Handledare
Esmail Salehi-Sangari
Uppdragsgivare
Kontaktperson
Sammanfattning
Eftersom majoriteten av alla start-up företag inte lyckas överleva på marknaden undersöker
denna studie affärsmodeller i fyra start-ups i två olika industrier för att bättre förstå hur deras
affärsmodeller har påverkat deras framgång. Studien utförs i Stockholm där uppdragsgivaren
verkar. Syftet med studien är att göra en utvärdering av komponenterna i den verksamma
affärsmodellen i växande start-up företag som verkar på marknader med olika
innovationsnivåer. Studien utförs baserat på hur affärsmodellen anpassas efter trender och
konkurrens i branschen och vilka likheter som finns i dessa affärsmodellers komponenter.
Denna studie kan bidra till nuvarande litteratur om start-ups affärsmodeller genom att börja
kartlägga affärsmodellernas likheter och skillnader och se hur de är anpassade efter branschen.
Studien kan även hjälpa start-ups förstå nyttan och användningen av de olika komponenterna i
deras affärsmodell.
För att utföra jämförelsen användes en flerfallsstudie där de olika fallen är olika start-up företag.
Analysen utfördes med hjälp av en 2x2 modell och är strukturerad efter Business Model
Canvas. Totalt är tre analyser är genomförda, en inom varje bransch och en mellan de två
branscherna. Den första analysen jämför affärsmodellerna för de två start-up företagen i
branschen för elkonsumtionsmätningar och finner att innovation och trender från miljöaspekter
påverkar dess företag. Den andra analysen jämför affärsmodellerna för de två start-up företagen
i branschen för paketleveranser och finner att dessa företag påverkas av trenden webbshopping.
Tredje och sista analysen jämför likheter mellan branscherna och finner både skillnader och
likheter. Dessa kopplas sedan till uppdragsgivaren och andra nya start-ups i diskussionskapitlet.
Analysen visar på att de undersökta start-up företagen har anpassat sina affärsmodellers
komponenter efter trender i branschen. Affärsmodellen är också anpassad efter den tekniska
utvecklingen i både den egna och andras branscher. Sociala kanaler verkar påverka
kundrelationerna. Vidare har konkurrensen på marknaden påverkat affärsmodellerna, liksom
nationella och internationella mål inom exempelvis miljöpåverkan som uppmuntrar

iv
förändringar. Slutligen har varje enskild komponent i affärsmodellerna likheter, även om de
olika strategierna B2B, B2C och B2B2C skapar skillnader. Fortsättningsvis har alla undersökta
start-ups testat sig fram och jobbar med hållbarhet och miljöpåverkan för att utveckla sina
affärsmodeller.
Nyckelord: affärsmodeller, start-ups, jämförande studie, Business Model Canvas.

v
Foreword and acknowledgements
This master thesis was written during the spring of 2018 at the Industrial Marketing and
Entrepreneurship division at KTH Royal Institute of Technology in Stockholm, Sweden. The
two authors of the thesis have studied the Design and product realization and Mechanical
engineering programs respectively with the master degree in Industrial management.
We would like to thank some people who have helped improve this report and research. Firstly,
we are grateful for our supervisor Esmail Salehi-Sangari. He always read our paper when we
asked, taught us a lot about how research is made and gave guidance. Thank you very much!
Others who have read our work and provided us with feedback include our opponents, people
from our seminar group and friends. We would like to thank all of you as well.
This study was made possible thanks to the employees who we had the opportunities to
interview at the four start-ups. You have contributed to this research by taking time from your
busy schedules to discuss your company’s business model, be available for follow-up questions
after the interviews and also give feedback on our written material.
Last but not least, we would like to thank the commissioning company for providing us with
the general topic on start-ups’ business models. You also gave us the opportunity to work with
you and you met with us to discuss our work during this semester. We hope this investigation
will help you begin a successful business.
Kristina Bondemark and Sofia Torssell
Stockholm, 2018-06-07

vi

vii
Key definitions and abbreviations
3PL Third Party Logistics, companies who work as external actors and
outsourcing partners for logistics to which the online retailers can
outsource their logistics such as inbound delivery, picking and
packing (Gilliam, 2015).
Angel investor Someone who invest their own money in a company. The investing
individual may or may not have a connection or relationship to the
company or any of the company’s entrepreneurs (Entrepreneur
Media, 2018).
AI Artificial Intelligence is the technology where computers learn
human behaviors through machine learning. AI can for example
calculate advanced problems and recognize patterns (Larsson, 2016).
B2B Business-to-business (Iankova et al., 2018). A strategy where the
company targets other businesses as their customers.
B2C Business-to-consumer (Iankova et al., 2018). A strategy where the
company targets consumers as their customers.
B2B2C Business-to-business-to-consumer (Iankova et al., 2018). A strategy
where the company targets both other businesses and their
consumers as their customer and end user.
Consumer Does in this study refer to the individual who use the product or
service. Also called end user.
CRM Customer Relationship Management is used by a company to seek
understanding of their customer and manage the customer
relationships through processes and technologies (Chen and
Popovich, 2003).
Customer Does in this study refer to a paying or non-paying user of the product
or service. The customer can be either a business or a consumer.
Halfway shopping Defined by Interviewee B1 as when a consumer orders a product
online but still have to collect the order at a store or a delivery point.
Haulage contractors A person or a company who transport goods for other persons or
companies (Haulage contractor, 2018).
Platoon driving Vehicles driving close in a row while communicating (Scania, 2015).
Retailer The business customer to the companies in Industry B who sells
goods through their web shop to the consumers.
viii
Service point A staffed location where the consumer can pick up and send
packages.
Smart boxes Lockers where consumers can collect their packages.
Smart homes/offices Automation and digitalization of the home or office through
technological solutions and digital tools.
Social CRM The use of social media channels for CRM, or in some cases in a
combination with traditional CRM channels (Woodcock et al.,
2011).
Social media Digital communication channels where individual or professional
users can share information. Popular social media channels are for
example Facebook, Instagram, LinkedIn and Twitter.
Start-up company In this study defined as a company younger than ten years emerged
from an innovative technology and with a strong growth.
Sustainability Lacks an unambiguous definition but can be seen to consist of
economic, social and environmental aspects (Thwink, 2014). The
term is in this study used with the additional definition of sustainable
development, which is “development that meets the needs of the
present without compromising the ability of future generations to
meet their own needs.” (WCED, 1987, “Towards Sustainable
Development”, para.1).
Two-sided platforms Specific multi-sided platforms which connects two distinct groups
of customers (Muzellec et al., 2015).
Venture capital A type of financial funding by firms or funds which is commonly
given to small emerging businesses, such as start-ups, at an early
stage. The venture capitalist buys a stake in the start-up’s idea (Zider,
1998).

ix
Table of contents
1 Introduction ............................................................................................................................. 1
1.1 Background ...................................................................................................................... 1
1.1.1 The commissioner of this study ................................................................................ 1
1.1.2 Start-ups and small businesses .................................................................................. 1
1.1.3 Business model .......................................................................................................... 2
1.2 Problem formulation ........................................................................................................ 3
1.3 Purpose and research questions ........................................................................................ 3
1.4 Delimitations .................................................................................................................... 4
1.5 Research contribution ....................................................................................................... 4
1.6 Chapter summary ............................................................................................................. 4
2 Literature survey ..................................................................................................................... 7
2.1 Business models ............................................................................................................... 7
2.1.1 Business Model Canvas ............................................................................................ 8
2.1.2 Differences between B2B, B2C and B2B2C ............................................................ 9
2.2 Innovation ......................................................................................................................... 9
2.3 Chapter summary ........................................................................................................... 10
3 Research methodology .......................................................................................................... 11
3.1 Research design .............................................................................................................. 11
3.1.1 Research paradigm .................................................................................................. 11
3.1.2 Research approach ................................................................................................... 11
3.1.3 Case study ............................................................................................................... 11
3.2 Literature survey ............................................................................................................ 12
3.3 Comparative study framework and data structure .......................................................... 12
3.4 Data collection approach ................................................................................................ 13
3.5 Credibility ....................................................................................................................... 15
3.6 Ethical concerns ............................................................................................................. 16
3.7 Chapter summary ........................................................................................................... 17
4 Data presentation and analysis .............................................................................................. 19
4.1 Definition of a start-up company according to empirics ................................................ 19
4.2 Industry A ....................................................................................................................... 19
4.2.1 The industry of electricity consumption measurements .......................................... 19
4.2.2 Company A1 ........................................................................................................... 21
4.2.3 Company A2 ........................................................................................................... 21
4.2.4 Within Industry A analysis ...................................................................................... 22
4.3 Industry B ....................................................................................................................... 28

x
4.3.1 The industry of package deliveries .......................................................................... 28
4.3.2 Company B1 ............................................................................................................ 29
4.3.3 Company B2 ............................................................................................................ 30
4.3.4 Within Industry B analysis ...................................................................................... 30
4.4 Between Industry A and Industry B analysis ................................................................. 37
4.4.1 Trends and competition in the industry ................................................................... 37
4.4.2 Value proposition .................................................................................................... 37
4.4.3 Customer segments ................................................................................................. 38
4.4.4 Customer relationships ............................................................................................ 38
4.4.5 Channels .................................................................................................................. 38
4.4.6 Revenue streams ...................................................................................................... 39
4.4.7 Key activities ........................................................................................................... 39
4.4.8 Key resources .......................................................................................................... 39
4.4.9 Key partners ............................................................................................................ 40
4.4.10 Cost structure ......................................................................................................... 40
4.4.11 Future and sustainability ....................................................................................... 40
4.5 Chapter summary ........................................................................................................... 41
5 Discussion ............................................................................................................................. 43
5.1 BMC and the analyses .................................................................................................... 43
5.1.1 Development and market adaption of the offering .................................................. 43
5.1.2 Customer segmentation and relationships ............................................................... 45
5.1.3 Operations to realize the business model ................................................................ 46
5.1.4 The possibilities of partnerships .............................................................................. 47
5.1.5 The future and sustainable businesses ..................................................................... 47
5.2 Chapter summary ........................................................................................................... 48
6 Conclusion ............................................................................................................................. 51
6.1 Answers to the research questions ................................................................................. 51
6.2 Limitations of this study and future research ................................................................. 52
6.3 Chapter summary ........................................................................................................... 52
7 References ............................................................................................................................. 55
Appendix 1. Business Model Canvas components .................................................................. 65
Appendix 2. Search words ....................................................................................................... 69

xi
List of figures
Figure 1. The four stages a start-up goes through. .................................................................... 2
Figure 2. The Business Model Canvas with nine components. ................................................. 8 Figure 3. The 2x2 framework for the comparative study. ....................................................... 12 Figure 4. Electricity consumption in Sweden in the area of residential and services. ............ 20 Figure 5. Statistics regarding the customers’ expectations for package deliveries. ................ 28
List of tables
Table 1. The four criteria used to qualify start-ups for this study. .......................................... 14
Table 2. The conducted interviews. ......................................................................................... 15

xii
Chapter 1 Introduction
1
1 Introduction
When a new firm enter a market they have to develop a business model that is suited for their
own business and adapted to the entered market. According to research, it is not enough to adopt
a business model from an established firm no matter how successful they have been or still are
(Foss et al., 2015). Because of this, a new entrant must know how to develop their business
model as well as work with it in order to succeed. A start-up company is one example of a new
entrant.
This introduction chapter gives a brief background of start-up companies and business models.
The research problem is described together with the purpose delimitations and research
contributions of this study.
1.1 Background
In order to better understand the problem formulation, this section provides a background on
the commissioning company, start-ups and business models.
1.1.1 The commissioner of this study
This study was initially commissioned by a start-up situated in Stockholm, Sweden, who in this
study is referred to as the Commissioner. The Commissioner are currently developing their
business around a product with an associated service to measure water usage.
The level of innovation is complex to measure however the market of measuring water usage
in Sweden is by the researchers in this study considered having little innovation activity by the
actors. The market generally have slow and non-disruptive changes. However, with technology
advancements, measurement systems are becoming more innovative.
1.1.2 Start-ups and small businesses
A start-up is a small company with large potential to grow rapidly but with high risks of failing
along the way. It is commonly known for developing a new technology-based innovative idea,
but are not driven only by money (Viswanathan, 2017; StartupAUS, 2016). According to a
report by European Startup Monitor (ESM), start-up companies are ventures younger than ten
years striving for significant growth regarding employees and/or sales (Kollmann et al., 2017).
Compared to an established business, a start-up has no distinguished customers in the beginning
and they work to discover and develop a suitable business model (Duening et al., 2015). In this
study, a start-up has therefore been defined as a company younger than ten years emerged from
an innovative technology and with a strong growth. A successful start-up is defined as a start-
up company which has reached the market and continued to grow in for example revenue and/or
number of customers.

Chapter 1 Introduction
2
The lifecycle of a start-up is described with different stages by several authors. Two sided
Internet platforms can for example be described by the four stages embryonic, emerging,
growth and growth/maturity (Muzellec et al., 2015). The first two stages are focusing on the
product or service and then acquiring and bringing value to the customers. In the two later
stages, focus will also be on acquiring revenue and balancing the cost and revenue possibilities.
Another description is presented by the community platform The Hub who lists start-ups in
Sweden and the Nordic countries with regard to four stages; idea, product or prototype, going
to market and growth (The Hub, 2018). These stages can be seen in Figure 1.
Figure 1. The four stages a start-up goes through.
Every start-up company starts with an idea of what they want to do and why, followed by a
product or prototype to test that idea. If the prototype is good enough to get investors, the start-
up continues with going to market to later be able to grow and expand. The Commissioner is,
at the time for this study, in the second stage; product or prototype.
Start-ups are often associated with innovation and new technology (Regeringskansliet, 2017).
The level of innovation activities differs between industries. An increased number of firms
increases the competition in the industry and that industry also has more innovation activity
(Aghion et al., 2001). In this study, the term “level of innovation” is affected by both the number
of innovation activities and the type of activities in a company.
It is worth mentioning that not all emerging small business are start-ups. A small business is a
company not necessarily motivated by promoting innovative products or services (Kollmann et
al., 2017), but put more value in making a profit and sustaining the business for a long time. It
can be argued that start-ups are included in the definition of small business, but the terms are
separated for the clarity of this study.
1.1.3 Business model
A business model is used by both established and new firms in order to bring products and
services to the market. In order to make money, the business model is responsible to ensure that
technological innovation delivers value to the customer (Chesbrough and Rosenbloom, 2002).
In addition to this, it should tell who the customers are and why they will buy the product or
service (Blank, 2007). Furthermore, a business model is built on several components and the
purpose of the business model has to be understood by employees in order to create, deliver
and capture value from the commercialization (Chesbrough and Rosenbloom, 2002;
Osterwalder and Pigneur, 2010).
Chapter 1 Introduction
3
A start-up’s initial phase differs from an established company in terms of their lack of
distinguished and paying customers. Because of this, the start-up cannot determine how to
design their business model in order to successfully create and bring value. Instead, the goal for
a start-up is to become credible, address the customer and market demand as well as
characterizing sales and revenue before going into designing the business model (Duening et
al., 2015).
It is important to have a good strategy and a unique business model when entering a market
since the statistics shows that 5-10 % of new entrants fail within one year of entry and 50 % fail
within five years (Markides, 2015). The fail-rate for start-ups specifically are often said to be
even higher, over 90 % (Byttner, 2016; Patel, 2015), as they are more disruptive entrants with
bigger risks. Some of the most common reasons for a start-up to fail includes poorly evaluated
market needs which results in a non-existing market for the product, insufficient capital, lack
of customer awareness and premature scaling (Yetisen et al., 2015).
1.2 Problem formulation
When a start-up is entering a market, they will have to compete with the existing products and
services when delivering value to their customer. Challenges include to understand the
customer needs and convince the customer to choose a specific product. Since the statistics
show that 90 % of start-ups fail, they have to adapt their business model in order to create a
competitive advantage.
Many factors can affect a business model and start-up companies are vulnerable since they do
not have a well-established position on the market. They have to regard the industry’s trends
and competition in order to adapt their business model. Therefore, one of the main problems
for a start-up is to successfully enter the market and adapt the business model to the industry in
order to grow.
1.3 Purpose and research questions
The purpose of this study is to make an assessment of the components in the utilized business
models of growing start-ups in markets with different level of innovation.
The assessment will be done based on the following research questions:
RQ1. How does trends in the industry affect the business model?
RQ2. How does competition in the industry affect the business model?
RQ3. What are the similarities between the business models of successful start-ups in two
different industries?

Chapter 1 Introduction
4
1.4 Delimitations
This study is first and foremost delimited to be focusing on the functional level in the system
perspective. The functional level is defined as a perspective on the firm’s organization and
business and it is chosen since the investigation is made with a firm perspective focused on the
business models, not the industries. Furthermore, the business model components are observed
from a perspective of why they were developed instead of only what they are. Numerical values
for costs and revenue are therefore not included in this study.
The geographical delimitation of this study is Stockholm, Sweden, since it is geographically
closest to the researchers during the time of this study. This made it possible to find and
interview start-up companies with the same market conditions. However, since the studied
concepts of business models and start-ups does not vary greatly in the literature regarding
geographical area, international sources are included in the literature and background chapters.
1.5 Research contribution
This study contribute with research on start-ups in the field of business models. While there is
a lot of research about large established companies there is not as much about start-ups in the
literature within business models and practical applications of business models.
Even though some reasons for start-ups’ failure are listed in literature, it is not described how
other start-ups’ business models have avoided the reasons for failure by for example adapt to
trends and competition in the industry. This will therefore be investigated in this study. The
study also helps start-ups understand the different business model components’ importance for
the business’ growth. This includes, for example, what resources other start-ups have used and
where they have used them in order to grow and become successful.
By mapping differences and similarities in start-ups’ business models, and how these are
affected by and adapted to the industry, this research helps start-ups succeed. Start-ups who
survive can contribute to sustainability in economics and society. Competition, growth and
technology development all benefit from start-up companies. They can for example increase
employment rate as small corporations and provide environmental technology improvements
to societies.
1.6 Chapter summary
This introductory chapter presents a brief background to the study with central terms and
definitions. The commissioning start-up is also presented shortly. A start-up is in this study
defined as a company younger than ten years emerged from an innovative technology and with
a strong growth. However, the majority of emerging start-ups are not able to survive and the
importance of business models and their characteristics are highlighted.

Chapter 1 Introduction
5
The purpose of this study is to make an assessment of the components in the utilized business
models of growing start-ups in industries with different level of innovation. The investigation
will be made based on the following research questions; how trends in the industry affect the
business model, how competition in the industry affect the business model and what the
similarities are between the business models of successful start-ups in two different industries.
This study is delimited to be focusing on the functional level in the system perspective, include
start-ups operating in Stockholm but does not include numerical values. Furthermore, this
investigation contribute with research on start-ups’ business models and begins to map
differences and similarities in start-up’ business models as well as how these are affected by
and adapted to the industry. The study also helps start-ups understand the importance and usage
of different business model components.

Chapter 1 Introduction
6

Chapter 2 Literature survey
7
2 Literature survey
This chapter presents previous research on business models and the frequently used tool
Business Model Canvas. It also presents previous research from literature on innovation and
how it is affected by market competition or the number of start-ups.
2.1 Business models
Business models have been used since the middle of the 20th century (Mateu and March-
Chorda, 2016; Yang et al., 2017) but an unambiguous agreement of what a business model is
does not exist (Zott et al., 2011). Although the concept is often studied without an explicit
definition, it has over the years been referred to as a statement, a description, a representation,
an architecture, a structural template, a framework, a pattern and a set, a conceptual tool or a
model (Foss et al., 2015). While the definitions of a business model are many, one explain the
business model as “[...] the heuristic logic that connects technical potential with the realization
of economic value” (Chesbrough and Rosenbloom, 2002, p.529) and another defines it as “a
reflection of the firm’s realized strategy” (Casadesus-Masanell and Ricart, 2010, p.195).
No matter the exact definition, the business model is part of a business’ strategy (Mateu and
March-Chorda, 2016). The business strategy is more focused on the questions what to offer;
what the market looks like; and how the offer should be provided to customers (Santos et al.,
2015) while the business model is concentrated to how to deliver what value and how to best
organize in order to create, provide and capture this value (Saebi, 2015).
A lot of literature describe how to use and create successful business models. The research
about imitating and copying another company’s business model in order to improve show
varying results. Copying successful business models to other markets or industries have been
done a lot and is difficult to prevent (Dickinson, 2009 cited in Mateu and March-Chorda, 2016,
p.4). However, one distributor’s successful business model cannot be successfully copied by
another company without developing it further in order for it to be adapted to the new market
(Markides, 2015). For example, the same technology yields different income depending on how
it is commercialized (Chesbrough, 2010). The only thing that will bring competitive advantage
when reacting to challenges or exploiting an opportunity is speed and an agile culture in the
organization and business model (Markides, 2015). Nevertheless, a company’s ability to
generate business models to later choose and implement the best one becomes a dynamic
capability (Mateu and March-Chorda, 2016).
Since many companies have an increased focus on service, innovation and sustainability as a
maneuver to increase competitive advantage, the business model research have gotten new
focus areas as well. Broad terms such as sustainability and innovation are to some extent still
adapted to fit the researchers’ purpose but researchers nevertheless describe the importance of
a business model being able to withstand or adapt to technological, environmental and social
Chapter 2 Literature survey
8
changes. The success of a company is found to be dependent on simultaneously succeeding
with matching competitors’ value proposition and improving their own value proposition
enough for customer to consider their offering as the better one (Markides, 2015). In addition
to this, the survival of a company is determined by their ability to modify and adapt their
business model (Jabłonski and Jabłonski, 2016).
2.1.1 Business Model Canvas
Even though there are many tools to structure a business model (Haaker et al., 2017), the
Business Model Canvas (BMC) by Osterwalder and Pigneur is one of the most famous ones.
BMC is a tool that can help to assess, visualize and describe a company’s business model
(Osterwalder and Pigneur, 2010). It gives an overview of the operational strategies, especially
when used on a single offering, customer or market at a time (Frick and Ali, 2013). The BMC
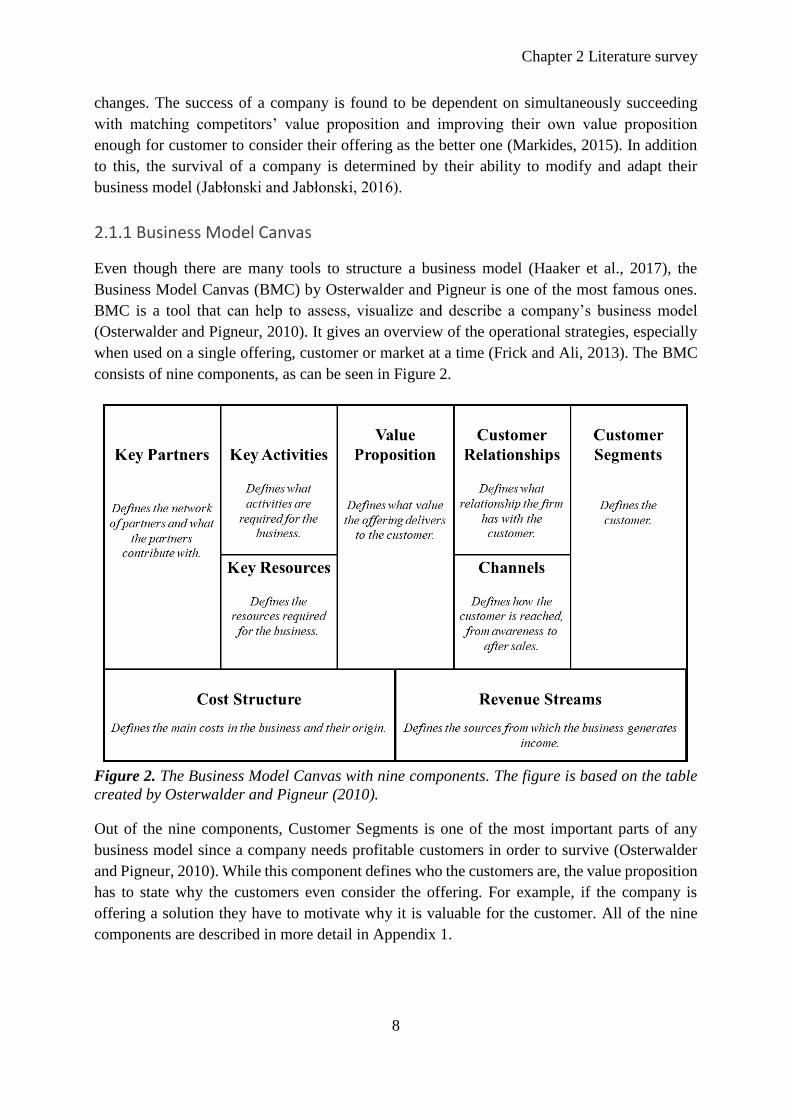
consists of nine components, as can be seen in Figure 2.
Figure 2. The Business Model Canvas with nine components. The figure is based on the table
created by Osterwalder and Pigneur (2010).
Out of the nine components, Customer Segments is one of the most important parts of any
business model since a company needs profitable customers in order to survive (Osterwalder
and Pigneur, 2010). While this component defines who the customers are, the value proposition
has to state why the customers even consider the offering. For example, if the company is
offering a solution they have to motivate why it is valuable for the customer. All of the nine
components are described in more detail in Appendix 1.

Chapter 2 Literature survey
9
2.1.2 Differences between B2B, B2C and B2B2C
There are several strategies a company can use and the different strategies affect the content of
the business model. Three of them are business-to-business (B2B), business-to-consumer
(B2C) and business-to-business-to-consumer (B2B2C).
B2B companies have not transitioned to digital marketing platforms such as social media the
same way B2C companies have used these platforms for marketing purposes. Companies with
the B2B2C strategy on the other hand get revenue from other business but manage the
customers of these business as well. Therefore they have to market themselves towards both
businesses and consumers at the same time (Iankova et al., 2018).
It is found in previous studies that B2B businesses focus on the importance of activities related
to maintaining the relationship with the customer more than B2C business do (Iankova et al.,
2018; Moore et al., 2013). However, B2B2C businesses use reviews and ratings more than both
B2B and B2C companies do. While all three market strategies use social media for customer
acquisition, B2B businesses are less eager to use social media for maintaining relationships
with their existing customers (Iankova et al., 2018).
2.2 Innovation
There are many ways to innovate, and while product innovation innovates the offering (product
or service) and process innovation innovates the processes for developing the offering, business
model innovation innovates the components of the company’s business model. A company can
for example innovate their business model in three ways; either by industry model innovation,
revenue model innovation or enterprise model innovation (Giesen et al., 2007). According to
this, a business model can be innovated by a horizontal move between existing or newly created
industries, by changing how revenue is generated or by changing the structure of the company
and its role in the current or a new value chain.
The level of innovation is not easily measured in for example a country or an industry. Many
companies measure innovation as an outcome and a result, the number of progressing
innovation projects or input in the form of generated innovative ideas (Richtnér et al., 2017).
Measurements that are used in research about innovation are for example the number of patent
application or the total factor for productivity (Anokhin and Wincent, 2011). However, there
are many possible ways to measure innovation but not one right way to do it.
There is extensive literature on the relationship between competition and innovation. Increased
competition leads to increased investments in research and development (R&D) for products
and services in competing firms while the investments decrease in laggard firms (Aghion et al.,
2014). R&D investments result in innovations (Aghion et al., 2014) and these investments are
important since innovation are considered the main driver of economic growth (Colombo et al.,
2017). Furthermore, an industry with more than one firm has more innovative activity and the
competition correlates with the productivity growth (Aghion et al., 2001).

Chapter 2 Literature survey
10
Schumpeter has researched on innovation and come up with the hypothesis that large firms with
market power increase the rate of innovation (Nicholas, 2003). However, this theory called
Schumpeterian growth also involves new firms that can enter the market and might even be
able to dominate the industry through creative destruction, which is the “process of industrial
mutation that incessantly revolutionizes the economic structure from within, incessantly
destroying the old one, incessantly creating a new one” (Schumpeter, 1942, cited in Tülüce and
Yurtkur, 2015, p.721). Several authors argues that smaller firms tend to innovate more,
relatively their size, than large firms do (Nicholas, 2003) and that creative destruction is always
included in growth (Aghion et al., 2015). Although, a little competition increase the growth and
the maximal degree of competition has to be allowed in order to achieve maximal growth rate.
A little imitation is almost always needed as well (Aghion et al., 2001). Furthermore, market
power can stimulate technological progress since firms expect to receive rents from the
monopoly with the help of innovation (Nicholas, 2003).
Following the hypothesis by Schumpeter, the relationship between the number of start-ups and
innovation is ambiguous and lacks a clear correlation. Even though many assumptions says that
a high start-up rate correlates to high innovation rate, it is not sure that the correlation is positive
in all settings. However, the correlation could be questioned since it can also be affected by the
level of development in the observed country. The relationship is context-dependent and
therefore the rate of start-ups may be both positively and negatively related to the level of
innovation (Anokhin and Wincent, 2011).
2.3 Chapter summary
Previous research regarding business models, BMC and innovation are presented in a literature
survey. The research on business models focus on what the unambiguous concept is, what it
aims to do and characteristics that improve the businesses’ chances of survival. The business
model has to withstand or adapt to technological, environmental and social change as well as
be able to do so fast in order to acquire competitive advantage. Previous research also states
that the business model cannot be copied without alteration but tools such as the BMC with its’
nine components are widely used to develop and structure the business model.
The previous research on innovation is focused on the concept of innovation and how different
types of competitors affect the level of innovation in a market. There are many ways to innovate,
for example through business model innovation, and there are also many, yet questionable,
ways to measure innovation. Research is not unanimous regarding whether start-ups increase
innovation but many authors agree that competition increase investments for research and
development.

Chapter 3 Research methodology
11
3 Research methodology
This chapter justifies the research’s methodology and clarifies the its’ methods by presenting
the research design as well as how preparations for the research were made, how data was
collected, how the analysis was conducted and with what tools. The chapter is finalized with a
discussion on credibility and ethics of this study.
3.1 Research design
This section on research design explains the research paradigm and approach of the study,
including the case study approach.
3.1.1 Research paradigm
A research paradigm is the logic of which guides how the research should be conducted based
on the researcher’s perspective about the world and the nature of knowledge (Collis and Hussey,
2009). “Interpretive methods of research adopt the position that our knowledge of reality is a
social construction by human actors. In this view, value-free data cannot be obtained, since the
enquirer uses his or her preconceptions in order to guide the process of enquiry, and furthermore
the researcher interacts with the human subjects of the enquiry, changing the perceptions of
both parties” (Walsham, 1995, p.376). This study is considered to be within the interpretivism
paradigm.
3.1.2 Research approach
Qualitative and quantitative are two approaches to conduct research. Quantitative research is
traditionally more used in natural science and it often use methods such as surveys, experiments
or statistical calculations. Qualitative research on the other hand often gathers semi-structured
empirical data and the analysis is based on words more than numbers (Yin, 1993).
This study have tried to identify what new companies can learn from successful ones in similar
fields and did not aim to quantify any data or results. Therefore, this study has a qualitative data
and research approach.
3.1.3 Case study
Case research starts from the desire to develop a comprehension of a single or small number of
cases in a real world environment (Yin, 2012). The aim is to investigate a certain phenomenon,
person, organization, event or behavioral condition in its everyday environment with the help
of one or multiple cases. Even though case studies are often associated with qualitative methods,
they can be both qualitative and quantitative depending on the data’s approach (Yin, 1993).
Chapter 3 Research methodology
12
This research used a case study approach with multiple cases where each case consisted of one
start-up company. The multiple cases made it possible to make a comparative assessment of the
components in the utilized business models of growing start-ups.
3.2 Literature survey
The literature survey was conducted in order to find theory on business models and start-ups as
well as be able to position this research amongst the previous. The literature consisted of peer-
reviewed material from scientific journals, business journals and books. The literature was
found using search words listed in Appendix 2.
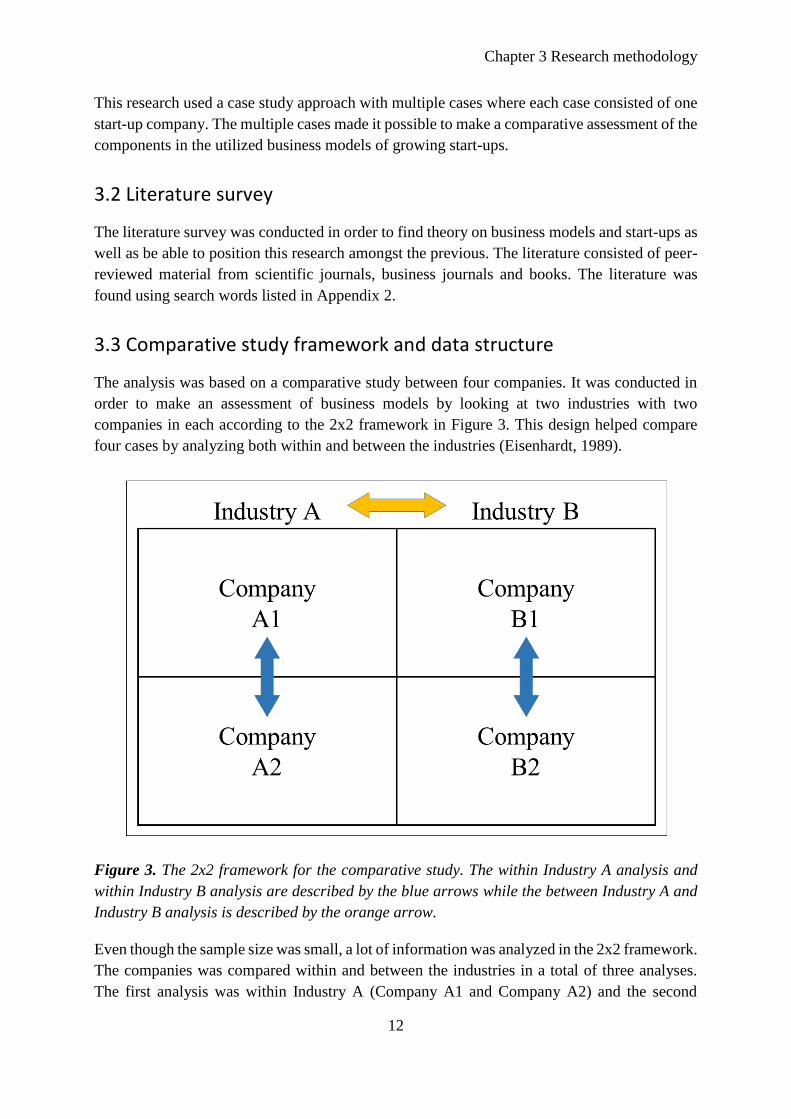
3.3 Comparative study framework and data structure
The analysis was based on a comparative study between four companies. It was conducted in
order to make an assessment of business models by looking at two industries with two
companies in each according to the 2x2 framework in Figure 3. This design helped compare
four cases by analyzing both within and between the industries (Eisenhardt, 1989).
Figure 3. The 2x2 framework for the comparative study. The within Industry A analysis and
within Industry B analysis are described by the blue arrows while the between Industry A and
Industry B analysis is described by the orange arrow.
Even though the sample size was small, a lot of information was analyzed in the 2x2 framework.
The companies was compared within and between the industries in a total of three analyses.
The first analysis was within Industry A (Company A1 and Company A2) and the second
Chapter 3 Research methodology
13
analysis within Industry B (Company B1 and Company B2). These analyses can be seen by the
blue arrows in Figure 3. The third analysis was between Industry A and Industry B and can be
seen by the orange arrow in Figure 3.
The BMC was used to structure the data for each company and thereby create a similar
foundation for the analyses. Even though there are other tools in the literature for developing
business models, the BMC was chosen since it is well-known and widely adopted in practice
and research (Joyce and Paquin, 2015). However, the additional headings “Competitors” and
“Future and sustainability” were added to the analyses in order to get a wider understanding of
the industries and businesses.
The first two analyses, within Industry A and within Industry B, was based on the BMC
components while the third analysis, between Industry A and Industry B, was done based on
the similarities found in each BMC component from the within analyses of Industry A and
Industry B. The similarities was compared between the industries.
3.4 Data collection approach
Considering qualitative studies, secondary data alone is not sufficient to contribute with new
research and primary data has to be collected as well (Greener, 2008). This study therefore
analyzed primary data collected from interviews and connected it to secondary data from web
pages and documents regarding the investigated companies and industries. Interviews were
chosen as the data collection method in order to get a deeper understanding of the start-up
companies’ business models and their industries.
Four criteria was used in order to select the four companies and find appropriate candidates for
the interviewees. The first criteria regarded the availability of the companies to ensure that they
were accessible and could provide the information needed for this study. This meant for
example that the company was operating in, and originated from, Sweden. Since this study took
place in Stockholm, the local area was preferred in terms of accessibility. Furthermore, the
companies should have emerged as start-ups and grown to reach the market where they
launched their product or service. They were also preferred to have one main offering. The
complete list of the criteria for the start-up companies are listed in Table 1 below.
Chapter 3 Research methodology
14
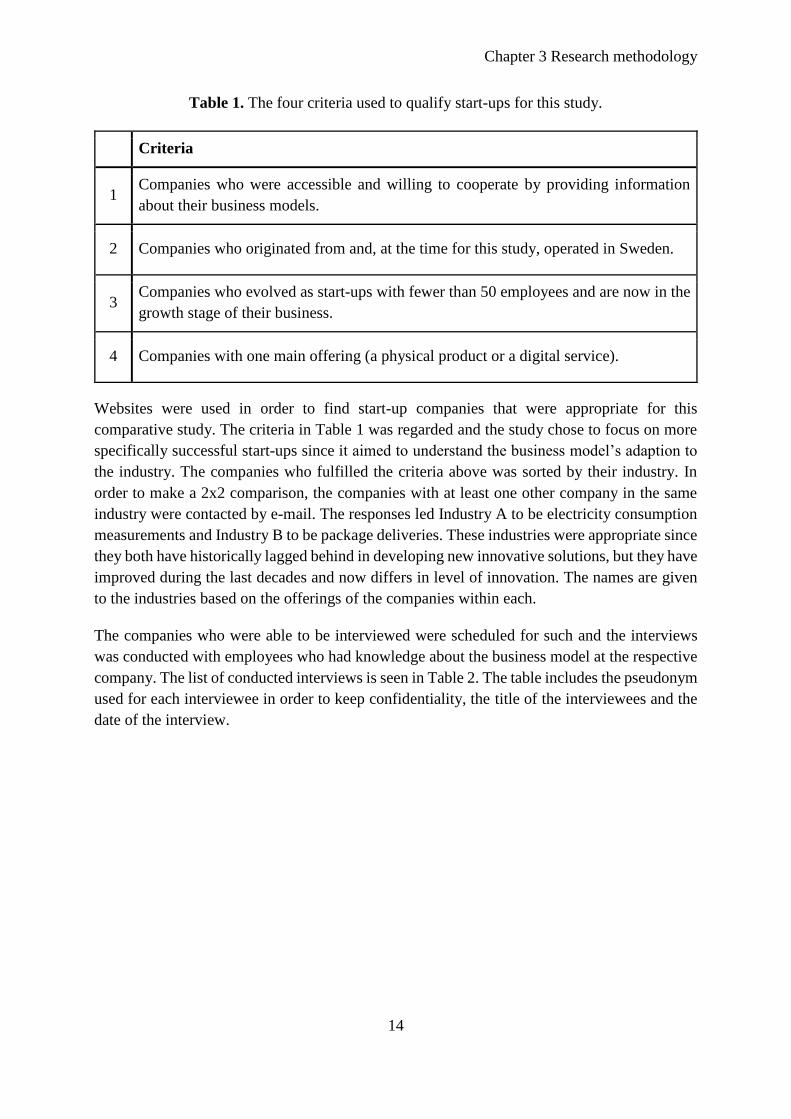
Table 1. The four criteria used to qualify start-ups for this study.
Criteria
1 Companies who were accessible and willing to cooperate by providing information
about their business models.
2 Companies who originated from and, at the time for this study, operated in Sweden.
3 Companies who evolved as start-ups with fewer than 50 employees and are now in the
growth stage of their business.
4 Companies with one main offering (a physical product or a digital service).
Websites were used in order to find start-up companies that were appropriate for this
comparative study. The criteria in Table 1 was regarded and the study chose to focus on more
specifically successful start-ups since it aimed to understand the business model’s adaption to
the industry. The companies who fulfilled the criteria above was sorted by their industry. In
order to make a 2x2 comparison, the companies with at least one other company in the same
industry were contacted by e-mail. The responses led Industry A to be electricity consumption
measurements and Industry B to be package deliveries. These industries were appropriate since
they both have historically lagged behind in developing new innovative solutions, but they have
improved during the last decades and now differs in level of innovation. The names are given
to the industries based on the offerings of the companies within each.
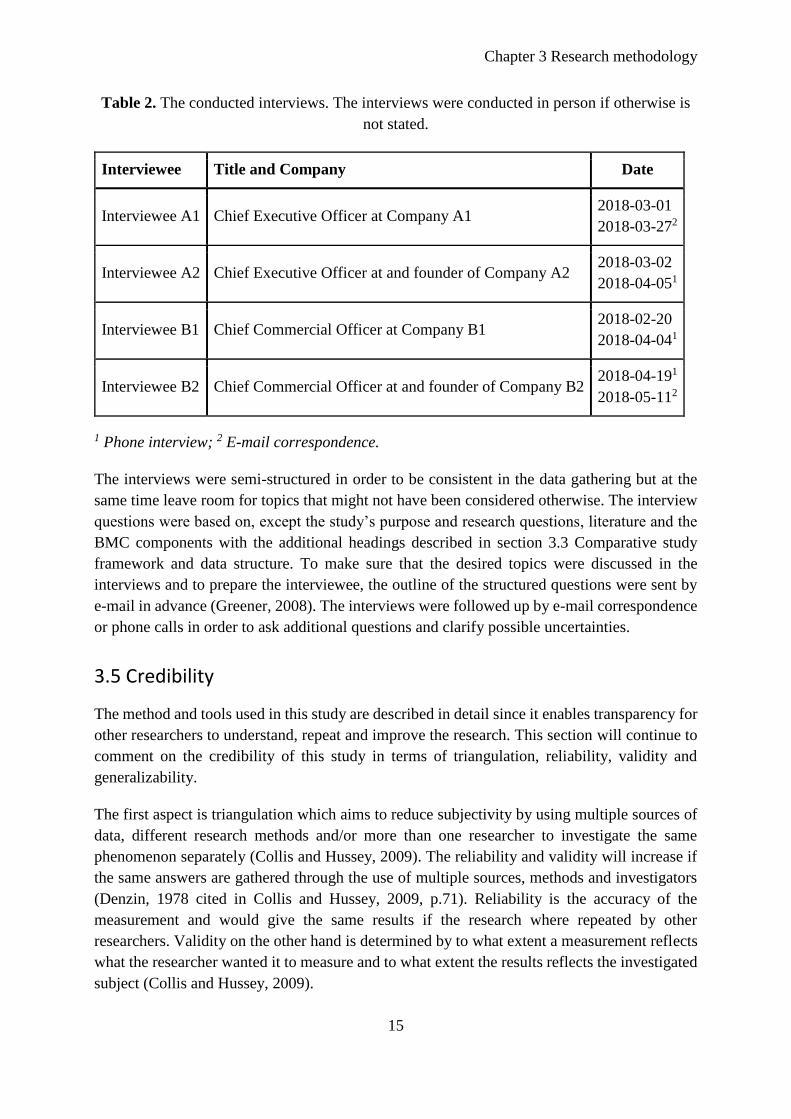
The companies who were able to be interviewed were scheduled for such and the interviews
was conducted with employees who had knowledge about the business model at the respective
company. The list of conducted interviews is seen in Table 2. The table includes the pseudonym
used for each interviewee in order to keep confidentiality, the title of the interviewees and the
date of the interview.
Chapter 3 Research methodology
15
Table 2. The conducted interviews. The interviews were conducted in person if otherwise is
not stated.
Interviewee Title and Company Date
Interviewee A1 Chief Executive Officer at Company A1 2018-03-01
2018-03-272
Interviewee A2 Chief Executive Officer at and founder of Company A2 2018-03-02
2018-04-051
Interviewee B1 Chief Commercial Officer at Company B1 2018-02-20
2018-04-041
Interviewee B2 Chief Commercial Officer at and founder of Company B2 2018-04-191
2018-05-112
1 Phone interview; 2 E-mail correspondence.
The interviews were semi-structured in order to be consistent in the data gathering but at the
same time leave room for topics that might not have been considered otherwise. The interview
questions were based on, except the study’s purpose and research questions, literature and the
BMC components with the additional headings described in section 3.3 Comparative study
framework and data structure. To make sure that the desired topics were discussed in the
interviews and to prepare the interviewee, the outline of the structured questions were sent by
e-mail in advance (Greener, 2008). The interviews were followed up by e-mail correspondence
or phone calls in order to ask additional questions and clarify possible uncertainties.
3.5 Credibility
The method and tools used in this study are described in detail since it enables transparency for
other researchers to understand, repeat and improve the research. This section will continue to
comment on the credibility of this study in terms of triangulation, reliability, validity and
generalizability.
The first aspect is triangulation which aims to reduce subjectivity by using multiple sources of
data, different research methods and/or more than one researcher to investigate the same
phenomenon separately (Collis and Hussey, 2009). The reliability and validity will increase if
the same answers are gathered through the use of multiple sources, methods and investigators
(Denzin, 1978 cited in Collis and Hussey, 2009, p.71). Reliability is the accuracy of the
measurement and would give the same results if the research where repeated by other
researchers. Validity on the other hand is determined by to what extent a measurement reflects
what the researcher wanted it to measure and to what extent the results reflects the investigated
subject (Collis and Hussey, 2009).

Chapter 3 Research methodology
16
Both researchers of this study was present during the interviews and thanks to this, one
interviewer could focus on what was said and ask follow up questions while the other
interviewer kept the interview to the topic and took notes. Even though some argue that separate
interviews get higher reliability (Collis and Hussey, 2009), the companies in this study did not
have time to participate in the same interview twice. Nevertheless, data triangulation, the use
of multiple sources, was aimed for in order to obtain a higher reliability. The reliability in
qualitative studies within the interpretivist paradigm is not of highest importance and the
researchers’ ability to understand different observations or interpretations are more important
since the researchers affect the research (Collis and Hussey, 2009). This study could for
example benefit from multiple perspectives in each case but as it turned out, none of the start-
ups were able to provide a second interviewee which can limit the data’s objectivity, reliability
and validity. However, it was possible to acquire interviewees in each industry with the same
position and bias answers were considered.
Research methods or poor samples are examples of what can affect the validity of a study. In
addition to finding suited methods, this study have interviewed employees working in close
relation to the business model and a dialogue has been upheld with them both before and after
the interviews. Some information about the companies and their upcoming changes have been
left out, disguised or were never acquired which could lead to other findings for other
researchers. Furthermore, Interviewee B2 was interviewed much later than the other
interviewees which could have affected what answers were sought by the researchers.
Additionally, this interview was conducted over the phone instead of in person which caused
difficulties in the communication. All the interviews were held in Swedish since it was easier
for the interviewees to express themselves in their native language. Therefore, the translation
to English could have affected the primary data. However, the English written drafts was
approved by the interviewees. The extracted data did answer the asked questions and
clarifications have been made with the interviewees afterwards. The validity of this study is
therefore considered good.
Generalizability is the extent to which a research finding can be applied to other cases or
settings. Even with one case, generalizability is possible but researchers need comprehensive
and deep understanding of the studied phenomenon. Some generalization was sought in this
study since it aimed to help other start-ups become successful. However, since a complete
investigation of causality was not performed and research on business models shows different
results regarding copying other companies’ business models, the generalizations and
recommendation was done with precaution.
3.6 Ethical concerns
Several ethical issues were considered and discussed throughout this study. This regarded codes
of conduct, plagiarism, confidentiality and anonymity. To begin with, the Swedish Research
Council has created a codex with principles for ethical research in the humanities and social
sciences among many other fields of research. The codex stress issues handled in regulations
and governmental acts but also the importance of a scientifically approved research with openly

Chapter 3 Research methodology
17
reported results that other researchers can check and use to repeat the research (Swedish
Research Council, 2018).
The Swedish Association of Graduate Engineers present their Code of Honor in ten principles
for engineers. For example should the engineer “not work in or interact with business and
organizations of questionable character or goals that conflict with personal beliefs” (Swedish
Association of Graduate Engineers, 2018) which has been regarded in this research in terms of
both the Commissioner as well as the four start-up companies in the comparative study.
Furthermore, they stress that the engineer should strive for an objective method in their work
and avoid false information. Therefore, this research used mostly peer-reviewed sources but
data was also gathered from websites that were considered reliable. In addition, the data
collected from the interviews have been considered true even though this was not something
that could be ensured completely.
Plagiarism has been avoided by separating the gathered empirics and drawn conclusions from
previous research as well as carefully mark when quotes are used. Furthermore, confidentiality
and anonymity has been treated with care which was especially considered for the
Commissioner, the four start-up companies in the analyses and the interviewees. All the
interviews began with information about the purpose of the interview and the study as well as
how the information would be used. The interviewers also requested the consent from the
interviewee to record and use the data. The recordings were then kept confidential and only
used by the researchers during the research process. Some information have been left out or
disguised in order to help anonymity and the companies’ future plans. Only the information
necessary for the analyses was presented.
3.7 Chapter summary
This study is in the interpretivism paradigm and have a qualitative approach. The comparative
study is built on multiple case studies where one case is one investigated company. It follows a
2x2 framework and uses both secondary and primary data, where the last one is obtained by
semi-structured interviews. In total, three analyses are made with four companies and two
industries. The credibility of the study is considered good but can be affected by for example
ethical issues such as anonymity and bias answers from the interviewees.

Chapter 3 Research methodology
18

Chapter 4 Data presentation and analysis
19
4 Data presentation and analysis
This chapter presents data parallel to the analyses. It includes the two investigated industries
and the four start-up companies with a background to their business and how they work with
business models. The chapter begins with reviewing the term start-up before the comparative
study and the assessment of the start-up companies’ business models are done.
4.1 Definition of a start-up company according to empirics
The definition of the term start-up is ambiguous, as mentioned before, and the interviewees
therefore gave their own description on how they define a start-up company. This way, the
researchers could ensure whether they considered themselves as a start-up.
To begin with, Interviewee B1 agrees with the literature that a clear definition lacks but
acknowledge that start-up companies are about strong growth and contains a disruptive business
model to challenge the established solutions. Interviewee A2 continues this reasoning by also
connecting start-ups to innovation and rethinking the traditional organization. Start-up is more
of a culture and process than anything else, according to Interviewee A2. According to
Interviewee B2, a start-up has at least three qualities which applies to Company B2; they are
not afraid to try something new, they are flexible and they are right now in the “beginning of
something bigger”. In other words, they challenge the market and have much likely a strong
growth ahead.
Apart from Interviewee A2, Interviewee B1 and Interviewee B2 who all define their companies
as start-ups respectively, Interviewee A1 define Company A1 as a scale-up more than a start-
up since they do no longer scale as fast as a start-up does. They are becoming a more established
actor on the market and the start-up label is starting to get obsolete. However, this study still
considers Company A1 as a start-up since they have emerged from an innovative technology
and have a strong growth.
4.2 Industry A
This section introduces Industry A, electricity consumption measurements, with information
about changes in the market as well as developments and innovation within the industry.
Company A1 and Company A2 are then presented, followed by the within analysis of their
business models.
4.2.1 The industry of electricity consumption measurements
The electricity came to Sweden during the 19th century (Vattenfall, 2018a) but it was not until
the 1960s that electrical machines had become part of all Swedish homes (Vattenfall, 2018b).
In 2016, electricity made out 33 % of the total energy usage in Sweden (Swedish Energy
Chapter 4 Data presentation and analysis
20
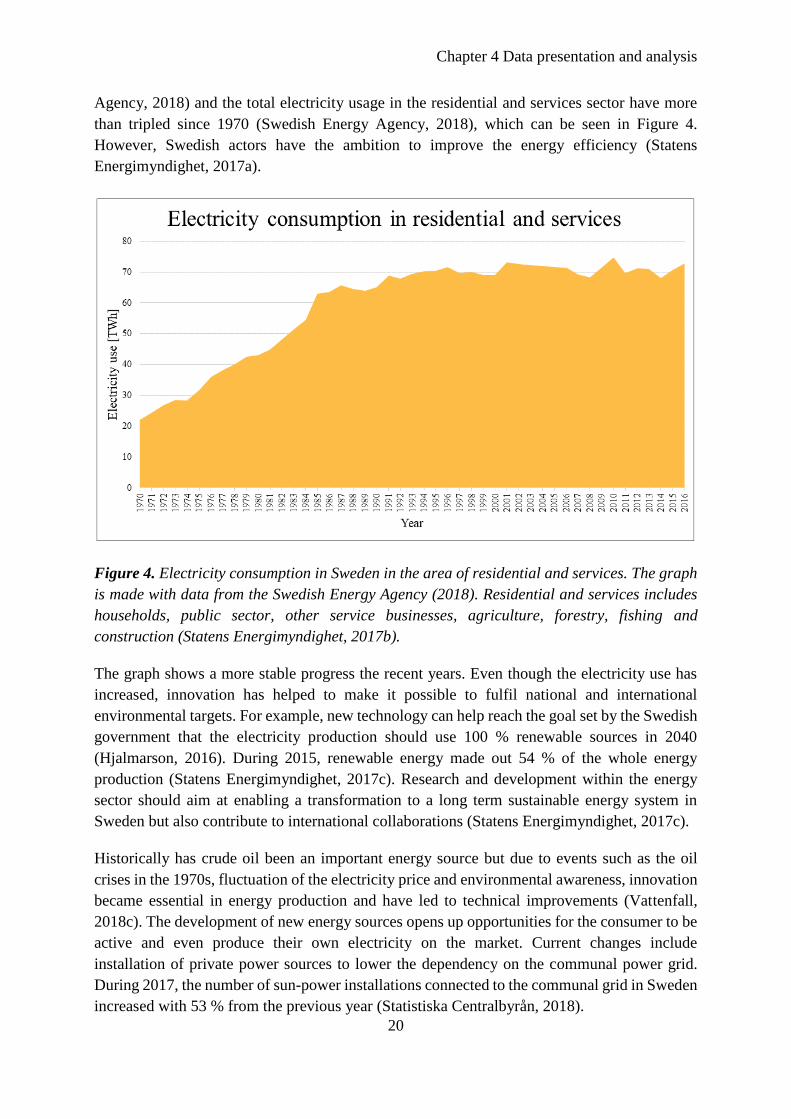
Agency, 2018) and the total electricity usage in the residential and services sector have more
than tripled since 1970 (Swedish Energy Agency, 2018), which can be seen in Figure 4.
However, Swedish actors have the ambition to improve the energy efficiency (Statens
Energimyndighet, 2017a).
Figure 4. Electricity consumption in Sweden in the area of residential and services. The graph
is made with data from the Swedish Energy Agency (2018). Residential and services includes
households, public sector, other service businesses, agriculture, forestry, fishing and
construction (Statens Energimyndighet, 2017b).
The graph shows a more stable progress the recent years. Even though the electricity use has
increased, innovation has helped to make it possible to fulfil national and international
environmental targets. For example, new technology can help reach the goal set by the Swedish
government that the electricity production should use 100 % renewable sources in 2040
(Hjalmarson, 2016). During 2015, renewable energy made out 54 % of the whole energy
production (Statens Energimyndighet, 2017c). Research and development within the energy
sector should aim at enabling a transformation to a long term sustainable energy system in
Sweden but also contribute to international collaborations (Statens Energimyndighet, 2017c).
Historically has crude oil been an important energy source but due to events such as the oil
crises in the 1970s, fluctuation of the electricity price and environmental awareness, innovation
became essential in energy production and have led to technical improvements (Vattenfall,
2018c). The development of new energy sources opens up opportunities for the consumer to be
active and even produce their own electricity on the market. Current changes include
installation of private power sources to lower the dependency on the communal power grid.
During 2017, the number of sun-power installations connected to the communal grid in Sweden
increased with 53 % from the previous year (Statistiska Centralbyrån, 2018).

Chapter 4 Data presentation and analysis
21
Digital technology makes it further possible to advance the current electrical grid into a so
called “smart grid”. One part of the smart grid are smart electricity meters installed in every
household in Sweden (Regeringskansliet, 2018a). The smart grid will, among other things, give
the consumer further control over their energy consumption (Regeringskansliet, 2018b) and
since 2009 every household in Sweden have a smart electricity meter installed
(Regeringskansliet, 2018c). This can be compared to the EU goal for which at least 80 % of all
electricity meters in the union should be replaced with smart meters before 2020 (European
Commission, 2018).
4.2.2 Company A1
The first of the two companies in the industry of electricity consumption measurements is
Company A1 who sells automated and visualized electricity measurement systems and services
to other companies. Their systems are web based and can lower the customers’ electricity costs.
They aim to decrease the environmental impact and lower the customer’s electricity cost by
providing electricity consumption awareness.
The offering of Company A1 was formulated when students helped a customer understand the
origin and amount of their services' electricity costs. However, it was a venture capital
investment that later made it possible to start the company. They are now operating mainly in
the Nordics but run tests in other European countries as well. At the time for this study,
Company A1 have growth as their main goal and they have received an award for fast growing
business.
To administrate and build their business model, Company A1 use the BMC. During the last
year, the business model have been looked through and updated when changes have occurred,
such as when higher positions were created or replaced. Interviewee A1 points to the
importance in continuing to update or tweak the business model regularly in order to move
forward, since the business model age quickly and have to continuously adapt to new
competitors and new technology on the market. Company A1 continuously has to reevaluate
their value proposition, partnerships and customer segments and they prioritize to analyze the
competitors in order to improve the own service.
4.2.3 Company A2
The second investigated company in Industry A, Company A2, provides a visualization of
households’ electricity consumption though a smartphone application. They provide
improvement suggestions in order for the residents to lower both their electricity cost and
environmental impact.
The initial idea behind Company A2 was incorporated by students with the aim to lower energy
consumption in households by providing an easy to use service to measure electricity usage.
The founders wanted to change the electricity market and later also promote investments in
renewable energy sources.

Chapter 4 Data presentation and analysis
22
Company A2 use the BMC when developing their business model, but trial and error on the
market are used to confirm what works or not. The biggest change in their business model
happened when the strategy changed from B2B to B2C. Smaller changes have however
occurred when new employees joined the company as well as when angel investors joined the
company board. Their offering is affected by demand and interests on the market. For example,
producing electricity through renewable energy sources such as solar panels have been a trend
during the recent years and Company A2 has therefore made it possible for their customers to
evaluate their house’s suitability for installing solar panels and get cost quotations from
providers.
4.2.4 Within Industry A analysis
This section presents the within analysis of Industry A, as described in section 3.3 Comparative
study framework and data structure, where the business models of Company A1 and Company
A2 are analyzed according to trends, competition, BMC components and future plans.
Trends and competition in the industry
Environmental awareness and a sustainable lifestyle are trends that can be causing a rise in
demand of measurement tools for energy and electricity usage in the market. It is becoming
possible to see and lower the energy consumption with easy measures available through
technological development.
The largest competition for the investigated companies in the industry of electricity
consumption measurements are electricity providers who have been developing their own
services for measuring the users’ consumption. Company A1 do not have many direct
competitors who both collect and analyze the consumed electricity. There are for example the
large established firms with small departments who visualize electricity data and a growing
amount of start-ups who compete as well. Interviewee A1 argues that the market have indirect
competitors since the customer can find the same product from other actors but in that case they
have to find two separate systems to cover the functionality of Company A1’s service.
Company A2 on the other hand saw other start-ups as the main competition in the beginning
but are now competing with the electricity providers’ services as well which are becoming more
available and developed.
Since the electricity providers’ main purpose is not to visualize but to provide and charge for
the electricity, their own services for measuring and visualizing consumption might not be a
priority and therefore not as good as the services of Company A1 and Company A2.
Furthermore, Company A1 and Company A2 are new entrants who are challenging established
actors on the market. As the literature survey showed, competition increase innovation which
is the case in the market of electricity measurements. Since the electricity providers in many
cases are established companies with a large customer base and resources, they have the
possibility to be innovative and release new solutions.

Chapter 4 Data presentation and analysis
23
Value proposition
Both Company A1 and Company A2 want to visualize and help to lower the customers’
electricity consumption as their main value. Besides this, Company A1 provide their customers
with tailored solutions and fast results. Even though the process of selling a product have
changed during the company’s lifetime, the value proposition has stayed similar and only small
adjustments have been made to it when the products got new features.
According to Interviewee A2, the value proposition itself and matching it to the customer needs
are as of today the most important part of Company A2’s business model. Besides wanting to
visualize and lower the customers’ electricity usage, Company A2 want to offer an easy to use
service and help them towards using more environmentally friendly energy sources. For
example by facilitating for a customer who is considering installing solar panels. In addition to
this, their aim is to innovate by for example analyzing the data in order to plan electricity
consumption according to current prices and habits in the user’s home.
The value proposition for Company A1 and Company A2 are similar. They are both visualizing
the electricity usage but they differs in the offered additional services. While Company A1 are
focusing on collecting and analyzing the data, Company A2’s value proposition includes
providing optional offers that, for example, can help the customer become more sustainable.
Customer segment
Company A1 have a B2B strategy and their customers are mainly owners of property, hotels
and retail premises. Company A2 on the other hand have a B2C strategy and focus on
homeowners and mainly house owners. Since the strategies are different it is no surprise that
the customers are different as well. However, they both compete with the electricity providing
companies despite the separated customer segments.
Company A2’s service is as many digital platforms built on users. Since it lets the customer
compare their electricity usage with other customer’s usage, the service becomes more
attractive with a higher number of users. Since no one wants to join an empty community, the
most successful platforms connect users (Edelman, 2015). Therefore, it was important for
Company A2 to find customers interested in the service’s opportunities from the beginning.
Customer relationships
A difference between the companies is the personal or passive contact they have with the
customers. Company A1 has more personal contact with their customers and they exchange
knowledge which both builds and deepens loyalty as well as increases the understanding of the
customers’ needs and demands. Company A1’s first customer is still using the service and is
important in terms of feedback and technical requirements. Company A2 on the other hand
have a passive relationship with their customers and contact is held mainly through the app,
since the needs of Company A2’s customers do not require a personal relationship.

Chapter 4 Data presentation and analysis
24
Even though the customer relationships differ, both companies value feedback and try to collect
as much of it as possible through for example surveys. Company A2 have also created personas
of real users in order to evaluate and improve the service according to their interests and habits.
Channels
The channels that Company A1 and Company A2 use are different, both between the channel
itself and also to what purpose it is used. The two main purposes of channels that have been
identified for both companies are to contact existing and to reach new customers. To contact
existing customers, Company A1 use their website and phone calls. Reaching households
through phone calls would however be a lot of work for Company A2 and instead, they use
their app and e-mail to keep contact with existing customers. To reach out to new customers,
Company A1 use direct sales with a salesperson and they are also visible at events and fairs.
Furthermore, both companies use social media to be visible. The next step for Company A1 in
order to reach new customers is to further develop partner or agent sales. Company A2 reach
new customers through their partners with whom they can promote their business.
As described, the companies use different methods to keep contact with their customers and
this could be explain by their B2B or B2C strategy. For example, business customers may be
more open to phone sales than consumers and they would not search for and buy an expensive
solution for electricity measurements though an app-store, which a consumer could be more
inclined to do.
The price of the product could also be affecting the way to best get in contact with new
customers. The service Company A2 provide in their app is free for the customer while
Company A1 charge for their service. While an app is free of charge and available for anyone
in an app-store, without much of an investment for the customer, the solutions Company A1
provides needs more salesmanship in order to convince the business customer to try it.
Revenue streams
The main revenue stream for Company A1 comes from the product which consists of a setup
cost and a leasing cost. The price differs depending on the software solution and is adjusted to
the market. Company A2 on the other hand does not get revenue from their customers the same
way Company A1 does. Their revenue stream changed when they went from B2B, where they
sold their platform to other businesses, to B2C, providing a service free of charge directly to
the consumers. The largest revenue stream now comes from an arrangement with providers of
solar panels.
The contrasting strategies and customer segments can be a cause for the different revenue
streams. Whilst Company A1 works in, what can be seen as, a more traditional way (selling a
product or service for money), Company A2 offers a free service which is shown to extract a
positive effect for the users (Hüttel, 2018). Another aspect that can cause this difference is the
value propositions, which for Company A1 is more focused on the customer saving money
while it for Company A2 is more focused on the customer’s environmental impact.
Chapter 4 Data presentation and analysis
25
Nevertheless, one similarity between the two companies is that the revenue streams comes from
other businesses. Company A2’s revenue comes from the solar panel providers who buys
information from the users. Further development of revenue streams can be explored through
revenue model innovation.
However, as mentioned by Interviewee A1 and Interviewee A2 respectively, neither of the two
companies are profitable. Company A1 have increased their revenue but they have also
increased their costs and the balance have therefore always been close to zero. Furthermore,
Company A1 is believed to have a more stable revenue stream with regular customers than
Company A2 has, since they cannot ensure to what extent the customers will want cost
quotations on solar panels. Even though Company A1 have investors they might be closer to
do business without external financial help than Company A2 are. Since Company A2 never
had a profit, they are still dependent on investors to be able to expand their business. However,
this is speculations based on the collected data.
Key activities
Key activities for both Company A1 and Company A2 are development of their software and
service, collection of the electricity data with warrants from the customer to the electricity
provider, analysis of the collected data and visualization of the results. However, while
Company A1 puts more focus on analyzing the data and giving their customer fast results,
Company A2 have valued customer acquisition. Customer acquisition is of course important
for all companies but since Company A2 work B2C instead of B2B, it can be argued that it is
more difficult for them to reach new customers and their marketing strategies are therefore
different as well. Marketing and customer acquisition can be done through partnerships where
Company A2 can reach out to both new and existing customers.
Both companies gather feedback from the customers which they use in order to improve their
services. However, while Company A1 have a more interactive relationship with their
customers, Company A2 do not have the same sense of what each customer want since they do
not have personal contact with each and every one of them. This is consistent with the literature
that suggested that B2B companies focus more on activities that are maintaining the customer
relationship and that they are less eager to use social media for this purpose. It can also be seen
that this and many of the other differences in activities can be connected to the B2B or B2C
strategy.
Furthermore, both companies continuously test their products on the market to make sure they
have the potential to be successful. Company A1 want to increase their revenue by three to four
times and to achieve this goal they have to implement a better sales structure. The cycle time
of the current structure is long and the technology needs higher automation for the future.
Meanwhile, the development and refinement of the service is an important activity for Company
A2 which they use customer surveys for. Besides this, they are continuously focusing on
creating a simplified user experience and mediating offers between solar panel providers and
the users.

Chapter 4 Data presentation and analysis
26
According to Interviewee A2, Company A2 have had drawbacks in some activities, such as the
recruitment process and financial planning, which could have been better performed.
Additionally, they could have benefited from a better overall understanding of the connected
business parts and overall accuracy.
Key resources
The smart electricity meters are a prerequisite for both Company A1 and Company A2 and can
be seen as a key resource even though they are not owned by companies themselves. These
smart meters makes it possible to collect the data, which is another key resource required for
their analyses. Moreover, Company A1 need competent personnel to develop and perform their
service. Company A2 need personnel to develop and refine their offering as well, but also to
improve the user experience in their app. Company A2 have also used consultants as an external
personnel resource in different projects.
The key resources of the two companies are similar, they both need electricity data from their
customers and they both need personnel. Both companies also have investors for financial
resources who have been of high importance for the companies’ growth. Some financial
resources for Company A2 have also come from receiving an official grant.
Key partners
The partnerships of Company A1 are constantly developing but the main partners are
manufacturers of hardware, such as electricity meters. These partners can be used for partner
sales and they can partner up to sell their products as complements and a package in order to
give more value to the customer. For Company A2, the partnerships became more important
after the strategic shift to B2C and they now mainly use partners to reach out to new customers.
Company A2 have partnerships with for example magazines that targets house owners, the same
customer segment as themselves. This is a content-marketing partnership which Interviewee
A2 describes as fruitful for both partners since the company provide content to the magazine
which in turn act as a marketing platform for Company A2. Another partnership is with real
estate agencies who can offer the house buyer Company A2’s service as an additional value
which gives Company A2 a new customer.
The main difference between the partnerships is their main purpose. Company A1 use
partnerships to develop their service and create partner sales while Company A2 use them to
attract new customers. Furthermore, Company A2 has an international collaboration with an
American university through an academic partnership with mutual exchange of resources and
knowledge. Company A2 is given the opportunity to more easily expand to the American
market at an early stage of their business while the university gets data for academic research
such as investigating improvements in effective electricity usage.

Chapter 4 Data presentation and analysis
27
Cost structure
The general costs for both companies are development, administration and offices. However,
the costs connected to marketing and sales structure can differ since these can be affected by
the B2B or B2C strategy.
Company A1 is highly dependent on the quality of the building’s electricity meters and it is
possible that their advancements are faster than the smart electricity meters’ development. This
could be a future risk, leading to additional cost since they would either have to expand their
business or push for changes in the development of the infrastructure before they can harvest a
continuous profit.
The cost structures of the two companies are similar and the differences could depend on the
strategy they have and not the product itself.
Future and sustainability
Company A1 aim to fulfill their goal of increasing the revenue in the Nordic countries they are
active in now, especially Sweden, by structuring their sales process and procedure. At the same
time, Company A2 wish for every other household in Sweden to use their service. However,
both companies also wish to expand to international markets in the near future.
Company A1 are doing some tests in other European countries but even though some countries
have a standard similar to Sweden, many of them have insufficient meters installed in buildings
which makes it harder for the companies to expand outside the Nordics. The technology
improvement of the electricity meters will not be an area where Company A1 will push for
change unless it is their customers who need the upgraded meter. Instead, this will fall upon the
electricity provider and the legislation in the respective country.
Company A2 want to expand their operational area as well. Firstly to other Nordic and some
American markets and soon thereafter to other European countries. Interviewee A2 mentions
that an expansion like this will require an increased workforce which in turn will need
organizational changes such as departments for human resources and finance.
Both Company A1 and Company A2 are working with sustainability, especially considering
the services they are offering. They want to lower the customers’ electricity consumption in
order to lower the environmental impact energy usage has on the planet. For example, Company
A2 contribute to the environmental goal of making the electricity production use 100 %
renewable energy sources by helping households install solar panels. However, the companies
do not consider the environmental factors to be enough to call themselves sustainable.
According to Interviewee A1, a company is not sustainable solely because they work with
sustainability in one way or another. Interviewee A1 argues for four perspectives of
sustainability; people, planet, profit and purpose, and Company A1 works with these in their
everyday operations. Interviewee A2 has similar thoughts on a sustainable company and the
employees’ wellbeing are of high importance in Company A2 as well.

Chapter 4 Data presentation and analysis
28
4.3 Industry B
This section introduces Industry B, package deliveries, with statistics on deliveries and
information about the historical and future innovative changes in the industry. Company B1
and Company B2 are then presented, followed by the within analysis of their business models.
4.3.1 The industry of package deliveries
The postal service in Sweden was a monopoly until 1993 but the market of package deliveries
have had more competition (Konkurrensverket, 2018). The largest postal service in Sweden,
PostNord (previously Posten), also delivers packages and have been summarizing previous
year’s statistics regarding e-commerce in Sweden. E-commerce in Sweden has grown from
being 6 % of the total retail in 2012 (Posten et al., 2013) to 8,7 % in 2017 (PostNord et al.,
2018). The customers’ expectations have changed during these years, for example regarding
fast and free delivery which can been seen in Figure 5 below.
Figure 5. Statistics regarding the customers’ expectations for package deliveries (Posten et al.,
2013; PostNord et al., 2014; 2015; 2016; 2017; 2018). Fast delivery is specified to less than
three days in 2012-2014 and one to two days in 2015-2017.
Figure 5 shows that the customer expectations of fast deliveries increased the most between
2014 and 2015. During 2015, the customers began to value the options to choose when, where
and how their ordered product was to be delivered and a greater share of customers started to
request home deliveries on evenings or weekends (PostNord et al., 2016). In 2016, 78 % of the
customers considered the option to choose delivery method to be important (PostNord et al.,
2017). Home deliveries became requested more extensively already in 2013 (PostNord et al.,

Chapter 4 Data presentation and analysis
29
2014) and the amount of companies offering home delivery rose with 10 percentage points
during 2014 (PostNord et al., 2015). The latest edition of the report E-barometern was made on
numbers from 2017 and showed that home delivery on evenings was still rare but continued to
be requested by 11 % of the customers while 4 % requested to collect from a smart box
(PostNord et al., 2018).
The largest logistics companies offering deliveries of packages in Sweden today are PostNord,
DHL, DB Schenker, Bring, UPS and FedEx, among others. They have had to innovate their
sorting and delivery processes as well as their offerings in order to meet the changed customer
habits and demands. The innovation in this industry comes in different forms; from temperature
controlled transportation boxes to automated sorting and calculated routes with artificial
intelligence (AI). The future holds solutions such as drone deliveries, platoon driving and
autonomous deliveries (FedEx, 2018). Start-ups and SMEs in this industry are challenging the
large actors and they are important for innovation and economic growth (FedEx, 2015).
4.3.2 Company B1
Company B1 offers a package delivery service for online retailers where they deliver the
products the consumer orders online. They want to remove so called halfway shopping by
delivering directly to the consumer’s front door. They use AI solutions to optimize the delivery
route in order to minimize the environmental impact and they aim to challenge the large
competitors by creating new trends instead of following the existing ones.
Company B1 works from a B2B2C strategy, meaning their direct customers are the online
retailers and the end users are the retailers’ customers, in other words the consumers. One
challenge this strategy has is to satisfy both the retailers and the consumers.
The founders of Company B1 noted a gap in the industry of deliveries and they decided to
introduce a new service for home deliveries. The initial idea of home deliveries has not changed
and continued as the core business. After exploring deliveries of different goods for a few years,
they decided to focus solely on home deliveries of e-commerce packages. This service had the
best potential to be the main business, since it was appreciated and wanted by both consumers
and retailers but also because the deliveries of other goods took too much focus, energy and
resources compared to their return of investment.
According to Interviewee B1, a business model can basically be seen as a contexture of
operations and commercials and these have to work in symbiosis and constantly challenge each
other in order to be fruitful for the company. Company B1 has not actively chosen to follow
any academic tool but are instead creating their business model from experience. Interviewee
B1 mention a potential pitfall as being too academic and controlled by academic models when
developing the business model. Even though these models, such as the BMC, have strengths,
Interviewee B1 argue that they are often too theoretical for a business.

Chapter 4 Data presentation and analysis
30
4.3.3 Company B2
The second company in Industry B is Company B2 who offers online retailers and consumers
an alternative logistic solution to home delivery and service points. By providing deliveries to
smart boxes at several locations, they make it possible for the consumers to collect their ordered
goods whenever they want, without waiting in line. Company B2 work from a B2B2C strategy
where their direct customer are the online retailer and the end user are the consumer.
The founders of Company B2 noticed problems in the industry and came up with a business
idea including three offerings in the beginning. They then decided to put more focus on one of
these offerings - to deliver goods from the retailer to the consumer - as they noticed that e-
commerce was the most profitable business at that time. However, Interviewee B2 mentions
that the two other offerings are still active and the time put on developing these are not
considered wasted since the resources was balanced to the potential profit.
Company B2 does not use any academic tool, such as the BMC, for developing their business
model. The components of their business model are instead chosen according to what has to be
done in order to reach their goals and the content is created based on decisions they make, not
a documented framework. Even though the vision for Company B2 has been the same from the
beginning, the business model has changed with the focus of the offerings. Furthermore, the
business is affected by the trend of growing e-commerce in this industry, which according to
Interviewee B2 has been, and still is to some point, traditional.
4.3.4 Within Industry B analysis
This section presents the within analysis of Industry B, as described in section 3.3 Comparative
study framework and data structure. The business models of Company B1 and Company B2
are analyzed according to trends, competition, BMC components and future plans.
Trends and competition in the industry
Online shopping is increasing in numbers and volume and both start-ups as well as larger actors
are inspired from this trend. This growing trend can be facilitated by for example extended
delivery possibilities or improved payment services.
There are many strong competitors on the market of deliveries in Swedish today but the
businesses differs between these competitors and the two start-up companies. All of them
deliver packages but differs regarding for example geographical range and delivery type. The
services Company B1 and Company B2 provide are found at the larger companies as well but
since online shopping is a growing trend, there is room for more actors to offer package
deliveries. The customer demand increase and the consumers are not bound to use one single
company since they can change their preferred delivery service from time to time. Therefore,
several actors can compete for the same customers. Interviewee B2 highlights that Company
B2 has been able to expand their business despite the competition from giant logistics
companies and several start-up companies in the industry.

Chapter 4 Data presentation and analysis
31
Company B1 have had two options to challenge the competitors; either they can lower the price
in order to grow in number of deliveries which would lead to faster growth but a less profitable
business, or they can prioritize sales with higher value which will lead to slower growth but a
more profitable business. The focus has shifted between these options over time and it has been
challenging to find the perfect balance between the two.
Value Proposition
Both companies have more or less had the same goal and vision since the beginning and they
aim to facilitate the delivery process, either by delivering to the consumer’s home or to a smart
box. They started out with broader value propositions but limited themselves in order to
increase the quality of their services. Company B2 describes their additional offerings as
development possibilities while Company B1 excluded theirs without having plans of
reinstatement. Interviewee B1 said that their pitfalls range from unnecessary expenses to
development of unsellable products. It can be a pitfall to start out too broad too early as
Company B1 did and they therefore decided to go back to focusing on one single offering in
order to become the best in the field. Interviewee B1 mentioned the importance to choose the
right offering to focus on and the good ideas that are discovered along the way can be tested
and used later when the core business has reached significant market shares. Company B2
started out broad as well. They began with three services but, at that time, chose to focus on
developing one more than the others.
Customer Segments
Both Company B1 and Company B2 work with a B2B2C strategy and the customer segments
are therefore twofold. The closest customer for both companies are online retailers who want
to offer delivery options to their consumers, who are the second customer segment of Company
B1 and Company B2. Company B1 deliver to consumers in the largest cities in Sweden while
Company B2 have both large and middle sized cities in Sweden.
Even though the retailers and consumer are large groups of corporations or individuals, neither
company work with mapping the customers within the segments. With the increase of online
shopping, this might be possible for them to do in order to better target the marketing towards
consumers or find certain needs and development areas. The mapping could be based on the
amount of packages the consumers order, demographics and from what type of store they order
from or where they wish to order from.
Customer relationships
Both Company B1 and Company B2 cooperate with the online retailers in order to reach the
consumers. The retailers benefit from offering the companies’ delivery services to the
consumers and the companies need the retailers in order to conduct their business. However,
Interviewee B2 also considers the retailers to be partners with Company B2 since they have a
contract which benefits both parties.

Chapter 4 Data presentation and analysis
32
The relationship with the consumers is also important for both companies. They collect
feedback from the consumers after the delivery in order to improve and keep a good
relationship. One difference between Company B1 and Company B2 however is the amount of
interaction and personal contact they have with the consumers. Company B1 have some
personal interaction with them through the courier who becomes the company’s representative.
Company B2 on the other hand does merely interact with their consumers face to face since
they deliver the package to a smart box where the consumer can pick it up later.
Channels
The main uses of channels are to reach customers and collect feedback. Company B1 and
Company B2 both reach their consumers through the retailers’ online store. Furthermore, both
companies use social media as a platform for interaction, questions and concerns from
consumers. Other channels are the companies’ websites, e-mail and phone. Interviewee B2
mentions that even though the contact with their consumers is limited, Company B2 value their
feedback.
New retailers are initially reached by contact through phone and e-mail or, in the case of
Company B1, professional social media channels such as LinkedIn. Moreover, Company B1
enters partnerships with the suppliers of the e-commerce platforms which give them the
possibility to providing their delivery option in the integrated system the retailers use. Company
B2 does not engage in any similar partnership with e-commerce platforms, and they use their
other channels to contact new retailers.
Interviewee B2 mentions that large retailers, which Company B2 has, can help them to be
recognized among new retailers who wants to offer the same delivery service to their consumers
as their competitors does. Potential new online retailers can contact Company B2 if they wish
to integrate the service in their online shop.
Both companies have similar ways to get in touch with retailers and consumers. They value
social media and rating systems in order to gain valuable feedback which they can use to
improve. The rating systems are growing in popularity on the Internet and the user reviews can
be a compelling factor for new retailers and consumers who consider trying the service.
Revenue streams
The primary revenue stream for Company B1 are the income from online retailers who pay to
be able to offer Company B1’s service to the consumers. The retailers are charged based on the
weight by volume on their packages since this is the factor deciding how many packages a
delivery truck can be loaded with. However, even though many consumers expect free
deliveries, as seen in Figure 5, the retailers sometimes do not offer the delivery for free and in
that case the consumer pays. Either way, the consumer can always choose to pay extra for
additional services such as adjusting the estimated time of delivery.

Chapter 4 Data presentation and analysis
33
Company B2 also gets paid from online retailers but per package they deliver and the delivery
is free of charge for the consumer. Their revenue is growing rapidly and even though they still
handle small volumes, they predict a continuous growth for the next couple of years.
Interviewee B2 mentions that it was important for Company B2 to put the optimal price on the
product in order to successfully acquire their first customer. They did so by researching the
market to adapt their pricing accordingly.
Interviewee B1 and Interviewee B2 both argue that it is less expensive to deliver several
packages to a service point in one location then it is to deliver one package to each home in
several locations. This can be a cause for Company B1 and Company B2’s different pricing
models. Company B2’s smart boxes with its fixed dimensions has a limited volume while
Company B1 are not as limited by the volume, even though they still have limitations for what
the couriers can carry and what the sorting terminals can handle. However, it becomes more
expensive to deliver a larger weight by volume since the fuel consumption increases, which is
why Company B1 charges based on this parameter. Furthermore, the consumer generally have
higher expectations on Company B1’ service since it is more expensive than other delivery
methods. They therefore have to enhance their service by for example offering fast deliveries.
Key activities
In order to perform and deliver the value proposition, key activities for Company B1 are the
collecting, sorting and delivering packages. To be able to optimize the route for delivery, they
manage their own terminals where the packages are sorted and loaded into the delivery trucks.
Key activities for Company B2 are collecting, sorting and delivering packages as well.
However, there are differences between the delivery processes of the two companies since
Company B1 delivers to each consumer’s home while Company B2 delivers to their smart
boxes.
Other key activities for Company B2 today are within operations; to do what is necessary to
deliver on time and to improve internal processes. Other key activities are those that will make
the company grow in volume as well as create satisfaction with the retailers, consumers and
partners. For example, Company B2 have a dialogue with the owners of the locations in which
the smart boxes are located. Together, they are currently looking into possible expansions by
increasing the size of the smart boxes. Furthermore, in order to increase the number of retailers
and expand the business according to plans, Company B2 need to improve recruitment and
sales processes but also have processes for handling all operational processes. One example of
improving these processes is to optimize the collecting of packages from the retailers’
inventories which locations are spread out.
Furthermore, system development and marketing for expansion are important activities for
start-ups such as Company B1 and Company B2. Company B1 have a more scaled system
development where they optimize the service while Company B2 do not need the same
optimization of routes since they deliver to the same specific locations. Additionally, the labeled
smart boxes located in stores and malls provides cheap marketing.

Chapter 4 Data presentation and analysis
34
Another key activity for both companies regards feedback. Company B1 provides the drivers
with feedback about the transportation while the retailers get a delivery report each day about
previous day’s deliveries. This report contains information about the deliveries and consumer
encounters as well as the consumers’ satisfaction. Company B2 work with feedback as well, to
the retailers and from consumers, and a bad review from a consumer will be followed up in
order to improve their service. Comparing the two companies, it is found that the feedback
Company B1 collect from their consumers can get more personal since they are integrating face
to face when delivering. Even though Company B2 do not have personal contact they still
receive valuable feedback they can use to improve the customer experience.
One of the most vital processes in the development of Company B1’s offering has been, and
still is, trial and error. It has been important to dare to try, as well as abort an inadequate idea
before large investments are done. In other words, opportunities can be missed by not testing
the ideas and too much resources risk getting invested before finding out if it will fail once it
reaches the market. Interviewee B1 says that the most valuable ideas have to be found and
captured, which is why trial and error is common in many companies creating new offerings.
Both Company B1 and Company B2 used trial and error in the beginning to create a good
service and saw that e-commerce deliveries were the most successful one. However, they were
still able to use previous ideas in order to develop their offering. It can be concluded that all
activities in the two companies are relevant and they both focus on activities that bring value to
the customers, both now and in the future.
Key Resources
Key resources for the companies in order to deliver the packages are cars, couriers and the
terminals where the packages are sorted before delivery. The main difference between the
companies’ physical resources are Company B2’s smart boxes, which Company B1 does not
possess. What is noticeable is that both companies have to have software and developers in
order to conduct their business. Developers and IT-equipment are important for Company B1
since the optimization and planning of routes makes Company B1 unique. Company B2 on the
other hand use these resources for developing the software in their smart boxes.
The resources are highly relevant to both companies and the business would suffer if any of
them was removed. Even the premises for terminals and offices are important resources which
makes it possible for the companies to conduct business. In addition, both companies have
received financial aid from investors.
Key Partners
Company B1 work with partners in several ways and important partners are for example the e-
commerce platforms the retailers use for their online stores. Through these platforms, Company
B1 can reach retailers by partner sales. Another partner is third party logistics (3PL), companies
who are external actors and outsourcing partners for logistics, to which the online retailers can
outsource their logistics such as inbound delivery, picking and packing. Through this
partnership, the 3PL can offer a complete solution for the retailer and Company B1 gets more
Chapter 4 Data presentation and analysis
35
customers. The last type of partnership are the operational partnerships with haulage contractors
who act as couriers for Company B1. The next step is to reach out to external couriers for part
time employment in addition to the haulage contractors.
Company B2 also use haulage contractors to pick-up and deliver packages. Furthermore, all
their online retailers are considered to be not only customers but also partners, according to
Interviewee B2. In addition to these, key partners are the owners of the premises where the
smart boxes are located, such as stores and malls, who get value from attracting people to the
area.
Another partnership Company B2 has is the cooperation with a competing logistics company.
When a consumer who lives close to a smart box orders an international package and the logistic
company who freight it to Sweden is a partner with Company B2, the consumer will get the
option to collect it from a smart box instead of getting a standard delivery. Company B2 will
then collect the package from the logistic company and deliver it to one of their smart boxes.
This kind of partnership would not be suited for Company B1 since it would not provide more
value to the consumer. However, international partnerships might still be beneficial for
Company B1 in other ways.
The partnerships of Company B1 and Company B2 are similar yet different. Company B2 has
more control over the operationalization, while Company B1 has more cooperation within the
operationalization. The companies’ future partnerships would most likely be connected to
expanding the customer base and operative actions. Company B2 might consider partnerships
for the different uses of their smart boxes.
Cost structure
Some of the general costs for Company B1 and Company B2 comes from the delivery process,
including cars and couriers, as well as their storage and sorting terminals with equipment. As
mentioned in the descriptions of the companies’ revenue streams, it can be cheaper to deliver
to smart boxes and service points than to the consumers’ homes since it is possible to finish
more deliveries within the same time. Other costs are connected to offices as well as the
continuous development of the software and service. Future costs can be connected to
marketing of extended offers.
Future and sustainability
Both Company B1 and Company B2 have ambitions to grow and expand to additional cities in
Sweden and become profitable, but Interviewee B1 can see an international expansion not too
far ahead as well. When Company B1 have become profitable nationally, they may begin to
expand city-by-city in other countries. In order to have the potential to become a leading
company offering home deliveries, Company B1 cannot risk getting too expensive which is one
reason for them to only expand to larger cities where it is possible to optimize the route.
Chapter 4 Data presentation and analysis
36
Interviewee B2 on the other hand does not see the same international expansion for Company
B2. Their near future involves expanding the business to additional cities in Sweden and
opening up new terminals for sorting and loading of overnight deliveries. In order to realize
their expansion plans, Interviewee B2 describes their need for more personnel. The challenges
for Company B2 so far have been to recruit the right personnel at the right time, improve
processes as the volumes increase and to have sufficient offices and terminals.
The future plans for Company B1 and Company B2 also differs regarding their potential
offerings. Company B1 does, at the time of this study, not have any plans of extending their
offering from e-commerce in the current market. Company B2 on the other hand are at the
moment looking into implementation of further offerings to extend the usage of their smart
boxes. Consumers will then be able to send packages as well as manage transfers with the help
of the smart boxes. Within the next couple of years, Company B2 wish to have more smart
boxes, more customers and handle bigger volumes. Since the delivery service is free of charge
for the consumer today, they have to evaluate how the extended services will be priced.
Depending on future development, Company B2 might separate the business and look
separately at transportation and the smart boxes. This will depend on possible future
partnerships in the two areas. The future will also hold new and novel developed technology
which can make it possible for both companies to have faster and more optimized deliveries.
Company B1 hope that within ten years be able to use new technologies for deliveries in order
to improve both the price and the environmentally impact. In the meantime they have reduced
their impact by optimizing routes and climate compensate the distance driven, which they will
continue to do until all transportation can be emission free. Interviewee B2 describes the fuel
alternatives to be limited but Company B2’s trucks run on environmental diesel and aim to be
loaded to full capacity in order to be efficient. The trucks will in the future be completely
electrified for more sustainable deliveries. Company B2 also see autonomous vehicles as a
possibility to lower the environmental impact in intercity transportations. In addition to the
trucks, Company B2 use bike deliveries. Company B1 on the other hand do not use bikes since
they cover large geographical areas and have to leave the loaded bike unattended each time they
deliver to the consumer’s door.
One challenge for the companies is to make their transportations sustainable in order to become
a more sustainable option for deliveries. Both companies are working with sustainability
parallel to the value they add to the industry but their work in sustainability are regarded relative
the industry since neither driving trucks running on fossil fuels nor unnecessary consumption
of products are environmental friendly opportunities.
The definitions of sustainability vary and according to Interviewee B1, a sustainable solution
has to be affordable. An environmental friendly solution that is too expensive for users is not
sustainable. Since Company B1 does not develop any new technologies themselves they cannot
be proactive in the development process. However, they watch the market for the latest
solutions and aim to be reactive and early adopters of technologies that contribute to better
environment, both globally and inside the company. For example, they are preparing systems

Chapter 4 Data presentation and analysis
37
and interfaces for new sustainable solutions and they work with optimizing the use of the
available technologies.
According to Interviewee B2, sustainability is to deliver a service you are able to affect.
Consumption will never be sustainable but the service Company B2 offer contribute to lowering
the environmental impact of deliveries, since it is better for the environment to deliver many
packages to one location where the consumer can collect it from a smart box than it is for a
truck to drive to all consumers’ home in separate locations.
4.4 Between Industry A and Industry B analysis
This section presents the between analysis, as described in section 3.3 Comparative study
framework and data structure, where Industry A and Industry B are compared by patterns found
in the within analyses.
4.4.1 Trends and competition in the industry
Both Industry A and Industry B have established firms in the lead, such as large electricity
providers and package delivery companies, who are or have been governmentally owned and
who the small start-ups now have to compete with. The companies within Industry A do not
compete with each other since they target different customer segments but Company B1 and
Company B2 on the other hand do compete.
Market trends change and create new demands, with which the innovative start-up companies
can challenge the established actors. Both industries have similar competition in their markets
and, as mentioned, innovation is a contributing factor for competition even though it is not
always possible to see the innovative solutions. For example, Company B1 and Company B2
use a variety of technical solutions in order to speed up the delivery process while the companies
in Industry A innovate with their software applications for analyzing the data.
4.4.2 Value proposition
All companies’ initial value propositions are to some extent still used in their current value
propositions. The main difference between each industry’s value propositions is the time frame.
The companies in Industry A continuously create value while the value of the companies in
Industry B is temporary. Company A1 and Company A2 need to have a longer time frame than
the companies in Industry B since helping the customer to become environmentally friendly
and lower their electricity costs and consumption cannot be done immediately. Company B1
and Company B2 bring long term value to the retailers since they continuously bring value to
many consumers. On the other hand, they bring short term value to the consumer and the
consumer would not get any additional value from a longer relationship. The value Company
B1 and Company B2 bring could be considered to be long lasting in an environmental aspect if
their processes are more environmentally friendly than competitors and therefore improve
Chapter 4 Data presentation and analysis
38
Industry B’s environmental impact. A sustainable option in transportation can make
environmental friendly consumers return.
4.4.3 Customer segments
The origins of the industries’ customer segments are similar since both come from market
trends; having a sustainable lifestyle and increasing online shopping. However, the actual
customer segments differs between the two industries; the companies in Industry A mainly
focus on one specific customer segment while the companies in Industry B focus on two broad
customer segments. Furthermore, industry observations shows that B2B2C is a common
strategy used in the industry of package deliveries, since it seldom is the retailer who deliver
themselves.
4.4.4 Customer relationships
The companies in Industry A have more loyal customers who use their service continuously.
The retailers and consumers to the companies in Industry B however does not necessary stay
loyal for a long period of time or to one single company at a time. Since the value provided in
each industry is either long term or short term, the loyalty of the consumers follows the same
pattern. For example, the consumers in Industry B can use different delivery companies for
each online order they place and they are not bound to use only one or the same one multiple
times. The retailers does in most cases provide their customers with several delivery options
and are not obligated to only offer the delivery service of one company alone. Therefore,
Company B1 and Company B2 have to make sure that the retailers and consumers get more
value from their service compared to the competitors’. Since the cooperation with retailers
provides both parties with value, it is of relevance to observe this relationship as a partnership,
just like Company B2 considers their retailers as partners more than customers.
Generally, the contact with the business customers is in both industries active and personal
while the contact with the consumers is more passive. Customer relations are valued in both
industries and all the companies work with feedback in order to improve and take care of the
customers. The literature suggested that B2B2C companies use reviews and ratings more than
both B2B and B2C companies, however this could not be verified in this study since it would
require measurements and larger samples.
4.4.5 Channels
The channels are similar for all companies in both Industry A and Industry B but they differ
regarding which channel is used for what purpose and to what extent. The companies in both
industries use websites, e-mail and phone calls to reach out to customers but social media and
partners are used as well. Social media are more widely used as a channel to target consumers
than other businesses.
Chapter 4 Data presentation and analysis
39
Existing customers are mainly reached through the website and e-mail in both industries and
sometimes, for Company A1 and the retailers in Industry B, through phone. This shows that the
more traditional channels are exchanged for social media when targeting consumers. For
example, the companies in Industry B use social media frequently when collecting reviews and
ratings from the consumers.
The partners can be used as channels since they can reach both new and existing customers. A
pattern can be seen in Industry A that partnerships and partner sales can be used to reach new
customers. In Industry B however, partnerships with e-commerce platforms are used to target
the retailers but not the consumers. Instead, Company B1 and Company B2 mainly use the
retailers to reach new consumers.
4.4.6 Revenue streams
Similarities are found between the revenue streams of the four companies and they all get
revenue from other businesses no matter who the end user is. Company A1 get revenue from
their business customers, Company A2 get revenue from their partners and the companies in
Industry B get their main revenue from the retailers. Furthermore, neither of the companies in
the two industries are profitable but since they are all start-up companies, this result was
expected. The revenue is instead reinvested in order to expand and explore the business.
4.4.7 Key activities
It was clear from the interviews that all key activities are necessary and have a clear purpose
aligned with performing the service or expanding the business. The main activities, such as
collecting data and delivering packages, are specific to the industry and therefore the industries
does not share many similarities. However, the continuous activities of development, testing
and collecting of feedback are important for all four companies since these activities makes it
easier for the start-ups to get a competitive advantage. Information becomes more available and
it is therefore easier for customers to compare options, rate the used products and switch product
if they are dissatisfied. Good ratings and feedback from the customers can therefore be crucial
for the company to keep customers and maintain a competitive advantage.
4.4.8 Key resources
The used resources are highly relevant to both industries but the companies in Industry B have
a greater need for physical resources, for example sorting terminals and cars. However, all
companies are dependent on resources they do not own, such as the smart meters, haulage
contractors or the retailers’ inventories, as well as financial resources from investors and in
some cases consultants.
Personnel is important to all companies and developers seem to be demanded in both industries.
All personnel, and especially developers, are needed to increase innovation and technological
developments which are advancing fast. Companies risk falling behind if they do not keep up

Chapter 4 Data presentation and analysis
40
with the changes. Furthermore, it takes resources such as developers and time to innovate an
industry.
4.4.9 Key partners
One difference between the industries is how they define partners. A partner in Industry A is a
strategic choice to help sales while Industry B define partners as a strategic choice as well as a
customer. The differences between the partnerships of the companies in Industry A can be
connected to the strategy but both of them reach new customers through partners, either by
partner sales or content-marketing. The companies in Industry B both have a B2B2C strategy
and possible partnerships range from improving customer satisfaction to operational processes.
4.4.10 Cost structure
The investigated companies have similar costs structure and all companies have costs for
personnel, offices and software development. The main difference between the industries is that
the companies in Industry B have costs from physical resources connected to the delivery
process while Company A1 and Company A2 do not have any corresponding costs.
4.4.11 Future and sustainability
The companies in Industry A want to expand outside of Sweden. They are both already
operating internationally to some extent but have plans to reach more markets in the upcoming
years. The companies in Industry B have ambitions to expand as well but on a national level
for the near future. They want to expand to more cities and become profitable in Sweden before
going international.
There are several possible reasons for the different ambitions of expansion between the
companies in the two industries. Since Company B1 and Company B2 need physical resources
for their service, costs and logistical issues can arise and obstruct an international expansion.
Company A1 and Company A2 on the other hand do not have a physical product and are able
to distribute their services through the Internet. However, the distribution of the service can still
be limited and it is therefore advantageous to have personnel locally to observe and understand
the new regulations, society and environment.
All four companies have long term sustainability goals. The companies in Industry A can help
fulfil national and European environmental goals with their services. Both Company B1 and
Company B2 are working with lowering their fuel consumption and planning the shortest
delivery routes in order to become the best environmental option for delivering online ordered
goods and at the same time improve the transportation industry.
Industry A have an extended view on sustainability compared to the companies in Industry B.
However, neither Company A1 nor Company A2 see their service as sustainable solely because
of the services’ environmental focus. They also include aspects regarding the personnel’s health
and wellbeing in order to work more sustainable.

Chapter 4 Data presentation and analysis
41
4.5 Chapter summary
This chapter presents the two investigated industries and four investigated start-up companies
before the analyses are conducted. The first analysis compares the business models of the two
companies in Industry A and it is found that trends regarding the environment and innovation
affects both the industry and its’ competitors. The second analysis compares the business
models of the two companies in Industry B and here, trends regarding online shopping are found
to affect the industry. The third analysis compares the two industries and both differences and
similarities are found. It is found that both companies in Industry A use BMC when developing
their business model while neither company in Industry B uses an academic tool. Furthermore,
the company’s strategy affect many of the components in the business model. The B2B or B2C
strategies of Company A1 and Company A2 adapts to one customer while the B2B2C strategy
used by the companies in Industry B adapts to two.

Chapter 4 Data presentation and analysis
42

Chapter 5 Discussion
43
5 Discussion
This chapter discuss the results of the analysis and connects the findings to the Commissioner
and other emerging start-up companies.
5.1 BMC and the analyses
Even though this study use the BMC as a tool to structure the data for the analyses, not all
investigated companies use this tool to develop their business models. This lead to only minor
obstacles in sorting the data since most information relevant for the business can be fitted into
the BMC components. Moreover, a pattern is noticed regarding when the companies used BMC
or not. Both companies in Industry A was founded by students which could be one reason for
them to work more academically and structure their business model according to the BMC.
Neither of the companies in Industry B used the BMC to develop their business model, and it
is noticed that these companies was founded by entrepreneurs from the business world who had
experience from previous jobs. It is however possible that the BMC components are utilized in
the business model of these companies as well, even though it is not structured according to the
academic model specifically. Furthermore, Interviewee A1 argues that BMC is a standardized
and explicit tool, and that this model is used by “everyone” in order to get an overview of what
the company does. The researchers of this study argues against this statement since it is found
not every company actively work according to the BMC, or other academic models, but still
succeeds. It is still worth mentioning that the sample of investigation is limited and the
statement by Interviewee A1 can therefore still be correct in most cases.
The business model should be a clear and pragmatic internal document and not a beautification
of the business in the form of an advertisement. However, the tool for developing the business
model do not have to be used too strictly and a company can alter their business model in order
to excel.
5.1.1 Development and market adaption of the offering
The companies in Industry A and Industry B all have competitors in their fields. Competition
has, as described in chapter 2 Literature survey, a positive effect on the number of innovation
activities and there is causality between the product-market competition and the productivity
growth. The level of competition in Industry B does for example encourage innovative solutions
and fast deliveries but it is uncertain whether it is the changed consumer habits, the innovation
from actors in the field or other reasons that changed the traditional market of deliveries. In
difference to Industry B, the innovation in Industry A is driven by increased environmental
awareness which is further increased by governmental regulations, media attention and
scientific research. The awareness of environmental problems is constantly spoken of and
inspires people to change habits as well as encourages companies to take environmental

Chapter 5 Discussion
44
initiatives. Parallel to this, technological developments build trends such as smart homes or
smart offices which inspire further technical applications in homes and office buildings.
The approach of the Commissioner is a bit different. Instead of following changed consumer
habits, they identified a local and global problem which led to their aim of improving the use
of resources, more specifically water resources. This is also connected to the environmental
awareness trend. Many societies share negative consumption habits but it is not a noticeable or
well-known problem in Sweden, since water always comes through the faucet. Instead, the
water consumption is often highlighted for the environmental impact perspective instead of a
waste of resources. The Commissioner’s service will not replace one on the existing market but
instead target a new customer segment. The market they are entering is highly traditional in the
sense that it is controlled by the municipalities and has not undergone radical changes. One
example of another traditional market is Industry B in which one governmentally owned actor
in postal services had monopoly for a long time and first when the monopoly ended could new
actors enter the market and create competition. Other start-up companies can be compared to
the same conditions where they can enter a market without much visible innovation activity and
with room for competition. Even when the postal monopoly ended, the governmentally owned
actor had the advantage of already possessing large market shares and they could easily conduct
business even with package deliveries.
All of the investigated start-ups have a valuable purpose, whether it is to improve the
environmental impact or facilitate everyday lives, which can be connected to the market needs.
The value propositions in Industry B are highly connected to the changed consumer habits but
are not necessary new since both home deliveries and smart boxes existed earlier. However,
home deliveries can perhaps be easier and more affordable now, not to mention with improved
environmental impact, since the delivery routes are well calculated and climate compensated.
The smart boxes are accessible and they improve the alternatives for the customer to pick up
the package at a service point with limited working hours. Since the customers of the
investigated companies in Industry B could be considered to pick Company B1 and Company
B2’s services over other actors’, the companies have successfully matched the other actors’
value propositions while improving their own. Through this, they get a competitive advantage,
as the literature suggested they would do.
The value propositions in Industry A are connected to change as well, but the change is perhaps
not customer habits as much as market trends and environmental awareness together with the
digitalization of homes. Company A2 creates value together with the customers by comparing
their usage to other customers’. Many digital platforms have this approach since the service
becomes more attractive if users can see that others use it, and in this case compare their statistic
to others’.
A value proposition does not have to be a result of a market trend but it needs to be beneficial
for the customer. For example, the Commissioner aims to minimize the waste of resources by
helping people become aware of their water consumption and inspiring them to lower both their
usage and, as a consequence, their costs. A good value proposition is key to a successful
Chapter 5 Discussion
45
business and time should be spent on this BMC component. Since the value proposition does
not come as a response more than a result, they might have to create a strategy to convince the
customers to understand the value and buy the product.
5.1.2 Customer segmentation and relationships
The Commissioner is in the first, embryonic, or second, product or prototype, stage depending
on which author’s description is used. No matter the stage’s name, they are focusing on the
product development, the product’s value and customer acquisition. They will have a similar
strategy as the investigated companies in Industry B where their customer and the end user in
some cases will be different segments. Therefore, the value proposition has to target two
customer segments at the same time. The paying customer and the end user need separate
strategies for, for example, communication and revenue streams. The investigated companies
have changed their initial customer segments and narrowed them down when they noticed
which one were more profitable to focus on. Emerging start-ups should also analyze each
segment’s possibilities before narrowing them down to the one with most potential. Differences
in customer needs and demands should be included in for example the customer relationship
analysis.
There are many possible ways to perform the segmentation and contact each segment but it can
be difficult to know which way would be optimal. Although the analyses show that business
customers are more often contacted through phone or e-mail while consumers are more often
contacted through apps or social media, it is not investigated which channel would be best
suited. It is noticed however that technological developments have opened up new channels for
the companies to use; such as social CRM which includes social media. Besides acting as a
platform for two-way communication, the companies can use Internet to find customer needs
but the technology also makes it possible for customers to find information about the
companies, as well as competitors. The customer relationship is therefore affected by the
channels through which the customers are contacted.
Furthermore, the analyses show that the customer relationship is most likely affected by who
the paying customer is and which relation they desire or need. A company’s relationship with
non-paying customers is more passive and the disadvantages of this kind of relationship is that
the companies can have dissatisfied customers without realizing it. All the investigated
companies value customer opinions and collect feedback, but in order to communicate with the
dissatisfied customers they need available channels such as social media platforms or a
functional own website. Badly designed channels can aggravate for the customer to give
feedback which can lead to a ceased relationship. Start-ups should therefore choose appropriate
channels through which communication can be conducted both to and from the customer. For
example, the used social media platforms as well as the company’s own website should include
a clear description of the product, how it is acquired and how interested investors and customers
can contact them.

Chapter 5 Discussion
46
5.1.3 Operations to realize the business model
To realize the business model, operations including for example resources and activities have
to be connected to their costs and revenue streams. All activities the start-ups perform are key
in the business development. Even though some actions or choices of path can be considered a
waste of time at the moment, the trial and error approach is important for building a successful
business. This approach is a way to modify the business model, which is a characteristic
associated with business survival according to Jabłonski and Jabłonski and mentioned in
chapter 2 Literature survey. For example, the finance has to be planned and it is important to
evaluate the products’ price on the market, which Company B2 found favorable to do. Start-
ups, such as the Commissioner, should investigate what the customers want and value before
pricing the product in order to optimize the revenue in relation to the costs.
Financial resources include the revenue which should be larger than the costs in order for the
company to be profitable. The revenue streams of the four companies investigated in this study
comes from other businesses but since the investigated sample is small, it is not possible to
draw any conclusion about the positive or negative aspects of having revenue streams mainly
from other business, compared to revenue streams from consumers. However, they have all
successfully entered the market and are currently growing.
The research also find that none of the investigated companies are profitable today. They all
received financial resources from investors and the revenue they now earn from their offering
are reinvested into the company in order to grow. Having investors is common for start-up
companies in general and the investors can be either angel investors or larger companies.
The analyses indicate that physical resources is one of the larger costs in the investigated
companies and based on this assumption could the largest cost of a start-ups offering a product,
for example the Commissioner, be the production site with associated equipment.
Unfortunately, no recommendations can be provided regarding this since this study do not
include a start-up company offering a physical product in their service nor are financial plans
and numbers included in the scope of this investigation. Nevertheless, start-up companies have
uncertain futures and it might therefore be wise to use external resources before large
investments are made on owning resources. Furthermore, a start-up can lower their initial costs
by using external resources when possible. One example of this is Company B1 and Company
B2 who cooperate with haulage firms who deliver the packages with their own vehicles and
drivers. This have probably helped the start-up companies minimize some costs in the initial
phase of the business but since they are now expanding, they should evaluate when it will be
more profitable to own the vehicles and employ the drivers themselves.
It is in some cases impossible to not use external resources. For example, the companies in
Industry A use the smart meters already installed in the buildings and by doing this they do not
need to change infrastructure in order to acquire customers. Since the Commissioner is in a
market of utilities, they will depend on the existing infrastructure as well. Nevertheless, they
have to install their own physical meters, compared to the smart meters in Industry B.

Chapter 5 Discussion
47
In order to perform the activities, a company needs human resources as well. The interviews
show that roles in the companies are not organized the same way in a start-up compared to a
large company and one person does in many cases handle various tasks; from financial planning
and customer acquisition to the coworkers wellbeing. The loose roles can for example benefit
the agility and speed in a start-ups’ business model and organization since these qualities are
suggested by the literature to improve the competitive advantage. Furthermore, the loose roles
can be preferred regarding personnel costs, since a start-up often have limited budget in the
beginning and cannot always hire an employee to do one specific task. However, consultants
have been utilized in at least one of the investigated companies.
5.1.4 The possibilities of partnerships
The investigated companies have first and foremost formed strategic alliances with non-
competitors. Their purpose differ but it can be argued that a company’s strategy can affect
which type of partnership is most needed in the business. The analysis indicates that
partnerships can depend on the company’s strategy. For example, Company A2 has a B2C
strategy and their partnerships are targeting new customers while Company A1 uses their
partnerships to develop their service further and create partner sales. The partnerships in
Industry B are focusing on the necessary physical resources and acquiring customers.
Since start-ups in the first stages of developing their business, including the Commissioner, do
not yet have customers, their strategy is not completely decided. However, start-ups should
investigate potential partnerships. For example, a strategic alliance can benefit the start-up by
introducing the product on the market and acquire their first customers, while the partner can
provide their customers with additional value. Another possible partnership for a start-ups with
a physical product is cooperation with suppliers, a so called buyer-supplier partnership, in order
to assure reliable supplies for the hardware. In order to reduce risks and add conditions for a
successful business, start-ups can enter partnerships with manufacturers who have all the
resources required for producing the product.
However, partnerships can be risky for start-ups. Their ideas risk getting copied by other
companies or partners who can finance their own development after getting knowledge about
the start-ups’ new product or service. Only one of the investigated start-ups has a partnership
with a competitor and reasons for this can be the potential betrayal and stealing of ideas.
However, partnerships with competitors are not investigated in this study and recommendations
for the Commissioner and other start-ups cannot be provided regarding this type of partnership.
5.1.5 The future and sustainable businesses
All investigated companies have plans to expand their geographical area in the future but the
plans differ depending on how they deliver their offerings. As mentioned in the between
Industry A and Industry B analysis, the companies in Industry B need more physical and human
resources in the new market than the companies in Industry A do.

Chapter 5 Discussion
48
While the American market is an obvious choice for Company A2’s international expansion
due to their academic partnership, it is also a possible market for Company A1. Regardless, all
four companies first and foremost look to Nordic and European markets but it can be discussed
how the degree of development can affect which countries are attractive and not. For example,
inhabitants in countries with less technological development might not be as interested in
measuring their electricity consumption or shopping online since they have other issues to focus
on. However, the Commissioner might have additional markets outside the technological
developed parts of the world where they can help both inhabitants and the environment long
term. Their product can be used to save water resources in markets where clean water are scarce.
In order to explore further possibilities, the investigated companies as well as other start-ups
can, as mentioned in section 2.2 Innovation, innovate their business model through industry
model innovation, revenue model innovation and enterprise model innovation. In any case, both
the present and the future also hold sustainability matters for both industries. To begin with, the
businesses of Company A1 and Company A2 open up for more sustainable living by lowering
the customers’ environmental impact. Industry B on the other hand can never be completely
sustainable since delivery services for easily accessed online shopping fuel a society of
consumption and they need some form of transportation no matter the environmental impact it
causes. However, the delivery services of Company B1 and Company B2 can be considered
more sustainable than other delivery options since they have lower environmental impact. As
a start-up, they also contribute to economic and social growth.
Further discussion of sustainability includes aspects brought by the interviewees where a
sustainable business includes the wellbeing of the employees and consciousness about the
actual sustainability of all parts included in the company. Interviewee A1 argues that for
example offices and material things are seldom sustainable produced and that no company is
sustainable when looking at such details.
5.2 Chapter summary
This chapter discuss the analyses of the business model components, divided into five main
topics, and the results are applied to the Commissioner and other start-ups. The first subject,
development and market adaption of the offering, discuss how the value proposition is affected
by the market and how it has to adapt to both competitors and trends. For example, start-ups
should use trial and error approaches to test their product on the market before making large
investments in it. Secondly, customer segmentation and relationships are found to be important
to care for in order to successfully find, acquire and keep customers. Since emerging start-ups
have not yet entered the market, they do not have any customers and should focus resources on
how to find and acquire them. Thirdly, operations to realize the business model are discussed
with focus on the importance of resources and activities for a growing start-up. All activities
are considered important in a start-up and start-ups should for example investigate what the
customers want and value before pricing the product in order to optimize the revenue in relation
to the costs. The fourth subject, the possibilities of partnerships, is discussed since all
investigated companies have different partnerships and use these in different ways. Strategic

Chapter 5 Discussion
49
alliances between non-competitors are a relevant type of partnerships for start-ups in the early
stages of entering the market. Lastly, the futures of the investigated companies are discussed
and include aspects on a sustainable business. The companies’ needs for physical resources can
affect the possibilities they have to expand to new and international markets. Start-ups with a
physical product must also observe manufacturing in order for them to be a sustainable
company. Sustainability in a company also includes internal aspects of the working
environment and the personnel’s health.

Chapter 5 Discussion
50

Chapter 6 Conclusion
51
6 Conclusion
This chapter concludes this study based on the findings from the comparative study by
answering the research questions and discuss limitations as well as future research possibilities.
6.1 Answers to the research questions
This study performs a comparative study with the purpose to make an assessment of the
components in the utilized business models of growing and innovative start-ups in markets with
different level of innovation. The three research questions formulated in addition to the purpose
are answered in this section. The business model components are observed from a perspective
of why they were developed instead of only what they are.
RQ1. How does trends in the industry affect the business model?
The investigated business models have all been affected by trends in the industry and the
business model components have evolved from and adapted to these trends. Trends does for
example create new customer segments which a new start-up can target with their value
proposition. The business model also adapts to scientific research, governmental regulations
and technological development in today’s society not only in the associated industry but in other
industries as well. For example, the development of digital tools for communication and
payments have made it easier to conduct business. With these new prerequisites, start-ups will
more likely have the possibility to create and try new value propositions. The use of social
media is seen to be a growing trend and social channels can also affect the customer relationship
since different customer segments have different needs and the technological development as
well as social behavior provides new opportunities. Lastly, it is noticed that international and
national goals, such as lowering the environmental impact, also affects the business model since
these can encourage and push for change.
RQ2. How does competition in the industry affect the business model?
The level of competition and the number of competitors in the market have affected the business
models’ of the investigated start-ups. For example, a start-up can more easily enter a market
with room for new actors but they have to work harder to survive if the competition is extensive.
The investigated companies have narrowed down their value proposition in order to compete
and grow in one area, instead of having a more slowly growth in several areas. Competition
also makes it important to have good reviews the companies can work with to improve.
RQ3. What are the similarities between the business models of successful start-ups in two
different industries?
The B2B, B2C and B2B2C strategies affect the business model components but there are
similarities despite the different strategies. One similarity is found in the approach for
developing the business model components. All start-ups have for example used a trial and
Chapter 6 Conclusion
52
error approach. They have tested and evaluated the offering on the market and stopped
developing it if it did not seem to have potential to be sold or if it took to much resources at that
time. Furthermore, all the investigated start-ups work with the customer segment that is the
most profitable one or the easiest one to reach. However, even though start-ups can be believed
to have only growth in focus, all the investigated companies are working with sustainability
and lowering their environmental impact.
Each of the components also share similarities. For example the value propositions have
evolved from market trends or customer needs and, in addition, the companies’ partnerships
have provided resources and knowledge to help develop the business. Another similarity is that
the investigated start-up companies have revenue streams mainly from other companies.
Furthermore, all performed activities are important for the investigated companies. They
continuously develop their product or service and work with feedback and market analyses. The
companies use digital channels and social media is common for, for example, collecting
feedback. Lastly, the customer relationship is more personal and active when the customers are
other businesses while the relationship is more passive towards consumers.
6.2 Limitations of this study and future research
This study is dependent on the empirics collected from the start-ups as discussed in chapter 3
Research methodology. It does not analyze numerical values or measure the level of innovation
in the companies and the industries. Industry observations and conclusions are drawn with
sample size in mind, bias answers are considered and sensitive information are distorted or left
out. Furthermore, some information is not revealed by the companies and cannot be included
in this study. The study does not have the possibility to research start-ups’ finances, and future
research should therefore focus the investigation on the finances of both successful and
unsuccessful start-up companies with a larger sample and over a longer time period in order to
get a more extensive research. For example by investigating the differences in cost structures,
what it costs to be successful and how which investments affect the growth of a company.
This research also notice that CRM is partially used by the start-up companies but cannot
investigate further within the scope of this study. Future research could therefore investigate
how CRM develops, when it is needed, how it is affected by competition and how companies
manage to uphold satisfied consumer without ever meeting them.
6.3 Chapter summary
The business model is affected by trends and competition in the industry as well as the
customer’s needs. Scientific research, governmental regulations and technology development
are examples of other aspects influencing the business model. The business model components
of successful start-ups in different industries are connected to the company’s strategy. Another
similarity is the trial and error approach which is commonly used by start-ups to develop their
business model components.

Chapter 6 Conclusion
53
This study does not include numerical values on the start-ups’ finances which can be considered
in future research. Future research should also use a larger sample and have a longer time
period.

Chapter 6 Conclusion
54

Chapter 7 References
55
7 References Aghion, P., Akcigit, U. and Howitt, P. 2015. The Schumpeterian Growth Paradigm. Annual
Reviews. 7(1), pp.557-575.
Aghion, P., Bechtold, S., Cassar, L. and Herz, H. 2014. The Casual Effects of Competition on
Innovation: Experimental Evidence. [Working paper]. Department of Economics, Harvard
University.
Aghion, P., Harris, C., Howitt, P. and Vickers, J. 2001. Competition, Imitation and Growth
with Step-by-Step Innovation. Review of Economics Studies. 68(3), pp.467-492.
Anokhin, S. and Wincent, J. 2010. Start-up rates and innovation: A cross-country
examination. Journal of International Business Studies. 43(1), pp.41-60.
Blank, S. G. 2007. The Four Steps to the Epiphany: Successful Strategies for Products that
Win. 4th ed. Wisconsin: Quad/Graphics.
Byttner, K-J. 2016. Handels nya startup-professor: Så blir ditt företag en unicorn. Veckans
Affärer. January 4th. [Online]. Available from:
https://www.va.se/nyheter/2016/01/04/handels-nya-startup-professor-sa-blir-ditt-foretag-
en-unicorn/ [Accessed 2018-04-05].
Casadesus-Masanell, R. and Ricart, J. E. 2010. From Strategy to Business Models and onto
Tactics. Long Range Planning. 43(2), pp.195–215.
Chen, I. J. and Popovich, K. 2003. Understanding customer relationship management (CRM):
People, processes and technology. Business Process Management Journal. 9(5), pp.672-
688.
Chesbrough, H. 2010. Business Model Innovation: Opportunities and Barriers. Long Range
Planning. 43(2), pp.354–363.
Chesbrough, H. and Rosenbloom, R. S. 2002. The role of the business model in capturing
value from innovation: evidence from Xerox Corporation’s technology spin-off companies.
Industrial and Corporate Change. 11(3), pp.529-555.
Collis, J. and Hussey, R. 2009. Business research: a practical guide for undergraduate &
postgraduate students. 3rd ed. Basingstoke: Palgrave Macmillan.
Colombo, L., Dawid, H., Piva, M. and Vivarelli, M. 2017. Does easy start-up formation
hamper incumbents' R&D investment?. Small Business Economics. 49(3), pp.513-531.
Chapter 7 References
56
DeSarbo, W.S., Jedidi, K. & Sinha, I. 2001. Customer value analysis in a heterogeneous
market. Strategic Management Journal. 22(9), pp.845–857.
Duening, T. N., Hisrich, R. D. and Lechter, M. A. 2015. Technology entrepreneurship: taking
innovation to the marketplace. 2nd ed. Oxford: Academic Press.
Edelman, B. 2015. How to Launch Your Digital Platform. Harvard business review. [Online].
Available from: https://hbr.org/2015/04/how-to-launch-your-digital-platform [Accessed
2018-05-16].
Eisenhardt, K. M. 1989. Building Theories from Case Study Research. The Academy of
Management Review. 14(4), pp.532-550.
Entrepreneur Media. 2018. Angel Investor Definition. Entrepreneur Small Business
Encyclopedia. [Online]. Available from:
https://www.entrepreneur.com/encyclopedia/angel-investor [Accessed 2018-05-18].
European Commission. 2018. Smart grids and meters. European Commission. [Online].
Available from: https://ec.europa.eu/energy/en/topics/markets-and-consumers/smart-grids-
and-meters [Accessed 2018-04-04].
FedEx. 2015. European SME export report. FedEx Express. [Online]. Available
from: http://images.fedex.com/downloads/small-
business/FedEx_EuropeanSMEExportReport_July15.pdf [Accessed 2018-04-25].
FedEx. 2018. Högteknologiska lösningar som kommer revolutionera branschen. FedEx.
[Online]. Available from: http://www.fedex.com/se/enews/2018/february/logistics-tech-
trends.html [Accessed 2018-04-04].
Floh, A., Zauner, A., Koller, M. and Rusch, T. 2014. Customer segmentation using
unobserved heterogeneity in the perceived-value–loyalty–intentions link. Journal of
Business Research. 67(5), pp.974–982.
Foss, N. J., Saebi, N. J. and Saebi, T. 2015. Business model innovation: the organizational
dimension. Oxford: Oxford University Press.
Frick, J. and Ali, M. M. 2013. Business model canvas as tool for SME. IFIP Advances in
Information and Communication Technology. 415(1), pp.142-149.
Gao, S. and Low, S. P. 2014. Lean Construction Management The Toyota Way. Singapore:
Springer.

Chapter 7 References
57
Giesen, E., Berman, S. J., Bell, R. and Blitz, A. 2007. Three ways to successfully innovate
your business model. Strategy & Leadership. 35(6), pp.27-33.
Gilliam, C. 2015. Third Party Logistics (3PL) - Everything You Need to Know. Tradegecko.
September 11th. [Online]. Available from: https://www.tradegecko.com/blog/3pl-
everything-you-need-to-know-about-third-party-logistics [Accessed 2018-05-23].
Greener, S. 2008. Business Research Methods. BookBoon.
Haaker, T., Bouwman, H., Janssen, W. and Reuvera, M. 2017. Business model stress testing:
A practical approach to test the robustness of a business model. Futures. 89(1), pp.14–25.
Harrigan, K. R. 1988. Joint Ventures and Competitive Strategy. Strategic Management
Journal. 9(2), pp.141-158.
Haulage contractor, 2018. In Cambridge Dictionary. Available from:
https://dictionary.cambridge.org/dictionary/english/haulage-contractor [Accessed 2018-05-
18].
Hjalmarson, G. 2016. Regeringen satsar mer på forskning och innovation på energiområdet.
Regeringskansliet. [Online]. Available from:
http://www.regeringen.se/pressmeddelanden/2016/12/regeringen-satsar-mer-pa-forskning-
och-innovation-pa-energiomradet/ [Accessed 2018-04-04].
Holcombe, C. J. 2016a. Revenue streams. In: eBusiness a complete text. Chile: Litlangs
Publishing Ltda. [Online]. Available from: http://www.ecommerce-digest.com/revenue-
streams.html [Accessed 2018-05-21].
Holcombe, C. J. 2016b. Cost structure. In: eBusiness a complete text. Chile: Litlangs
Publishing Ltda. [Online]. Available from: http://www.ecommerce-digest.com/cost-
structure.html [Accessed 2018-05-21].
Hüttel, B. A., Schumann, H., Mende, M., Scott, M. L. and Wagner, C. J. 2018. How
Consumers Assess Free E-Services: The Role of Benefit-Inflation and Cost-Deflation
Effects. Journal of Service Research. Pre Published January 9th.
Iankova, S., Davies, I., Archer-Brown, C., Marder, B. and Yau, A. 2018. A comparison of
social media marketing between B2B, B2C and mixed business model. Industrial
Marketing Management. DOI: https://doi.org/10.1016/j.indmarman.2018.01.001.
Jabłoński, A. and Jabłoński, M. 2016. Research on Business Models in their Life Cycle.
Sustainability. 8(5), p.430.
Chapter 7 References
58
Joyce, A. and Paquin, R. L. 2015. The triple layered business model canvas: A tool to design
more sustainable business models. Journal of Cleaner Production. 135(1), pp.1474-1486.
Kollman, T., Stöckmann, C., Hensellek, S. and Kensbock, J. 2017. European Startup Monitor
2016. [Online]. Available from:
http://europeanstartupmonitor.com/fileadmin/esm_2016/report/ESM_2016.pdf [Accessed
2018-02-16].
Konkurrensverket. 2018. Paketmarknaden. In: Konkurrensen i Sverige 2018. Report 2018:1.
Stockholm: Elanders Sverige AB. pp.124-130.purpo
Larsson, P. 2016. Artificiell intelligens på stark frammarsch. KTH. February 15th. [Online].
Available from: https://www.kth.se/forskning/artiklar/artificiell-intelligens-pa-stark-
frammarsch-1.626006 [Accessed 2018-05-18].
Lindi, J. and Marques Da Silva, C. 2011. Value proposition as a catalyst for a customer
focused innovation. Management Decision. 49(10), pp.1694–1708.
Markides, C. 2015. How Established Firms Exploit Disruptive Business Model Innovation:
Strategic and Organizational Challenges. In: Foss, N. J., Saebi, N. J. and Saebi, T. eds.
Business model innovation: the organizational dimension. Oxford: Oxford University
Press. pp.123-144.
Martin. 2015. Selecting and Managing Channels in Business Model Canvas. Cleverism.
March 4th. [Online]. Available from: https://www.cleverism.com/selecting-managing-
channels-business-model-canvas/ [Accessed 2018-04-19].
Mateu, J. M. and March-Chorda, I. 2016. Is experience a useful resource for business model
innovation?. Technology Analysis & Strategic Management. 28(10), pp.1195-1209.
Molyneux, P. 2013. Distribution Channels. In: Maude, D. ed. Global Private Banking and
Wealth Management. Oxford: John Wiley & Sons Ltd. pp.127-152.
Moogk, R. D. 2012. Minimum Viable Product and the Importance of Experimentation in
Technology Startups. Technology Innovation Management Review. 2(3), pp.23–26.
Moore, J. N., Hopkins, C. D. and Raymond, M. A. 2013. Utilization of Relationship-Oriented
Social Media in the Selling Process: A Comparison of Consumer (B2C) and Industrial
(B2B) Salespeople. Journal of Internet Commerce. 12(1), pp.48-75.
Muzellec, L., Ronteau, S. and Lambkin, M. 2015. Two-sided Internet platforms: A business
model lifecycle perspective. Industrial Marketing Management. 45(1), pp.139–150.

Chapter 7 References
59
Nicholas, T. 2003. Why Schumpeter was Right: Innovation, Market Power, and Creative
Destruction in 1920s America. The Journal of Economic History. 63(4), pp.1023-1058.
Osterwalder, A. and Pigneur, Y. 2010. Business model generation a handbook for visionaries,
game changers and challengers. New Jersey: John Wiley & Sons.
Pandey, R. 2016. Customer satisfaction more important than revenue growth: Salesforce.
Marketing Interactive. April 8th. [Online]. Available from: http://www.marketing-
interactive.com/customer-satisfaction-important-revenue-growth-salesforce/ [Accessed
2018-05-23].
Patel, N. 2015. 90% Of all Startups Fail: Here’s What You Need To Know About The 10%.
[Online]. Available from: https://www.forbes.com/sites/neilpatel/2015/01/16/90-of-
startups-will-fail-heres-what-you-need-to-know-about-the-10/#3e81f48b6679 [Accessed
2018-02-20].
Posten, Svensk Distanshandel and HUI Research. 2013. e-barometern: 2012 årsrapport.
Stockholm: Posten. [Online]. Available from:
https://www.postnord.se/foretag/foretagslosningar/e-handel/e-handelsrapporter-och-
kundcase/arkiv-e-barometern [Accessed 2018-03-01].
PostNord, Svensk Digital Handel and HUI Research. 2014. e-barometern: 2013 årsrapport.
Stockholm: Posten. [Online]. Available from:
https://www.postnord.se/foretag/foretagslosningar/e-handel/e-handelsrapporter-och-
kundcase/arkiv-e-barometern [Accessed 2018-03-01].
PostNord, Svensk Digital Handel and HUI Research. 2015. e-barometern: 2014 årsrapport.
Stockholm: Posten. [Online]. Available from:
https://www.postnord.se/foretag/foretagslosningar/e-handel/e-handelsrapporter-och-
kundcase/arkiv-e-barometern [Accessed 2018-03-01].
PostNord, Svensk Digital Handel and HUI Research. 2016. e-barometern: 2015
årsrapport. Stockholm: Posten. [Online].Available from:
https://www.postnord.se/foretag/foretagslosningar/e-handel/e-handelsrapporter-och-
kundcase/arkiv-e-barometern [Accessed 2018-03-01].
PostNord, Svensk Digital Handel and HUI Research. 2017. e-barometern: 2016 årsrapport.
Stockholm: Posten. [Online]. Available from:
https://www.postnord.se/foretag/foretagslosningar/e-handel/e-handelsrapporter-och-
kundcase/arkiv-e-barometern [Accessed 2018-03-01].
PostNord, Svensk Digital Handel and HUI Research. 2018. e-barometern: 2017 årsrapport.
Stockholm: Posten. [Online]. Available from:

Chapter 7 References
60
https://www.postnord.se/foretag/foretagslosningar/e-handel/e-handelsrapporter-och-
kundcase/e-barometern [Accessed 2018-03-01].
Regeringskansliet. 2017. Startup Sverige - ett smörgåsbord av innovation. Regeringen.
December 21st. [Online]. Available from:
https://www.regeringen.se/artiklar/2017/12/startup-sverige--ett-smorgasbord-av-
innovation/ [Accessed 2018-06-04].
Regeringskansliet. 2018a. Elsystemet förnyas. Swedish Smartgrid. [Online]. Available from:
http://swedishsmartgrid.se/varfor-smarta-elnat/elsystemet-fornyas/ [Accessed 2018-04-04].
Regeringskansliet. 2018b. Betydelse för slutkunderna. Swedish Smartgrid. [Online]. Available
from: http://swedishsmartgrid.se/varfor-smarta-elnat/elsystemet-fornyas/betydelse-for-
slutkunderna/ [Accessed 2018-04-04].
Regeringskansliet. 2018c. Smarta elmätare. Swedish Smartgrid. [Online]. Available from:
http://swedishsmartgrid.se/varfor-smarta-elnat/elsystemet-fornyas/smarta-elmatare/
[Accessed 2018-04-04].
Richtnér, A., Brattström, A., Frishammar, J., Björk, J. and Magnusson, M. 2017. Creating
Better Innovation Measurement Practices. MIT Sloan management review. 59(1), pp.45-53.
Rouse, M. 2015. Customer segmentation. TechTarget SearchSelesforce. May. [Online].
Available from: https://searchsalesforce.techtarget.com/definition/customer-segmentation
[Accessed 2018-04-19]
Saebi, T. 2015. Evolution, Adaptation, or Innovation?: A Contingency Framework on
Business Model Dynamics. In: Foss, N. J., Saebi, N. J. and Saebi, T. eds. Business model
innovation: the organizational dimension. Oxford: Oxford University Press. pp.145-168.
Santos, J. F. P. dos, Spector, B. and Van der Heyden, L. 2015. Toward a Theory of Business
Model Change. In: Foss, N. J., Saebi, N. J. and Saebi, T. eds. Business model innovation:
the organizational dimension. Oxford: Oxford University Press. pp.43-63.
Saunders, M., Lewis, P. and Thornhill, A. 2012. Research Methods for Business Students. 6th
ed. Essex: Pearson Education Limited.
Scania. 2015. Platooning- how it works. YouTube. February 8th. [Online]. Available from:
https://www.youtube.com/watch?v=X7vziDnNXEY [2018-05-23]
StartupAUS. 2016. Crossroads: An action plan to develop a vibrant tech startup ecosystem in
Australia. Sydney. [Online]. Available: https://s3-ap-southeast-

Chapter 7 References
61
2.amazonaws.com/startupaus/StartupAus_Crossroads_report_Digital_Edition.pdf
[Accessed 2018-02-14].
Statens Energimyndighet. 2017a. Sektorsstrategier för energieffektivisering.
Energimyndigheten. [Online]. Available from:
http://www.energimyndigheten.se/energieffektivisering/program-och-
uppdrag/Sektorsstrategier-for-energieffektivisering2/ [Accessed 2018-04-12].
Statens Energimyndighet, 2017b. Energiläget i siffror 2017 (Excel). Report Energiläget.
Stockholm.
Statens Energimyndighet, 2017c. Energiindikatorer 2017. Report Energiindikatorer.
Eskilstuna.
Statistiska Centralbyrån. 2018. Antal solcellsanläggningar och installerad effekt (MW), efter
region. År 2016-2017. Statistikdatabasen. [Online]. Available
from: http://www.statistikdatabasen.scb.se/pxweb/sv/ssd/START__EN__EN0123/InstSolc
ellNY/table/tableViewLayout1/?rxid=fd134915-216d-4f22-9252-b407bc942664 [Accessed
2018-04-03].
Strategyzer. 2018. How do I use the Customer Relationships building block of the Business
Model Canvas?. Strategyzer Support. [Online]. Available from:
http://support.strategyzer.com/knowledgebase/articles/1194373-how-do-i-use-the-
customer-relationships-building-b [Accessed 2018-05-01].
Sweeney, J. C. and Soutar, G. N. 2001. Consumer perceived value: The development of a
multiple item scale. Journal of Retailing. 77(2), pp.203–220.
Swedish Association of Graduate Engineers. 2018. Code of Honour. Sveriges Ingenjörer.
[Online]. Available from: https://www.sverigesingenjorer.se/Om-forbundet/Sa-tycker-
vi/hederskodex/ [Accessed 2018-03-23].
Swedish Energy Agency. 2018. Energy in Sweden Fact and Figures 2018. Published Mars
28th. Available from: http://www.energimyndigheten.se/en/news/2018/energy-in-sweden--
-facts-and-figures-2018-available-now/ [Accessed 2018-04-03].
Swedish Research Council. 2018. The humanities and social sciences. CODEX. [Online].
Available from: http://www.codex.vr.se/en/forskninghumsam.shtml [Accessed 2018-03-
23].
The Hub. 2018. Startups. [Online]. Available from: https://thehub.se/startups [Accessed 2018-
02-14].

Chapter 7 References
62
Thwink. 2014. Three Pillars Of Sustainability. [Online]. Available from:
http://www.thwink.org/sustain/glossary/ThreePillarsOfSustainability.htm [Accessed 2018-
06-05].
Tülüce, N. S. and Yurtkur, A. K. 2015. Term of Strategic Entrepreneurship and Schumpeter's
Creative Destruction Theory. Procedia - Social and Behavioral Sciences. 207(1), pp.720–
728.
Vattenfall. 2018a. Landsbyggdens electrifiering. Vattenfall. [Online]. Available from:
https://historia.vattenfall.se/sv/en-ny-vardag-med-el/innan-vattenfall-fanns [Accessed
2018-04-06].
Vattenfall. 2018b. Elen ändrade folks vardag. Vattenfall. [Online].
https://historia.vattenfall.se/sv/en-ny-vardag-med-el/elen-andrade-folks-vardag [Accessed
2018-04-06].
Vattenfall. 2018c. På jakt efter alternativ energi. Vattenfall. [Online].
https://historia.vattenfall.se/sv/entreprenorsskap-och-kreativitet/pa-jakt-efter-alternativ-
energi [Accessed 2018-03-06].
Viswanathan, B. 2015. Startup vs. Small Business: What’s the Difference?. Huffington Post.
[Online]. December 6th. Available from: https://www.huffingtonpost.com/quora/startup-
vs-small-business_b_7708530.html [Accessed 2018-02-14].
Walsham, G. 1995. The Emergence of Interpretivism in IS Research. Information Systems
Research. 6(4), pp.376-394.
Wang, Y. and Feng, H. 2012. Customer relationship management capabilities. Management
Decision. 50(1), pp.115–129.
WCED. 1987. Our Common Future. Oxford and New York: Oxford University Press.
Woodcock, N., Green, A. and Starkey, M. 2011. Social CRM as a business strategy. Journal
of Database Marketing & Customer Strategy Management. 18(1), pp.50-64.
Yang, M., Evans, S., Vladimirova, D. and Rana, P. 2017. Value uncaptured perspective for
sustainable business model innovation. Journal of Cleaner Production. 140(1), pp.1794–
1804.
Yetisen, A. K., Volpatti, L. R., Coskun, A. F., Cho, S., Kamrani, E., Butt, H.,
Khademhosseini, A. and Hyun Yun, S. 2015. Entrepreneurship. Lab on a Chip. 15(18),
pp.3638-3660.

Chapter 7 References
63
Yin, R.K. 1993. Application of case study research. California: SAGE.
Yin, R.K. 2012. Applications of case study research. 3rd ed. California: SAGE.
Zider, B. 1998. How Venture Capital Works. Harvard Business Review. [Online]. Available
from: https://hbr.org/1998/11/how-venture-capital-works [Accessed 2018-05-18].
Zott, C., Amit, R. and Massa, L. 2011. The Business Model: Recent Developments and Future
Research. Journal of Management. 37(4), pp.1019-1042.

Chapter 7 References
64

Appendix 1. Business Model Canvas components
65
Appendix 1. Business Model Canvas components
This is a short introduction to the nine components of the BMC and aim to provide an
understanding of each components’ purpose and strategic implications. The sources are both
peer-reviewed and non-peer-reviewed.
Value Proposition
The value proposition defines what value the offering is creating for the customer and solves
either a problem, a need or a demand (Osterwalder and Pigneur, 2010). The value proposition
also describes what differentiates one company’s value from others’. However, a good value
proposition is not a guarantee for success. Customers often make choices based on the value
the product brings, not based on its’ details (Lindi and Marques Da Silva, 2011), and it could
be a waste to over process a product, to add more value than the customer desire (Gao and Low,
2014). In order to deliver the value, it needs to be adapted to the market and is therefore often
tested before mayor investments are done. Minimum viable product (MVP) is an approach to
design and validate the product with early customers (Moogk, 2012).
Customer Segments
Customer segments defines the customer and can also include the customer needs.
Segmentation is done in order to improve companies’ strategies and adjust their value
proposition (DeSarbo et al., 2001). In a B2C strategy, customer segmentation categorize
customers into groups based on need, demographic, geographic, psychographic and behavior
(Floh et al., 2014) while the segmentation in a B2B strategy often is based on an industry or a
job position which would find their service appealing (Rouse, 2015). Companies can also use
value based segmentation, which is segmentation based on the revenue and cost the customer
bring the company (Rouse, 2015), or use segmentation based on the customers’ consciousness,
such as if the customer is price, quality or value conscious (Sweeney and Soutar, 2001).
Customer Relationships
The customer relationship defines what type of relationship the company has with the customer.
The relationships can be described by their time frame (long or short term), if customer
communities exists or if the companies create value together with the customer or for example
how the contact between the customer and company is done (personal or passive) (Strategyzer,
2018). If the relationship is passive, the company do not speak directly or regularly to the
customer and the relationship is handled through digital tools.
In order to structure the relationships, companies work with Customer Relationship
Management (CRM). CRM is a strategy with multiple processes within companies that creates,
maintains and strengthen long-term relationships with attractive clients (Wang and Feng, 2012).

Appendix 1. Business Model Canvas components
66
Nowadays, social CRM is also used to define social media related activities where the
companies and customer share and collect information.
Channels
Channels defines how the customer is reached from awareness to after sales. The channels can
be categorized into marketing, sales and distribution (Martin, 2015) and each channel can be
owned by the company, bought from another business or provided by a partner. Traditionally,
the channels have been face-to-face but technological advancements have brought a wide
variety of options (Molyneux, 2013). Social media is one of these options and B2B and B2C
companies use social media channels differently regarding which platform is used, what
purpose it has and what the perceived outcome is (Iankova et al., 2018). Furthermore, B2B
companies do not rank social media channels as important as B2C companies does. Proper use
of channels can become a competitive advantage and it is therefore important to adjust it to the
targeted customer segment (Martin, 2015).
Revenue Streams
Revenue Streams describe what part of the business that generates which income (Osterwalder
and Pigneur, 2010). The revenue is planned in order to cover the costs the product or service
need as well as a profit margin. However, there are numerous possibilities to acquire revenue,
for example by fixed or dynamic pricing (Holcombe, 2016b). Although revenue is important,
companies seem to prioritize the customers’ satisfaction in order to succeed (Pandey, 2016).
Key Activities
In order to realize the business model’s value proposition, some key activities must be done
(Osterwalder and Pigneur, 2010). Each component in the business model have specific
activities. The activities can be anything that is necessary to do in order to complete the value
proposition or the other components, for example develop an interface.
Key Resources
Key resources defines the resources required to make the business model work. The resources
can be described as either physical, human, intellectual or financial (Osterwalder and Pigneur,
2010). Note that not all the resources have to be owned by the company but can be external or
shared resources. For example, a company can own cars but use another company’s drivers.
Key Partners
This BMC component defines the network of partners and what the partners contribute with.
Through partnerships, companies can acquire more resources, specialize their own activities,
reduce risk and in other ways optimize the business model. Four types of partnerships can be
described as; strategic alliances between non-competitors, cooperation between competitors,
buyer-supplier partnerships and joint ventures (Osterwalder and Pigneur, 2010). Strategic
alliances between non competitors and cooperation between competitors are for example used

Appendix 1. Business Model Canvas components
67
to help each other or when companies have mutual interests. Buyer-supplier partnerships are
used to assure reliable supplies and joint ventures join two entities to a completely new one, but
are not necessarily always defined as a partnership (Harrigan, 1988).
Cost Structure
Defines the main costs in the business model and their origin. Depending on the business model,
a company can either be value driven or cost driven. This means that value and costs are
prioritized differently in different business models; if a business model is cost driven, it aims to
minimize all costs while a value driven business model often focus on creating a premium value
proposition (Holcombe, 2016a). Furthermore, the cost can be categorized as fixed, variable,
economies of scale and/or economic of scope.

Appendix 1. Business Model Canvas components
68
Appendix 2. Search words
69
Appendix 2. Search words
This appendix presents a list of search words used and combined to find sources for the
literature survey.
Assessment
B2B
B2B2C
B2B2C
B2C
Business model
Business model canvas
Business model evolution
Business model innovation
Business model strategy
Business plan
Business strategy
Business to Business
Business to business to customer
Business to customer
Corporate Social Responsibility
Customer discovery
Economic growth
Entrepreneur
Entrepreneurship
Green technology
Growth
Innovation
Life cycle
Market entry
Osterwalder
Procurement
Secondary business
Small medium enterprise
Smart meter
SME
Startup
Start-up
Start-up strategy
Vattenmätare

www.kth.se