business investment in canada falls far behind other ... nvestent in anaa ein ter ountries...
TRANSCRIPT

fraserinstitute.org FRASER RESEARCH BULLETIN 1
F R A S E R RESEARCHBULLETIN
October 2017
�� This bulletin provides an overview of busi-ness investment in Canada: why investment is important, its recent performance, and how it compares with other industrialized countries.
�� Business investment is central to long-term economic growth and rising living standards. Investment is also an important determinant of the structure of industry growth in future years, since it provides the capital for firms to grow. Investment embodies new technologi-cal developments and innovations, committing firms to expand in a specific direction while providing the tools for employees to work more productively.
�� There is a tendency to assume that the weakness in business investment in Canada is simply part of slow growth throughout the OECD following the financial crisis that be-
gan in 2008. However, despite strength in the energy sector before 2015, business investment in Canada has lagged behind that in almost all other advanced market economies for which there is comparable data.
�� Indeed, business investment in Canada has been relatively low compared to other coun-tries at least since 2000. It improved somewhat between 2009 and 2014 when strength in our energy sector boosted our relative performance. However, the underlying weakness of investment in Canada became apparent again after oil prices slumped, ending the boom in energy investment.
�� The persistent weakness of business invest-ment in Canada has been aggravated by several recent government policies including increased tax rates on capital and mounting budget defi-cits and debt, both of which add to the uncer-tainty that entrepreneurs and investors feel about the future.
Summary
Business Investment in Canada Falls Far Behind Other Industrialized Countries by Philip Cross

Business Investment in Canada Behind Other Countries
fraserinstitute.org FRASER RESEARCH BULLETIN 2
IntroductionOne of the most common narratives about Cana-da’s economy centres on hefty investments over the past decade in its energy sector, notably the oil sands. This narrative gives the impression that business investment, while disproportionately concentrated in one sector, has been a driving force in Canada’s economic growth. While it is true that energy investment had risen, this nar-row focus obscures the fact that business invest-ment as a share of Canada’s GDP continues to be at a rate that is among the lowest in the Organ-isation for Economic Cooperation and Develop-ment (OECD). Even during the period of rapidly increasing energy investment before the drop in commodity prices, Canada trailed other OECD countries on measures of business investment. After years of decline, the Bank of Canada fore-sees little rebound in business investment, which it forecasts to rise by less than 1 percent in 2018 and 2019 (Bank of Canada, 2017: 8). If weak busi-ness investment persists, it will be a major con-tributor to slow growth in Canada in the future.
This bulletin gives an overview of business investment in Canada: why investment is important, its recent performance, and how it compares with other OECD countries. It reviews the broad trends since 2000, focusing particularly on the post-2014 period when the energy sector no longer compensated for the persistent weakness in other industries. It also briefly discusses factors weighing on business investment in Canada, including recent govern-ment policies that have made the investment climate less hospitable.
The role of investment in the economyBusiness investment is central to long-term economic growth and rising living standards. For investments to be made, some current con-sumption must be sacrificed so that the funds
can be spent on assets that will generate higher incomes and ultimately living standards in the future. In the words of Ricardo Caballero, “Investing means trading the present for the future” (1999: 815). Dale Jorgensen and Steven Landefeld concluded that “Capital input is the most important source of economic growth in the postwar period” (2006: 97). For Hyman Min-sky, “Investment is the essential determinant of the path of a capitalist economy: the govern-ment budget, the behavior of consumption, and the path of money wages are secondary” (1986: 191). Conversely, a dearth of investment can be fatal: the collapse of business investment in North America to below the rate of deprecia-tion in the 1930s, implying an outright decline in the capital stock, was a principal factor mak-ing the 1930s recession the “Great Depression.”
Investment is also an important determinant of the structure of industry growth in future years, since it provides the capital for firms to grow. For example, the investment Canada has made in energy has been reflected in rapid out-put growth of energy products as well as the transportation infrastructure needed to carry these products to markets. Investment embod-ies new technological developments and inno-vations, committing firms to expand in a spe-cific direction while providing the tools for employees to work more productively.
Investment also plays an outsized role in the cyclical fluctuation of the economy between periods of recession and growth. This large impact reflects that investment is one of the most volatile components of aggregate demand over the business cycle.
As important as investment is to an economy, more investment does not always guaran-tee sustained income growth. The centrally-planned economies dominated by the Soviet
Business Investment in Canada Behind Other Countries
fraserinstitute.org FRASER RESEARCH BULLETIN 3
Union demonstrated that high levels of invest-ment alone were insufficient to generate inno-vation and growth. That’s because the invest-ments were not in the right industries due to a lack of informational guidance from market prices and profits, and the suppression of the entrepreneurial spirit to act on this informa-tion. As noted by legendary business manage-ment guru Peter Drucker, “It is not how much capital is being invested—or else the Soviet Union would have easily been the world’s fore-most economy. What’s critical is the productiv-ity of capital” (2017: 86). A Keynesian prescrip-tion of digging holes and then filling them back up is simply a wasted opportunity to boost long-run productivity.
The structure of business investment in CanadaThere are three components to business fixed investment: non-residential structures, machinery and equipment, and intellectual property products. Structures include buildings such as offices, factories, and warehouses, and engineering works such as oil and gas facilities, pipelines, hydroelectricity dams, and transmis-sion wires. Machinery and equipment invest-ments include computers, electronics, and industrial machinery. These investments are critical for boosting individual worker produc-tivity, whereas structures tend to be linked to the expansion of capacity, which helps raise an
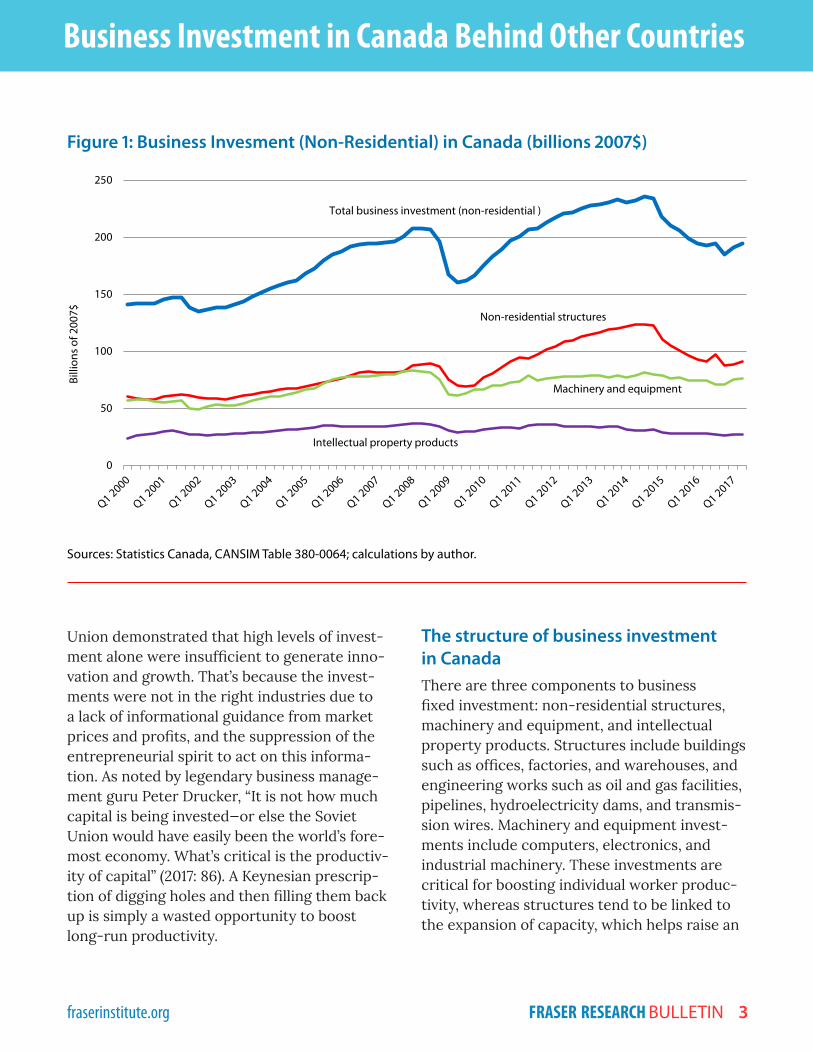
Figure 1: Business Invesment (Non-Residential) in Canada (billions 2007$)
Sources: Statistics Canada, CANSIM Table 380-0064; calculations by author.
0
50
100
150
200
250
Billi
ons o
f 200
7$
Machinery and equipment
Non-residential structures
Total business investment (non-residential )
Intellectual property products

Business Investment in Canada Behind Other Countries
fraserinstitute.org FRASER RESEARCH BULLETIN 4
industry’s output and productivity.1 Investment in intellectual property mostly reflects spend-ing on research and development, which tends to fluctuate less over time.
Figure 1 displays total business investment in Canada (adjusted for inflation in 2007 dol-lars) and its three main components from 2000 through to the most recent quarter of available data in 2017. Total business investment increased from $141.1 billion in 2000 up to $207.5 billion in 2008 before dropping to $160.5 billion in 2009 as a result of the recession. It then began increas-ing in 2010, peaking at $235.8 billion in 2014 before dropping again in 2015 after the energy price shock. As of the second quarter this year,
1 The larger importance of machinery and equip-ment to labour productivity is documented in Rao, Someshwar, Jianmin Tang, and Weimin Wang (2003).
it currently stands at $194.2 billion—18 percent lower than the quarterly peak in 2014.
Because of the energy boom, Canada saw a surge in the construction of non-residen-tial structures after the 2009 recession. This was dominated by energy projects as capacity expanded in the oil sands and subsequently in the network of pipelines needed to distribute oil and gas, as well as utility generation. How-ever, these gains were not matched by invest-ment in machinery and equipment (figure 1). Put differently, while there was a significant surge in investments in non-residential struc-tures from 2009 to the end of 2014, investments in machinery and equipment did not increase by the same proportion.
Figure 2 displays Canada’s annual business investment as a share of GDP from 2000 to
Figure 2: Business Investment (Non-Residential) in Canada, as Share of GDP
Sources: Statistics Canada, CANSIM Table 380-0064; calculations by author.
0%
2%
4%
6%
8%
10%
12%
14%
16%
Machinery and equipment
Non-residential structures
Total business investment (non-residential )
Intellectual property products

Business Investment in Canada Behind Other Countries
fraserinstitute.org FRASER RESEARCH BULLETIN 5
2016. Since 2000, business investment has aver-age about 12 percent, even with the boom in energy investment that lifted spending on struc-tures over much of this period. By 2007, invest-ment in structures had surpassed investment in machinery and equipment in Canada. This source of strength in energy investment was partly offset by persistent weakness in spend-ing on productivity-enhancing machinery and equipment, which as a share of GDP has fallen
for most of the past two decades. Canada’s reli-ance on structures is unusual; more typical is the US, where investment in machinery and equipment was twice as high as it was on struc-tures.
The weakness in investment in machinery and equipment over the past decade has been con-centrated in three industries. Finance, mostly banks, has posted the largest decline, from
Table 1: Business Investment (Non-Residential) as a Share of GDP
2000-2008 avg. 2009-2014 avg. 2015-2017 avg.
Percent Rank of 17 Percent Rank of 17 Percent Rank of 17
Australia 14.8% 6 18.9% 2 15.7% 3
Belgium 14.8% 5 14.8% 4 15.6% 4
Canada 11.3% 15 12.6% 8 10.9% 16
Denmark 12.3% 10 11.3% 14 12.1% 11
Finland 13.4% 8 12.0% 12 11.8% 15
France 12.3% 11 12.6% 9 13.3% 9
Germany 12.2% 13 12.0% 11 12.1% 12
Iceland 15.1% 4 8.5% 17 13.6% 7
Japan 15.3% 3 14.4% 5 15.5% 5
Korea 22.2% 1 21.6% 1 21.3% 1
Netherlands 11.5% 14 11.6% 13 12.4% 10
New Zealand 10.9% 16 10.6% 15 11.8% 14
Norway 12.2% 12 13.6% 7 12.0% 13
Sweden 14.0% 7 14.4% 6 15.0% 6
Switzerland 17.5% 2 17.3% 3 18.2% 2
United Kingdom 9.4% 17 8.9% 16 9.4% 17
United States 12.4% 9 12.3% 10 13.3% 8
Notes:
(1) Comparable data is not available for OECD countries not listed here.
(2) 2016 is preliminary data and 2017 is projected by OECD.
Sources: OECD Economic Outlook, June 2017; calculations by author.
Business Investment in Canada Behind Other Countries
fraserinstitute.org FRASER RESEARCH BULLETIN 6
$23.2 billion in 2006 to $4.3 billion in 2017 (all industry-level data are in current dollars, not adjusted for inflation).2 The drop was about equally spread between Quebec and Ontario. Meanwhile, manufacturers, led by firms in Ontario, have cut machinery and equipment outlays from $14.4 billion in the years before the recession to $11.8 billion. Finally, the mining industry quickly slashed spending on machin-ery and equipment from $7.3 billion when oil prices began to dive in 2014 to just $0.9 billion by 2017. The sudden and precipitous drop in machinery and equipment investment reflects this industry’s commitment to finishing mega-projects nearing completion (outlays for struc-
2 All investment data in this paragraph are from Sta-tistics Canada, Cansim Table 029-0045. Industry data on investment are only available in current dollars.
tures remain much higher at $11.2 billion in 2017); it therefore urgently searched for cuts in its spending on machinery and equipment to counter its falling cash flow.
Business investment in Canada compared with that in other OECD countries
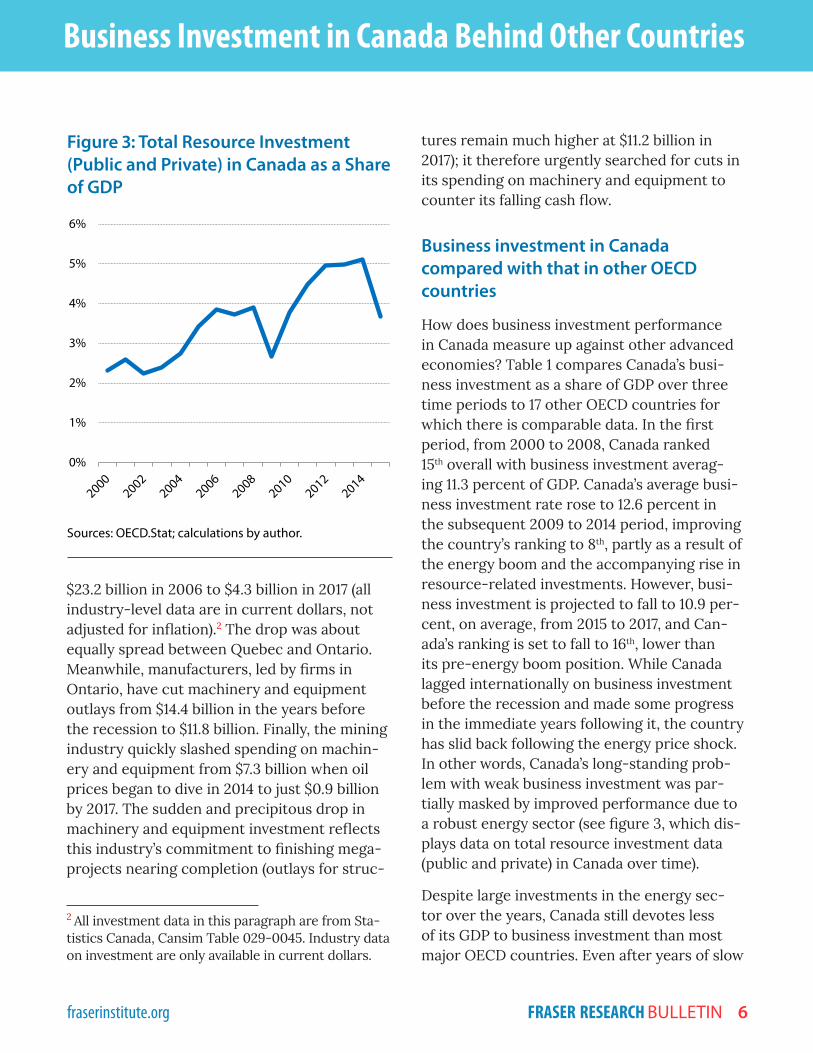
How does business investment performance in Canada measure up against other advanced economies? Table 1 compares Canada’s busi-ness investment as a share of GDP over three time periods to 17 other OECD countries for which there is comparable data. In the first period, from 2000 to 2008, Canada ranked 15th overall with business investment averag-ing 11.3 percent of GDP. Canada’s average busi-ness investment rate rose to 12.6 percent in the subsequent 2009 to 2014 period, improving the country’s ranking to 8th, partly as a result of the energy boom and the accompanying rise in resource-related investments. However, busi-ness investment is projected to fall to 10.9 per-cent, on average, from 2015 to 2017, and Can-ada’s ranking is set to fall to 16th, lower than its pre-energy boom position. While Canada lagged internationally on business investment before the recession and made some progress in the immediate years following it, the country has slid back following the energy price shock. In other words, Canada’s long-standing prob-lem with weak business investment was par-tially masked by improved performance due to a robust energy sector (see figure 3, which dis-plays data on total resource investment data (public and private) in Canada over time).
Despite large investments in the energy sec-tor over the years, Canada still devotes less of its GDP to business investment than most major OECD countries. Even after years of slow
Figure 3: Total Resource Investment (Public and Private) in Canada as a Share of GDP
Sources: OECD.Stat; calculations by author.
0%
1%
2%
3%
4%
5%
6%

Business Investment in Canada Behind Other Countries
fraserinstitute.org FRASER RESEARCH BULLETIN 7
growth and turmoil in their financial markets, most developed countries still invest mark-edly more of their GDP than Canada’s 10.9 per-cent (see figure 4). South Korea invests nearly twice as much as Canada, while most European countries and the US invest between 12 per-cent and 15 percent. Only the United Kingdom invests less, partly reflecting the winding down of investments in North Sea oil and the wither-ing away of its industrial base (see Driver and Temple, 2013).
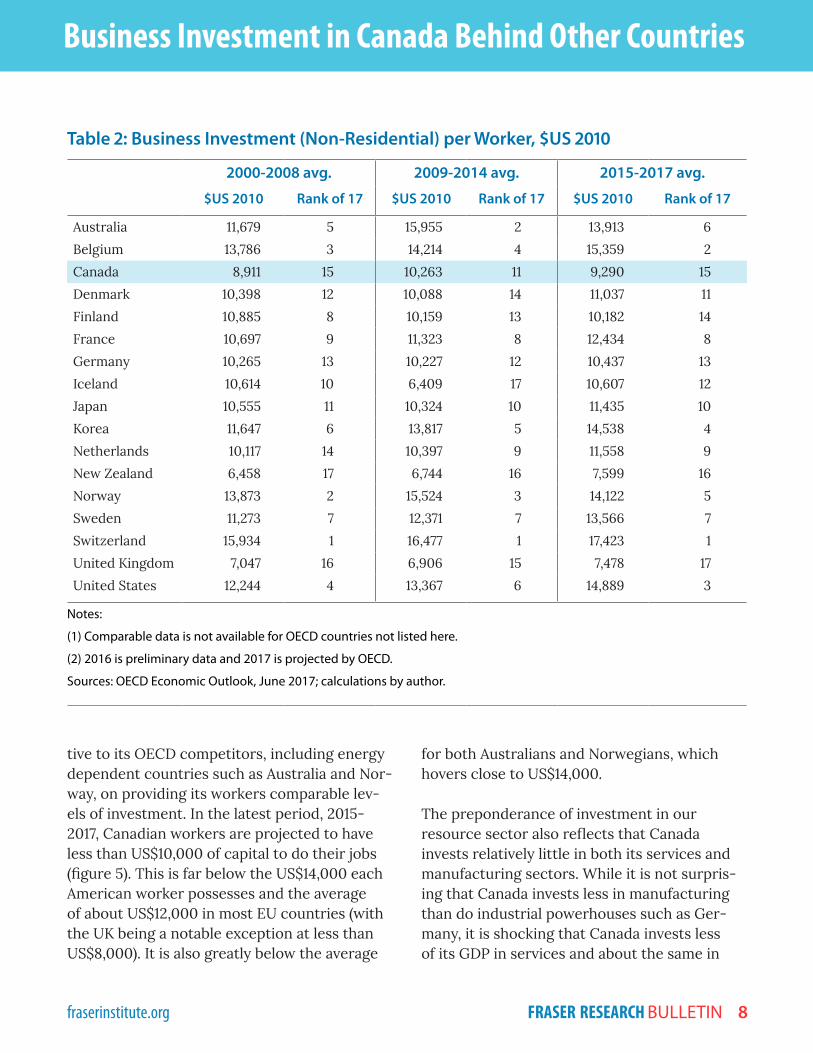
The persistent weakness of business invest-ment, especially for machinery and equipment, means that Canadian workers have one of the lowest amounts of capital equipment to help them do their jobs productively. Table 2 com-pares total business investment per worker in the OECD (using Purchasing Power Parity rates to convert each national currency into 2010 US dollars) over the same three time periods. It shows Canada consistently ranks poorly rela-
Figure 4: Non-Residential Business Investment as Share of GDP in OECD Countries, 2015-2017 Average
Notes:(1) Comparable data is not available for OECD countries not listed here.(2) 2016 is preliminary data and 2017 is projected by OECD.Sources: OECD Economic Outlook, June 2017; calculations by author.
9.4%
10.9%
11.8%
11.8%
12.0%
12.1%
12.1%
12.4%
13.3%
13.3%
13.6%
15.0%
15.5%
15.6%
15.7%
18.2%
21.3%
0% 5% 10% 15% 20% 25%
United Kingdom
Canada
Finland
New Zealand
Norway
Germany
Denmark
Netherlands
France
United States
Iceland
Sweden
Japan
Belgium
Australia
Switzerland
Korea
Business Investment in Canada Behind Other Countries
fraserinstitute.org FRASER RESEARCH BULLETIN 8
tive to its OECD competitors, including energy dependent countries such as Australia and Nor-way, on providing its workers comparable lev-els of investment. In the latest period, 2015-2017, Canadian workers are projected to have less than US$10,000 of capital to do their jobs (figure 5). This is far below the US$14,000 each American worker possesses and the average of about US$12,000 in most EU countries (with the UK being a notable exception at less than US$8,000). It is also greatly below the average
for both Australians and Norwegians, which hovers close to US$14,000.
The preponderance of investment in our resource sector also reflects that Canada invests relatively little in both its services and manufacturing sectors. While it is not surpris-ing that Canada invests less in manufacturing than do industrial powerhouses such as Ger-many, it is shocking that Canada invests less of its GDP in services and about the same in
Table 2: Business Investment (Non-Residential) per Worker, $US 2010
2000-2008 avg. 2009-2014 avg. 2015-2017 avg.
$US 2010 Rank of 17 $US 2010 Rank of 17 $US 2010 Rank of 17
Australia 11,679 5 15,955 2 13,913 6
Belgium 13,786 3 14,214 4 15,359 2
Canada 8,911 15 10,263 11 9,290 15
Denmark 10,398 12 10,088 14 11,037 11
Finland 10,885 8 10,159 13 10,182 14
France 10,697 9 11,323 8 12,434 8
Germany 10,265 13 10,227 12 10,437 13
Iceland 10,614 10 6,409 17 10,607 12
Japan 10,555 11 10,324 10 11,435 10
Korea 11,647 6 13,817 5 14,538 4
Netherlands 10,117 14 10,397 9 11,558 9
New Zealand 6,458 17 6,744 16 7,599 16
Norway 13,873 2 15,524 3 14,122 5
Sweden 11,273 7 12,371 7 13,566 7
Switzerland 15,934 1 16,477 1 17,423 1
United Kingdom 7,047 16 6,906 15 7,478 17
United States 12,244 4 13,367 6 14,889 3
Notes:
(1) Comparable data is not available for OECD countries not listed here.
(2) 2016 is preliminary data and 2017 is projected by OECD.
Sources: OECD Economic Outlook, June 2017; calculations by author.

Business Investment in Canada Behind Other Countries
fraserinstitute.org FRASER RESEARCH BULLETIN 9
manufacturing as a poor nation such as Greece (figure 6). In fact, Canada invests less of its GDP in services (6.6 percent) than any of the other OECD countries (Australia is the next lowest at 8.7 percent). Note that the data in figure 6, like the data in figure 3, include both private and public investment, since the OECD does not distinguish between the two sectors.
Factors weighing on business investment in Canada
Business investment has lagged throughout the current recovery compared with previ-
ous cycles. The Bank of Canada noted that “the recovery in business investment is antici-pated to remain below what would normally be expected based on historical experience” (Bank of Canada, 2017: 15). Weak investment reflects that the stimulus from central banks has failed to spark growth in the overall economy giv-ing firms little means and few incentives to invest. Record low interest rates and improved balance sheets should have made investment more attractive but has not done so. In particu-lar, very high rates of capacity utilization have not elicited more manufacturing investment, notably in Ontario where a loss of competitive-
Figure 5: Non-Residential Business Investment per Worker in OECD Countries, 2015-2017 Average (in $US 2010)
Notes:(1) Comparable data is not available for OECD countries not listed here.(2) 2016 is preliminary data and 2017 is projected by OECD.Sources: OECD Economic Outlook, June 2017; calculations by author.
7,478
7,599
9,290
10,182
10,437
10,607
11,037
11,435
11,558
12,434
13,566
13,913
14,122
14,538
14,889
15,359
17,423
0 2,000 4,000 6,000 8,000 10,000 12,000 14,000 16,000 18,000 20,000
United Kingdom
New Zealand
Canada
Finland
Germany
Iceland
Denmark
Japan
Netherlands
France
Sweden
Australia
Norway
Korea
United States
Belgium
Switzerland
US$ 2010

Business Investment in Canada Behind Other Countries
fraserinstitute.org FRASER RESEARCH BULLETIN 10
ness plays a role. The Bank of Canada also cites structural factors such as slower labour force growth and uncertainty over US economic pol-icy for low business investment levels. Instead, whenever business firms in North America need to expand output, they have done so by boost-ing labour and not capital inputs, as reflected in weak productivity growth.
While the macroeconomic determinants of business investment are complex and not very
well understood,3 some broad parameters
3 While well-developed theories of consumption, housing, and international trade exist, business investment has always been somewhat of a black box for economists, partly because so few have at-tempted to explain and test their theories beyond basic tenets such as the importance of the after tax rate of return on investments and the role of capac-ity utilization (concerning whether firms do not have the capacity to raise output or have excess capacity). For recent evidence on how increased uncertainty
Figure 6: Total (Public and Private) Services and Manufacturing Investment as Share of GDP in OECD Countries, 2010-2015 Average
Notes:(1) Total investment includes investment by governments.(2) Italy is excluded due to a lack of industry level data for 2015.(3) Services includes industries other than: agriculture, forestry and fishing; mining and quarrying; manufacturing; public administration and defence, compulsory social security; education; human health and social work activities.Sources: OECD National Accounts at a Glance; OECD.Stat; calculations by author.
0% 5% 10% 15% 20% 25%
Canada
Australia
Greece
United States
Netherlands
United Kingdom
Denmark
Hungary
Ireland
Finland
Germany
Slovak Republic
France
Austria
Estonia
Belgium
Sweden
Czech Republic
Services Manufacturing

Business Investment in Canada Behind Other Countries
fraserinstitute.org FRASER RESEARCH BULLETIN 11
are known to affect why business investment is high in some countries and low in others. Clearly the rate of return on investments is an important variable. So the rate at which capi-tal is taxed is important. In terms of taxes on corporate income, Canada took some impor-tant steps starting in the 1990s to improve its competitiveness by lowering corporate income taxes (especially while the US maintained one of the highest corporate tax rates in the world, although its effective tax rate was lower than its punishing statutory rate of 35 percent). However, recently the overall tax rate on capi-tal has started to creep up again in Canada. The marginal effective tax rate on capital (which measures all taxes on capital, not just corporate income taxes) rose from 17.5 percent in 2012 to 20.0 percent in 2015 (figure 7). The higher tax rates on capital continued after profits began to fall precipitously after mid-2014.
Large government deficits and debts are another factor that depresses business invest-ment. They do so by creating uncertainty about the future among entrepreneurs and inves-tors who expect the run up in government debt to eventually lead to higher taxes. Moreover, a recent study for the National Bureau of Eco-nomic Research found in the US “robust evi-dence of ‘crowding out,’ a tendency for higher levels of government debt to reduce the level of corporate borrowing” (Dwyer, 2017). This is a significant finding since the US has much deeper and more diversified capital markets than in Canada. Rising government borrowing by federal and provincial governments may have an even greater crowding out effect in Canada’s thin
about economic policies (i.e., taxes, government spending, regulations, and monetary policy) ad-versely affects investment, see Baker, Bloom, and Davis (2016, March 10).
capital markets if firms do not have ready access to US capital markets.
As noted, the reluctance to invest more is espe-cially surprising for manufacturing, where high capacity utilization and a lower dollar should have stimulated investment. There is an important regional dimension to the weak-ness in manufacturing investment, with per-sistent slack in Ontario where industry faces a host of competitive challenges resulting from high costs imposed by the provincial govern-ment for labour, electricity, and regulation (see Cross, 2017). The giant auto parts maker Magna provided a visible example of the real-life effect of these costs. In July 2017 Magna testified at a government hearing on the proposed over-haul of labour legislation that the high cost of operating in Ontario had led it to reconsider
Figure 7: Canada’s Marginal Effective Tax Rate on Capital Investment, 2012-2015
Source: Bazel and Mintz (2016).
17.5
18.8 19.0
20.0
16.0
16.5
17.0
17.5
18.0
18.5
19.0
19.5
20.0
20.5
2012 2013 2014 2015
Perc
ent

Business Investment in Canada Behind Other Countries
fraserinstitute.org FRASER RESEARCH BULLETIN 12
future investments and production in the prov-ince, especially as neighboring states in the US are pursuing policies to attract investment. If Keynes was right and animal spirits are impor-tant to investment, it is important to under-stand that businesses are quite dispirited in Ontario with the lowest business confidence in the country.
Falling corporate profits have been another fac-tor constraining business investment in recent years. While the popular image is that corpo-rations are sitting on large profits, the real-ity is that profitability has never returned to its pre-recession peak in 2008 and more recently substantial declines were posted after the oil price crash. According to data on net prof-its from Statistics Canada’s National Accounts, profits peaked at $294.2 billion (at annual rates) in the second quarter of 2008. Profits hovered around $280 billion in 2011 and again in 2014, but then plunged by one-third to $190.5 billion in the second quarter of 2016. Moreover, firms spent what little profit they made in 2015 and 2016, unable to cut investment spending as fast as incomes fell. Corporations became net bor-rowers in 2015 (see figure 8) to sustain even the low level of investments in those years because they could not cut investment spending as fast as profits were falling. This reality is sharply at odds with the false picture of firms sitting on large piles of “dead money” waiting to be spent. The fact that firms had to borrow funds to sus-tain investment also means they were in direct competition with governments to raise funds in financial markets, increasing the importance of crowding out in Canada.
More broadly, the shrinking profitability of investments in Canada, especially in the oil and gas sector, appears to be discouraging foreign investment in Canada. Most of the large for-eign-controlled multinationals operating in the
oil sands have sold their interests to Canadian companies. More recently, Malaysia’s Petronas announced it would not pursue a $36 billion investment in liquefied natural gas in BC. The withdrawal of investments in Canada by foreign companies removes an important source of funding and signals fewer new energy projects will be undertaken in the future.
However, not all the reasons for weak business investment are readily understood. As noted at the start of this section, economists have rela-tively few theories of the behaviour of invest-ment and this applies to Canada. For example, it is hard to explain why investment in Canada’s finance industry has been very weak in recent years despite a sterling international reputation and a proliferation of technological innovation.
Figure 8: Net Lending by Canadian Corporations, Billions (Nominal)
Source: Statistics Canada, CANSIM Table 380-0076.
-10
0
10
20
30
40
50
60
70
80
Billi
ons (
nom
inal
)

Business Investment in Canada Behind Other Countries
fraserinstitute.org FRASER RESEARCH BULLETIN 13
Conclusion
Anemic business investment has contributed to the weak recovery of Canada’s economy after 2009. More importantly, low levels of invest-ment inhibit productivity growth, one of the key determinants of living standards in the long-run. Investment has been weak in most of the OECD. Nevertheless, Canada’s investment rate and its investment per worker were both among the lowest in the OECD despite the pre-2015 boom in the energy sector.
Is Canada investing productively, to answer Peter Drucker’s challenge? It was appropriate to expand capacity in the energy sector during a decade of high oil prices. But Canada has failed to invest in productivity enhancing machinery and equipment for decades. Meanwhile, the oil price crash in 2015 did lead to a sharp cutback in investment in the oil sector, especially from for-eign-owned firms. However, there was no sign of an accompanying shift in investment into manu-facturing and services, which should have picked up some of this slack, even in industries such as finance where profitability is high, or manufac-turing where capacity use is elevated.
References
Baker, Scott R., Nicholas Bloom, and Steven J. Davis (2015, March 10). Measuring Economic Policy Uncertainty. Economic Policy Uncertainty. <http://www.policyuncertaint.com/media/BakerBloomDavis.pdf>, as of October 5, 2017.
Bank of Canada (2017). Monetary Policy Report (July). Bank of Canada.
Bazel, Philip, and Jack Mintz (2016). 2015 Tax-Competitiveness Report: Canada is Losing its Attractiveness. SPP Research Papers 9, 37 (November). School of Public
Policy, University of Calgary. <https://www.policyschool.ca/wp-content/uploads/2016/12/Tax-Competitiveness-Bazel-Mintz.pdf>, as of October 5, 2017.
Caballero Ricardo. J. (1999). Aggregate Investment. In John Taylor and Michael Woodford (eds.). Handbook of Macroeconomics. Volume 1B. Elsevier.
Cross, Philip (2017). Ontario’s One Cylinder Economy (July). Fraser Institute.
Driver, Ciarian, and Paul Temple (2003). Capital Investment: What are the Main Long Term Trends in Relation to the United Kingdom Manufacturing Business and How Do These Compare Internationally? The Future of Manufacturing Project: Evidence paper number 8 (October). UK Government Office for Science. <https://www.gov.uk/government/uploads/system/uploads/attachment_data/file/283884/ep8-capital-investment-trends-uk-manufacturing.pdf>, as of October 4, 2017.
Drucker, Peter (2017). They’re Not Employees, They’re People. In The Peter F. Drucker Reader. Harvard Business Review Press.
Gunn, Dwyer (2017). When Government Borrows Heavily, Firms Reduce Leverage. NBER Digest (June).
Jorgenson, Dale and Steven Landefeld (2006). Blueprint for Expanded and Integrated U.S. Accounts: Review, Assessment, and Next Steps. In Dale Jorgensen, Steven Landefeld, and William Nordhaus (eds.). A New Architecture of the U.S. Economic Accounts. University of Chicago Press.
Minsky, Hyman (1986). Stabilizing an Unstable Economy. Yale University Press.
OECD (2017). OECD Economic Outlook. Organisation for Economic Cooperation and

Business Investment in Canada Behind Other Countries
fraserinstitute.org FRASER RESEARCH BULLETIN 14
Copyright © 2017 by the Fraser Institute. All rights re-served. Without written permission, only brief passag-es may be quoted in critical articles and reviews.
ISSN 2291-8620
Media queries: call 604.714.4582 or e-mail:
Support the Institute: call 1.800.665.3558, ext. 586, or
e-mail: [email protected]
Visit our website: www.fraserinstitute.org
Philip Cross worked for 36 years at Statistics Canada, the last few as its Chief Economic Analyst. He wrote Statistics Canada’s monthly assess-ment of the economy for years, as well as many feature articles for the Canadian Economic Observer. After leaving Statistics Canada, he has worked as a contract researcher for a variety of organizations. He has been widely quoted over the years, and now writes a bi-weekly column for the National Post and other papers.
AcknowledgmentsThe author would like to thank Charles Lammam, Milagros Palacios, and Hugh MacIntyre of the Fraser Institute for their research assistance, as well as the anony-mous reviewers for their comments, sug-gestions, and insights. Any remaining errors or oversights are the sole responsibility of the author. As the researcher has worked independently, the views and conclusions expressed in this paper do not necessar-ily reflect those of the Board of Directors of the Fraser Institute, the staff, or supporters.
Development. <http://www.oecd.org/eco/outlook/economic-outlook/>, as of Oct. 5, 2017.
OECD.Stat. Table 8A: Capital Formation by Activity. Web table. Organisation for Economic Cooperation and Development. <https://stats.oecd.org/Index.aspx?DataSetCode=SNA_TABLE8A#>, as of September 6, 2017.
OECD.Stat. National Accounts at a Glance. Web table. Organisation for Economic Cooperation and Development. <https://stats.oecd.org/Index.aspx?DataSetCode=NAAG>, as of October 5, 2017.
Rao, Someshwar, Jianmin Tang, and Weimin Wang (2003). Canada’s Recent Productivity Record and Capital Accumulation (July). Industry Canada.
Statistics Canada. Cansim Table 029-0045: Capital and Repair Expenditures, Non-Residential Tangible Assets, by North American Industry Classification System (NAICS), Canada, Provinces and Territories. Government of Canada. <http://www5.statcan.gc.ca/cansim/a26?lang=eng&id=290045>, as of Oct. 4, 2017.
Statistics Canada. CANSIM Table 380-0064: Gross domestic product, expenditure-based. Government of Canada. <http://www5.statcan.gc.ca/cansim/a26?lang=eng&id=3800064>, as of October 5, 2017.
Statistics Canada. Cansim 380-0076: Current and capital accounts—Corporations. Government of Canada. <http://www5.statcan.gc.ca/cansim/a26?lang=eng&id=3800076>, as of Oct. 4, 2017.