business environments to ``make in india'' by japanese …agricultural) 0% 0% 0% total...
TRANSCRIPT

Business Environments to ``Make in India''
by Japanese Firms
Takahiro Sato
(Kobe University)
1
June 17, 2015Policy Research Institute

Outline
1. Introduction
2. The Results of Questionnaire Survey (2013-14)
(1) Responding and Non-Responding Japanese Companies
(2) Current Situation of Responding Japanese Companies
3. Concluding Remarks
Appendix: Overview of Japanese Companies in India
2
1. Introduction
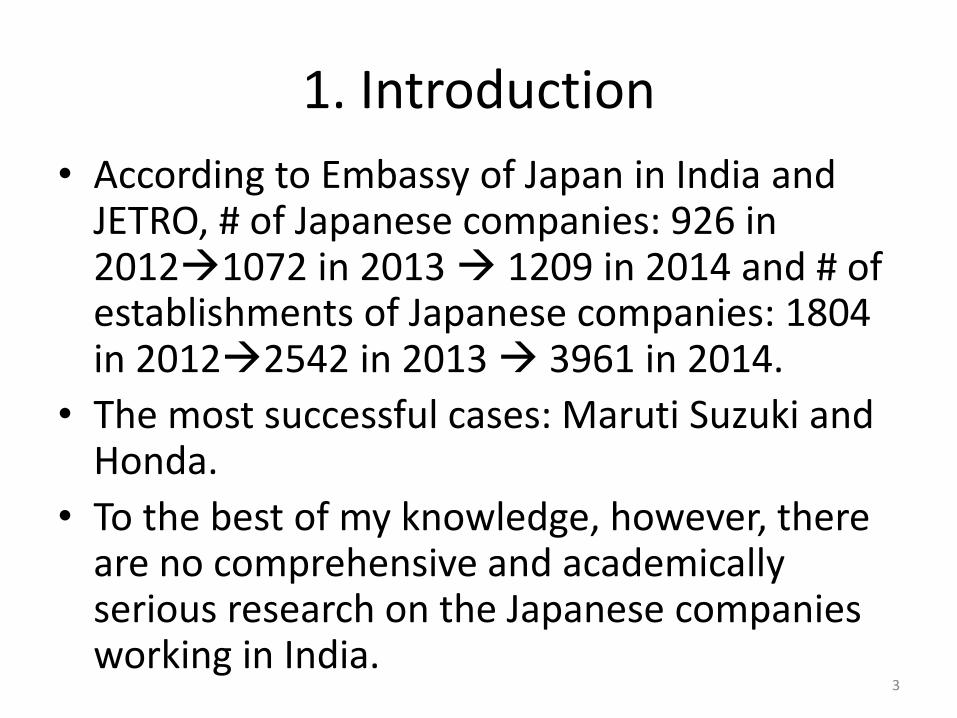
• According to Embassy of Japan in India and JETRO, # of Japanese companies: 926 in 20121072 in 2013 1209 in 2014 and # of establishments of Japanese companies: 1804 in 20122542 in 2013 3961 in 2014.
• The most successful cases: Maruti Suzuki and Honda.
• To the best of my knowledge, however, there are no comprehensive and academically serious research on the Japanese companies working in India.
3

• FDI spillover channels: (1)Horizontal effect with newly acquired knowledge spilling out from foreign-affiliated firms as skilled local workers change companies, (2)Vertical effect whereby new technology is introduced from foreign-affiliated firms to domestic firms though the industrial input-output relations
• Our paper recently shows the positive FDI spillovers through backward industrial linkages in enhancing the productivity of the Indian manufacturing sectors*.
*Azusa Fujimori and Takahiro Sato (2015) ``Productivity and technology diffusion in India: The spillover effects from foreign direct investment,'' Journal of Policy Modeling, 37, pp. 630-651.
• Significant contribution of foreign-affiliated firms to ``Make in India'' can be expected. 4
Academic Contribution of This Study
• Making of ``population list’’ of Japanese companies attached with the basic corporate information.
• Based on it, a questionnaire survey was done to all companies of ``population list.’’ The current situation of the 113 responding companies is investigated. The difference between responding and non-responding companies is also examined.
• The study investigates the business environments faced by the Japanese companies working in India. 5

2. The Results of Questionnaire Survey (2013-14)
(1) Responding and Non-Responding Japanese Companies
6
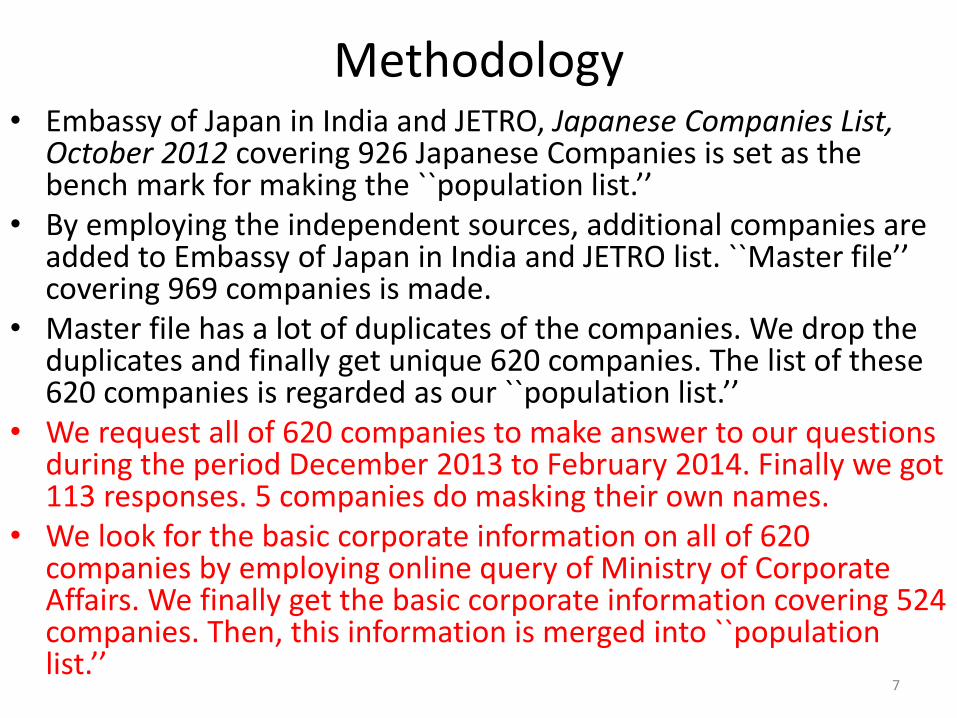
Methodology• Embassy of Japan in India and JETRO, Japanese Companies List,
October 2012 covering 926 Japanese Companies is set as the bench mark for making the ``population list.’’
• By employing the independent sources, additional companies are added to Embassy of Japan in India and JETRO list. ``Master file’’ covering 969 companies is made.
• Master file has a lot of duplicates of the companies. We drop the duplicates and finally get unique 620 companies. The list of these 620 companies is regarded as our ``population list.’’
• We request all of 620 companies to make answer to our questions during the period December 2013 to February 2014. Finally we got 113 responses. 5 companies do masking their own names.
• We look for the basic corporate information on all of 620 companies by employing online query of Ministry of Corporate Affairs. We finally get the basic corporate information covering 524 companies. Then, this information is merged into ``population list.’’
7

Characteristics of Responding Companies and Non-responding
Companies
• 5 anonymous companies are excluded from the group of responding companies.
• Response rate: 17%.
• Share of capital of responding companies: 10%.
• Average capital of responding companies is also smaller. 8
Non-responding
Responding TotalResponding/
TotalNumber of companies 512 108 620 17%Number of identifiedcompanies
432 92 524 18%
Capital(Rupee in hundredsof million)
5763 637 6400 10%
Average capital(Rupee inhundreds of million)
13.34 6.92 12.21 87%

Characteristics of Responding Companies and Non-responding Companies(2)
• Responding companies' share of commerce/ transportation is larger and that of manufacturing (transport equipment) is less. 9
Non-responding
Responding Total
Others 3% 1% 3%Other services 21% 19% 20%Commerce, transportation 20% 28% 21%Manufacturing(Others) 12% 8% 11%Manufacturing(Chemical and medicine) 7% 10% 7%Manufacturing(Machinary) 16% 19% 16%Manufacturing(Metals) 3% 4% 3%Manufacturing(Transport equipments) 19% 10% 18%Manufacturing(Food) 0% 0% 0%Manufacturing(Agricultural) 0% 0% 0%
Total 100% 100% 100%

Characteristics of responding Companies and Non-responding Companies(3)
• Location of responding companies is more in Delhi and Haryana and less in Tamil Nadu.
10
Non-responding
Responding Total
Andhra Pradesh 0% 1% 0%Daman and Diu 0% 0% 0%Delhi 35% 50% 37%Gujarat 0% 1% 0%Haryana 17% 24% 18%Himachal Pradesh 0% 0% 0%Jharkhand 0% 0% 0%Karnataka 4% 5% 4%Kerala 1% 0% 0%Maharashtra 9% 5% 8%Orissa 0% 0% 0%Pondicherry 0% 0% 0%Punjab 1% 0% 0%Rajasthan 2% 3% 2%Tamil Nadu 20% 7% 18%Uttar Pradesh 1% 1% 1%West Bengal 2% 2% 2%Unknown 8% 2% 7%
Total 100% 100% 100%

Characteristics of responding Companies and Non-responding Companies(4)
Characteristics of responding Companies and Non-responding Companies(5)
Characteristics of responding Companies and Non-responding Companies(6)
11
Non-responding
Responding Total
Non-governmental company 58% 48% 56%Foreign subsidiary company 26% 35% 28%Other company 1% 2% 1%Non-company 16% 15% 15%
Total 100% 100% 100%
Non-responding
Responding Total
Listed company 5% 3% 5%Unlisted company 79% 82% 80%Non-company 16% 15% 15%
Total 100% 100% 100%
Non-responding
Responding Total
Private limited company 67% 77% 69%Public limited company 18% 9% 16%Non-company 16% 14% 15%
Total 100% 100% 100%
• Responding Companies’ share of foreign subsidiary company and private limited company is larger.

Establishment Year, Number of Companies and Capital
Note: 1981 is the year when Anchor Panasonic and Maruti Suzuki were established and 1995 is the year when TTSL (Tata Teleservices) was established.
Capital
Number of companies
12

3. The Results of Questionnaire Survey (2013-14)
(2) Current Situation of Responding Japanese Companies
13

14
2% 2%
40%
1%
26%
2%
1%
13%
2% 11%
The Reason of Investment in IndiaDA
There are a stable supplier of parts and raw materialsin India
Easy to respond to the Indian market needs
Expectations for the Indian market
Demands of neighboring countries are strong andfuture expansion canbe expected
Easy to secure human resources with qualified labors
Low cost of materials including raw materials,manufacturing process,transportations,land andbuildingsPenetrated along with the parent company or businesspartners,etc.
Low labor cost

15

16

Employment Situation
17
Average Min Max TotalNumber of employees 212 1 3000 23579Japanese nationality 5 1 90 580Local Japanese employees 1 0 10 60Temporary staff 137 0 5000 12291Turnover 9 0 100 811

18

19

20

21

22
23
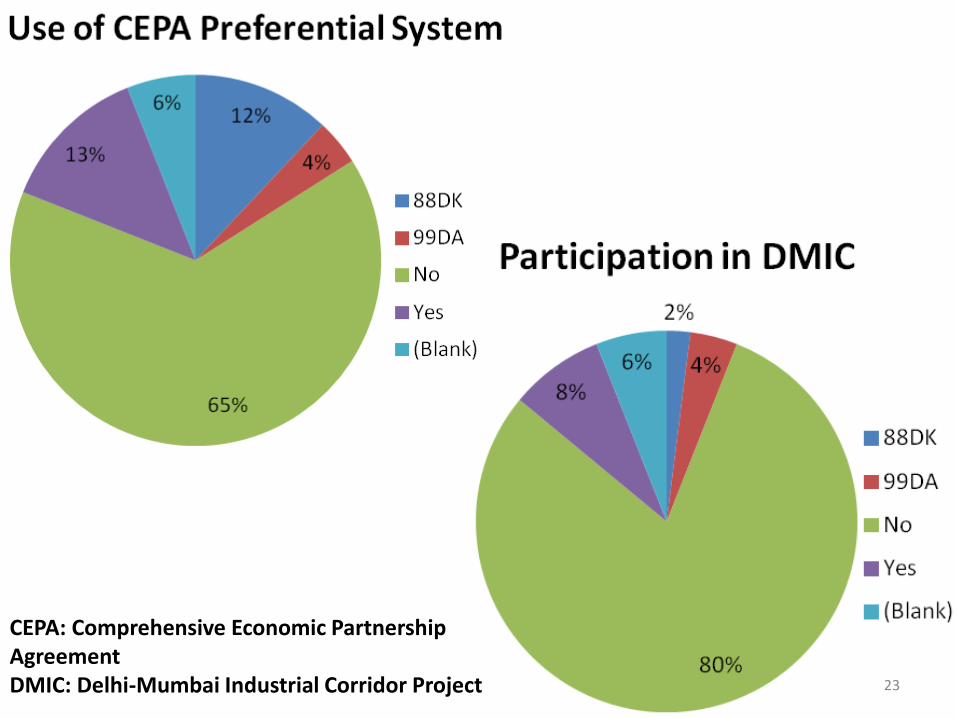
CEPA: Comprehensive Economic Partnership AgreementDMIC: Delhi-Mumbai Industrial Corridor Project
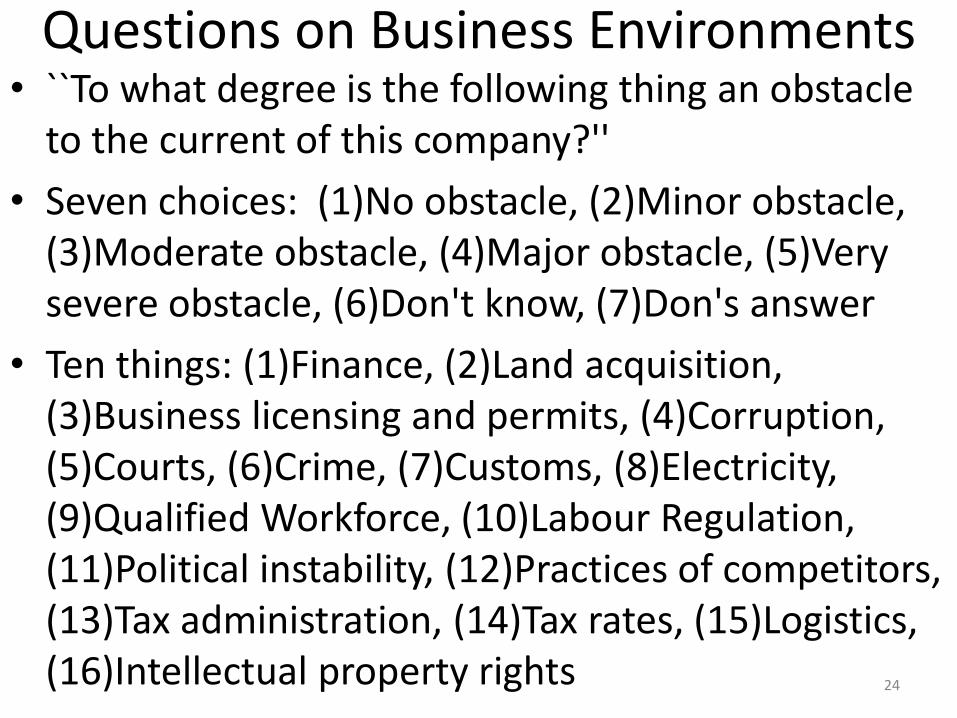
Questions on Business Environments• ``To what degree is the following thing an obstacle
to the current of this company?''
• Seven choices: (1)No obstacle, (2)Minor obstacle, (3)Moderate obstacle, (4)Major obstacle, (5)Very severe obstacle, (6)Don't know, (7)Don's answer
• Ten things: (1)Finance, (2)Land acquisition, (3)Business licensing and permits, (4)Corruption, (5)Courts, (6)Crime, (7)Customs, (8)Electricity, (9)Qualified Workforce, (10)Labour Regulation, (11)Political instability, (12)Practices of competitors, (13)Tax administration, (14)Tax rates, (15)Logistics, (16)Intellectual property rights 24

25
42%
21%
11%
3%3%
9%
3%8%
Finance No obstacle
Minor obstacle
Moderate obstacle
Major obstacle
Very severe
obstacle88DK
99DA
(Blank)

26

27

28

29
41%
9%11%
7%
2%
18%
3% 9%
Courts No obstacle
Minor obstacle
Moderate obstacle
Major obstacle
Very severeobstacle88DK
99DA
(Blank)

30

31

32

33
34

35

36

37

38

39

40


• The results of questionnaire survey in section 2 shows:(1) Responding companies have the following characteristics: more NCR in location, less transport equipment and more commerce/ transportation in industry, and smaller in size. (2) Reason for investment in India: Many companies market potentiality not only in India but also in the neighbor countries. Indeed, some companies have export destination diversity. India as step stone for business in Africa, Middle East, and EU.(3) Local content ratio is not high. Many companies procure the goods from Japan and East Asia. Implications for exchange rate problem and the opportunities of cost advantage induced by increase of local contents.
42
(4) Employment of contract labors is common. Implications for labor laws and industrial relations.
(5) Despite of the serious recession of the Indian economy, more than half of companies have good performance.
(6) The most serious obstacle for the business is the difficulty to obtain good human resources (turnover rate is also high). Implication for ``Skill Development’’ for promoting ``Make in India.’’ Many companies suffer from inadequate infrastructure and strong regulations (ex. High tax rate, inflexible and retrospective tax administration and introduction of MAT to SEZs).
(7) A few Japanese companies involve the CEPA and the DMIC. Further investigation of low utilization of preferential tax treatment under the CEPA is needed.
43

Appendix: Overview of Japanese Companies in India
• Ministry of Finance, Situation of Outward and Inward Direct Investment, and Process of Outward/ Inward Direct Investment.
• Toyokeizai, Kaigai Sinsyutsu Kigyo Souran.
• Ministry of Economy, Trade and Industry, Survey of Overseas Business Activities.
45
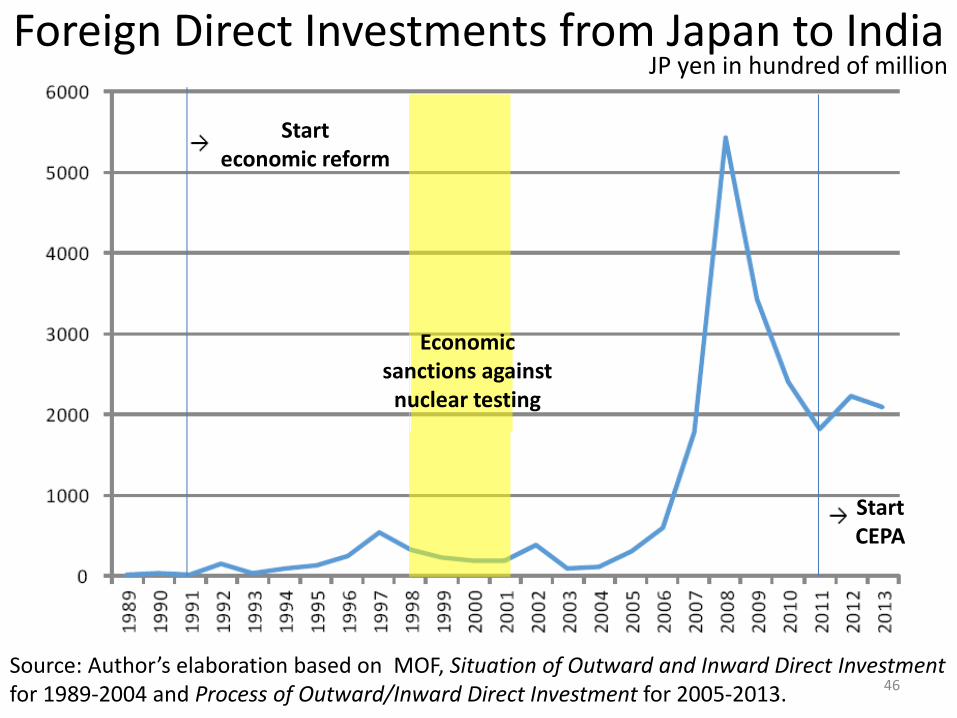
Foreign Direct Investments from Japan to IndiaJP yen in hundred of million
Source: Author’s elaboration based on MOF, Situation of Outward and Inward Direct Investment for 1989-2004 and Process of Outward/Inward Direct Investment for 2005-2013.
Start economic reform
Start CEPA
Economic sanctions against
nuclear testing
46

Source: Author’s elaboration based on Toyokeizai, Kaigai Sinsyutsu Kigyo Souran.
Number of Japanese Companies, Employees and Capital in India
the number of firms
the number of employees
(00)
Capital (Rupee in
hundreds of million, right axis )
.47

Japanese Companies’ Average Capital in India
Average capital(Rupee in million)
The average number of employees
48Source: Author’s elaboration based on Toyokeizai, Kaigai Sinsyutsu Kigyo Souran.

The source:http://www.freemap.jp/itemDownload.php?b=asia&s=india&t=gif
49

North
North
North
Locations of Japanese CompaniesBlank
West Bengal
Rajasthan
Maharashtra
Bihar
Punjab
Haryana
Delhi
Chandigarh
Tamil Nadu
Daman
Goe
Kerala
Gujarat
Karnataka
UP
Mp
Hp
50Source: Author’s elaboration based on Toyokeizai, Kaigai Sinsyutsu Kigyo Souran.

Transport equipment
Agricultural products and foodstuff
Electric power and gas
Electrical and electric equipment
Steel and metal
textile
Life insurance
Information and communication
Commercial, logistics and travel
Mining and petroleum and coal
Construction
Finance and Insurance
Machinery and precision machine
Chemically and medicine
Other manufacturing
Other service industry
Industrial Sectors of Japanese Companiesin India
51Source: Author’s elaboration based on Toyokeizai, Kaigai Sinsyutsu Kigyo Souran.

Distribution of Japanese Companies’ CapitalAcross States
Blank
West Bengal
Rajasthan
Maharashtra
Bihar
Punjab
Haryana
Delhi
Chandigarh
Tamil Nadu
Daman
Goe
Kerala
Gujarat
Karnataka
UP
MP
Maharashtra
Haryana
Karnataka
Delhi
52Source: Author’s elaboration based on Toyokeizai, Kaigai Sinsyutsu Kigyo Souran.
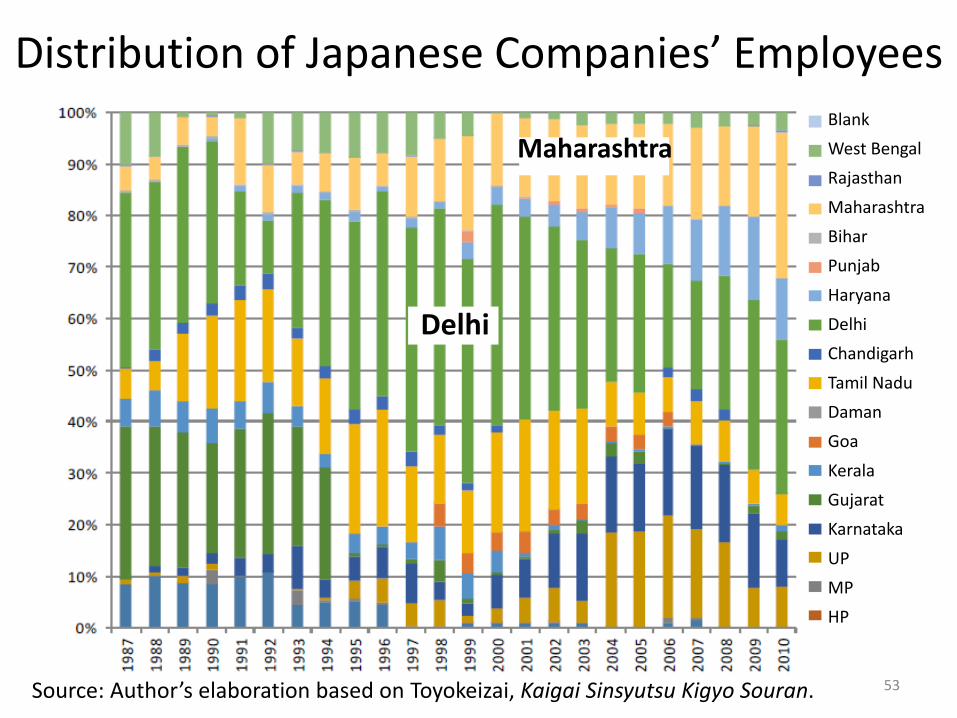
Distribution of Japanese Companies’ EmployeesBlank
West Bengal
Rajasthan
Maharashtra
Bihar
Punjab
Haryana
Delhi
Chandigarh
Tamil Nadu
Daman
Goa
Kerala
Gujarat
Karnataka
UP
MP
HP
Maharashtra
Delhi
53Source: Author’s elaboration based on Toyokeizai, Kaigai Sinsyutsu Kigyo Souran.

Number of Japanese Companies in India
Manufacturing industry
Transport equipment
Total
54Source: Author’s elaboration based on METI “Survey of Overseas Business Activities”.

Manufacturing industry
Transport equipment
Total
Japanese Companies’ Sales in IndiaJP yen in million
55Source: Author’s elaboration based on METI “Survey of Overseas Business Activities”.

Manufacturing industry
Transport equipment
Total
Number of Japanese Companies’ Employeesin India
56
Source: Author’s elaboration based on METI “Survey of Overseas Business Activities”.

Summary of Appendix• Existing Statistics in Appendix shows:
(1) Since the mid-2000s, investment of Japanese companies grows especially in NCR.
(2) Transport equipment, electronics, and machinery industries dominate the Japanese investment.
(3) Maharashtra and Delhi absorb capital of Japanese companies. Recently the Japanese capital goes to Haryana.
(4) Share of transport equipment industry in terms of sales and employee is very high.
• Long-term economic relation between India and Japan: Cotton era Iron era Car era (Pls. see Takahiro Sato (2012), ``Economic Relations between India and Japan, ‘’ Eurasian Geography and Economics, Vol.53, No.4, pp.457-478.)
57