business demographics, economic trends, opportunities, and...
TRANSCRIPT

Business Demographics, Economic Trends, Opportunities, and Challenges to the
Mason County Economy
Phase III Report
July, 2017

2 | P a g e
310 W. Cota Street Shelton, WA 98584
360.426.2276
Contents Acceptance and Appreciation ...................................................................................................................................... 3
Executive Summary ..................................................................................................................................................... 4
Letter from the Director .............................................................................................................................................. 5
Introduction, Background ............................................................................................................................................ 7
Methodology ............................................................................................................................................................... 8
The Mason County Business Base ................................................................................................................................ 9
Mason County Economic Snapshot ........................................................................................................................... 10
Benchmark Analysis ................................................................................................................................................... 39
Impact of Growth Management Act .......................................................................................................................... 61
Findings and Recommendations................................................................................................................................ 67
Appendix A ................................................................................................................................................................ 70
UGA’s, RAC’s and Hamlets in Mason County......................................................................................................... 70
Appendix B ................................................................................................................................................................ 72
Matrix of Permitted Uses ...................................................................................................................................... 72
Appendix C ................................................................................................................................................................ 74
Technical Notes on Composition .......................................................................................................................... 74

3 | P a g e
310 W. Cota Street Shelton, WA 98584
360.426.2276
Acceptance and Appreciation
This report could not have been completed without the support and contributions of many. We want to thank and recognize those who helped complete this effort.
Economic Development Council of Mason County James Thomas, President
Kristin Masteller, Vice Chair Wes Taylor, Secretary Treasurer
Curt Adcock Pat Cusack Randy Neatherlin Danette Brannin Lance Deyette Dave Overton Kristy Buck Rob Drexler Ray Peters Jennifer Capps Teresa McDermott Rick Schmeling Scott Cooper Donna Moir Fred Wright Gary Cronce Joel Myer
The EDCMC accepted and approved this report at their regular meeting on July 13, 2017.
Research assistance was provided by:
Jaclyn Woodson, Program Manager Office of Economic Development and Competitiveness Washington State Department of Commerce
Jason Wells, GIS Tech
Mason County Public Works
Loretta Swanson, Public Works Technical Services Manager Mason County Public Works
And the staff of the Economic Development Council of Mason County, comprised of:
Lynn Longan, Executive Director Jennifer Baria, Business Development Director Karin Leaf, Administrative Assistant
Editorial revue was provided by Jordan Miller, Marilyn Vogel and Paula Reeves

4 | P a g e
310 W. Cota Street Shelton, WA 98584
360.426.2276
Executive Summary
This report represents a third in a series of assessments of the state of business in Mason County. Previous productions were labeled as “phases” so in keeping with past tradition this one is titled “Phase III.” The report finds Mason County to be economically mixed with expanding business sectors in Retail and Healthcare which are offset by contractions in Manufacturing and Real Estate. This points to an economy in transition. Transition leads to change and change to a new and different tomorrow. Personal income lags behind state and national averages which is a result of a move from higher paid technical jobs to lower paid service opportunities. This challenges Mason County while providing the opportunity to focus and target business development and recruitment efforts on businesses that support a higher wage. Through its 2015 strategic planning effort “Strategic Solutions” the EDC has identified industries such as healthcare, information & communications technology, and advanced manufacturing. There are gaps in the economy that are directly related to these industries, thereby giving economic development officials the opportunity to explore targeted marketing and recruitment efforts. When compared to its peers in the benchmark analysis, Mason County holds its own in many cases. Mason County has the second highest population growth rate in the comparison study, experiencing strong Retail growth and Finance & Insurance sales as well as the provision of Heath Care services. Contractions in Manufacturing and Professional Services present challenges for Mason County. Agriculture sales declined in every peer analysis where data was available. Looking at the comparison between Mason County and counties with a similar economic base has helped provide insight as to where economic improvement can be achieved by building strategies for growth. This evaluative process provides a knowledge base upon which future directives can be based. The impact of the Growth Management Act continues to dis-incent the business community outside of the development zones. With almost half of the business base in the county outside of development areas, the challenges for corporate investment into real estate assets can be significant. The need for compromise presents itself now more than ever in order to foster the growth of investment and jobs in Mason County.

5 | P a g e
310 W. Cota Street Shelton, WA 98584
360.426.2276
Letter from the Director
Moving an economy forward is an important driver for any economic development office. At its heart, economic development is about building strong and prosperous economies that result in communities where people seek to live and raise their families and businesses locate to employ those individuals. The programs we offer add to the Mason County economy by: Increasing the Tax Base: This results in additional revenue that supports, maintains, and improves local infrastructure and public services. Our focus is on seven sectors; Aquaculture, Tourism, Forest Products, Value Added Agriculture (focus on food and beverage processing), Advanced Manufacturing, Healthcare, and Information & Communication Technology.
Job Creation: Successful economic development results in better wages, benefits and opportunities for the advancement of our residents. Business Retention: We strive to make businesses feel appreciated by the community and in turn, more likely to remain in Mason County contributing to our economy. Economic Diversification: The more we can diversify our economy in Mason County the less susceptible we are to economic fluctuations. Self Sufficiency: As we build a stronger and more diverse economic base in Mason County our dependence on outside resources diminishes. We will be much more capable of standing on our own strengths as self-sufficiency increases. Productive Use of Our Physical Assets: Property put to its highest and best use maximizes the value of that property for all concerned. Quality of Life: Better jobs result in more local tax dollars which raise the economic tide for the entire community resulting in higher standards of living for all Mason County residents. Community Pride: When economic development successes present themselves the ripple effect reaches out through the community; everyone wins and everyone feels much better as a result of those successes.
In this report, we review where Mason County is today, compare ourselves to some peer communities, and then evaluate the impact of land use controls on development and investment since the implementation of the Growth Management Act in 1990.

6 | P a g e
310 W. Cota Street Shelton, WA 98584
360.426.2276
Advancing Mason County is a continual effort coordinated through the work of many individuals and organizations. We enjoy the collaborative process of bringing important issues to the forefront and we look forward to healthy discussions on how we can make the Mason County of tomorrow so much better than what it is today.
Lynn Longan Director, EDC of Mason County

7 | P a g e
310 W. Cota Street Shelton, WA 98584
360.426.2276
Introduction, Background
Economic activity, both production and consumption, relates to the environment in two fundamental ways. We draw resources (renewable and non-renewable) from the environment to produce goods and services, and we emit wastes into the environment in the process of both producing and consuming. Conventional economic thinking says that prosperity is a function of competitiveness, and that competitiveness is a function of efficiency. But when economists think of efficiency, they usually consider only the efficiency of labor and capital. Our leaders in Mason County include other natural resources into our discussions on efficiency as we work to balance economic growth with sustainability of our resources and land. When the Growth Management Act was first implemented in Mason County in 1995 it brought with it some assumptions and controls that ran contrary to economic development practices. They included, but were not limited to:
• Most non-resource based businesses were located inside the Urban Growth Areas. Yet, the findings of the Phase II study (April 2000) showed that over two thirds (69%) were located outside of the UGA’s.
• Restricting certain land uses to Urban Growth Areas would not have a negative impact on property values. However, the Assemco plant closed in 1998. It’s building is now a non- conforming use and cannot be sold for what it was designed and constructed to do.
• Reduction in the size of development areas (UGA, RAC, Hamlets) would stimulate quality development inside the eligible growth districts.
• A reduction in the number of permitted uses outside UGA’s would be a good thing for Mason County. In fact, this premise missed the rural nature of our existing business base. Many of these businesses contribute greatly to the Mason County economy.
The Economic Development Council of Mason County (EDCMC), as a protector and guardian of Mason County’s economy, undertakes periodic reviews of the drivers and impedances affecting our economic progress. This Phase III analysis is one of many documents conducted with that goal as a priority.

8 | P a g e
310 W. Cota Street Shelton, WA 98584
360.426.2276
Methodology
This report is a third in a series1. Each report was presented as a “phase” so this one is titled “Phase III.” It builds upon findings in previous reports and it builds upon findings in previous reports and adds both internal and external evaluations to help Mason County leaders make strong economic decisions for our great county.
As such, it is also an evolution. In this Phase III version we add an economic snapshot of Mason County and then conduct a benchmark analysis against ten other comparable counties throughout the State of Washington. By expanding our breadth of analysis, we are able to conduct a more thorough examination of the status and direction of our own economy.
We initiated this study with a review of the Phase II report dated April of 2000. That report focused heavily on the newly implemented comprehensive plan that was drafted in response to the Growth Management Act. The GMA introduced the concept of Urban Growth Areas (UGA), Rural Activity Centers (RAC) and Hamlets (formerly called rural community centers). In 2000, Mason County had two UGA’s and three RAC’s. Since then, it has added another UGA and nine hamlets with the number of RAC’s remaining the same.
The Phase II report exposed the vast number of businesses that existed outside of these development zones. It drew attention to the importance and vulnerability of these businesses. Phase III continues that emphasis with added data and insight.
With regard to the economic snapshot and benchmark analysis, the EDCMC contracted with a consultant2 to prepare an independent review of both topics. Our consultant submitted their findings for our review in one of the progress meetings of the project.
Upon receipt of the draft document, the regulatory committee of the EDCMC reviewed, scrutinized and evaluated those findings. Through a series of work sessions each section of the report was edited and improved to increase its value to all who would receive its contents.
The purpose of the regulatory committee was to challenge the report’s findings. It was vitally important to the EDCMC that a quality product be released to the community. Their guidance and feedback were instrumental with developing the final body of work. The EDCMC thanks them for their contributions of time and talent.
1 The Phase II Report, “Business Demographics and the Impact of Land Use Restrictions on the Mason County Economy” was released in April of 2000. The Phase I report is no longer available. 2 Jim Mooney, DeSCo, www.descosolutions.com

9 | P a g e
310 W. Cota Street Shelton, WA 98584
360.426.2276
The Mason County Business Base
The subject of this analysis is the business community in Mason County. When we compiled our data for this analysis, we found 6,093 businesses scattered throughout the county. Of these, 1,425 were businesses with employees. The difference, 4,668 were classified as sole proprietors or cottage industries. Sole Proprietors Known as the self-employed, the sole proprietor provides work for a vast number of people not only in Mason County, but throughout our nation. Mason County reports 4,668 sole proprietors from its business roles. These businesses outnumber the 1,425 employers with aggregate payroll over three times of the employers and provide an additionally estimated $252 million in income.
A conscious decision was made not to map the sole proprietors with regard to development area status in this report because land use controls will typically not impact these individuals. Mason County’s Small Business Presence
The Small Business Administration defines a small business as an entity with operations of up to $7 million in revenue or 500 or fewer employees.3 However, that is the overall average benchmark as the actual definition varies greatly by sector. Some retail sectors have a revenue cap of $38.5 million while most agriculture sectors cap out at $750,000. Some energy sectors have a limit of 250 employees while there are manufacturing entities that can have up to 1,250 and still be considered small.
In the preparation of this report the EDCMC reviewed 2010 census data by income and size for the 23 NAICS4 codes that define different business sectors. For those sectors, and almost every business within each one, the EDCMC was able to compare that business against the size standards of the SBA. The results were insightful.
With regard known reported income, all but four businesses in Mason County fall below the caps to qualify as a small business.
3 Mason County defines small businesses as those with less than 50 employees per Marilyn Vogler 4 North American Industry Classification System

10 | P a g e
310 W. Cota Street Shelton, WA 98584
360.426.2276
Mason County Economic Snapshot
As we start our analysis, we look internally and review the performance of the Mason County economy. The purpose of this analysis is to describe demographics, jobs and income in Mason County over time comparing our changes against ourselves. Our objective is to discover and profile trends that speak to changes in our economy and identify issues we need to focus on as we direct your own future.
The Question
In this section, we ask the question, “What trends do we observe impacting the Mason County Economy?”
The Answer
An Economic Snapshot of the Mason County economy.
Through the data tables and graphs that follow, we provide insight on the Mason County economy. Here is a quick summary of what we found:
Summary Observations – Economic Snapshot Factors We Like Factors We Can Improve
Strong and accelerating population growth Large out-migration of the workforce on a daily basis
Expansion in Retail Trade and Health Care Contraction in Manufacturing and Real Estate Higher presence of Retail Trade, Manufacturing, Agriculture, and Government when compared to the State of Washington (Location Quotient)
Annual, hourly and personal income levels lag behind the State of Washington figures
Present a strong competitive advantage in the areas of Government, Retail Trade and Waste Management & Remediation (Shift Share)
Strategic location proximal to Olympia, Tacoma and Seattle
A Brief Overview Mason County was formed out of King County on March 13, 185435. The county seat, and only incorporated city, is Shelton. With a population of 10,000 individuals, Shelton houses 1/6th of Mason County’s 61,023 residents. Mason County covers 972 square miles with approximately 240 square miles within the Olympic National Park and the Olympic National Forest.
5 Wikipedia Online Encyclopedia

11 | P a g e
310 W. Cota Street Shelton, WA 98584
360.426.2276
Mason County, Washington
Along with Shelton, the US Census recognizes six census designated spaces; Allyn-Grapeview (2,917), Belfair-Tahuya (8,823), Kamilche (3,762), Skokomish Reservation (698), Timber Lake – Harstine Island (7,154), Union-Grapeview (11,906), and West Mason (6,752)6.
Mason County is due west of Tacoma; 30 miles as the crow flies and 52 miles by automobile. Slightly farther are the metropolitan areas of Seattle and Olympia. These population centers are offset by Mason’s Northwest Territory that lies within the Olympia National Forest and Olympia National Park. The Southeastern border is located on Puget Sound. The county has over 700 miles of fresh and salt water shoreline providing many beautiful vistas and opportunities for coastal interaction.7 Population Change. The County has experienced steady population growth since its first census in 1860 posting positive increases every year except 1920. This growth was especially robust from 1960 through 2010.
6 American FactFinder – 2010 Data Tables 7 Shoreline Master Plan
Population Growth 70,000
60,000
50,000
40,000
30,000
20,000
10,000
0
1860 1870 1880 1890 1900 1910 1920 1930 1940 1950 1960 1970 1980 1990 2000 2010 Est. 2016

12 | P a g e
310 W. Cota Street Shelton, WA 98584
360.426.2276
Wages and income8
In 2014, there were 13,899 jobs covered by unemployment insurance in Mason County, with a total payroll of over $510.0 million. Mason County’s average annual wage in 2014 was $36,693, below the state’s average of $55,003 representing a mere 67% of the state average compensation. While Mason County is often cited for its lower cost of living, the much lower annual wages experienced by Mason County workers result in challenges to maintain an acceptable standard of living when compared to other locations.
The median hourly wage in 2014 was $18.55, below the state’s median hourly wage of $22.61 state (excluding King County’s median hourly wage of $19.85). Mason County ranked 20th (out of 39 counties) in the state in its median hourly wage.
Personal income9
Personal income includes earned income, investment income, and government payments such as Social Security and Veterans Benefits. Investment income includes income imputed from pension funds and from owning a home. Per capita personal income equals total personal income divided by the resident population.
Personal income in 2014 lagged both the state and nation as Mason County’s per capita personal income was $35,732. While the U.S. average was $46,049 and the state average was $49,610. Mason County ranked 30th in the state (placing it in the fourth quadrant) in its per capita personal income in 2013.
The median household income in Mason County was $49,538 in 2010-2014 according to U.S. Census Bureau QuickFacts. The county’s median was less than the state’s ($60,294) and the nation’s ($53,482).
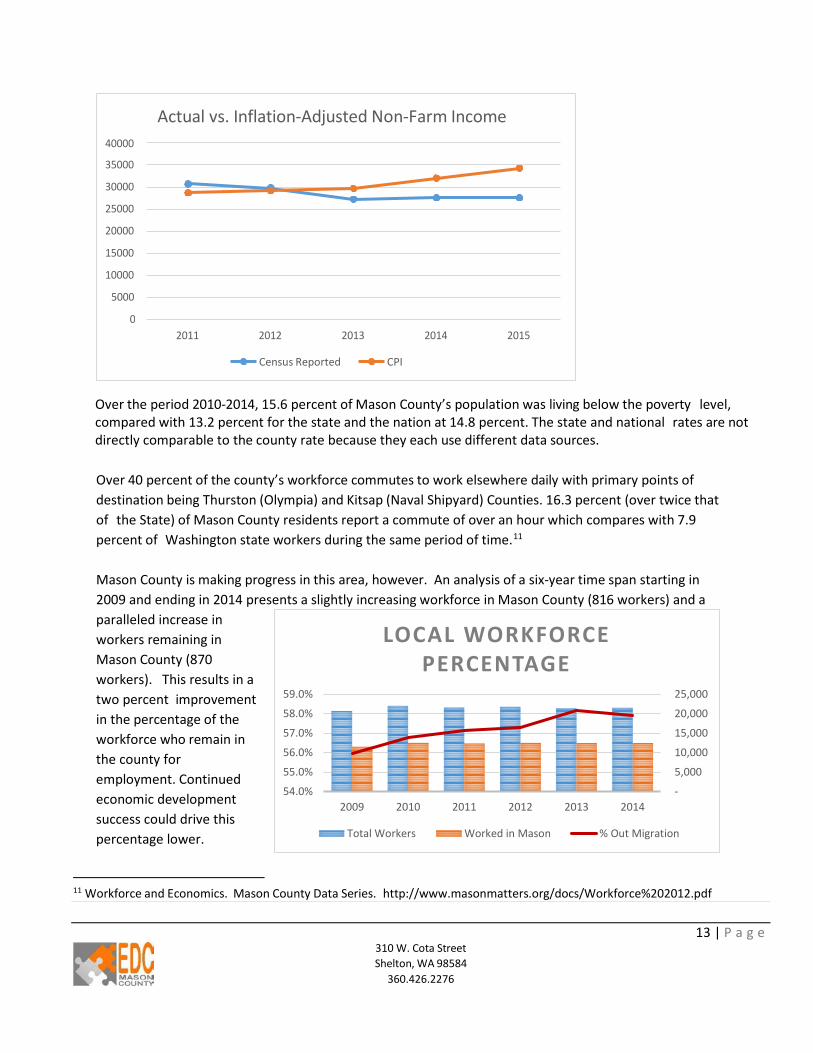
Median, Non-Farm Income is actually lower in 2015 at $28,429 than in 2011 when it was $28,641. It is significantly lower than the 2011 peak of $30,694. If income kept pace with inflation, 2015 income would have been over $34,000. Like much of the rest of the nation, real earnings have stagnated for Mason County workers. 10
8 Washington State Employment Security Department Profile for Mason County; https://fortress.wa.gov/esd/employmentdata/reports-publications/regional-reports/county-profiles/mason-county-profile 9 Washington State Employment Security Department Profile for Mason County; https://fortress.wa.gov/esd/employmentdata/reports-publications/regional-reports/county-profiles/mason-county-profile 10 American FactFinder and Bureau of Labor Statistics (for CPI)
13 | P a g e
310 W. Cota Street Shelton, WA 98584
360.426.2276
54.0%
55.0%
56.0%
57.0%
58.0%
59.0%
2009 2010 2011 2012 2013 2014 -
5,000
10,000
15,000
20,000
25,000
LOCAL WORKFORCE PERCENTAGE
Total Workers Worked in Mason % Out Migration
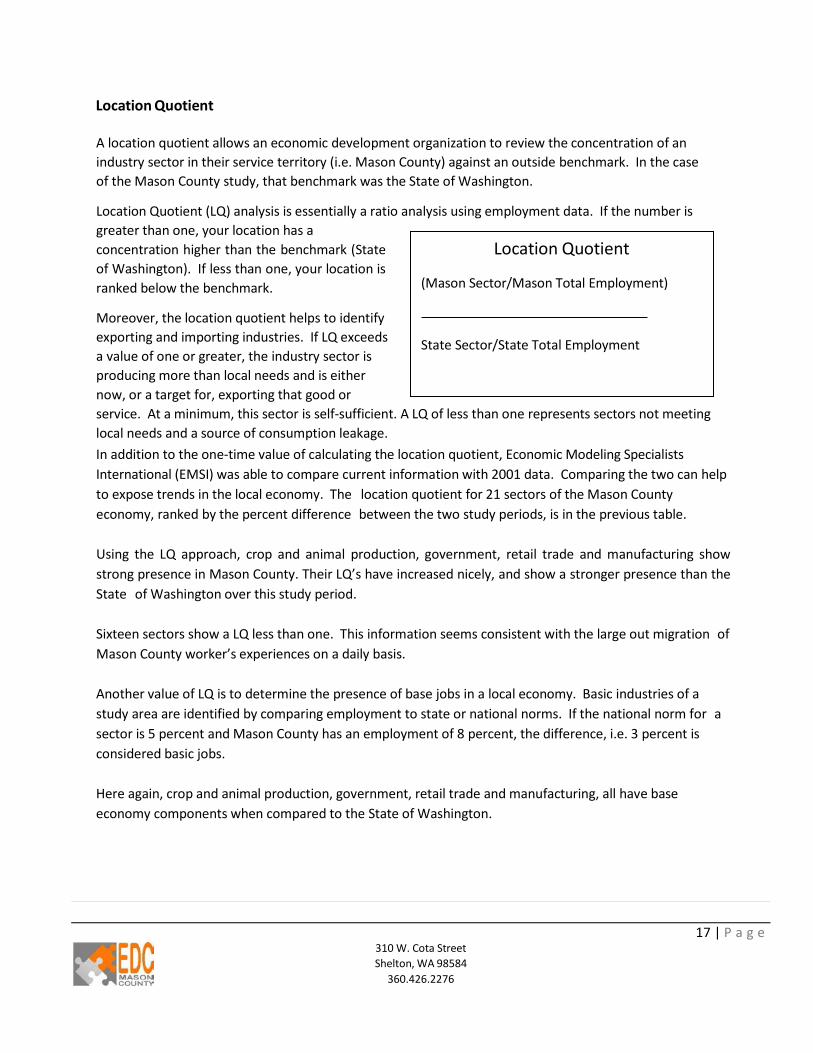
Over the period 2010-2014, 15.6 percent of Mason County’s population was living below the poverty level, compared with 13.2 percent for the state and the nation at 14.8 percent. The state and national rates are not directly comparable to the county rate because they each use different data sources.
Over 40 percent of the county’s workforce commutes to work elsewhere daily with primary points of destination being Thurston (Olympia) and Kitsap (Naval Shipyard) Counties. 16.3 percent (over twice that of the State) of Mason County residents report a commute of over an hour which compares with 7.9 percent of Washington state workers during the same period of time.11
Mason County is making progress in this area, however. An analysis of a six-year time span starting in 2009 and ending in 2014 presents a slightly increasing workforce in Mason County (816 workers) and a paralleled increase in workers remaining in Mason County (870 workers). This results in a two percent improvement in the percentage of the workforce who remain in the county for employment. Continued economic development success could drive this percentage lower.
11 Workforce and Economics. Mason County Data Series. http://www.masonmatters.org/docs/Workforce%202012.pdf
Actual vs. Inflation-Adjusted Non-Farm Income 40000
35000
30000
25000
20000
15000
10000
5000
0 2011 2012 2013 2014 2015
Census Reported CPI

14 | P a g e
310 W. Cota Street Shelton, WA 98584
360.426.2276
Employment Sectors
Using 2012 census data, the latest available, we can see the Mason County economy heavily supported by service sector jobs. The top five presenting the most establishments, jobs and/or payroll include, in descending order:
• Retail Trade • Accommodations and Food Services • Healthcare • Professional, Scientific, and Technical Services • Finance and Insurance
2012 Distribution of Employers10
NAICS Code
Description
Number of Establishments
44-45 Retail trade 134 72 Accommodation and food services 95 62 Health care and social assistance 94 81 Other services (except public administration) 80 54 Professional, scientific, and technical services 73 52 Finance and insurance 50
31-33 Manufacturing 47 53 Real estate and rental and leasing 44
56
Administrative and support and waste management and remediation services
44
42 Wholesale trade 33 48-49 (104) Transportation and warehousing (104) 28
71 Arts, entertainment, and recreation 21 51 Information 11 61 Educational services 4 22 Utilities 3
Comparing data from ten years prior, i.e. 2002, some trends in the Mason County economy begin to emerge. While many of the sectors remain stable or change very little between 2002 and 2012, some stand out with regard to their degree of change. Two that have expanded significantly are Retail Trade and Health Care & Social Services. These are generally attributed to a growing and aging population. The growth in retail sector jobs reflects the increased buying power of Mason County’s increasing
10 American FactFinder

15 | P a g e
310 W. Cota Street Shelton, WA 98584
360.426.2276
population. However, retail sector jobs tend to be entry level jobs resulting in higher turnover rates than other sectors. Healthcare careers tend to see longer employment trends, matched by better overall compensation, so expansion in this sector is generally favored when compared to retail sector growth.
Mason County Growth Sectors NAICS Description Change (2002 – 2012) in:
Establishments Sales (1,000’s) Payroll (1,000’s) Employment 44 - 45 Retail Trade -2 135,872 9,019 20 62 Health Care &
Social Services -5 73,455 31,912 386
Two that have contracted significantly are Manufacturing and Real Estate. Employment decline in these areas is generally attributed to much greater efficiencies in manufacturing and the economic recession that started in 2008/09 with its impact on real estate sales.
Mason County Contracting Sectors NAICS Description Change (2012 – 2002) in:
Establishments Sales (1,000’s) Payroll (1,000’s) Employment 31 – 33 Manufacturing -3 -58,179 -13,152 -524 53 Real Estate -10 -6,043 1 -25
Since manufacturing jobs traditionally pay better than most service sector jobs, the loss in manufacturing employment means that fewer people enjoy this higher standard of living. This has a ripple effect resulting in fewer expendable dollars on Main Street and less tax revenue paid into public coffers. All sectors of the economy are impacted when high paying jobs disappear. The largest employers in Mason County support these observations. Of the 20 largest employers driving the economy in the County, 18 are representatives of the service sector.

16 | P a g e
310 W. Cota Street Shelton, WA 98584
360.426.2276
Mason County’s Largest Employers11
Employer Sector Employees Little Creek Casino Hotel Gambling Establishment & Hotel 800 Washington Corrections Center Correctional 640 Mason General Hospital Medical Facility 625 Shelton School District Educational Facility 624 Taylor Shellfish, Inc. Shellfish 600 Mason County Government 325 Squaxin Island Tribe Tribal Facility 268 N. Mason School District Educational 259 Olympic Panel Products Plywood, veneer 220 Wal-Mart Retail 215 Island Enterprises (Inc. subsid) Tribal Companies 160 Alta Forest Products Lumber 140 Fred Meyer Marketplace Groceries 140 Exceptional Foresters, Inc. Social Services 128 Skokomish Indiana Tribe Tribal Facility 125 Mason County PUD No. 3 Utility 122 Fir Lane Health & Rehab. Care Provider 120 Alpine Way Retirement Care Provider 115 Alderbrook Inn Resort 111 Pioneer School District Education 107
11 Mason County EDC – www.choosemason.com
17 | P a g e
310 W. Cota Street Shelton, WA 98584
360.426.2276
Location Quotient
(Mason Sector/Mason Total Employment)
State Sector/State Total Employment
Location Quotient
A location quotient allows an economic development organization to review the concentration of an industry sector in their service territory (i.e. Mason County) against an outside benchmark. In the case of the Mason County study, that benchmark was the State of Washington.
Location Quotient (LQ) analysis is essentially a ratio analysis using employment data. If the number is greater than one, your location has a concentration higher than the benchmark (State of Washington). If less than one, your location is ranked below the benchmark.
Moreover, the location quotient helps to identify exporting and importing industries. If LQ exceeds a value of one or greater, the industry sector is producing more than local needs and is either now, or a target for, exporting that good or service. At a minimum, this sector is self-sufficient. A LQ of less than one represents sectors not meeting local needs and a source of consumption leakage. In addition to the one-time value of calculating the location quotient, Economic Modeling Specialists International (EMSI) was able to compare current information with 2001 data. Comparing the two can help to expose trends in the local economy. The location quotient for 21 sectors of the Mason County economy, ranked by the percent difference between the two study periods, is in the previous table. Using the LQ approach, crop and animal production, government, retail trade and manufacturing show strong presence in Mason County. Their LQ’s have increased nicely, and show a stronger presence than the State of Washington over this study period. Sixteen sectors show a LQ less than one. This information seems consistent with the large out migration of Mason County worker’s experiences on a daily basis. Another value of LQ is to determine the presence of base jobs in a local economy. Basic industries of a study area are identified by comparing employment to state or national norms. If the national norm for a sector is 5 percent and Mason County has an employment of 8 percent, the difference, i.e. 3 percent is considered basic jobs. Here again, crop and animal production, government, retail trade and manufacturing, all have base economy components when compared to the State of Washington.

18 | P a g e
310 W. Cota Street Shelton, WA 98584
360.426.2276
Location Quotient Analysis12
NAICS Description 2001 2016 Difference % Diff WA 22 Utilities 0.37 0.54 0.17 46% 0.41
56
Administrative, Support, Waste Management & Remediation
0.35
0.48
0.13
37%
0.82
44 Retail Trade 0.93 1.15 0.22 24% 0.99 90 Government 2.02 2.31 0.29 14% 1.17 51 Information 0.39 0.43 0.04 10% 1.83 31 Manufacturing 1.01 1.08 0.07 7% 1.01 42 Wholesale Trade 0.64 0.66 0.02 3% 0.98 72 Accommodation and Food Services 0.83 0.85 0.02 2% 0.88 11 Crop & Animal Production 2.87 2.92 0.05 2% 2.72 54 Professional, Scientific, and Technical Services 0.37 0.37 0 0% 0.96 99 Unclassified 0 0 0 0 0.01 62 Health Care and Social Assistance 0.69 0.68 -0.01 -1% 0.95 53 Real Estate and Rental and Leasing 0.78 0.75 -0.03 -4% 1.07 52 Finance and Insurance 0.59 0.49 -0.1 -17% 0.7 71 Arts, Entertainment and Recreation 0.85 0.69 -0.16 -19% 0.99 48 Transportation and Warehousing 0.51 0.41 -0.1 -20% 0.85 23 Construction 1.17 0.94 -0.23 -20% 1.07 61 Educational Services 0.27 0.2 -0.07 -26% 0.7 81 Other Services (except Public Administration) 1.4 0.92 -0.48 -34% 0.93 21 Mining, Quarrying, Oil and Gas 0.35 0.11 -0.24 -69% 0.15 55 Management of Companies and Enterprises 0.42 0 -0.42 -100% 0.87
12 EMSI Report

19 | P a g e
310 W. Cota Street Shelton, WA 98584
360.426.2276
Shift-Share Analysis
Another tool helps to highlight the Mason County economy; Shift Share Analysis. Shift share is similar to location quotient in that it highlights the uniqueness of a regional economy, but it does so in terms of job growth rather than total jobs in an industry sector. Shift share highlights the trends, positive or negative, within a given sector over time. It cannot explain why these trends are occurring, only that they are. It is the job of the local economic development office to explain why.
With shift share analysis, a positive competitive effect indicates the local sector is outperforming the larger benchmark. A negative effect means that the industry is underperforming compared to the larger benchmark. The larger the number the stronger the pace of change that is occurring. Sectors with positive competitive effects should be targeted for growth while negative values warrant focus for contraction. The 21 sectors of the Mason County economy are ranked according to shift-share strength in the table to the right.
Shift Share Analysis NAICS Description Comp. Effect
90 Government 953 44 Retail Trade 444 31 Manufacturing 153
56
Administrative, Support, Waste Management & Remediation
148
72 Accommodation and Food Services 73 62 Health Care and Social Assistance 61 11 Crop & Animal Production 36 42 Wholesale Trade 30 51 Information 17 54 Professional, Scientific, and Technical Services 13 22 Utilities 11 53 Real Estate and Rental and Leasing 2 99 Unclassified 0 21 Mining, Quarrying, Oil and Gas -6 61 Educational Services -22 71 Arts, Entertainment and Recreation -32 48 Transportation and Warehousing -41 52 Finance and Insurance -46 55 Management of Companies and Enterprises -92 23 Construction -151 81 Other Services (except Public Administration) -312
Shift Share Analysis
((Mason Sector Today - Mason Sector Previous)/ (Mason Sector Previous))
((Benchmark Sector Today - Benchmark Sector Previous)/ (Benchmark Sector Previous))

39 | P a g e
310 W. Cota Street Shelton, WA 98584
360.426.2276
Benchmark Analysis
In the next phase of our evaluation, we look externally and compare Mason County’s economy to neighbors and peers. This analysis allows us to answer the question, “How do we compare to others?” As economic forces impact ours and our comparison economies, we have the ability to monitor our performance compared to these outside benchmarks.
The Question
In this section, we ask the question, “How does the economy of Mason County compare with its peers?”
The Answer
A Benchmark Analysis. The answer, i.e. insight, is obtained when we compare Mason County with similar counties throughout Washington. Here is a quick summary of what we found:
Summary Observations – Economic Snapshot Factors We Like Factors We Can Improve
Second only to Grant County for the strongest population growth of the comparable counties
Greatest contraction of manufacturing productivity amongst peers
Leading in Retail growth Significantly challenged in Professional Service sector contraction
Leading in Finance and Insurance services Modest growth in Health Care Sector
External benchmarking compares Mason County’s economy against counties of similar size and economic potential. Through the assistance of EMSI13, a contractor with the State of Washington’s Department of Commerce, an analysis of all 39 counties was conducted. A number of parameters that included workforce, sector strength (LQ & SSA14), average earnings, population size and proximity to a major metropolitan area guided our findings. Ten benchmark counties were selected for this analysis. They were:
13 www.economicmodeling.com 14 Location Quotient and Shift Share Analysis

40 | P a g e
310 W. Cota Street Shelton, WA 98584
360.426.2276
Five Smaller:
• Jefferson County (30,08315) • Douglas County (39,599) • Kittitas County (42,204) • Stevens County (43,548) • Whitman County (46,737)
• Five Larger:
• Clallam County (73,486) • Grays Harbor County (70,836) • Grant County (89,120) • Lewis County (75,882) • Skagit County (116,901)
Population. Mason and Grant Counties are experiencing the most robust growth out of the study group. Comparing 2000 population figures with 2015 estimates shows both up over twenty-four percent. Skagit is third at eighteen percent, Clallam fourth at fourteen percent, Lewis is fifth at eleven percent and Grays Harbor is sixth at five percent.
Mason County’s (61,023) economic data was compared to these ten others on a number of parameters. In some instances, where the data available was not large enough to profile without exposing confidential information (frequently the population size was too small) the Census will withhold their
15 2015 Population Estimates from American FactFinder

41 | P a g e
310 W. Cota Street Shelton, WA 98584
360.426.2276
published results. As a result, not every county could be compared in every instance.
Benchmarked Sectors
We selected seven sectors of the Mason County economy to conduct the benchmark analysis; Agriculture, Manufacturing, Retail, Finance and Insurance, Professional Scientific and Technical Services, Healthcare, and Arts and Entertainment. Annual sales were the metric for this analysis (as opposed to employment or establishments). Data was available through American Fact Finder (US Census) for 2012 and 2007. Agriculture The Agriculture, Forestry, Fishing and Hunting sector comprises establishments primarily engaged in growing crops, raising animals, harvesting timber, and harvesting fish and other animals from a farm, ranch, or their natural habitats.
The establishments in this sector are often described as farms, ranches, dairies, greenhouses, nurseries, orchards, or hatcheries. A farm may consist of a single tract of land or a number of separate tracts which may be held under different tenures. For example, one tract may be owned by the farm operator and another rented. It may be operated by the operator alone or with the assistance of members of the household or hired employees, or it may be operated by a partnership, corporation, or other type of organization. When a landowner has one or more tenants, renters, croppers, or managers, the land operated by each is considered a farm.
The sector distinguishes two basic activities: agricultural production and agricultural support activities. Agricultural production includes establishments performing the complete farm or ranch operation, such as farm owner-operators, tenant farm operators, and sharecroppers. Agricultural support activities include establishments that perform one or more activities associated with farm operation, such as soil preparation, planting, harvesting, and
Agriculture (11) - Value of Goods (000's) County 2007 2012 Change % Change
Douglas Jefferson Kittitas 19,140 Stevens Whitman Mason 93,799 (93,799) -100% Clallam 138,588 97,448 (41,140) -30% Grant 40,399 Grays Harbor 181,879 153,446 (28,433) -16% Lewis 103,645 81,130 (22,515) -22% Skagit 115,784 104,712 (11,072) -10%

42 | P a g e
310 W. Cota Street Shelton, WA 98584
360.426.2276
County 2014 2016 ChangeDouglas 1,000 6,000 5,000 Jefferson - 7,000 7,000 Kittitas 1,000 12,000 11,000 Stevens 1 10,000 9,999 Whitman - 8,000 8,000 Mason - 17,000 17,000 Clallam - 11,000 11,000 Grant - 11,000 11,000 Grays Harbor - 16,000 16,000 Lewis - 5,000 5,000 Skagit 1,000 23,000 22,000
Marijuana Sales - Value of Goods (000's)
management, on a contract or fee basis.16
Today, there are far fewer people living on farms than at any other time in history. Yet crop yields are at all-time highs, producing more food per acre than ever. Increased agricultural productivity was one of the most significant farm developments during the second half of the 20th century. Productivity gains were largely due to the availability and adoption of new or improved technologies. Over the past 50 years, agricultural output increased as the level of inputs remained constant or declined. The result was sustained growth in farm productivity without the need to commit additional resources to the production process17. For every county that had data in both reporting periods, agricultural sales showed declines from 16 to 30 percent.
Marijuana Production, Processing and Sales Driven first by medical marijuana (2012) and later by recreational use (2016), and the anticipated production of industrial hemp, the marijuana crops and sales figures in Mason County are becoming significant contributors to the local economy. Today, the industry has 6 retailers and 26 producers in Mason County. Monthly purchases by consumers exceed $10 million. At a nine percent sales tax rate, monthly tax revenues are over $950,000 while excise taxes on producers exceeds $3 million. As of 2016, medical and recreational marijuanasales in Washington exceeded $1.5 billion.18 Mason County was 25th out of the 39 counties in the state in this sector. Growth in marijuana production and sales is forecasted to continue and to be a continued economic driver for Mason County.
16 United States Census Definition 17 US Department of Agriculture. National Agriculture Statistics Service 18 https://www.502data.com/

43 | P a g e
310 W. Cota Street Shelton, WA 98584
360.426.2276
Manufacturing The Manufacturing sector comprises establishments engaged in the mechanical, physical, or chemical transformation of materials, substances, or components into new products. The assembling of component parts of manufactured products is considered manufacturing, except in cases where the activity is appropriately classified in Sector 23, Construction.
Establishments in the Manufacturing sector are often described as plants, factories, or mills and characteristically use power-driven machines and materials-handling equipment. However, establishments that transform materials or substances into new products by hand or in the worker's home and those engaged in selling to the general public products made on the same premises from which they are sold, - such as bakeries, candy stores, and custom tailors, - may also be included in this sector. Manufacturing establishments may process materials or may contract with other establishments to process their materials for them. Both types of establishments are included in manufacturing.
The materials, substances, or components transformed by manufacturing establishments are raw materials that are products of agriculture, forestry, fishing, mining, or quarrying as well as products of other manufacturing establishments. The materials used may be purchased directly from producers, obtained through customary trade channels, or secured without recourse to the market by transferring the product from one establishment to another, under the same ownership.
Manufacturing (31-33) - Value of Goods (000's) County 2007 2012 Change % Change
Douglas 47,020 71,697 24,677 52% Jefferson 192,644 Kittitas 82,679 Stevens 468,975 271,300 (197,675) -42% Whitman 273,330 491,286 217,956 80% Mason 495,985 239,004 (256,981) -52% Clallam 568,754 338,624 (230,130) -40% Grant 954,932 1,421,612 466,680 49% Grays Harbor 1,095,135 840,102 (255,033) -23% Lewis 1,010,625 1,195,625 185,000 18% Skagit 8,783,773 12,215,820 3,432,047 39%
Taylor Shellfish Farms “From Tide to Table”
The Taylor family has been farming shellfish in the South Puget Sound since 1890.Taylor Shellfish Farms employs 600 employees throughout its company and is one of the largest employers in Mason County! Taylor Shellfish sells many types of seafood including oysters, mussels, geoduck and clams. Their products are shipped worldwide.
The Taylor Shellfish mission is: “To sustainably farm quality shellfish from tide to table while being responsible community citizens and active stewards of our marine environment.”

44 | P a g e
310 W. Cota Street Shelton, WA 98584
360.426.2276
Manufacturing has been and continues to be in the midst of a technological renaissance that is transforming the look, systems, and processes of the modern factory. Manufacturing is the frequent implementer of advances such as robotics, 3D printing or logistics efficiencies producing greater output per factory worker than ever before. In 2007 Mason County stood in the middle of the pack for its manufacturing output but by 2012 that output was reduced by more than half.
By contrast, four of the comparable counties, Whitman, Grant, Lewis, and Skagit, experienced manufacturing growth in the five years of the analysis.
Retail The Retail Trade sector comprises establishments engaged in retailing merchandise, generally without transformation, and rendering services incidental to the sale of merchandise.
The retailing process is the final step in the distribution of merchandise; retailers are organized to sell merchandise in small quantities to the general public. This sector comprises two main types of retailers: store and non-store retailers.
The buying of goods for resale is a characteristic of retail trade establishments that particularly distinguishes them from establishments in the agriculture, manufacturing, and construction industries. For example, farms that sell their products at or from the
Retail (44-45) - Value of Goods (000's) County 2007 2012 Change % Change
Douglas 427,881 414,061 (13,820) -3% Jefferson 183,939 201,453 17,514 10% Kittitas 397,888 272,723 (125,165) -31% Stevens 250,346 376,411 126,065 50% Whitman 82,485 Mason 364,147 442,118 77,971 21% Clallam 667,295 710,231 42,936 6% Grant 815,244 668,322 (146,922) -18% Grays Harbor 736,158 747,091 10,933 1% Lewis 888,461 791,793 (96,668) -11% Skagit 2,131,838 1,718,545 (413,293) -19%
Thermedia Corporation
James Thomas is the President of Thermedia Corporation. This Mason County business produces a heat and moisture exchanger that keeps medical patients’ airways warm and moist during anesthesia and long-term ventilation. Thermedia employs 5 people in Mason County and is looking to expand its business. James Thomas has been in business for 22 yrs. Thomas chose to relocate Thermedia to the Port of Shelton because of the optimal business conditions including a great fiber optic network. Thomas also appreciates the proximity to recreation Mason County offers.

45 | P a g e
310 W. Cota Street Shelton, WA 98584
360.426.2276
point of production are not classified in retail, but rather in agriculture. Similarly, establishments that both manufacture and sell their products to the general public are not classified in retail, but rather in manufacturing.
However, establishments that engage in processing activities incidental to retailing are classified in retail. This includes establishments, such as optical goods stores that do in-store grinding of lenses, and meat and seafood markets.
The return of consumer confidence has boosted retail sales in recent years in this increasingly complex sector. Today’s consumers are better educated, more connected, and more demanding than previous generations. Competition is driving improvements in the speed of delivery and the personalization of the consumer experience. In this benchmark analysis, retail sales were split with growth in five counties and contraction in the other five.
While Mason County’s growth rate may cause pride at its surface, it should be noted that practically all of Mason County’s retail growth is occurring from home grown, niche market businesses. With the exception of a Walmart in Shelton, department, or big box retail investment has avoided the county to date.
Tozier Bros Hardware “Your Local Source for Tools, Hardware, & Supplies”
Tozier Bro’s hardware has been in business for over 100 years. Art and Evan Tozier have owned the store since 1975. The business sells hardware items, seed and power equipment including small tractors. The business employs 12 people and is a staple of the community. Art Tozier says, “We were born and raised here, people depend on us to do the right thing.”

56 | P a g e
310 W. Cota Street Shelton, WA 98584
360.426.2276
Finance and Insurance The Finance and Insurance sector comprises establishments primarily engaged in financial transactions (transactions involving the creation, liquidation, or change in ownership of financial assets) and/or in facilitating financial transactions. Three principal types of activities are identified:
1. Raising funds by taking deposits and/or issuing securities and, in the process, incurring liabilities.
Establishments engaged in this activity use raised funds to acquire financial assets by making loans and/or purchasing securities. Putting themselves at risk, they channel funds from lenders to borrowers and transform or repackage the funds with respect to maturity, scale, and risk. This activity is known as financial intermediation.
2. Pooling of risk by underwriting insurance and annuities. Establishments engaged in this activity
collect fees, insurance premiums, or annuity considerations; build up reserves; invest those reserves; and make contractual payments. Fees are based on the expected incidence of the insured risk and the expected return on investment.
3. Providing specialized services facilitating or supporting financial intermediation, insurance,
and employee benefit programs.
In addition, monetary authorities charged with monetary control are included in this sector.
Major financial and insurance products and services include loans, financial services, investment advice, insurance products, transactions processing, trading financial instruments, and asset management. Financial and insurance firms create, liquidate, or change ownership of financial assets such as stocks, bonds, options, and insurance. Insurance accounts for about 50% of sector revenue, lending for about 35%, and securities services for about 15%.19 With regard to Finance and Insurance, Mason County out
19 Hoovers Sector Report Introduction.
Finance and Insurance (52) - Value of Goods (000's) County 2007 2012 Change % Change
Douglas 25,587 Jefferson 43,405 16,948 (26,457) -61% Kittitas 34,692 Stevens 132,507 198,606 66,099 50% Whitman 31,613 35,185 3,572 11% Mason 37,139 74,792 37,653 101% Clallam 108,214 83,478 (24,736) -23% Grant 108,923 101,698 (7,225) -7% Grays Harbor 151,057 85,092 (65,965) -44% Lewis 110,498 Skagit 278,576 331,759 53,183 19%

57 | P a g e
310 W. Cota Street Shelton, WA 98584
360.426.2276
Professional, Scientific, and Technical Services (54)- Value of Goods (000's) County 2007 2012 Change % Change
Douglas Jefferson 16,734 41,186 24,452 146% Kittitas 23,964 28,361 4,397 18% Stevens 10,214 Whitman 8,697 49,663 40,966 471% Mason 36,036 18,560 (17,476) -48% Clallam 115,700 Grant 41,907 35,866 (6,041) -14% Grays Harbor 29,110 39,607 10,497 36% Lewis 59,914 Skagit 183,715 303,592 119,877 65%
shown its peers significantly. Where trends were available, most other counties saw significant reductions or modest gains in these sectors. Mason County enjoyed watching theirs more than double.
Professional, Scientific, and Technical Services The Professional, Scientific, and Technical Services sector comprises establishments that specialize in performing professional, scientific, and technical activities for others. These activities require a high degree of expertise and training. The establishments in this sector specialize according to expertise and provide these services to clients in a variety of industries and, in some cases, to households. Activities performed include: legal advice and representation; accounting, bookkeeping, and payroll services; architectural, engineering, and specialized design services; computer services; consulting services; research services; advertising services; photographic services; translation and interpretation services; veterinary services; and other professional, scientific, and technical services.
Although the professional, scientific, and technical industry sector makes up only 6% of the U.S. workforce, it was responsible for 10% of national job growth from 2010 to 2012. In addition, the broad industry (NAICS 54) grew by 6% in the past two years, which illustrates our nation’s march toward a
Heritage Bank “A Community of Banks”
Heritage Bank in Shelton has been helping businesses and individuals grow for 50 years. The Shelton branch features commercial and residential loans as well as bank accounts and mortgages. Donna Moir is the Commercial Loan Officer at the Shelton branch and works with local business to secure commercial real estate loans and working capital to grow their businesses. The bank provides jobs for several Mason County residents. She feels privileged to help new businesses get started in Mason County and states, “It’s nice to see that businesses are continuing to grow and thrive.”

58 | P a g e
310 W. Cota Street Shelton, WA 98584
360.426.2276
more technical, STEM20 workforce. There are over 9.2 million jobs in this industry, which is driven b y sub-sectors like computer system design services and management, scientific, and technical consulting services.21 In terms of sales volume, Mason County ranks close to the bottom in 2012 value of goods sold. More importantly, this sector displays the largest loss over the study period cutting total output by nearly half.
Health Care The Health Care and Social Assistance sector comprises establishments providing health care and social assistance for individuals. The sector includes both health care and social assistance because, at times, it is difficult to distinguish between the boundaries of these two activities. The industries in this sector are arranged on a continuum starting with those establishments providing medical care exclusively, continuing with those providing health care and social assistance, and finally finishing with those providing only social assistance. The services provided by establishments in this sector are delivered by trained professionals. All industries in the sector share this commonality of process, namely, labor inputs of health practitioners or social workers with the requisite expertise. Many of the industries in the sector are defined based on the educational degree held by the
20 Science, Technology, Engineering, and Math 21 http://www.economicmodeling.com/2012/11/05/the-emerging-professional-scientific-and-technical-sector/
Health Care (62) - Value of Goods (000's) County 2007 2012 Change % Change
Douglas 44,782 45,734 952 2% Jefferson 76,789 Kittitas 44,374 55,382 11,008 25% Stevens 111,535 127,027 15,492 14% Whitman 89,547 Mason 95,465 108,504 13,039 14% Clallam 138,989 201,350 62,361 45% Grant 111,796 189,289 77,493 69% Grays Harbor 268,794 219,963 (48,831) -18% Lewis 123,238 330,270 207,032 168% Skagit 329,883 359,361 29,478 9%
Foster and Williams Architects
Foster and Williams Architects has specialized in team based solutions to structural and space needs for clients in Western Washington for more than 38 years. Their five employees have tackled projects from residential homes to many churches and public spaces like the Shelton Civic Center and Belfair Senior Center. “I really like knowing the people who pass me on the street, the pace of Mason County and the ability to make an impact.” states Len Williams, CEO.

59 | P a g e
310 W. Cota Street Shelton, WA 98584
360.426.2276
Mason General Hospital & Family of Clinics
Mason General Hospital & Family of Clinics (MGH&FC) is one of the highest rated rural hospitals districts in the State. They received the Washington State Hospital Association's (WSHA) 2016 Achieving Best Care Award and were recognized for success in a broad variety of patient safety measures. Mason General features a level four trauma designation emergency department that operates 24/7 and is staffed by board certified emergency services physicians, emergency services trained nurses and staff.
practitioners included in the industry.
This is arguably the most transformative sector of our economy right now. Initiated by the Affordable Care Act and its evolving iterations the changes in this sector will be substantial the next ten years. Moreover, aging Baby Boomers will put pressures on our healthcare system like few other times in history. The diversity of change in this sector was the greatest of all. Contractions by as much as eighteen percent to expansions of one hundred sixty-eight percent were experienced. Mason County fared well with a modest expansion of 14% over the five-year study period.
Arts and Entertainment The Arts, Entertainment, and Recreation sector includes a wide range of establishments that operate facilities or provide services to meet varied cultural, entertainment, and recreational interests of their patrons. This sector comprises:
• establishments that are involved in producing, promoting, or participating in live performances, events, or exhibits intended for public viewing;
• establishments that preserve and exhibit objects and sites of historical, cultural, or educational interest; and
• establishments that operate facilities or provide services that enable patrons to participate in recreational activities or pursue amusement, hobby, and leisure-time interests.
Some establishments that provide cultural, entertainment, or recreational facilities and services are classified in other sectors. Excluded from this sector are:
• establishments that provide both accommodations and recreational facilities, such as
hunting and fishing camps and resort and casino hotels are classified in Subsector 721, Accommodation;
• restaurants and night clubs that provide live entertainment in addition to the sale of food and beverages are classified in Subsector 722, Food Services and Drinking Places;
• motion picture theaters, libraries and archives, and publishers of newspapers, magazines, books, periodicals, and computer software are classified in Sector 51, Information; and
• establishments using transportation equipment to provide recreational and

60 | P a g e
310 W. Cota Street Shelton, WA 98584
360.426.2276
entertainment services, such as those operating sightseeing buses, dinner cruises, or helicopter rides, are classified in Subsector 487, Scenic and Sightseeing Transportation.
Due to the small nature of many of the businesses in this sector, the comparison data from the census was often suppressed making comparison or trend analysis extremely difficult. We do, however, want to highlight the emerging gaming industry’s presence in Mason County. Two showcase the industry: Lucky Dog Casino in Skokomish and Little Creek Casino in Shelton.
Originally located exclusively in centers like Las Vegas and Atlantic City, the casino industry has expanded nationwide as new gaming facilities have opened. The State of Washington has been an aggressive participant in this expansion. In fact, Spectrum, an industry leading consultant for gaming statistics, reports that Washington has more casinos than all but three states; Nevada, California and Oklahoma.
In the state of Washington there are 32 tribal casinos operated by 23 tribes. Little Creek is operated by the Squaxin Island Tribe and Lucky Dog by the Skokomish Tribal Council. Actual revenues for each are protected information under security agreements provided to the tribes. However, the Washington State Gambling Commission forecasts strong and sustained growth in the industry through 2020. This represents a 42.3% growth over 2015 revenues in the state.22
22 http://www.onlinepokerreport.com/22808/washington-state-gambling-expected-growth/

61 | P a g e
310 W. Cota Street Shelton, WA 98584
360.426.2276
Impact of Growth Management Act
First adopted by the state legislature in 1990, and later by Mason County in 1995, the Growth Management Act (GMA) has helped guide development in Mason County, along with most other Washington governmental units that are required to follow its principles. Altruistic in concept, the legislation is not without its impact on economic development efforts. In this final section of our analysis we look at its impact on Mason County.
The Question
In this section, we ask the question, “What is the impact and exposure of the Growth Management Act?”
The Answer
A quantitative and qualitative review of its impact to date. In the section that follows, we separate jobs and companies by development zone.
Summary Observations – Impact of Growth Management Act Factors We Like Factors We Can Improve
The focus on sustainable development benefits us all.
A less than “pro-business” approach to land use controls
Planned growth generally trumps lassie faire investment decisions in most situations
Limited grandfathering of existing business
Rezoning requests to facilitate investment are frequently challenged, denied or delayed
Maintain a 20-year supply of shovel ready sites that facilitates new investment
Timely review and approval of permits for existing facilities regardless of location
The Growth Management Act (Chapter 36.70A RCW) was adopted by the Legislature in 1990 requiring state and local governments to manage growth by identifying and protecting critical areas and natural resources lands, designating urban growth areas, preparing comprehensive plans and implementing through capital investments and development regulations. It has now guided growth for 27 years in the State of Washington and 22 years in Mason County.
Land use is separated into two major categories; Urban and Rural. Urban areas are further subdivided into Urban Growth Areas, Rural Activity Centers and Hamlets. It is the intention of the Mason County Comprehensive Plan to drive all development into urban areas. Growth outside of urban areas can only occur if it is not urban in nature, i.e. agriculture, resource-based, recreation and residential uses.

62 | P a g e
310 W. Cota Street Shelton, WA 98584
360.426.2276
Urban Growth Areas (UGA). Urban Growth Areas in Mason County represent the most development-intensive areas of the County. They provide all, or nearly all, of the community services to support urban development densities. Mason County’s three UGA’s represent over twelve thousand acres with an average size of 4,183 acres. Their over 640 employers provide almost $300 million in income for more than 7,300 workers.23
Urban Growth Areas Name Acreage Total Employers With Employees No. Employees Payroll
Shelton 9,052.40 505 450 6,562 266,436,308 Belfair 2,326.16 96 88 747 22,542,268 Allyn 1,171.65 45 9 36 5,676,777 Total 12,550.21 646 547 7,345 294,655,353
Rural Activity Centers (RAC). Rural Activity Centers are unincorporated areas that are characterized by urban type densities which may offer some urban services such as community water, limited commercial uses, and fire protection. RAC’s do not necessarily provide services to neighboring residents but do provide job opportunities for rural residents. Mason County’s three RAC’s consume over thirteen hundred acres of land with an average size of 444 acres. Their 37 employers provide almost $5 million in income for more than 160 workers.
Rural Activity Centers Name Acreage Total Employers With Employees No. Employees Payroll
Hoodsport 664.21 12 12 26 775,514 Union 416.26 12 9 74 2,593,936 Taylor Towne 252.78 13 11 67 1,600,684
Total: 1,333.25 37 32 167 4,970,134
Hamlets. Hamlets (formerly Rural Community Centers) are intended to provide a focal point and community identity for surrounding rural areas. They may include one or two civic, community or retail uses such as a post office, community center, church, grange, gas station or small convenience store. They are similar in nature to Rural Activity Centers only smaller in size. Mason County has nine Hamlets ranging in size from 8.5 acres to 110 acres. The average Hamlet in Mason County is 30.27 acres.
Hamlets were added since the EDCMC Phase II report in 2000 moving an additional 272 acres from rural to urban status. These Hamlets were estimated in the Phase II report to impact 100 businesses. In our Phase III analysis, we could find 11 businesses providing a payroll of over $400,000 for 25 employees.
23 Raw data received from Department of Revenue which was then mapped via County GIS.

63 | P a g e
310 W. Cota Street Shelton, WA 98584
360.426.2276
Hamlets Name Acreage Total Employers With Employees No. Employees Payroll
Bay Shore 110.74 Grapeview 2 33.85 Matlock 27.3 Deer Creek 24.69 Lilliwaup 23.67 Dayton 21.83 Spencer Lake (west) 10.99 Grapeview 1 10.89 Spencer Lake (east) 8.46
Total: 272.42 11 11 25 404,607
Note: The individual numbers per Hamlet were suppressed to protect confidential employment data.
Rural Employers. Rural employers represent those business entities that exist outside of the development zones. These entities are the ones most at risk to excessive development regulations. As you can see from the following table, they represent a substantial portion of the Mason County employment base, i.e. these employers represent:
• 49% of all employers in Mason County with or without employees • 78% of all the employed workforce in the county • 40% of all the payroll in Mason County
Stated differently, the number of jobs outside the development zones exceeds any one class (UGA, RAC or Hamlet) individually. One can further observe that:
• For any one job in a RAC or Hamlet combined there are 30 jobs outside the development zones • For any one job in an UGA there is another job outside the UGA
Outside Development Zone Name Acreage Total Employers With Employees No. Employees Payroll
Rural Mason County 468,480 682 573 5,869 204,141,425 Total: 468,480 682 573 5,869 204,141,425
Business Distribution per the GMA
Growth Management Act of 1990 (Chapter 36.70A RCW) set forth priorities for more managed growth
resulting in a more sustainable future for Mason County. Those goals are admirable, to say the least. At the same time, the GMA moved planning from a centralized, state driven function, to one of local

64 | P a g e
310 W. Cota Street Shelton, WA 98584
360.426.2276
Case Study: In 1998 Assemco operated a 12,000 s.f. class A manufacturing facility complete with rail access and a loading spur creating 75 well-paying jobs. When it closed, numerous efforts to attract new business to either lease or sell the facility to other industrial uses were denied by Mason County. Today it is home to a recreational marijuana grower providing few jobs at much lower wages. The rail spur sits idle.
control. Here again, the goals of the legislature are well founded.
Development Area Summary 199824 2016 Difference
Businesses with known addresses 3,289 5,88525 2,596 Businesses reporting employment 1,240 1,42526 185 Businesses outside UGA’s, RAC’s & Hamlets 62% 49%26 -13% Percent of businesses w/employees outside UGA’s 56% 49%27 -7% Percent of total employees at businesses outside UGA’s 44% 77%20 33%
Percent of private payroll generated by businesses outside UGA’s 38% 40%20 2%
Percent of existing business types, outside UGA’s, that are not authorized by the Matrix of Permitted uses
76%
76%20
0%
However, when the Mason County Comprehensive Plan was first adopted the scale of the impact on the business community, especially when it comes to their physical assets in the form of real estate, was seriously overlooked. We find that the GMA has under-prioritized the following key matters through the implementation of this legislation:
• The Majority of Businesses Are Located Outside of UGA’s, • Little or no grandfathering of rural businesses prior to GMA demarcations. • County Appeals Process is Unsupportive of Adaptive Reuse
Business Location Assessment
Location of Mason County Businesses. The UGA’s were first drawn in 1999 and then amended during the 2005 and 2016 updates of the Comprehensive Plan. At the same time, RAC’s and later Hamlets were added as development targeted areas in the county.
As a result of these decisions, a county with a large percentage of its business base located outside targeted
24 Phase II Report 25 Mason County Business Analysis July 2016.xlsx 26 ESD Data and Consultant Analysis 27 ESD Data and Consultant Analysis

65 | P a g e
310 W. Cota Street Shelton, WA 98584
360.426.2276
development areas was to find that this percentage had decreased as a result of these revisions. However, all planning efforts underway work to incentivize investment in development areas and to dis-incent investment for the vast majority of the business base in Mason County. Property owners outside of the development areas question the sensibility of putting money into assets that they may not be able to recoup should the building need to be sold at some future date.
When county operations are based on tax revenue its priority should be to assist all businesses with capital expenditures. These expenditures maintain the value of the existing structures or hopefully cause them to expand adding tax base and jobs through the process. It is the opinion of the EDCMC that Mason County is acting contrary to this objective. Based upon our analysis, almost half of the Mason County business base cannot experience economic growth or expansion simply because of a location selection that has since been hampered by the Growth Management Act.
Limited Grandfathering
Grandfathered Uses. Mason County has grandfathered existing uses prior to the GMA. Those uses that continue significantly in the same form and function as the time when the GMA impacted land use may appear to be safe. However, that may be a false sense of safety the property owner would perceive.
It would be true that if the business remained significantly unchanged, that the use of that facility could continue. However, should an existing business currently located outside of a development area want to expand with a new product line in order to capture additional market share, they would be prohibited from doing so. This non- conforming use is not protected by the grandfather clause associated with the implementation of the GMA in Mason County.
Moreover, should a business outside of development zone decide to mothball operations for a period of time, they have a very short window within which to recover and reinvent their business model. Once this window closes, the property cannot be re-used for its intended purpose.
Rezoning Conflicts
County Appeals Process. Mason County rezone applications are reviewed and approved or denied by the Board of County Commissioners. That body’s function is to address, and decide upon, use variances as they pertain to the land. There are three functions, specific to this topic, which this board provides:
• Interpreting the terms of the Growth Management Act as expressed through the Comprehensive Plan
• Determining whether a proposed use or project, or some aspect there, is “grandfathered” from having to comply with the terms of the controlling ordinance.
Case Study: In 2015 Simpson Lumber Mills shuttered 2 facilities idling 275 skilled workers. Sierra Pacific plans to rebuild “at least” one of the two mills in Shelton. The mill outside the UGA is slated for redevelopment.

66 | P a g e
310 W. Cota Street Shelton, WA 98584
360.426.2276
• Determining whether to allow a variance is necessary to prevent the ordinance terms from being unconstitutional as applied.
Matrix of Permitted Uses
The Matrix of Permitted Uses may be the most challenging aspect of the Mason County Comprehensive Plan. Where most county or civil units might discuss restricted uses, Mason County has chosen to take the opposite approach by publishing the Matrix of Permitted Uses. The table is reproduced in the appendix for reference in a slightly modified form. When first created, the table commented on 137 Land Use Classifications. It then extended permitted use of those land use classifications to Urban Growth Areas, Resource Areas, and Agricultural Resource Lands. For whatever reason, the table does not address the 15 land use classifications found in the Rural Lands zoning classification. As stated in the introduction to the table, “All uses not listed as permitted uses, accessory uses, or special permit uses in the matrix or Chapter 17.04 are prohibited uses.” For this reason, we have slightly modified the table in Appendix B to include Rural Lands in the right most column. There are no permitted uses identified in this column as a result of their omission in county planning efforts.
The intent of the Matrix of Permitted Uses to drive development into UGA’s is quickly apparent. Of the 137 identified land use classifications:
• 92% (126) are allowed in UGA’s, while • 22% (30) are allowed in Resource Areas, and • 19% (26) are allowed in Agricultural Resource Lands, and • 0% in Rural Lands by their omission from this table
The impact of this limited scope of permitted uses has been recognized by NAICS in a 2- through 6-digit hierarchical classification system, offering five levels of detail. Each digit in the code is part of a series of progressively narrower categories, and the more digits in the code signify greater classification detail. The first two digits designate the economic sector, the third digit designates the subsector, the fourth digit designates the industry group, the fifth digit designates the NAICS industry, and the sixth digit designates the national industry. The 5-digit NAICS code is the level at which there is comparability in code and definitions for most of the NAICS sectors across the three countries participating in NAICS (the United States, Canada, and Mexico). The 6-digit level allows for the United States, Canada, and Mexico each to have country-specific detail. A complete and valid NAICS code contains six digits.

67 | P a g e
310 W. Cota Street Shelton, WA 98584
360.426.2276
Findings and Recommendations
Key Findings
Throughout this analysis, a number of facts come to light. Most specifically, that Mason County is an essential building block for its member communities, but also for the State of Washington. The economic drivers of this county are constraining and challenging for both its residents and its business community alike.
Like many economies, Mason County is experiencing growth in some sectors and contraction in others. At present, its two most significant base-job sectors; Agriculture and Manufacturing, are experiencing contraction. Service sector jobs are expanding in most sectors. Concern is focused with regard to Professional Services employment contraction.
Wage and income levels are below both state and national levels.
In an effort to optimize future development, current job creators are placed at risk with regard to land use.
Recommendations
The key to prosperity. Mason County needs a new détente today – one between economic prosperity and land use management. There are many ways to pursue economic development and land use management that reinforce, rather than compete, with each other.
Optimize Internal and External Communications. Mason County’s Land Use and Economic Development Leaders need to work cooperatively. This can best occur through ongoing communication and reporting. Shared attendance at each other’s meetings would foster informal communication. Possibly an annual summit on Land Use and Economic Development would bring all interested parties into a common framework for promoting jobs and investment in Mason County.
Matrix of Permitted Uses. The EDCMC recommends the elimination of the Matrix of Permitted Uses and that it be replaced by the less restrictive and more business-friendly Matrix of Restricted Uses. However, knowing that each development opportunity is unique, an avenue for review and appeal should be included in the land use regulations even if a business should fall on the proposed Matrix of Restricted Uses.
Addressing Business Needs at Every Stage in Life Cycle: A close working relationship with Mason County employers is essential for successful economic development. As a service broker, the EDC can coordinate the resources required at each stage in a company’s life cycle. From start-up companies that need seed capital to mature companies looking for ways to cut costs, Mason County

68 | P a g e
310 W. Cota Street Shelton, WA 98584
360.426.2276
should be proactive in supporting and retaining local businesses and facilitating their growth. Equally important is recognizing the dynamics of business life cycles and the need to maintain a diverse portfolio of companies at various life stages.
Adequate Supply of Shovel Ready Sites
In order to foster development and remain competitive in economic development, Mason County needs an inventory of shovel ready sites. As required by the GMA, these sites would be located inside UGA’s or RAC’s. Hamlet’s would be challenged to provide the infrastructure necessary to support development of this scale. A demand analysis that reviews the number of existing and planned shovel ready sites in the market that compares the availability against acres of land sold would be an excellent start. Similarly, the total square footage of vacant industrial space28 should be inventoried and compared to sales in the market place. While priority would be placed on manufacturing spaces, a fully effective analysis would be made on commercial space needs and supply as well.
Interviews with Mason County economic development officials point to a lack of manufacturing sites in the county. This situation is exacerbated by the long production times needed to bring real estate into productive or competitive use. The inability to repurpose existing manufacturing properties outside of the UGA’s and RAC’s only elevates the need for this inventory to be completed.
In order to compete for those projects seeking a Pacific Northwest location it is advised that an inventory of at least 100 acres and 120,000 s.f. (i.e. 3, 40,000 s.f. facilities could be an alternative) be maintained. With limited developable land in Mason County, future growth will depend on maximizing the use of existing industrial sites and redeveloping brownfields. The County needs to work in partnership with the private sector to assure that appropriate sites and buildings are available.
Further stimulating the need for shovel ready sites is the newly formed relationship with China. As this relationship matures, the opportunity for Foreign Direct Investment (FDI) should increase. While a success for Washington, it would be a loss on the economic development program if all of those efforts resulted in investment in Thurston, King or another county other than Mason.
Accelerated Permitting In order to be competitive in economic development, the local jurisdiction strives to create a one-stop review and approval process for all permits necessary for successful investment to occur. In Mason County, the number of permitting entities are numerous and the time to approval is reported as lengthy.
There are many reports of delays and complaints of excessive cycle time for getting permits approved
28 It should be noted that many vacant buildings are functionally obsolete as modern-day manufacturing spaces require different ceiling heights and bay sizing than older facilities. Just because a building is vacant does not mean that it is competitive in today’s market.

69 | P a g e
310 W. Cota Street Shelton, WA 98584
360.426.2276
not only inside the development zones, but outside them as well. Approval outside of the development zones is reported as especially challenging. As of this report, that information is more anecdotal than documented. Accurate or not, the perception of delay is frequently communicated in development circles throughout Mason County. The lack of data supporting or rebuffing these statements lends fuel to the fire creating a negative impression of investment support in the County. Further analysis comparing permit reviews in Mason County to historical performance or comparable counties would facilitate prudent management decisions with this topic as well as a more informed basis upon which more positive statements could be released to the general public.
In all instances, the continual removal of blockades to investment needs to be a shared priority of public, private, non-profit and for-profit entities throughout Mason County.

70 | P a g e
310 W. Cota Street Shelton, WA 98584
360.426.2276
Appendix A
UGA’s, RAC’s and Hamlets in Mason County

71 | P a g e
310 W. Cota Street Shelton, WA 98584
360.426.2276

72 | P a g e
310 W. Cota Street Shelton, WA 98584
360.426.2276
Appendix B
Matrix of Permitted Uses 17.03.020 Matrix of Permitted Uses
The intent of this section is to assist proponents and staff in determining whether a proposed land use is consistent with the applicable policies of the Comprehensive Plan. Those policies were formed with the intention to allow property owners and project proponents as much flexibility as possible in the use of their property, within the constraints of the Growth Management Act. Therefore, the following matrix identifies the permitted uses in the urban or resource land areas in Mason County; note that the public should consult the specific adopted urban growth area plan for land use designation as permitted or prohibited. Permitted uses, as they apply to Rural Lands, have been placed in Chapter 17.04. All uses not listed as permitted uses, accessory uses, or special permit uses in the matrix or Chapter 17.04 are prohibited uses.
The text above is taken directly from the Comprehensive Plan of Mason County. The table below, is a modified version of the Matrix of Permitted Uses. Through the exclusion of Rural Areas in this matrix, virtually nothing can be done that generates income for a resident in these areas. In order to draw emphasis, we have reproduced some of the more common rural or home businesses that are currently denied by the Comprehensive Plan.
MASON COUNTY MATRIX OF PERMITTED USES
FIGURE 17.03.020 Description of Use Land
Use Classification
(U)
Urban Growth Areas
Resource Areas
Agricultural Resource
Lands
Rural Areas
Greenhouses, (private non-commercial)
II X Omitted
Carpenter Shops V X Omitted Furniture Repair (light industry) V X Omitted Light Industry V X Omitted Home Occupation I X X X Omitted Locksmith IV X Omitted Machine Shop V X Omitted Pesticide Application Service V X Omitted Small Engine Repair X X Omitted Welding Shops VI X Omitted

73 | P a g e
310 W. Cota Street Shelton, WA 98584
360.426.2276

74 | P a g e
310 W. Cota Street Shelton, WA 98584
360.426.2276
Appendix C
Technical Notes on Composition
These notes are provided for future versions of the report.
Internal Trends and Benchmark Comparisons. Much of the data for these two sections was obtained from census data via American Fact Finder. https://factfinder.census.gov
Business Counts were obtained from two sources:
All Businesses. All business in the county who file a business entity report were obtained from the Department of Revenue. In 2017, the original list contained 6,160 business of which 67 were duplicates with the same address. These were removed making the net business count 6,093.
Businesses with Payroll. Businesses with employee lists were obtained from the Washington State Employment Security Department. This list provided 1,425 business addresses.
The difference between the two lists (6,093-1,425) produced 4,668 addresses which were all deemed to be cottage industries or sole proprietors.
Mapping of business locations inside or outside the growth areas was conducted by the Mason County GIS. They provided maps and tables of the 1,425 businesses with payroll expenses. The 4,668 sole proprietors were purposely not mapped as they would not be impacted by a location inside or outside of a growth area.

75 | P a g e
310 W. Cota Street Shelton, WA 98584
360.426.2276