business cycles around the globe iea wc, istanbul june 26, 2008 péter benczúr magyar nemzeti bank...
TRANSCRIPT

BUSINESS CYCLES AROUND THE GLOBE
IEA WC, IstanbulJune 26, 2008
Péter Benczúr Magyar Nemzeti Bank and
Central European University
Attila Rátfai Central European University

BACKGROUND
• ‘Are All Business Cycles Alike?’ – Blanchard & Watson (1986): time-series variation in nature of
fluctuations in US
– This project: heterogeneity in BC frequency shocks and their propagation between (and within) groups of countries
• Mission: systematic analysis of cyclical component of key macro aggregates in a large number of countries– Uncover basic facts on volatility, cyclicality and persistence
– Structural estimation of productivity dynamics in a benchmark BC model
– Quantitative regularities across country groups, (across individual countries), (according to country characteristics)

CONTRIBUTION
• Bring more/better data– Assemble novel sample of quarterly frequency macro variables
– Many countries
– Uniform time frame
– Constant price NIPA measures (except CIS), non-intrapolated observations
• Assess structural heterogeneity in productivity shocks driving fluctuations
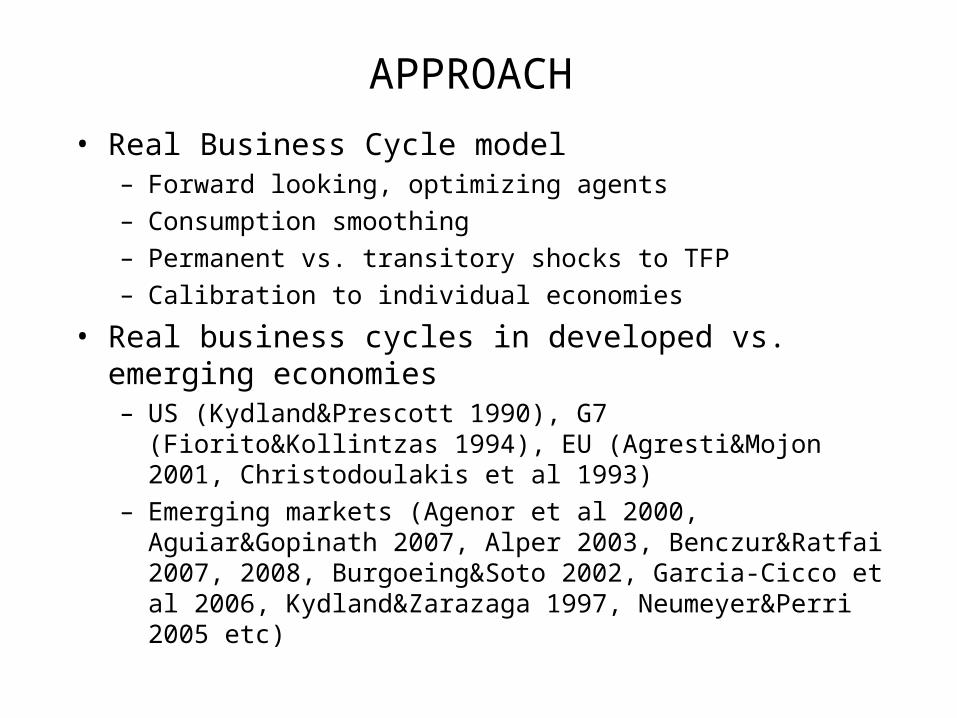
APPROACH
• Real Business Cycle model– Forward looking, optimizing agents
– Consumption smoothing
– Permanent vs. transitory shocks to TFP
– Calibration to individual economies
• Real business cycles in developed vs. emerging economies – US (Kydland&Prescott 1990), G7 (Fiorito&Kollintzas 1994), EU
(Agresti&Mojon 2001, Christodoulakis et al 1993)
– Emerging markets (Agenor et al 2000, Aguiar&Gopinath 2007, Alper 2003, Benczur&Ratfai 2007, 2008, Burgoeing&Soto 2002, Garcia-Cicco et al 2006, Kydland&Zarazaga 1997, Neumeyer&Perri 2005 etc)
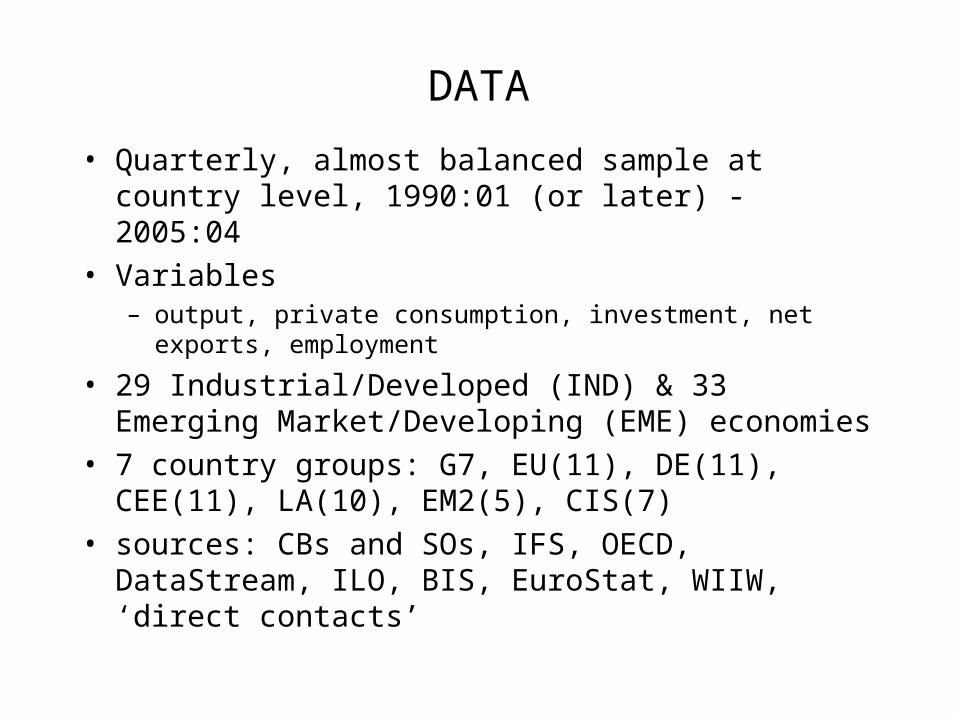
DATA
• Quarterly, almost balanced sample at country level, 1990:01 (or later) - 2005:04
• Variables– output, private consumption, investment, net exports, employment
• 29 Industrial/Developed (IND) & 33 Emerging Market/Developing (EME) economies
• 7 country groups: G7, EU(11), DE(11), CEE(11), LA(10), EM2(5), CIS(7)
• sources: CBs and SOs, IFS, OECD, DataStream, ILO, BIS, EuroStat, WIIW, ‘direct contacts’
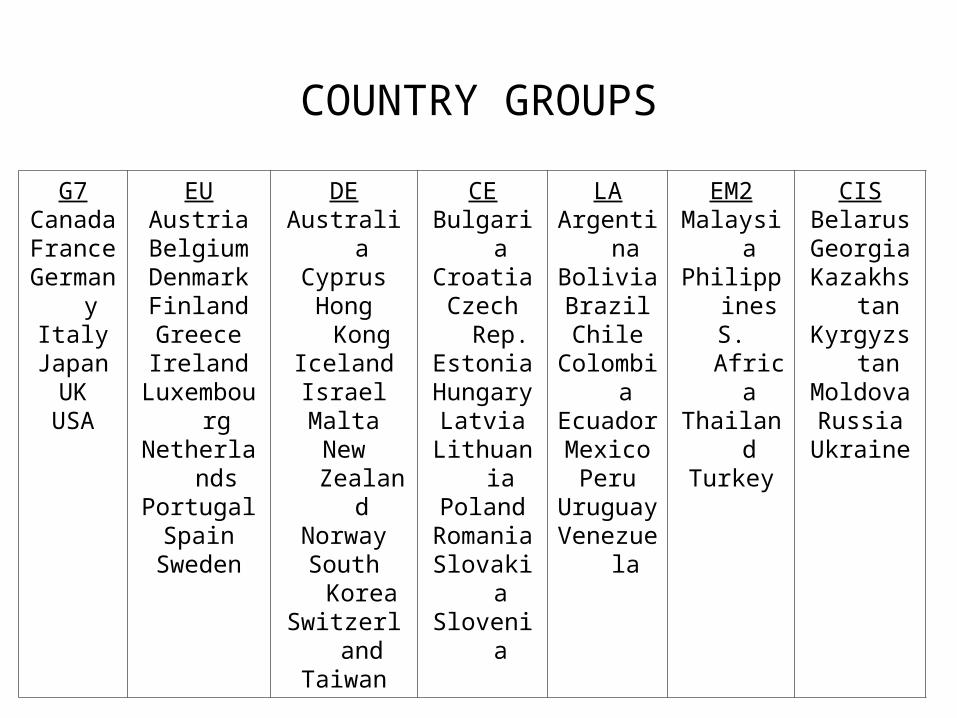
COUNTRY GROUPS
G7CanadaFrance
GermanyItalyJapanUK
USA
EUAustria
BelgiumDenmarkFinlandGreeceIreland
LuxembourgNetherlands
PortugalSpain
Sweden
DEAustraliaCyprus
Hong KongIcelandIsraelMalta
New ZealandNorway
South KoreaSwitzerland
Taiwan
CEBulgariaCroatia
Czech Rep.EstoniaHungaryLatvia
LithuaniaPoland
RomaniaSlovakiaSlovenia
LAArgentina
BoliviaBrazilChile
ColombiaEcuadorMexico
PeruUruguay
Venezuela
EM2Malaysia
PhilippinesS. AfricaThailandTurkey
CISBelarusGeorgia
KazakhstanKyrgyzstan
MoldovaRussia
Ukraine

CYCLICAL MOMENTS
Clean series, select comparable ‘variants’
• Do seasonal adjustment, take logs (but NX)
• Construct variables as needed (net exports to output ratio, productivity)
• Obtain cyclical component: HP filter
• Compute sample statistic– Absolute and relative standard deviation: volatility
– Max. correlation with Y0, Y-4,...,Y+4: comovement
– AR(1): persistence
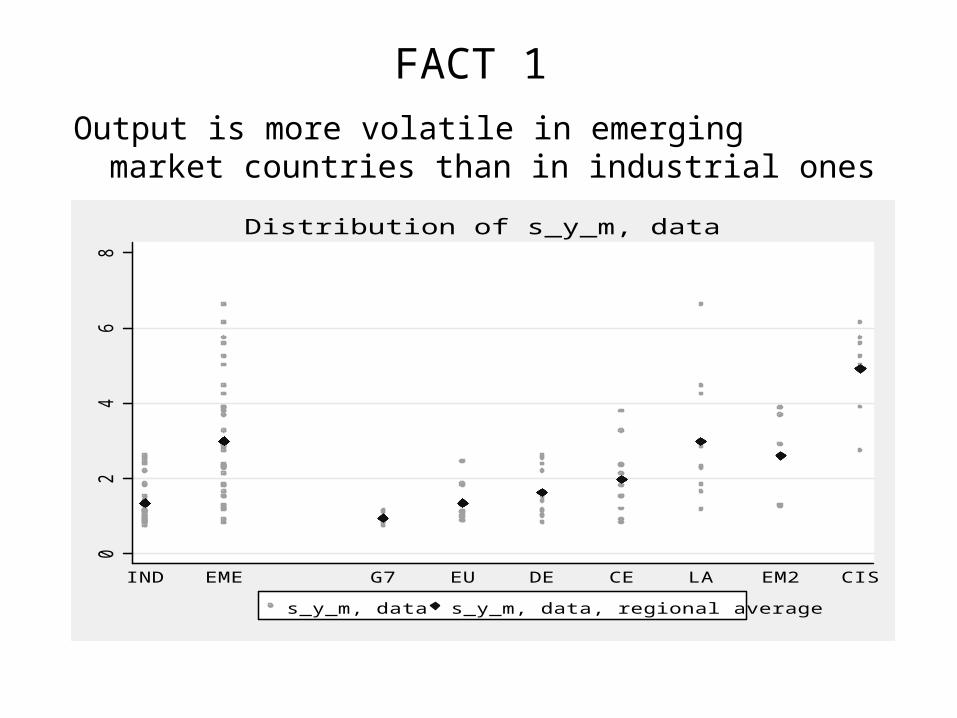
FACT 1
Output is more volatile in emerging market countries than in industrial ones
02
46
8
IND EME G7 EU DE CE LA EM2 CIS
s_y_m, data s_y_m, data, regional average
Distribution of s_y_m, data

FACT 2
Homogeneity in GDP persistence; mean: 0.620
.2.4
.6.8
1
IND EME G7 EU DE CE LA EM2 CIS
ac_y_m, data ac_y_m, data, regional average
Distribution of ac_y_m, data
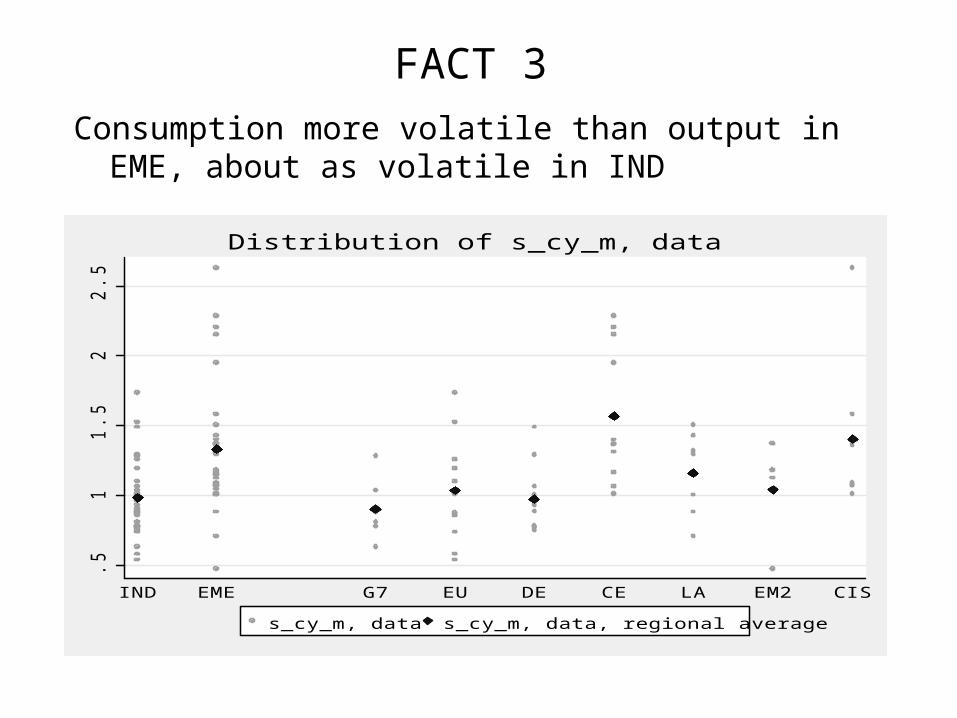
FACT 3
Consumption more volatile than output in EME, about as volatile in IND
.51
1.5
22.5
IND EME G7 EU DE CE LA EM2 CIS
s_cy_m, data s_cy_m, data, regional average
Distribution of s_cy_m, data

FACT 4
Relative investment volatilities about same2
46
810
IND EME G7 EU DE CE LA EM2 CIS
s_iy_m, data s_iy_m, data, regional average
Distribution of s_iy_m, data

FACT 5
Net exports more countercyclical in EME than IND; mainly due to LA
-1-.
50
.5
IND EME G7 EU DE CE LA EM2 CIS
c_nxyy_m, data c_nxyy_m, data, regional average
Distribution of c_nxyy_m, data
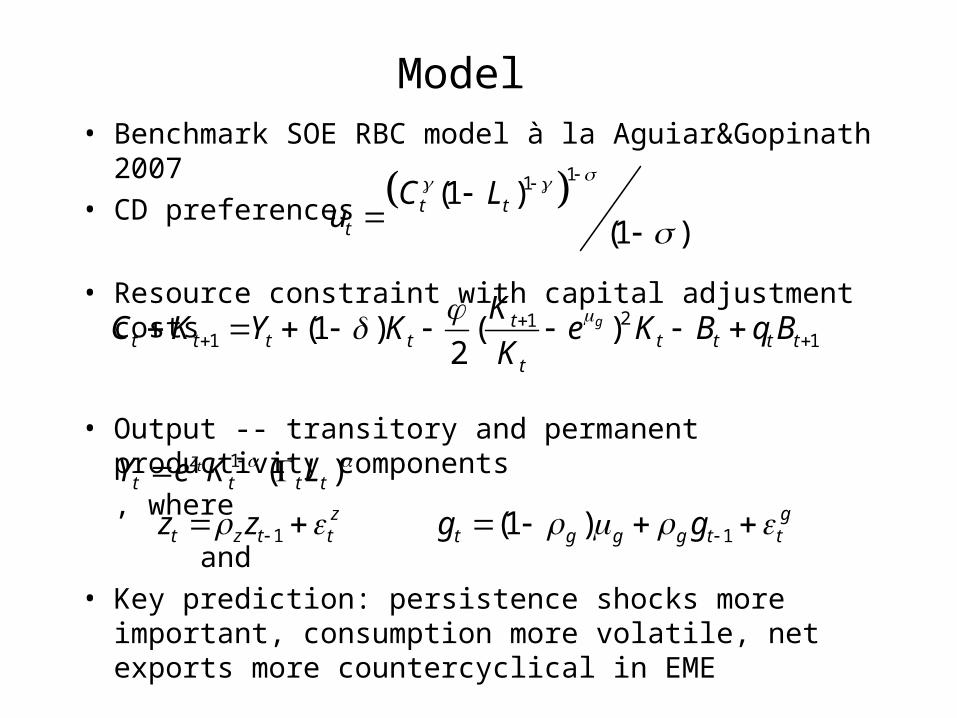
Model • Benchmark SOE RBC model à la Aguiar&Gopinath 2007
• CD preferences
• Resource constraint with capital adjustment costs
• Output -- transitory and permanent productivity components
, where
and
• Key prediction: persistence shocks more important, consumption more volatile, net exports more countercyclical in EME
11(1 )(1 )
t tt
C Lu
211 1(1 ) ( )
2gt
t t t t t t t tt
KC K Y K e K B q B
K
1 ( )tzt t t tY e K L
1z
t z t tz z 1(1 ) gt g g g t tg g

Structural Estimation - GMM
• Model with 13 parameters• estimated, rest calibrated as in
Aguiar&Gopinath 2007• Moment conditions
– Standard deviation of output, relative volatility of consumption, investment, net exports
– Correlation of consumption, investment, relative net exports, employment with output
– First-order autocorrelation in output
• Measures of fit– squared relative deviation between model and data variances
– squared absolute deviation between model and data correlations
• RW component of Solow Residual in B&N decomposition
, , , , ,z g z g g
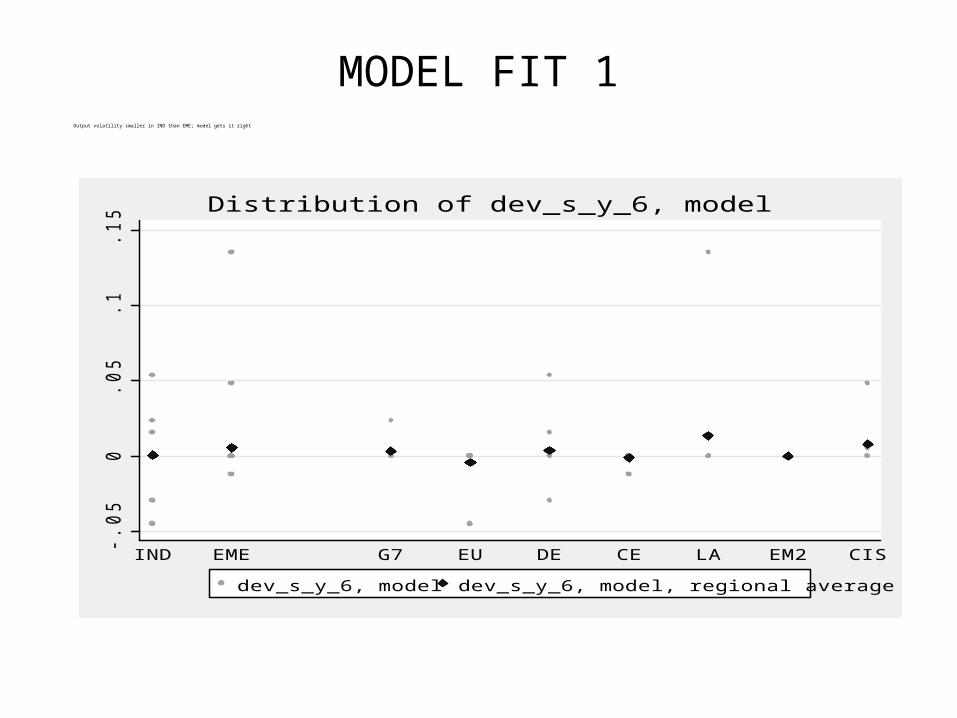
MODEL FIT 1Output volatility smaller in IND than EME; model gets it right
(Percentage difference between data and model moment)
-.05
0.0
5.1
.15
IND EME G7 EU DE CE LA EM2 CIS
dev_s_y_6, model dev_s_y_6, model, regional average
Distribution of dev_s_y_6, model

MODEL FIT 2
Output persistence overpredicted in EME
(Absolute difference between data and model moment)
-30
-20
-10
010
IND EME G7 EU DE CE LA EM2 CIS
dev_ac_y_6, model dev_ac_y_6, model, regional average
Distribution of dev_ac_y_6, model

MODEL FIT 3
Consumption volatility bit underpredicted, IND-EME differential is OK
(Percentage difference between data and model moment)
-100
-50
050
IND EME G7 EU DE CE LA EM2 CIS
dev_s_cy_6, model dev_s_cy_6, model, regional average
Distribution of dev_s_cy_6, model
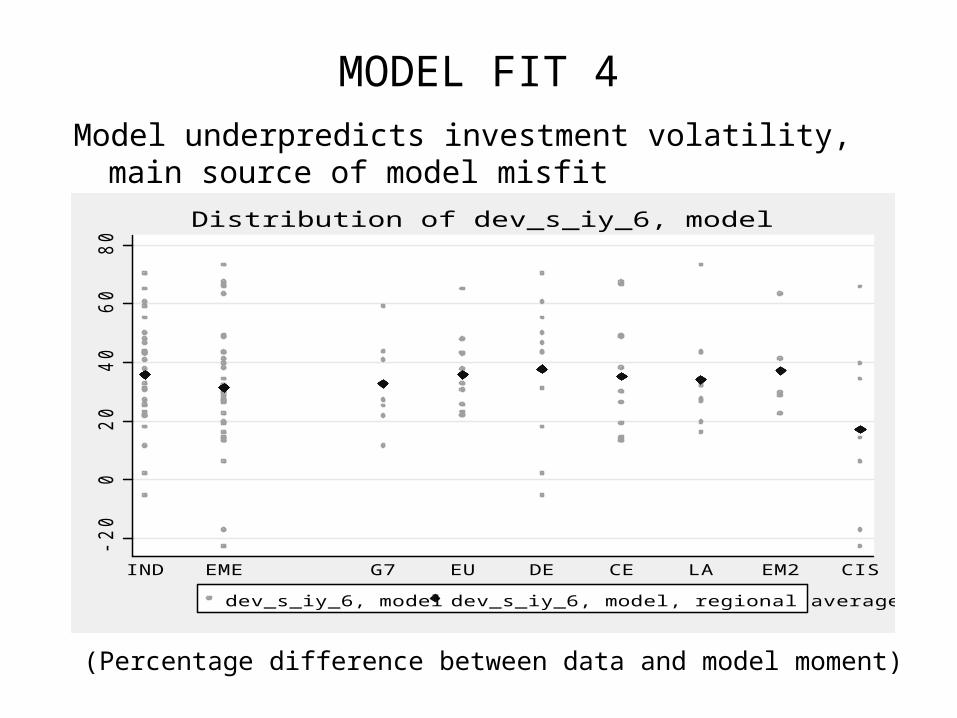
MODEL FIT 4
Model underpredicts investment volatility, main source of model misfit
(Percentage difference between data and model moment)
-20
020
40
60
80
IND EME G7 EU DE CE LA EM2 CIS
dev_s_iy_6, model dev_s_iy_6, model, regional average
Distribution of dev_s_iy_6, model

MODEL FIT 5
Net exports cyclicality slightly overpredicted
(Absolute difference between data and model moment)
-60
-40
-20
020
IND EME G7 EU DE CE LA EM2 CIS
dev_c_nxyy_6, model dev_c_nxyy_6, model, regional average
Distribution of dev_c_nxyy_6, model
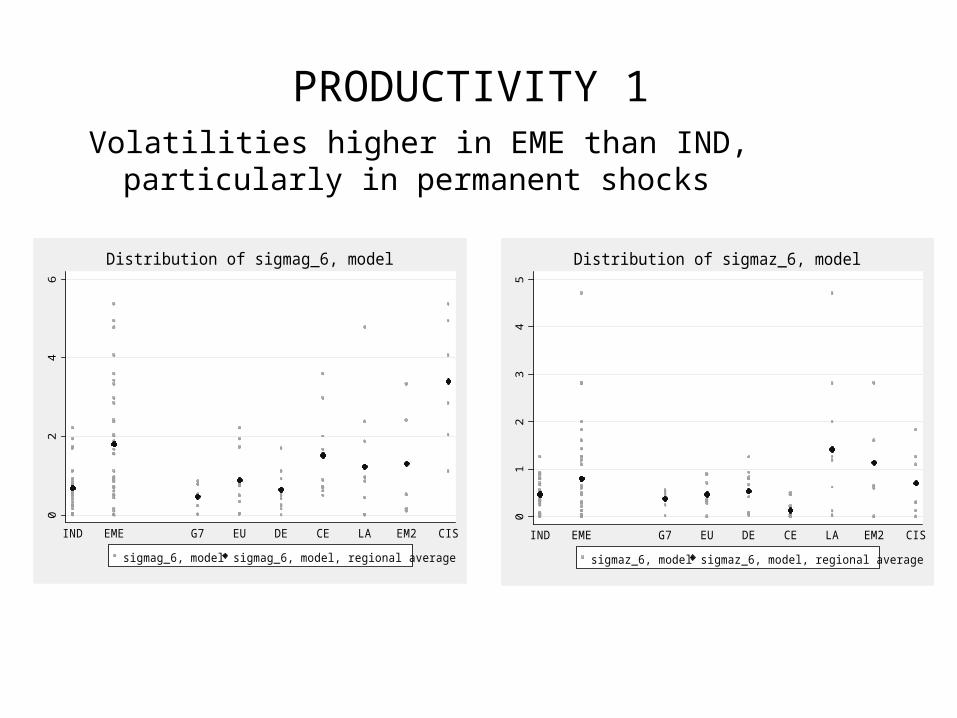
PRODUCTIVITY 1Volatilities higher in EME than IND, particularly in
permanent shocks
01
23
45
IND EME G7 EU DE CE LA EM2 CIS
sigmaz_6, model sigmaz_6, model, regional average
Distribution of sigmaz_6, model
02
46
IND EME G7 EU DE CE LA EM2 CIS
sigmag_6, model sigmag_6, model, regional average
Distribution of sigmag_6, model

PRODUCTIVITY 2Persistence about same in EME and IND in both components
of productivity
-.5
0.5
1
IND EME G7 EU DE CE LA EM2 CIS
rhog_6, model rhog_6, model, regional average
Distribution of rhog_6, model
-1-.
50
.51
IND EME G7 EU DE CE LA EM2 CIS
rhoz_6, model rhoz_6, model, regional average
Distribution of rhoz_6, model

PRODUCTIVITY 3B&N random walk component slightly higher in EME
0.2
.4.6
.81
IND EME G7 EU DE CE LA EM2 CIS
rwcomp_6, model rwcomp_6, model, regional average
Distribution of rwcomp_6, model

CONCLUSION
• New data
• Overriding message: Business Cycles Are NOT Alike! – Massive heterogeneity in basic facts between (and within) groups
of developed and emerging market economies
• Structural estimation – Combine observable moments with model structure
– Reasonable fit of model
– Heterogeneity in productivity parameters
– Mixed support for RBC approach to understand difference between emerging and developed economies