business 205. review of last class noir validity reliability
Post on 20-Dec-2015
216 views
TRANSCRIPT
Business 205

Review of last class
NOIRValidityReliability
Preview for Today
Frequency, Range, Means, Medians, Modes
GraphsVarianceStandard Deviation
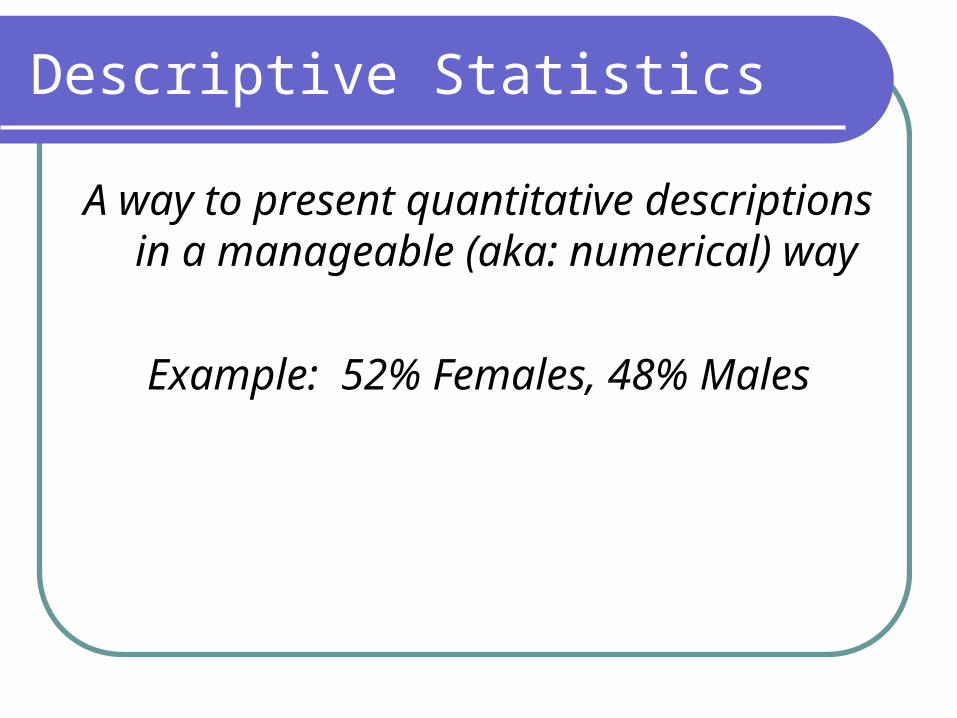
Descriptive Statistics
A way to present quantitative descriptions in a manageable (aka: numerical) way
Example: 52% Females, 48% Males
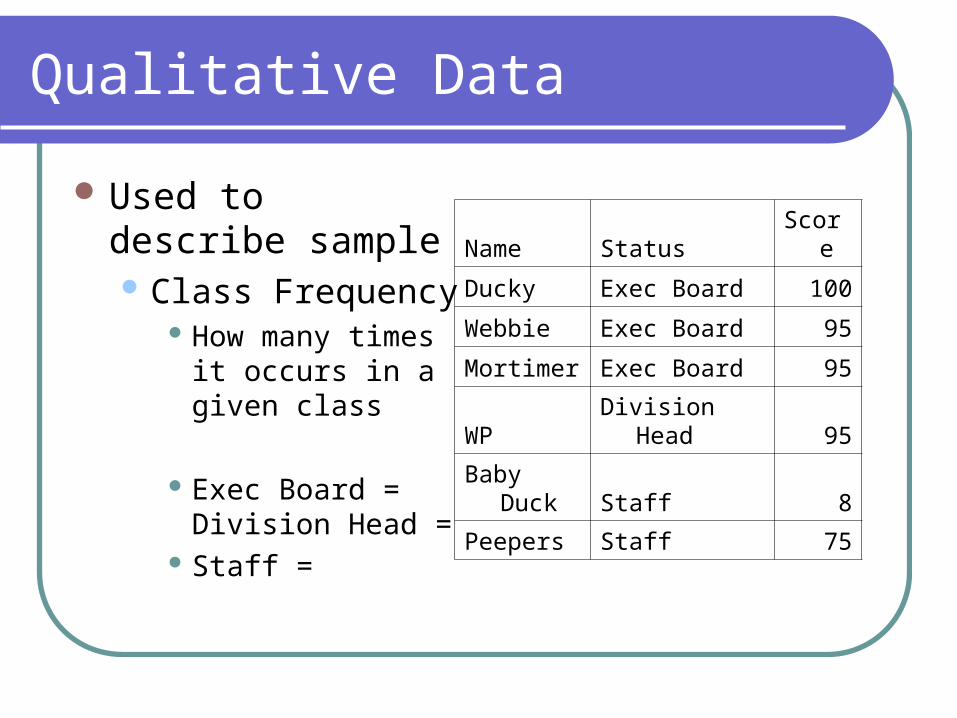
Qualitative Data
Used to describe sample Class Frequency
How many times it occurs in a given class
Exec Board = Division Head =
Staff =
Name Status Score
Ducky Exec Board 100
Webbie Exec Board 95
Mortimer Exec Board 95
WP Division Head 95
Baby Duck Staff 8
Peepers Staff 75
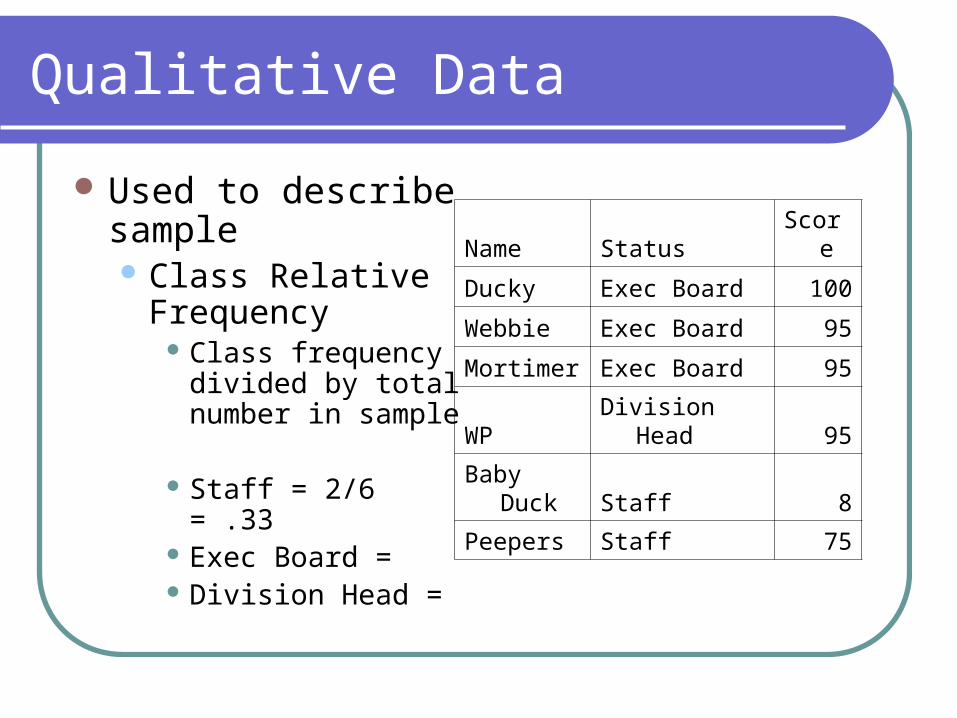
Qualitative Data
Used to describe sample Class Relative
Frequency Class frequency
divided by total number in sample
Staff = 2/6 = .33 Exec Board = Division Head =
Name Status Score
Ducky Exec Board 100
Webbie Exec Board 95
Mortimer Exec Board 95
WP Division Head 95
Baby Duck Staff 8
Peepers Staff 75
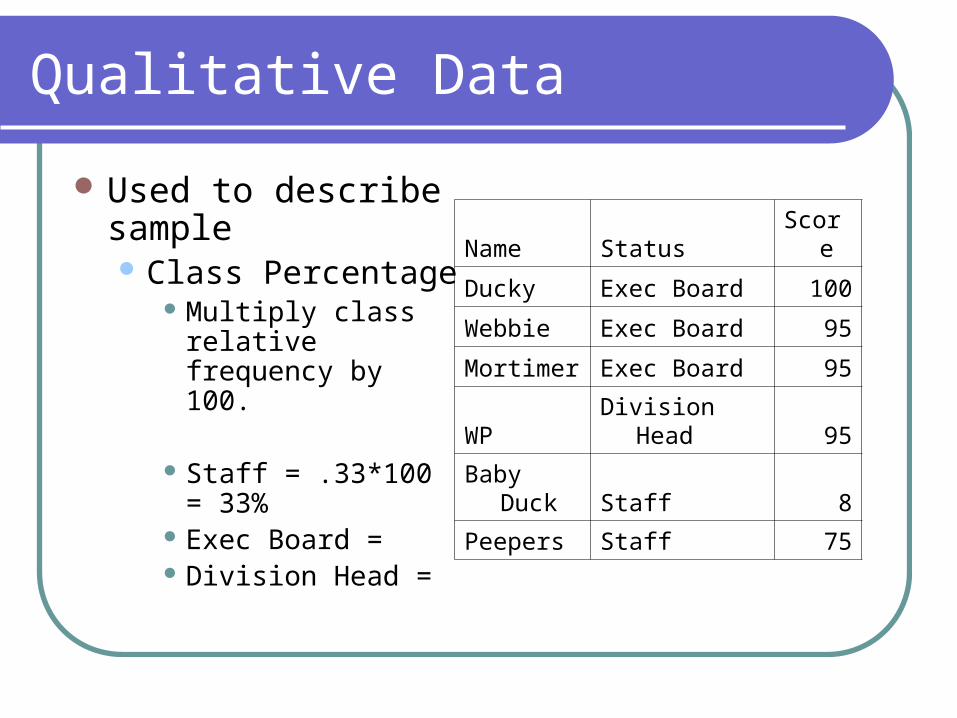
Qualitative Data
Used to describe sample Class Percentage
Multiply class relative frequency by 100.
Staff = .33*100 = 33%
Exec Board = Division Head =
Name Status Score
Ducky Exec Board 100
Webbie Exec Board 95
Mortimer Exec Board 95
WP Division Head 95
Baby Duck Staff 8
Peepers Staff 75
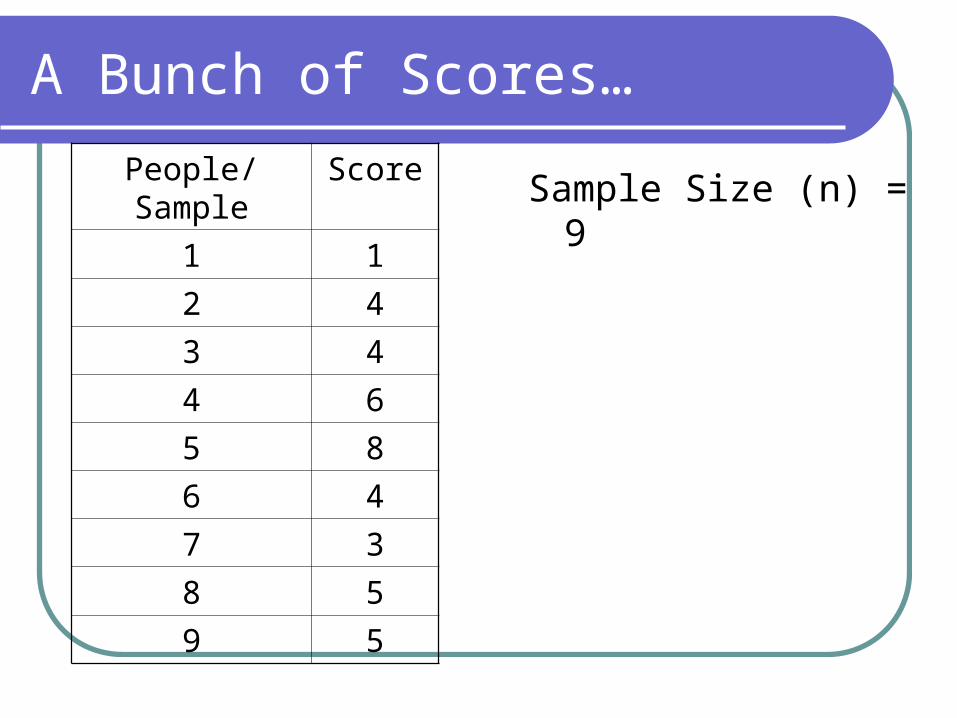
A Bunch of Scores…
Sample Size (n) = 9People/Sample Score
1 1
2 4
3 4
4 6
5 8
6 4
7 3
8 5
9 5
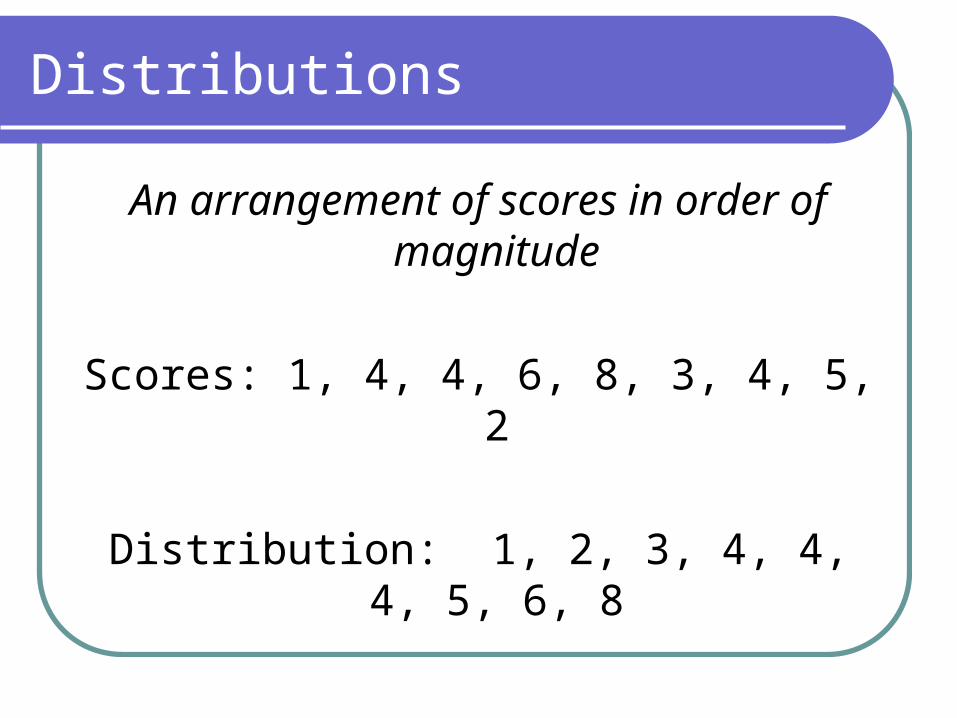
Distributions
An arrangement of scores in order of magnitude
Scores: 1, 4, 4, 6, 8, 3, 4, 5, 2
Distribution: 1, 2, 3, 4, 4, 4, 5, 6, 8
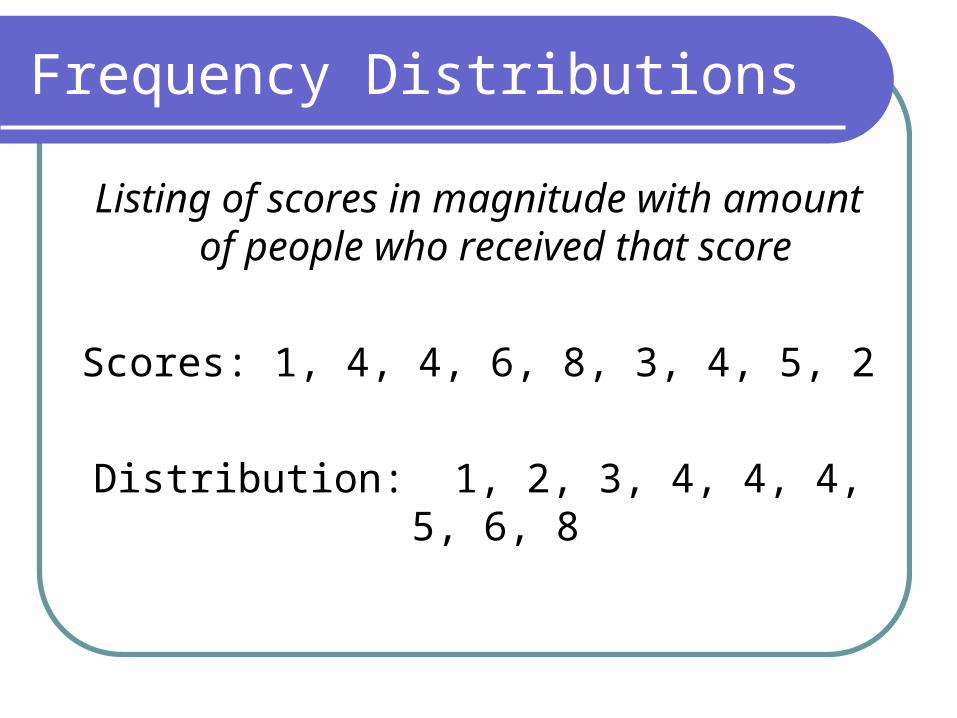
Frequency Distributions
Listing of scores in magnitude with amount of people who received that score
Scores: 1, 4, 4, 6, 8, 3, 4, 5, 2
Distribution: 1, 2, 3, 4, 4, 4, 5, 6, 8
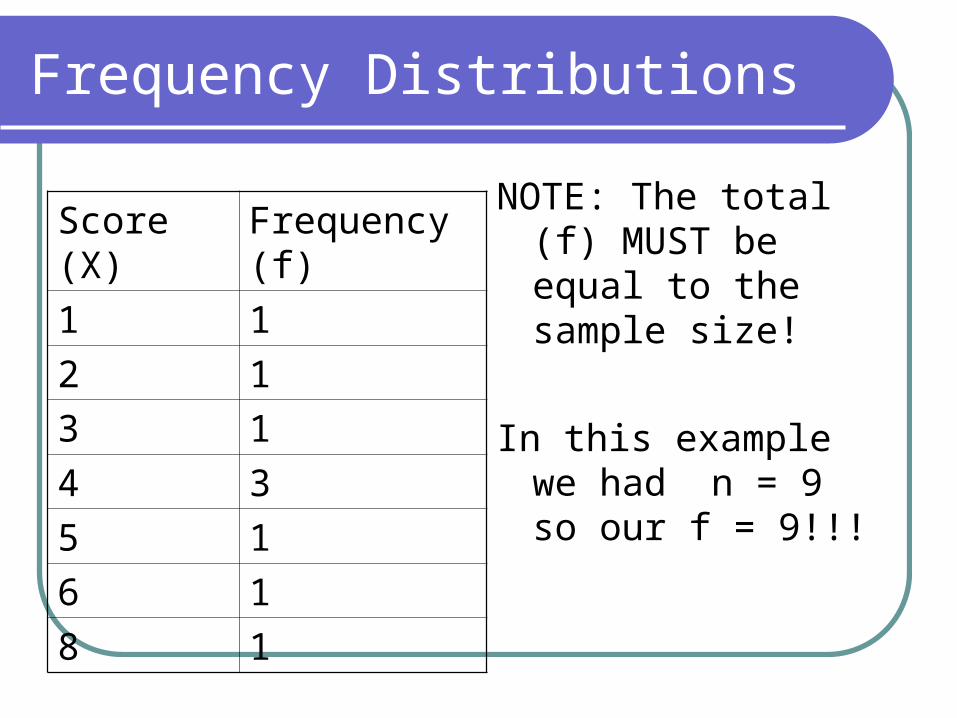
Frequency Distributions
NOTE: The total (f) MUST be equal to the sample size!
In this example we had n = 9 so our f = 9!!!
Score (X) Frequency (f)
1 1
2 1
3 1
4 3
5 1
6 1
8 1
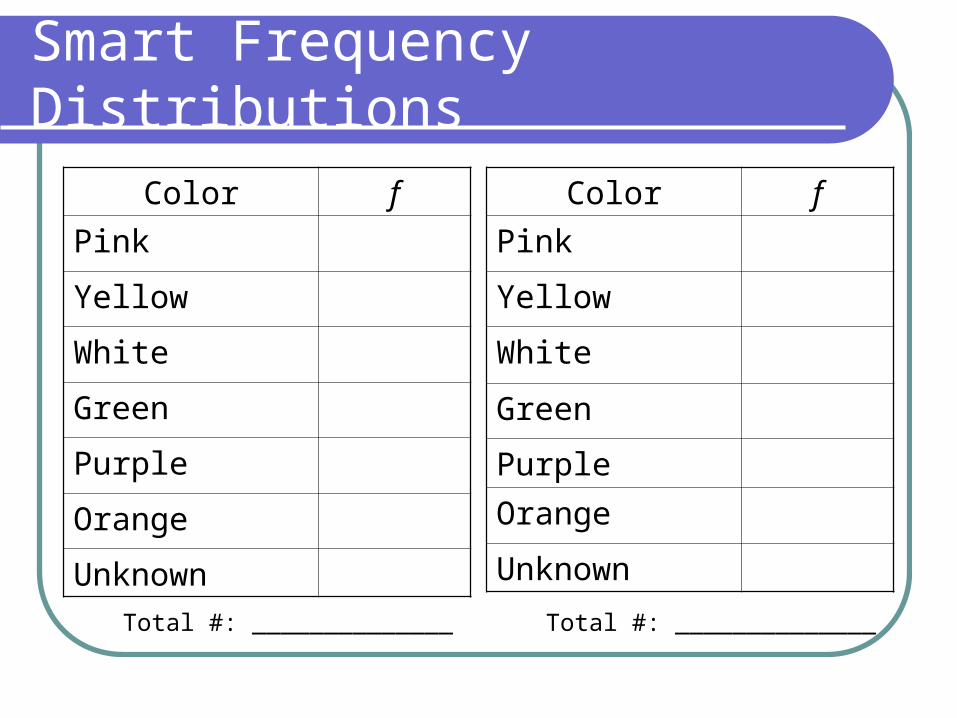
Smart Frequency Distributions
Color f
Pink
Yellow
White
Green
Purple
Orange
Unknown
Total #: ______________
Color f
Pink
Yellow
White
Green
Purple
Orange
Unknown
Total #: ______________
Graphs
Bar GraphsPie ChartsDot PlotsStem-and-Leaf PlotsHistograms
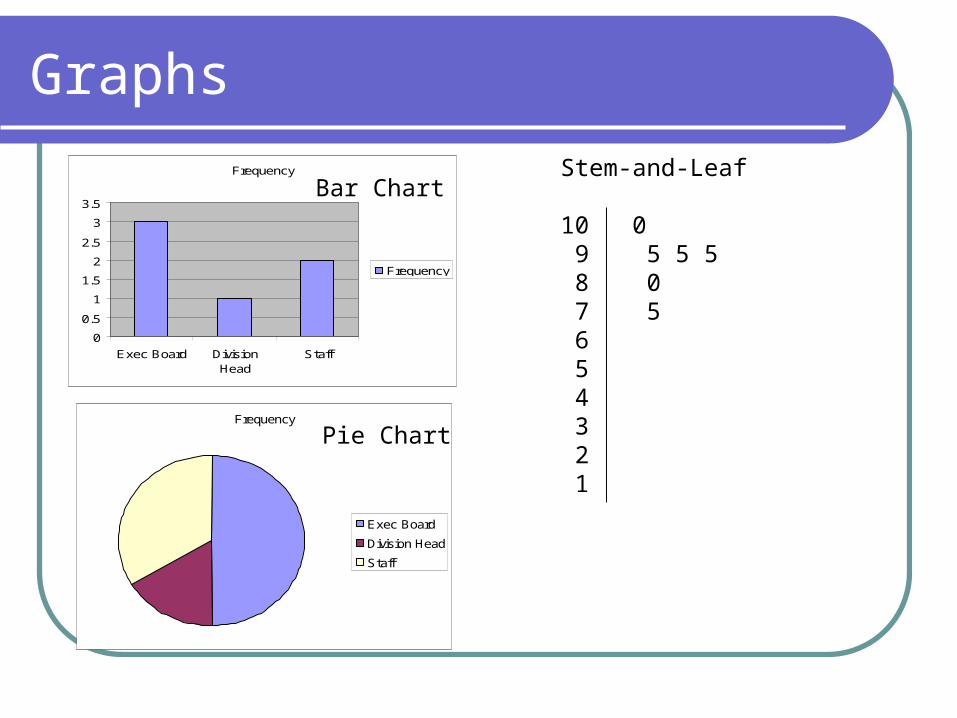
Graphs
Frequency
0
0.5
1
1.5
2
2.5
3
3.5
Exec Board DivisionHead
Staff
Frequency
Bar Chart
Frequency
Exec Board
Division Head
Staff
Pie Chart
Stem-and-Leaf
10 0 9 5 5 5 8 0 7 5 6 5 4 3 2 1
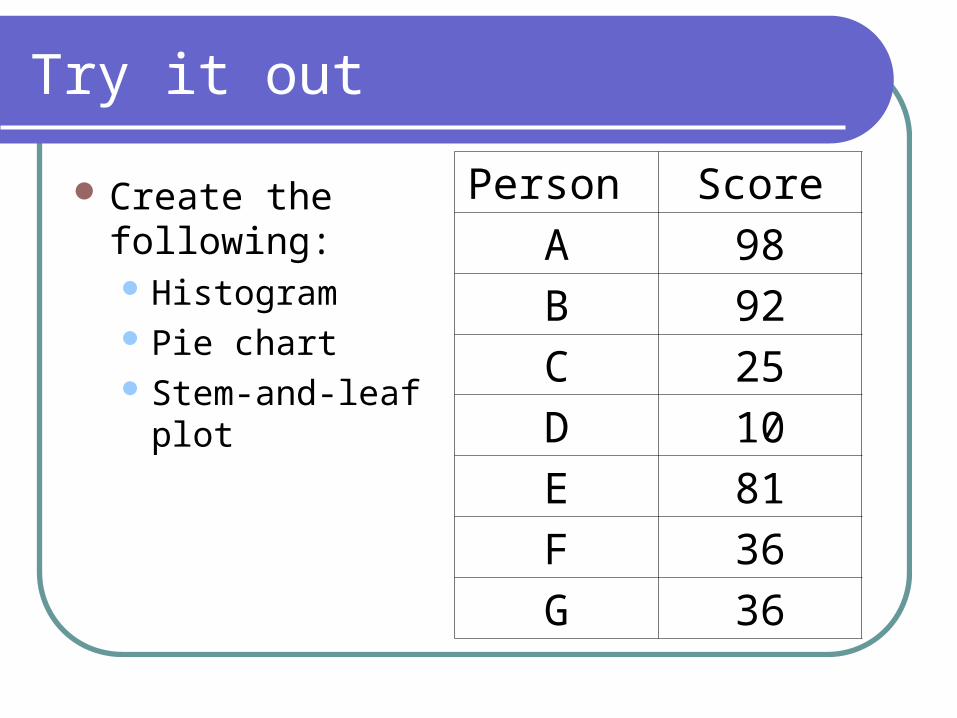
Try it out
Create the following: Histogram Pie chart Stem-and-leaf plot
Person Score
A 98
B 92
C 25
D 10
E 81
F 36
G 36
Central Tendency
Information concerning the average or typical score of the sample interested in.
**Do NOT confuse this with the mean…
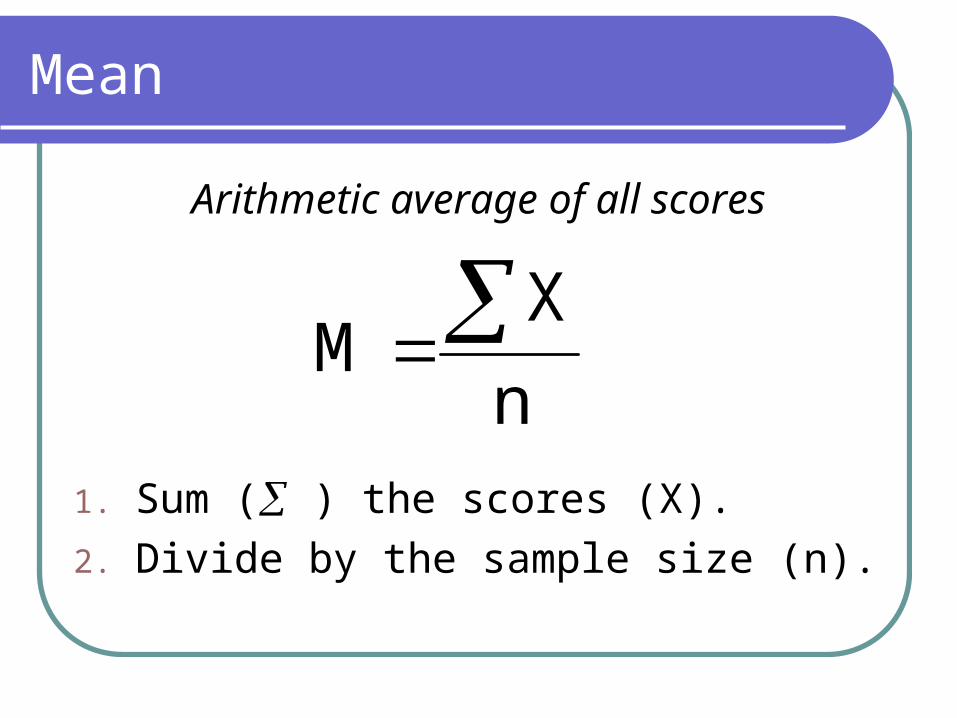
Mean
Arithmetic average of all scores
1. Sum ( ) the scores (X).
2. Divide by the sample size (n).
n
X M
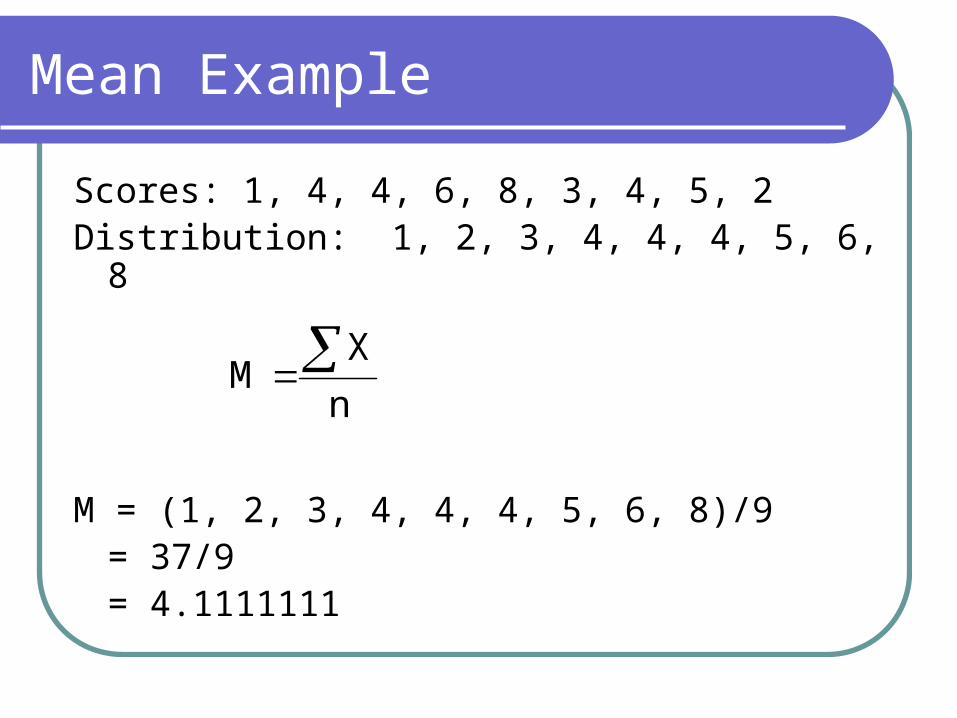
Mean Example
Scores: 1, 4, 4, 6, 8, 3, 4, 5, 2Distribution: 1, 2, 3, 4, 4, 4, 5, 6, 8
M = (1, 2, 3, 4, 4, 4, 5, 6, 8)/9= 37/9= 4.1111111
n
X M
Median
The midpoint of all the scores
1. Put all scores in order
2. Find the middle score1. Interpolate score if necessary
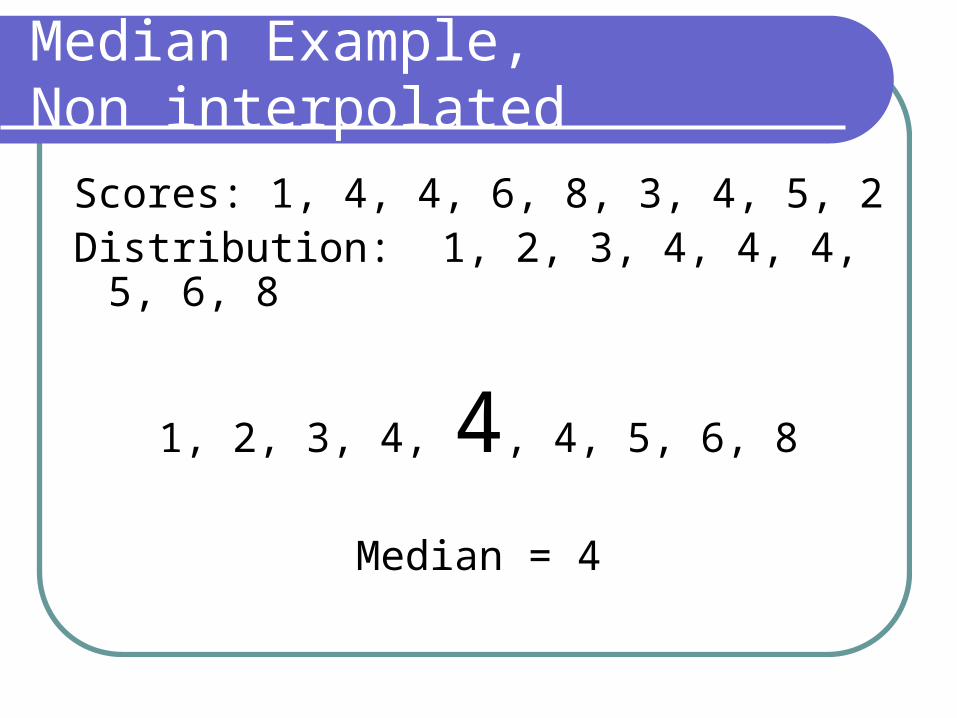
Median Example, Non interpolated
Scores: 1, 4, 4, 6, 8, 3, 4, 5, 2Distribution: 1, 2, 3, 4, 4, 4, 5, 6, 8
1, 2, 3, 4, 4, 4, 5, 6, 8
Median = 4
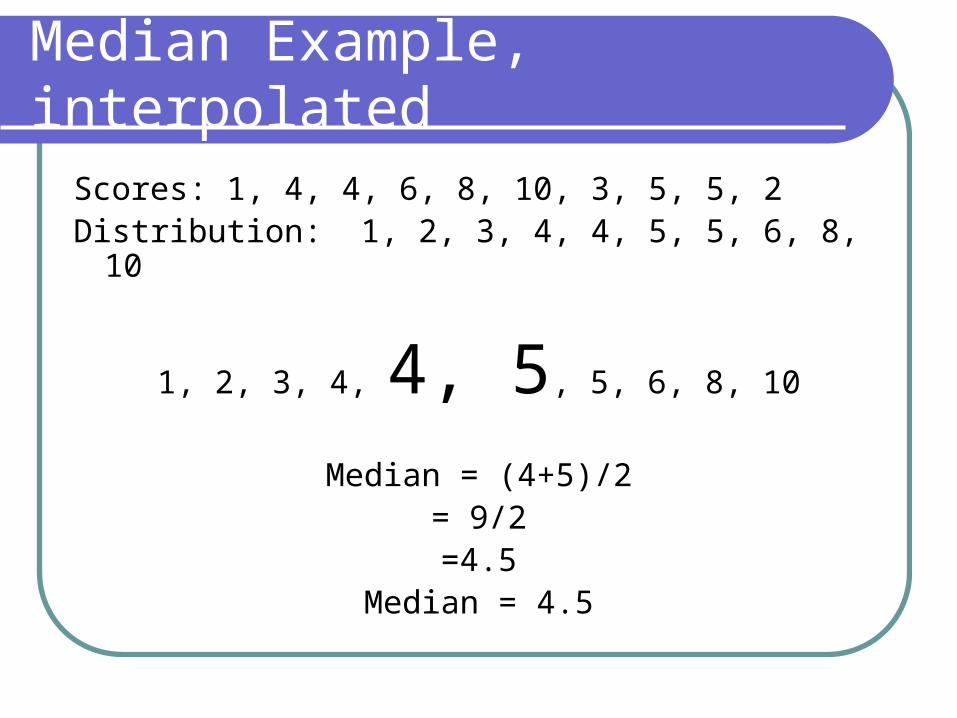
Median Example, interpolated
Scores: 1, 4, 4, 6, 8, 10, 3, 5, 5, 2Distribution: 1, 2, 3, 4, 4, 5, 5, 6, 8, 10
1, 2, 3, 4, 4, 5, 5, 6, 8, 10
Median = (4+5)/2= 9/2=4.5
Median = 4.5
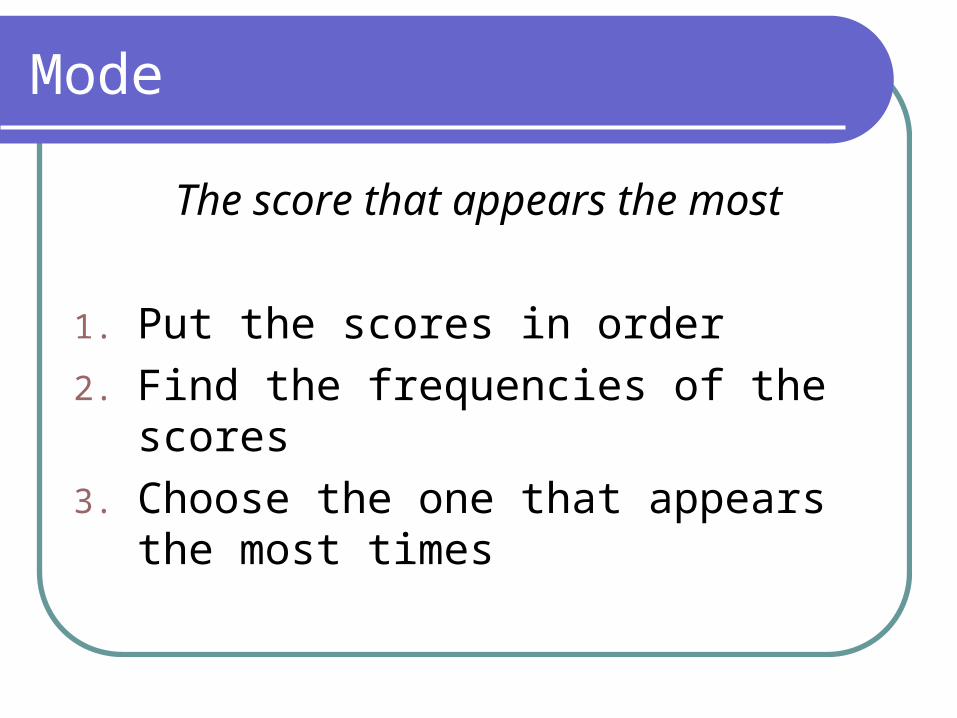
Mode
The score that appears the most
1. Put the scores in order
2. Find the frequencies of the scores
3. Choose the one that appears the most times
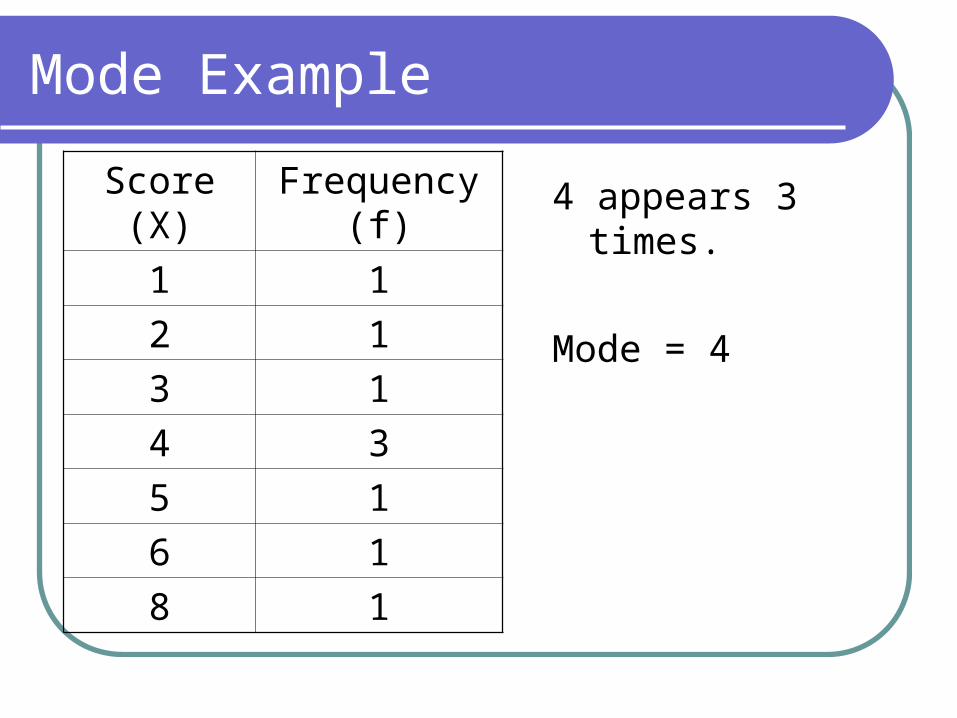
Mode Example
4 appears 3 times.
Mode = 4
Score (X) Frequency (f)
1 1
2 1
3 1
4 3
5 1
6 1
8 1

Mode Example
What if they are all the same in frequency?
Mode = ?
Score (X) Frequency (f)
1 1
2 1
3 1
4 1
5 1
6 1
8 1
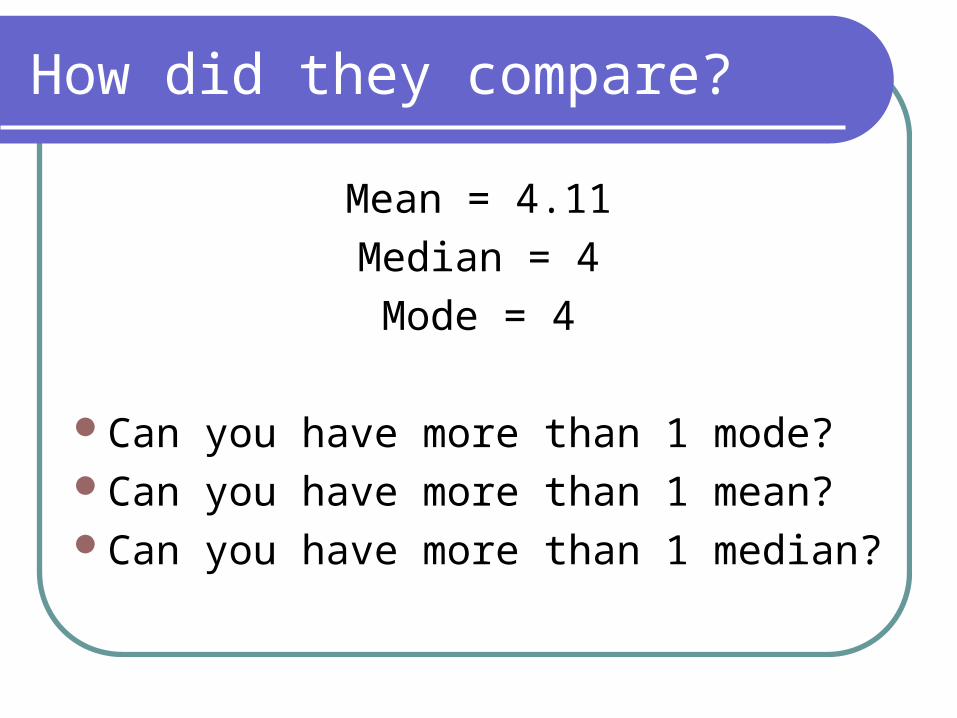
How did they compare?
Mean = 4.11
Median = 4
Mode = 4
Can you have more than 1 mode?Can you have more than 1 mean?Can you have more than 1 median?
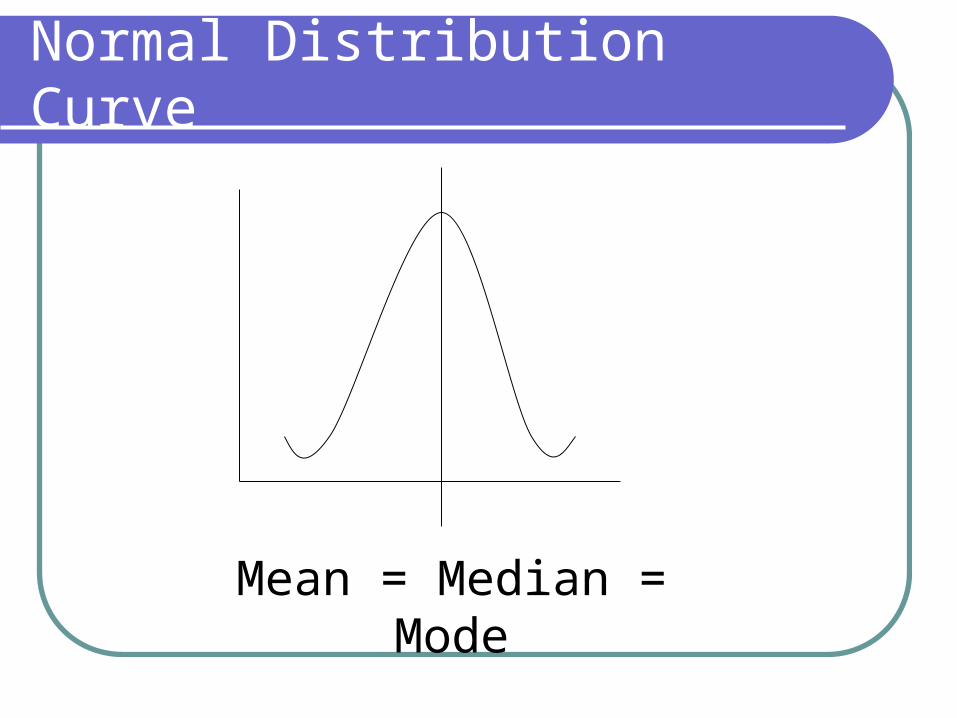
Normal Distribution Curve
Mean = Median = Mode

Positively Skewed
Mode
Median
Mean
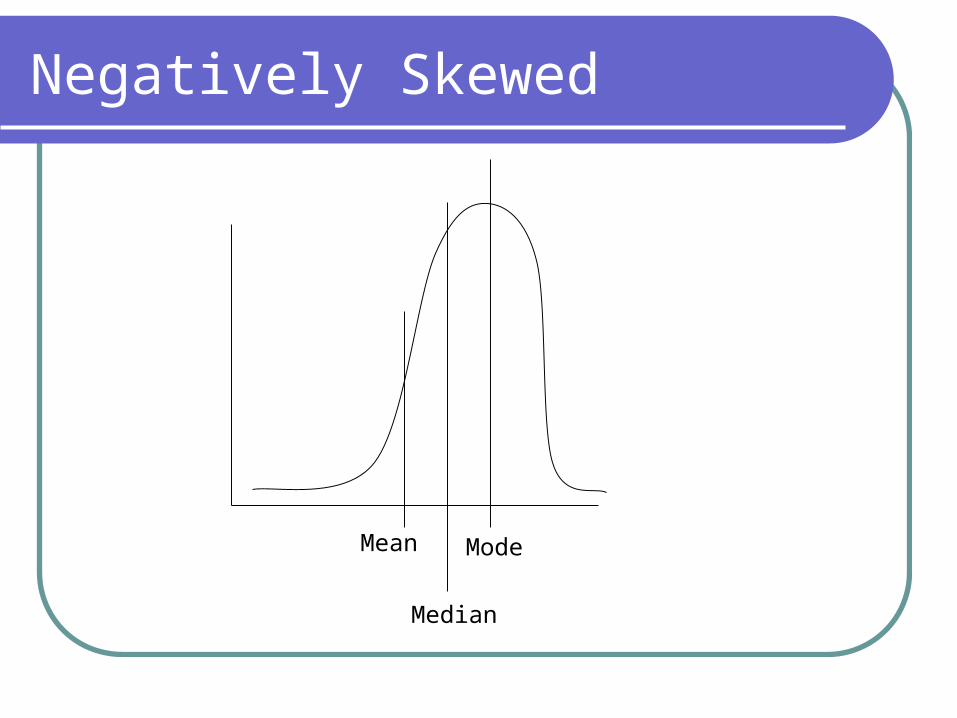
Negatively Skewed
Mean
Median
Mode
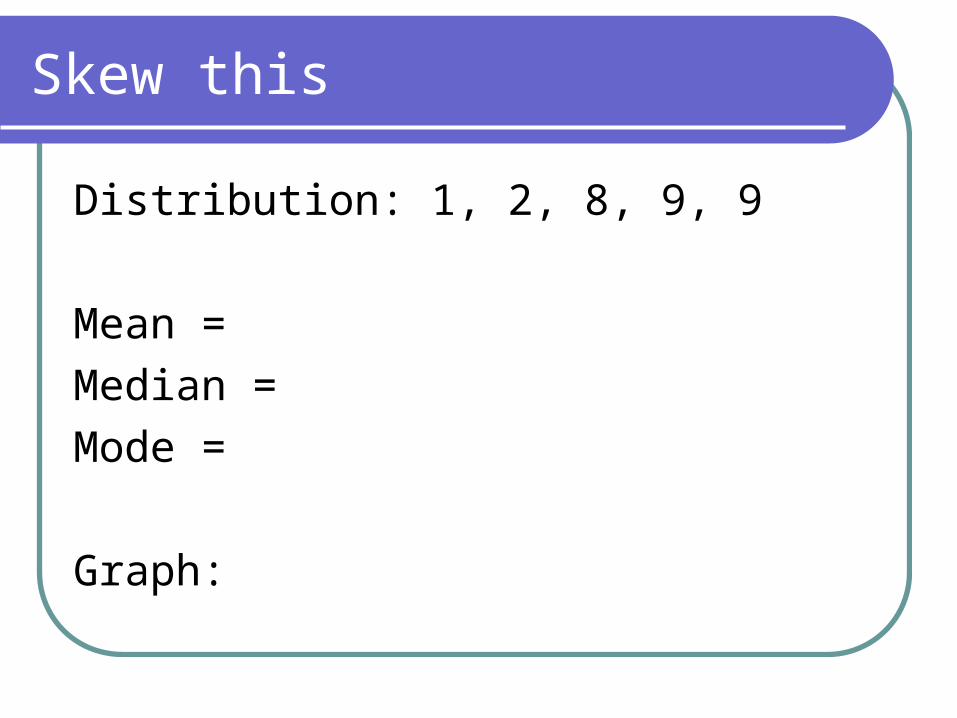
Skew this
Distribution: 1, 2, 8, 9, 9
Mean =
Median =
Mode =
Graph:
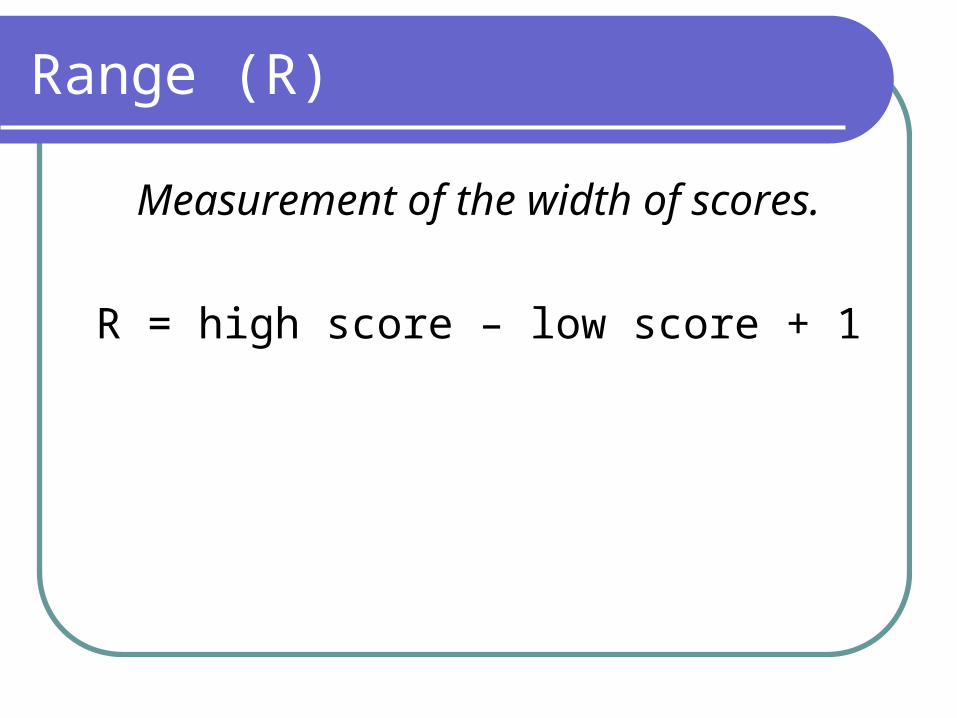
Range (R)
Measurement of the width of scores.
R = high score – low score + 1
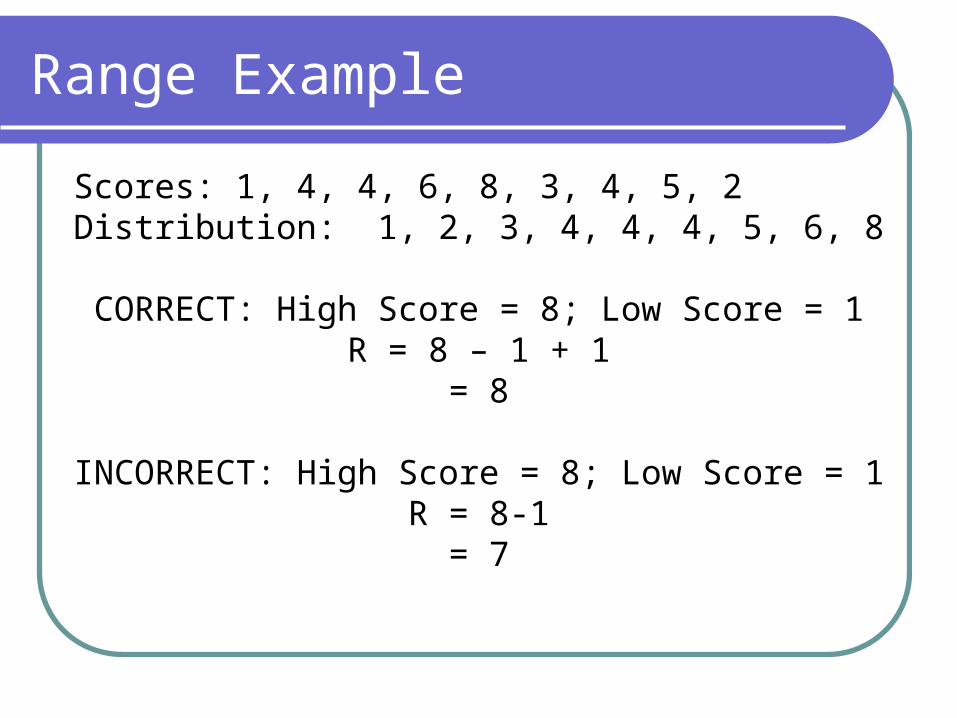
Range Example
Scores: 1, 4, 4, 6, 8, 3, 4, 5, 2Distribution: 1, 2, 3, 4, 4, 4, 5, 6, 8
CORRECT: High Score = 8; Low Score = 1R = 8 – 1 + 1
= 8
INCORRECT: High Score = 8; Low Score = 1R = 8-1
= 7
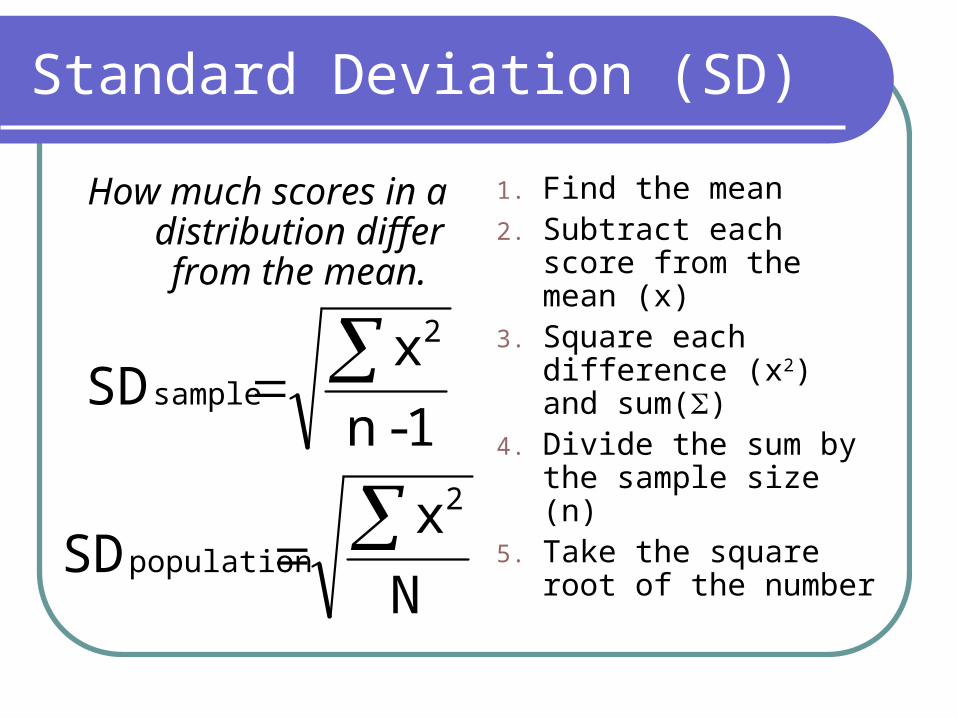
Standard Deviation (SD)
How much scores in a distribution differ from the mean.
1. Find the mean2. Subtract each score
from the mean (x)3. Square each
difference (x2) and sum()
4. Divide the sum by the sample size (n)
5. Take the square root of the number
1 -n
x SD
2
sample
N
x SD
2
population
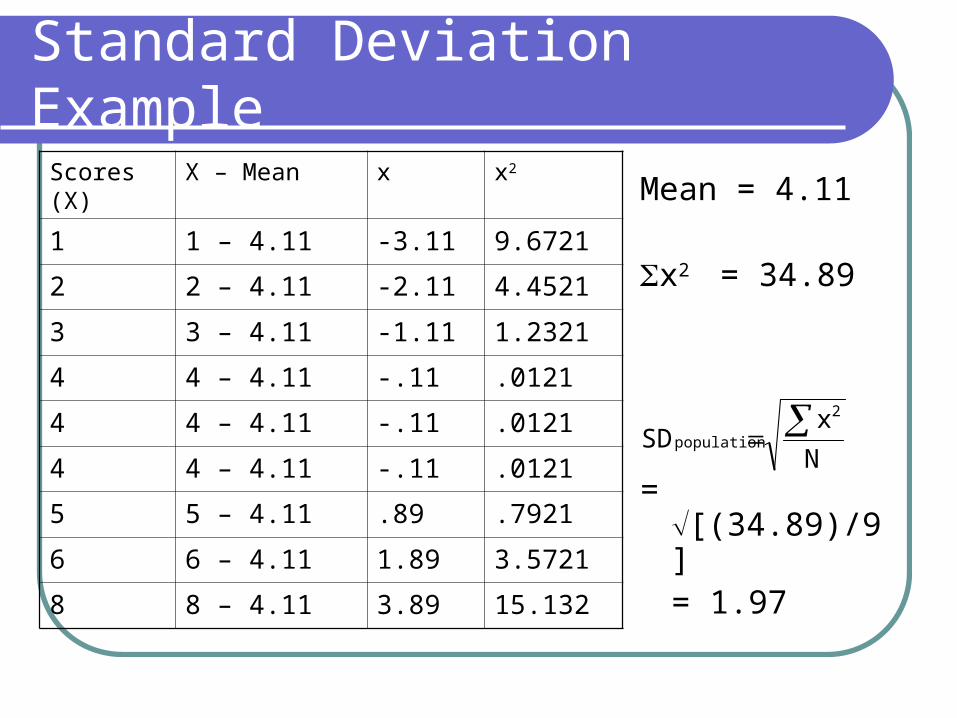
Standard Deviation Example
Mean = 4.11
x2 = 34.89
= [(34.89)/9]= 1.97
Scores (X) X – Mean x x2
1 1 – 4.11 -3.11 9.6721
2 2 – 4.11 -2.11 4.4521
3 3 – 4.11 -1.11 1.2321
4 4 – 4.11 -.11 .0121
4 4 – 4.11 -.11 .0121
4 4 – 4.11 -.11 .0121
5 5 – 4.11 .89 .7921
6 6 – 4.11 1.89 3.5721
8 8 – 4.11 3.89 15.132
N
x SD
2
population
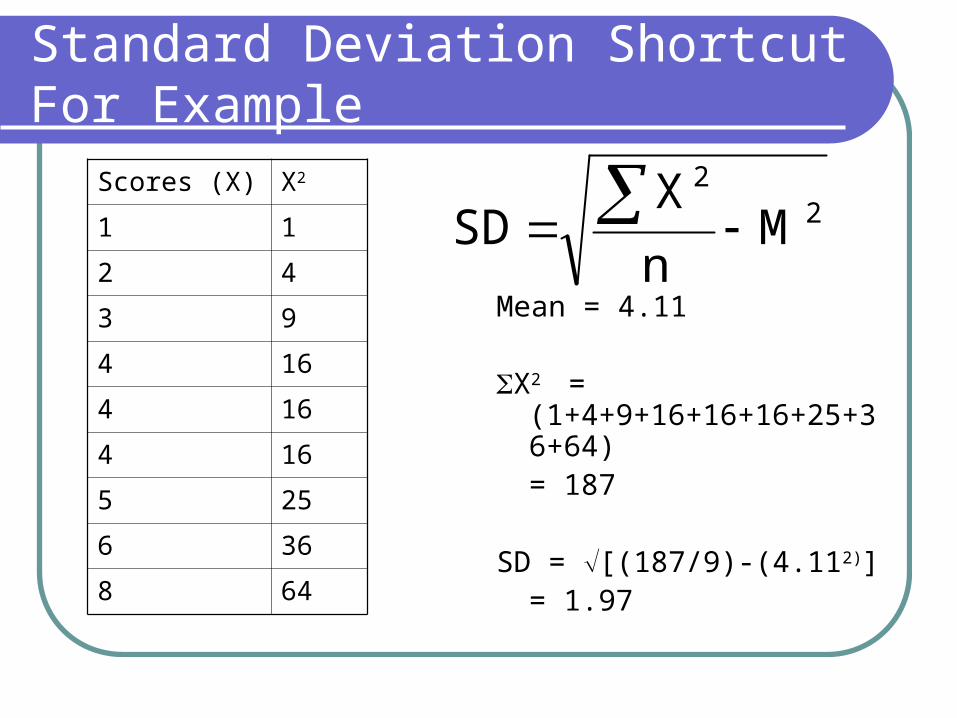
Standard Deviation Shortcut For Example
Mean = 4.11
X2 = (1+4+9+16+16+16+25+36+64)= 187
SD = [(187/9)-(4.112)]= 1.97
Scores (X) X2
1 1
2 4
3 9
4 16
4 16
4 16
5 25
6 36
8 64
22
Mn
X SD
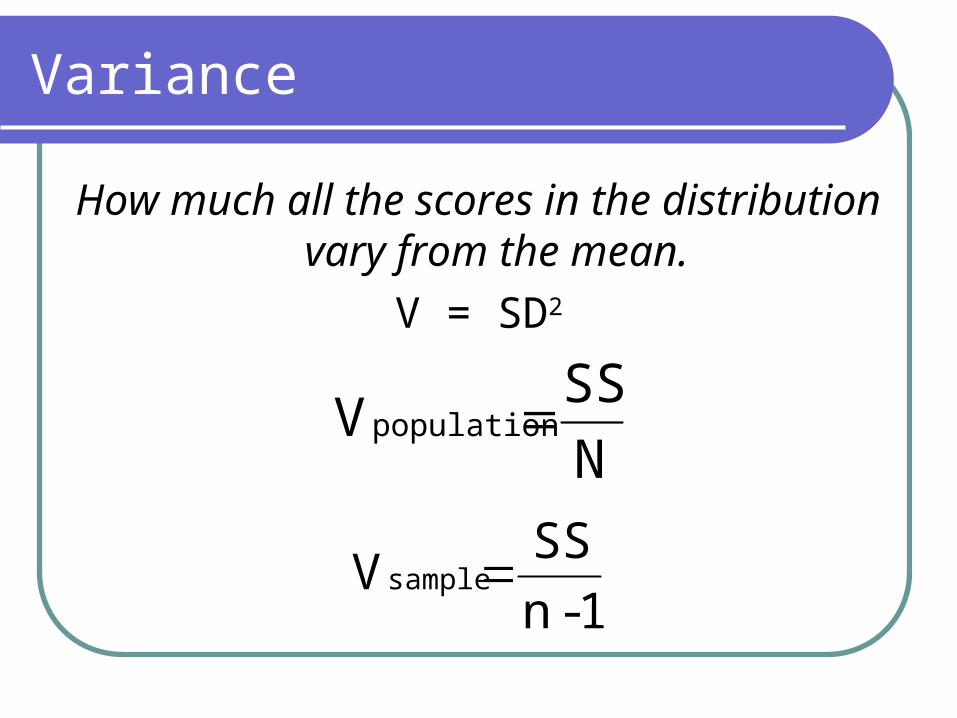
Variance
How much all the scores in the distribution vary from the mean.
V = SD2
N
SS Vpopulation
1 -n
SS Vsample
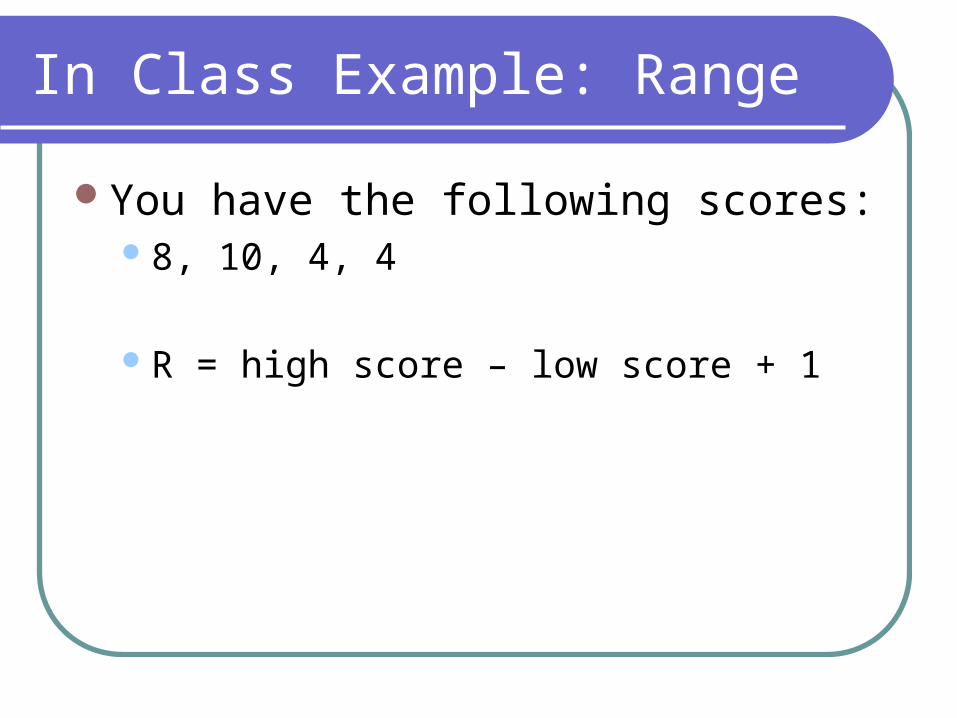
In Class Example: Range
You have the following scores:8, 10, 4, 4
R = high score – low score + 1

In Class Example: Distribution
You have the following scores: 8, 10, 4, 4
Score (X) Frequency (f)

In Class Example: Mean, Median, Mode
You have the following scores: 8, 10, 4, 4
Mean
Median
Mode
n
X M
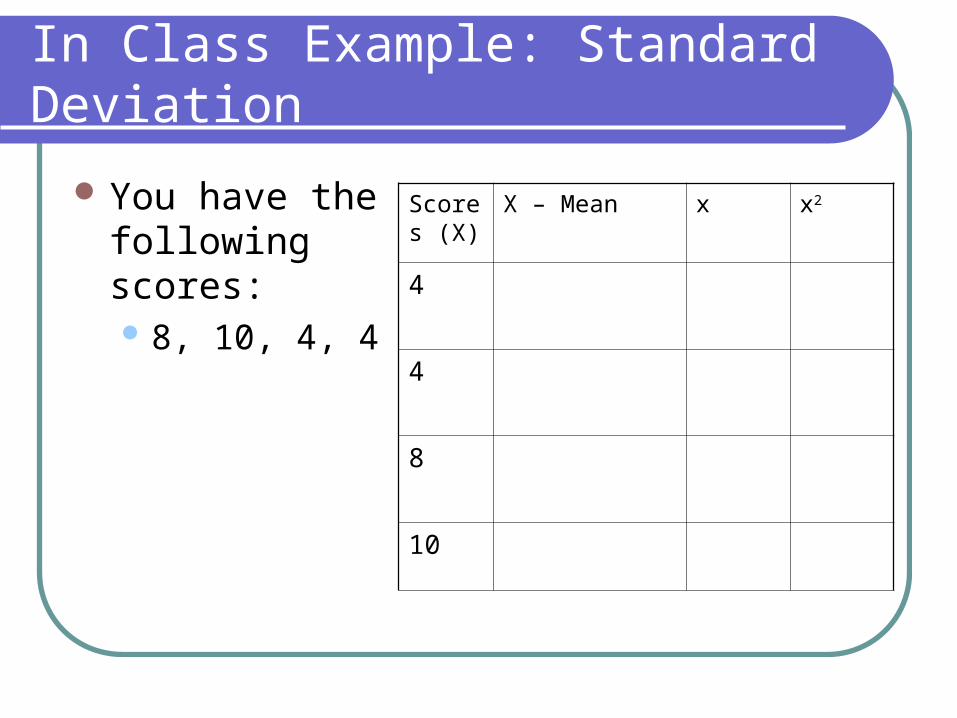
In Class Example: Standard Deviation
You have the following scores: 8, 10, 4, 4
Scores (X)
X – Mean x x2
4
4
8
10
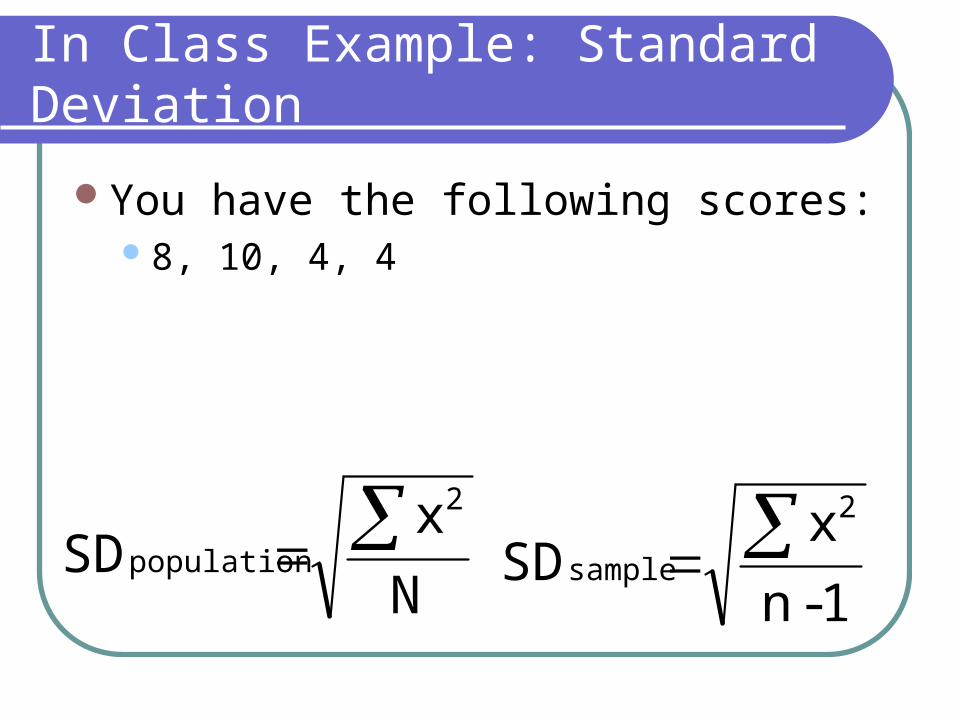
In Class Example: Standard Deviation
You have the following scores:8, 10, 4, 4
1 -n
x SD
2
sample
N
x SD
2
population
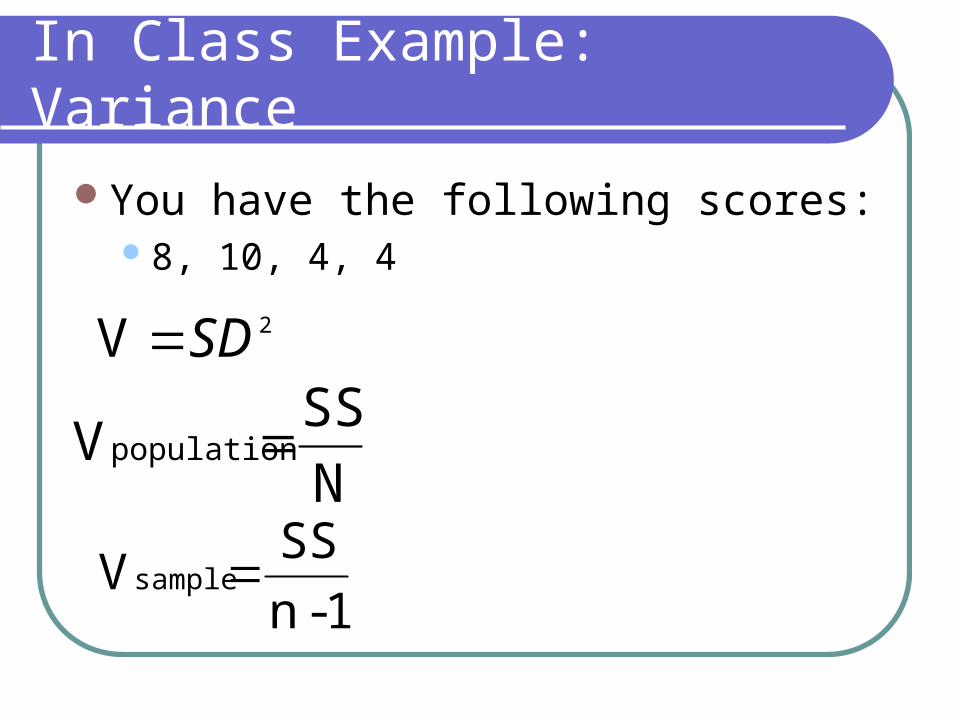
In Class Example: Variance
You have the following scores:8, 10, 4, 4
2 V SD
1 -n
SS Vsample
N
SS Vpopulation