bus trip optimization at directional level in gis
TRANSCRIPT

Bus Trip Optimization at Directional Level in GIS
Xia Xiaotang
March, 2009

Bus Trip Optimization at Directional Level in GIS
By
Xia Xiaotang
Thesis submitted to the International Institute for Geo-information Science and Earth Observation in partial fulfillment of the requirements for the degree of Master of Science in Geo-information Science and Earth Observation, Specialization: (Urban Planning and Management)
Thesis Assessment Board
Chairman: Dr Richard Sliuzas 1st Supervisor: Dr. ir. Mark Zuidgeest 2nd Supervisor: Prof. Dr. Zhengdong Huang External examiner: Prof. Liu Yanfang
INTERNATIONAL INSTITUTE FOR GEO-INFORMATION SCIENCE AND EARTH OBSERVATION
ENSCHEDE, THE NETHERLANDS
i

Disclaimer This document describes work undertaken as part of a programme of study at the International Institute for Geo-information Science and Earth Observation. All views and opinions expressed therein remain the sole responsibility of the author, and do not necessarily represent those of the institute.
ii

Abstract Public transport plays a significant role in large Chinese cities. Due to the large population, Chinese cities have to rely on efficient bus system to release the transportation pressure. At present, the complicated bus transit system is characterized by heavily overlapping bus routes, distributed bus stops as well as the low efficiency of the bus system operation. The main objective of this research is to obtain comprehensive optimal bus trip plans. Based on the bus route network model at the directional level, this research develops an improved methodology to generate optimal transit routes. Based on the impedance of travel time, this method incorporates transfer delay into the algorithm and gradually updates the bus route network attributes to realize the loop optimization. Bus trip optimization is a significant component in urban public transport planning. Particularly, the problem of bus transfer needs to be emphasized in order to provide sound trip guidance. This research uses the detailed directional data to explicitly present the bus network features. In this way, the optimization procedure may generate more accurate results to meet the requirements in complicated transport situations. Firstly, the research explores and investigates the advantages of the multi-tier transit data model. For the effective guidance, the detailed directional level of bus route network features is incorporated into the bus transit database. With the availability of the directional stops, it is possible to model the walking links between the stops. These walking paths are prominent in transfer situation, yet failed to be considered in existing bus trip optimizing methods. This representation serves two purposes: one is to form the elements of the directional network so as to facilitate optimal route computation; the other is to give detail spatial transfer instructions in trip guidance. Next, the improved algorithm introduced in this research aims at getting the multiple optimal routes. The bus trip optimization based on travel time impedance designed to be carried out with a looped procedure. Because general shortest path algorithm can only produce one solution each time, for the purpose to acquire alternative routes, essential changes are made on the network attribute. Finally, experiments are made based on the prototype developed with ArcGIS Engine. Considering passengers’ travel psychology, the multiple optimal routes generated by the prototype have the least travel time and minimal transfer times. The results indicate this prototype may provide the attractive and efficient alternative routes for travellers. It therefore has recommended improving the quality of data source; integrating methods of determining trip impedance; combining the spatial data level for network feature presentation, and the application in transit assignment. Key Words: transit data model, directional level, transfer, optimal path algorithm, GIS
i
Acknowledgments
First and foremost, I would like to give the thankfulness the International Institute for Geo-Information Science and Earth Observation (ITC) and Wuhan University for providing me this precious opportunity to study in the Netherlands. It broadened my view and expanded my knowledge. The precious time together with you will have a special place in my heart! I would like to express my sincere appreciation to both my supervisors. Firstly, to my first supervisor Ir. Mark Zuidgeest, for his unlimited and continuous support and his critical comments aiming to enhance and improve the present research. Secondly, to my second supervisor Prof. Huang Zhengdong at SUD in china, for his earnest help and encouragement during the whole study period. His hardworking spirit, intelligent ideas, critical comments and flexibility are admirable and had a significant effect to this research success. Not only supervise me, also you are my mentor of life. In the hard times of this research, both of them stood by me and supported me, for that I am very thankful and grateful. I also would like to thank the program director Drs.E.J.M.Emile Dopheide for all his help during my study in UPM program. And Ms.Monika Kuffer, for her constructive comments at the start stage in the research period. Special thanks go to the ITC friends, Zhou Jingnan, Zhou Xichang, Cheng Fangfang, Hao Pu, Zhao Xi, Zhang xiang. The valuable experience in Enschede, Netherlands with you all is memorable forever in my life. Your friendship and understanding support me, rise me up and guide me to the success. My sincere appreciation also goes to the colleague in SUD in Wuhan University, Zhou Jun, Wei Xuebing, who gave me the assistance to solving the program encountered during the difficult period in the study.
Of course, all my academic success counts back on the help, support and encouragement that I got from my family. They have always trusted on me and stood by my side when I needed them. Their great sacrifice makes me strong and courageous to continue my study, to pursue my ideal. Their warmest love is the most precious wealth I have. Last but not least, I give my appreciation to the beloved boyfriend, for his encouragement, understanding and care. Thanks for sharing the tears, and stealing the pain.
ii

Table of contents
1 Introduction.................................................................................................................................... 1
1.1 Background and justification ................................................................................................... 1 1.1.1 Transport situation in Wuhan, China ................................................................................ 1 1.1.2 Multi-tier data model for detailed representation ............................................................. 2
1.2 Research problem statement .................................................................................................... 4 1.3 Research objectives.................................................................................................................. 5 1.4 Research questions ................................................................................................................... 5 1.5 Conceptual framework ............................................................................................................. 6 1.6 Research design........................................................................................................................ 6
2 Literature Review and Theory Description................................................................................. 9
2.1 Transit network data model...................................................................................................... 9 2.1.1 Network models.............................................................................................................. 10 2.1.2 Process models ................................................................................................................11 2.1.3 Object models................................................................................................................. 13
2.2 Transit trip optimization approach ......................................................................................... 13 2.3 Network analyst in ArcGIS .................................................................................................... 14
2.3.1 Function of network analyst extension........................................................................... 14 2.3.2 Best route in Network Analyst ....................................................................................... 14
2.3.2.1 What's the best route................................................................................................... 14 2.3.2.2 Finding the best route ................................................................................................. 15
2.3.3 Network datasets in Network Analyst ............................................................................ 15 2.3.3.1 What is a network dataset ........................................................................................... 15 2.3.3.2 Network elements ....................................................................................................... 15
2.3.4 Connectivity of the network datasets.............................................................................. 15 2.3.5 Network attribute............................................................................................................ 16 2.3.6 Turns in the network dataset........................................................................................... 17
2.3.6.1 Multi-edge turns ......................................................................................................... 18 2.3.6.2 U-turns ........................................................................................................................ 18
3 Transportation Characteristic in Wuhan City.......................................................................... 20
3.1 A profile of study area............................................................................................................ 20 3.2 Characteristics of urban transport in Wuhan .......................................................................... 20
3.2.1 Transport development ................................................................................................... 21 3.2.1.1 Overview of the development in motor industry ........................................................ 21 3.2.1.2 Development of public transport ................................................................................ 21
3.3 Importance of public transport ............................................................................................... 22 3.4 Transport challenges .............................................................................................................. 22
4 Bus Network Construction at the Directional Level................................................................. 24
4.1 Introduction of the multi-tier bus data model ........................................................................ 24 4.2 Network in directional level of bus system in Wuhan ........................................................... 25
4.2.1 Elements of the transit network...................................................................................... 26 4.2.1.1 Fundamental elements ................................................................................................ 26 4.2.1.2 Network datasets built for performing network analysis............................................ 27
4.2.2 Analysis and application of the network ........................................................................ 28
5 Optimization of Transit Trip at the Directional Level.............................................................. 30
5.1 Problems with current route searching tool in ArcGIS .......................................................... 30 5.2 An improved algorithm.......................................................................................................... 32
5.2.1 The objectives................................................................................................................. 32 5.2.2 The general process ........................................................................................................ 33
iii

5.2.3 The algorithm ................................................................................................................. 34 5.3 A bus optimization prototype in ArcGIS................................................................................ 37
5.3.1 Overview of the prototype.............................................................................................. 37 5.3.1.1 Background of the prototype development................................................................. 37
5.3.2 Functions of the prototype.............................................................................................. 38 5.4 Experimental results in Wuhan .............................................................................................. 39
5.4.1 Case One......................................................................................................................... 39 5.4.2 Case Two ........................................................................................................................ 41 5.4.3 Conclusions .................................................................................................................... 43
6 Conclusions and recommendations............................................................................................ 45
6.1 General conclusions ............................................................................................................... 45 6.2 Results against research objectives ........................................................................................ 45 6.3 Study area recommendations ................................................................................................. 46 6.4 Further research recommendations ........................................................................................ 47
Reference.............................................................................................................................................. 49
iv
Table of figure Figure 1-1 Wuhan in China .................................................................................................................. 1
Figure 1-2 Cases of route stops of the same name with different spatial locations.............................. 2
Figure 1-3 Bus lines and stops of directional data level in Wuhan City .............................................. 3
Figure 1-4 The directional network (Huang and Wang 2007).............................................................. 4
Figure 1-5 Research conceptual framework......................................................................................... 6
Figure 1-6 Research framework ........................................................................................................... 8
Figure 2-1 Connectivity rules one ...................................................................................................... 15
Figure 2-2 Connecting edges within a connectivity group................................................................. 16
Figure 2-3 Connectivity rules two...................................................................................................... 16
Figure 2-4 Turns in the network dataset............................................................................................. 17
Figure 2-5 Multi-edge turn in divided roads ...................................................................................... 18
Figure 2-6 U-turn in same edge.......................................................................................................... 18
Figure 2-7 U-turn in divided roads..................................................................................................... 18
Figure 3-1 Wuhan city........................................................................................................................ 20
Figure 3-2 Wuhan bus system structure ............................................................................................. 21
Figure 3-3 Mass transit amount of passenger transport 1990 - 2007(*10000 person) .................. 21
Figure 3-4 Wuhan Bus Transit Passenger Indicators in 2007............................................................. 22
Figure 4-1 The three-tier framework for the urban transit system (Huang and Wang 2007) ............. 25
Figure 4-2 Network of city entire bus system .................................................................................... 26
Figure 4-3 Identification of the directional stop in the network......................................................... 26
Figure 4-4 Identification of the directional bus lines in the network ................................................. 27
Figure 4-5 Identification of the walking routes in the network.......................................................... 27
Figure 4-6 The definition of edge element in ArcGIS........................................................................ 28
Figure 4-7 Identification of the selected bus stop .............................................................................. 28
Figure 4-8 The bus lines information passing the stop....................................................................... 29
Figure 5-1 Generate the optimal route for the given two points ........................................................ 30
Figure 5-2 Simple optimal transit path use the ArcGIS Network Analyst function ........................... 30
Figure 5-3 Detail information of the transfer ..................................................................................... 31
Figure 5-4 Trip guidance window in ArcGIS..................................................................................... 31
Figure 5-5 The process of trip guidance GIS prototype ..................................................................... 33
Figure 5-6 The Network Dataset Properties....................................................................................... 35
Figure 5-7 Script Evaluators of the turn attribute............................................................................... 35
Figure 5-8 The flowchart of the improved algorithm......................................................................... 36
Figure 5-9 Overview of bus optimization prototype .......................................................................... 37
Figure 5-10 Properties of the added layer .......................................................................................... 38
v
Figure 5-11 Network analyst application in the GIS prototype.......................................................... 39
Figure 5-12 Case 1: O-D pair application of the system .................................................................... 40
Figure 5-13 Case 1: attributes of multiple optimal routes in database ............................................... 41
Figure 5-14 Case 1: Trip guidance information (sample interface).................................................... 41
Figure 5-15 Case 2: O-D pair application of the system .................................................................... 42
Figure 5-16 Case 2: attributes of multiple optimal routes in database ............................................... 42
Figure 5-17 Case 2: walking route of the transfer .............................................................................. 43
Figure 5-18 Case 2: Trip guidance information (sample interface).................................................... 43
vi

Bus trip optimization at directional level in GIS
1 Introduction
The general conditions of transport in developing countries include the shortage of infrastructure supply, highly mixed usage of vehicles, low accessibility, high traffic incident rates, and severe environmental impact. Due to large population size, fast increase of motor vehicles and slow improvements on road space, large cities in China are increasingly confronted with transport problems. The public transit system in Chinese large cities is characterized by complicated transit network, highly overlapping transit routes, and dispersed locations of homonymous bus stops. Public transport has been regarded as one of the major means to alleviate these problems, and in many of these cities the major mode of public transport is still the bus. In such heavily bus-oriented cities, due to the complexity of the bus transit system, how to provide citizens the optimal bus trip guidance is a challenging task, and now be concerned by increasing people. Based on the technique of spatial data modelling, the developed model needs to represent the network entities in multiple spatial levels. The multi-tier data model, especially the directional level introduced in this research, provides the possibility to compute the precise transfer delay, which is appropriate for cities with complex bus transit system, and may satisfy the needs of bus trip guidance with different optimizing criteria.
1.1 Background and justification
1.1.1 Transport situation in Wuhan, China
Wuhan is the capital city of Hubei province, China, with over 7 million residents and 450 square kilometres area. Due to its central location in China (Figure1-1), Wuhan has been an important hub connecting the north and south, and the east and west of China for more than 400 years. For a long history, Wuhan has relied on bus system, which now comprises over 4000 bus coaches, 260 bus lines and nearly 500 bus stops (Huang and Wang 2007). It is clear that the current bus system will keep on being the most important and conventional public transit method.
Figure 1-1 Wuhan in China
1

Bus trip optimization at directional level in GIS
With urbanization and socio-economic sustainable development, the requirement of the urban public transport is increasing. Meanwhile, the significance of public transport planning is emphasized by both the inadequate supply for infrastructure of public transport and the low efficiency of the urban road construction which far behind the growth of traffic volume. This concern regarding urban transport in China began in 1980s, aroused by the nationwide development policies that dramatically stimulated mobility in Chinese large cities. Thus, the public transport is especially encouraged by the transport polices. In large urban areas, there has been a growing recognition that public transportation is an important part of solutions to traffic congestion. The technology of channeling the traffic flow and the management of public transport system can not satisfy the increasing severed traffic congestion. With this concern and more information from the experiences of developed countries, transport experts and researchers introduced some urgent policy measures. As to improve the traffic environment, and alleviate urban traffic congestion, an important policy called “public transport priority” has been widely accepted by citizens. Furthermore, the focus goes to improve the quality of transportation system and strengthen the urban transport planning. The transportation system has a great influence and impact on regional patterns of development, economic viability, environmental impacts, and on maintaining socially acceptable levels of quality of life (Chang 2005). For a pubic transit system to be a feasible alternative to travellers, it must be able to provide its users with reasonable travel time and convenience.
1.1.2 Multi-tier data model for detailed representation
Most GIS and transport model applications have utilized a simplified method to represent bus line and line stops (TAN, TONG et al. 2004), i.e. one line symbol represents two directions of bus line, and one point represents a line stop that includes two or more stop sites. As buses have different timetables in their two directions, the directional route representation is necessary to better reflect the real situation in trip guidance. The need for more detailed bus representation can be further justified by special cases existing in heavily transit-oriented cities like Wuhan. Firstly, a bus line may have two different or partly different routes in its two directions. The reasons for these cases might be traffic controls (e.g. one-way streets and vehicle controls) or demand-driven (omitting certain stops during peak hours) (Sheth, Triantis et al. 2007). Based on the explanations above, conventional singe line representation is not appropriate for the different route situation. Secondly, at a place where several bus lines meet, a stop of the same name may have several individual sites. Ordinarily a bus stop has two stop sites on opposite sides of a street and the two sites are not far away from each other along the street. The complex situation, for example in Wuhan, is shown in Figure 1-2.
(a) At intersection: mixed directions (b) Around the block: one way (c) Around the block: mixed directions Figure 1-2 Cases of route stops of the same name with different spatial locations
2

Bus trip optimization at directional level in GIS
The spatial location of routes and stops is of great importance for trip guidance, especially considering the specific transfer situation. The detailed representation of transit lines in two directions will reflect the reality and give concrete guidance to transit passengers in their trip route searching. So, in this research, the following aspects need to be emphasized:
Transit networks have to be defined with reference to base street networks
A bus stop serving many lines may have more than two spatial locations
Bus stops have to be represented on both sides of the street
A multi-tier data model is developed in response to these requirements. The multi-tier data model puts transit features under one unified framework, which facilitates multi-scale applications of bus transit system, especially defined for dynamic transit trip planning, and operational transit data management (Huang 2006). A multi-tier data model is developed with reference to existing transit data models. The directional level is the lowest tier and detailed structure in multi-tier. With availability of this detailed directional level, it provides the possibility to model and evaluate the model the walking links among the transfer stops, which is play an important role in analysis of the complex transfer situation. It is proposed with two major objectives. Firstly, to represent complicated transit structure, especially the bus transit system in Chinese cities. Secondly, to develop a general framework for bus transit related applications, ranging from transit planning to user trip guidance. The directional data model is composed of entities that include objects (non-spatial), features (spatial) and network. Under the circumstances of Wuhan in China, the bus transit data model for trip guidance needs to be analyzed based on directional level (Figure 1-3).
Figure 1-3 Bus lines and stops of directional data level in Wuhan City
The Directional Tier: routes and stops are represented at the true geographical locations (Directional Routes and Directional Stops). Attributes are attached to these features. Directional routes are spatially delineated along the geometric paths (usually the outer lanes of streets). This level is suitable for ITS applications such as bus trip guidance and facility management (Huang
3
Bus trip optimization at directional level in GIS
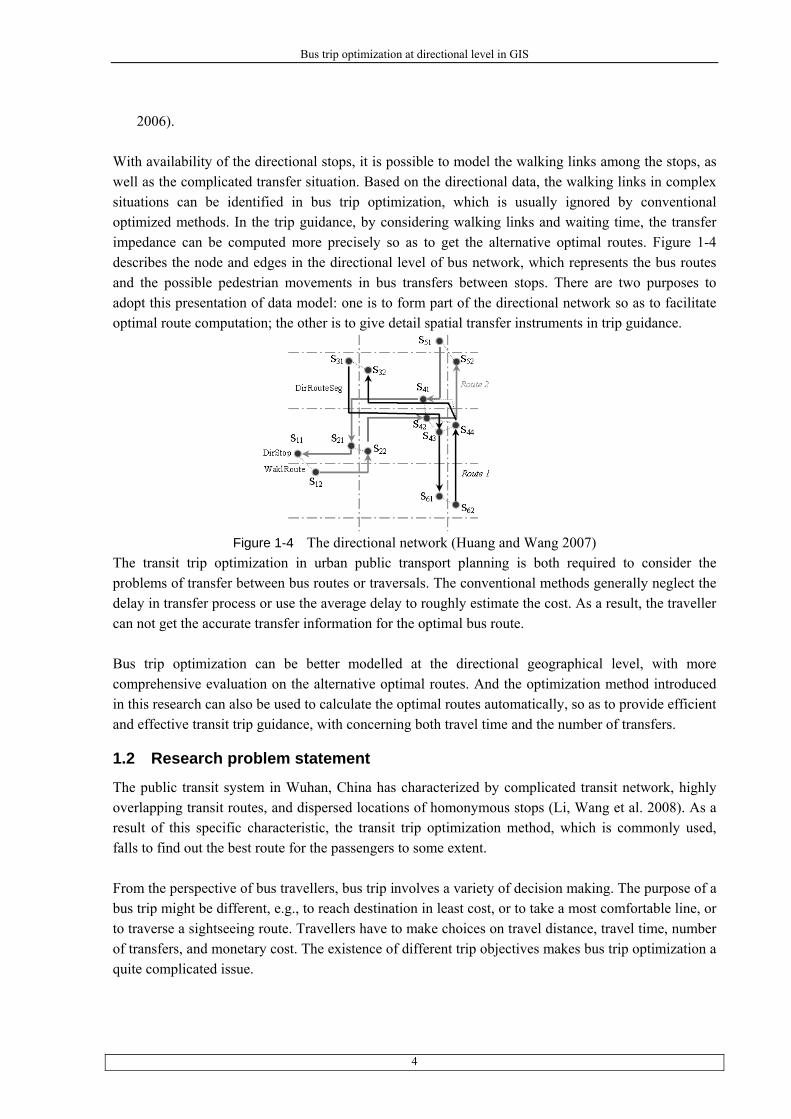
2006). With availability of the directional stops, it is possible to model the walking links among the stops, as well as the complicated transfer situation. Based on the directional data, the walking links in complex situations can be identified in bus trip optimization, which is usually ignored by conventional optimized methods. In the trip guidance, by considering walking links and waiting time, the transfer impedance can be computed more precisely so as to get the alternative optimal routes. Figure 1-4 describes the node and edges in the directional level of bus network, which represents the bus routes and the possible pedestrian movements in bus transfers between stops. There are two purposes to adopt this presentation of data model: one is to form part of the directional network so as to facilitate optimal route computation; the other is to give detail spatial transfer instruments in trip guidance.
Figure 1-4 The directional network (Huang and Wang 2007)
The transit trip optimization in urban public transport planning is both required to consider the problems of transfer between bus routes or traversals. The conventional methods generally neglect the delay in transfer process or use the average delay to roughly estimate the cost. As a result, the traveller can not get the accurate transfer information for the optimal bus route. Bus trip optimization can be better modelled at the directional geographical level, with more comprehensive evaluation on the alternative optimal routes. And the optimization method introduced in this research can also be used to calculate the optimal routes automatically, so as to provide efficient and effective transit trip guidance, with concerning both travel time and the number of transfers.
1.2 Research problem statement
The public transit system in Wuhan, China has characterized by complicated transit network, highly overlapping transit routes, and dispersed locations of homonymous stops (Li, Wang et al. 2008). As a result of this specific characteristic, the transit trip optimization method, which is commonly used, falls to find out the best route for the passengers to some extent. From the perspective of bus travellers, bus trip involves a variety of decision making. The purpose of a bus trip might be different, e.g., to reach destination in least cost, or to take a most comfortable line, or to traverse a sightseeing route. Travellers have to make choices on travel distance, travel time, number of transfers, and monetary cost. The existence of different trip objectives makes bus trip optimization a quite complicated issue.
4

Bus trip optimization at directional level in GIS
Thus, the research problem goes to how to improve and use the directional data model to search for the optimal transit routes, in order to provide more precise trip guidance for the public bus travellers. The context of this research is the city of Wuhan in China.
1.3 Research objectives
In this research, the main objective is to improve the accuracy of representing the complicated path and stops in bus routes system, and to provide efficient transit information service and sound optimal route guidance. The context of this research is the city of Wuhan, in China.
The more specific objectives are: To present and analyze the transit features at directional spatial level of transit data model
To improve the shortest route algorithm for the multiple optimal path searching
To find and generate multiple optimal bus route between one identified O-D pair at directional level
To provide trip guidance with detailed transfer information for bus travellers
1.4 Research questions
The research questions as related to the four sub objectives are: Sub objective (1): To present and analyze the transit features at directional spatial level of transit data model
What the characteristics of the multi-tier data model, especially the directional level?
Why to choose the directional spatial data model to present the bus routes network in Wuhan, China?
What is the specific characteristic of the bus routes and stops in the transit network at the directional level?
How does the directional data model better to represent the real transit situation?
Sub objective (2): To improve the shortest route algorithm for the multiple optimal path searching
What is the proper method to consider these impedances when evaluate the alternatives of optimal bus trip?
How to improve the algorithm in order to generate multiple optimal routes?
How to adjust this improved algorithm to the directional data network?
Sub objective (3): To find and generate multiple optimal bus routes between one identified O-D pair at directional level
How to integrate the improved algorithm into the developed prototype?
What is the characteristic of the GIS prototype used for the bus trip guidance?
What is the process to generate the multiple optimal bus routes used the improved algorithm?
5

Bus trip optimization at directional level in GIS
What geographical information is obtained from the alternative routes presented?
Sub objective (4): To provide trip guidance with detailed transfer information for bus travelers
What kinds of information are necessary for effective trip guidance?
How to interpret the alternative routes with geographical data into guidance language for better understanding?
What is the inherent difference when comparing these alternative routes, for the purpose of optimal routes chosen?
How to present these optimal routes in the appropriate way for the passengers?
1.5 Conceptual framework
Figure 1-5 Research conceptual framework
1.6 Research design
To conduct this research and particularly to answer the research questions, this research has three main stages. The following figure(Figure 1-6)gives an overview of the methodology followed in the present research. The stages of the proposed methodology are discussed and highlighted one by one.
6

Bus trip optimization at directional level in GIS
Stage One: Analyze of current situation and improve the existing data model
Due to the complexity of the transit system in Wuhan, China, there are many cases of overlapping routes and complex distribution of bus stops. A comprehensive transit data model is necessary to be improved to better represent the real travel situation and prepare for the more precise analysis of the optimal route choices. A multi-tier data model is developed in response to these requirements. And the directional level of this data model can represent the in-bound and out-bound bus routes, as well as the directional stops of each bus line. The walking routes are introduced at this detailed level to connect individual directional stop sites within a complex stop junction (Hou, Zhou et al. 2007). Stages Two: Identify the impedance of bus trip and generate the optimal bus route
During the bus trips, the travellers may prefer least number of transfers, or prefer shortest travel distance and time. This has led to two different strategies in searching optimal bus trips, one is transfer oriented, and the other is distance or time oriented. For bus transit, the time impedance includes on-board time and transfer time. In reality, the transfer time can be divided into walking time and waiting time. Based on the detailed directional level of data model, it is possible to precisely evaluating transfer impedance. The bus trip optimization based on time impedance has to be carried out with a looped procedure. With the general shortest path algorithm, each run can only produce one solution. But for the bus trips, usually there exists several possible optimal routes. To acquire these alternative routes, the developed algorithm has to be used to extend the function of the Network Analysis in ArcGIS. Further, the data model at detailed directional level has provided possibility for precisely analyzing and evaluating transfer impedance. Transfer between two bus routes can only happen at stops. With the introduction of the stops and route feature at the directional tier, two types of bus transfers can be identified, including the straight-walking transfer and cross-street transfer. Finally, with these network elements, optimal bus trips can be derived by applying general optimal path finding functions existing in most GIS packages, ArcGIS Network Analysis Extension for example. Stages Three: Find alternative routes and provide bus trip guidance
In practice, owing to the route overlapping phenomenon and transfer situations between the stops, an urban bus trip system can provide more than one solution between stops pairs. In order to find all the possible optimal trips for travellers, the process should be developed to find the alternative routes with the consideration of different impedance, which have been identified before. During the procedure, the attributes of the network and the impedance need to be changed automatically in order to compute out the acceptable results by applying some programming. Thus, the alternative transit trip can be searched. The analysis of the criteria of the alternatives needs to be made to evaluate them. The considering factors are composed of total travel time, total travel distance and total number of transfer. Finally, the alternative transit trip including the optimal bus route and psychologically acceptable considering factors can be provided for the bus traveller clearly.
7

Bus trip optimization at directional level in GIS
Figure 1-6 Research framework
8

Bus trip optimization at directional level in GIS
2 Literature Review and Theory Description
2.1 Transit network data model
Spatial data modelling is the foundation for any transportation applications. A good data model can greatly enhance the performance of applications and the maintenance and management of spatial data of transportation networks. A lot of studies on data modeling for transportation have emerged in the literature since 1994 after a workshop on generic data modeling for Linear Referencing Systems in Milwaukee (Vonderohe and et al 1995; Deuker 1995; Butler 1995 Vonderohe and Hepworth 1996; Vonderohe and Hepworth 1998; Dueher and Bulter 1998; Fletcher and et al 1998; Sutton and Wyman 2000; Peng and Huang 2000; Huang and Peng 2001). The main focus of prior researches has been on Linear Reference System (LRS) for highways and on the development of generic linear data models. GIS-T enterprise data model is a good example of the generic transportation data model (Dueker and Butler 1998). It is independent of map scale, specific entity attributes, mode of travel, and location measurements methods. Path finding is supported by the topologic structure in the model. Traditional shortest path algorithms can be implemented with this kind of data model, in which criteria (cost) for path finding are associated to traversal segment or nodes (Huang 2007). If this generic data model is implemented in transit, a bus route with a direction could be modelled as a traversal, and bus stops and transfer nodes be modelled as point events. However, the generic data model only can provide a framework. It has to be adapted for each application, especially for transit applications like online trip planning systems. Peng (Peng and Huang 2000) developed an entity-relational (ER) data model based on Dueker and Butler’s generic transportation data model to model the spatial relationships among entities and events in the transit network. Moreover, Peng (Peng and Huang 2000) also developed an object-oriented (OO) data model to handle the dynamic nature of the transit network and enable high efficiency path finding. In addition to the broad scope of the field of GIS-T, the wide range of applications within that field, and the diverse group of practitioners, one must consider that the process of data modelling can also be very broadly defined (Konstantinos Evangelidis 2001). That is, a data model can mean many different things to different people. In the most general sense a model can be any structured set of ideas or objects. It can be a set of rules, relations, or equations. It can be a representation or a synthesis of data (PEUQUET 1984). In practice, several sets of GIS-T data models have evolved over time. For the purposes of the very brief review provided here, these models are loosely divided into three groups: Network Models, Process Models, and Object Models. Within each of these groups each individual model has a specified scope and purpose, which it is not our intent to review in detail here. Because of these differences, these GIS-T data models should not be seen as competing with one other but rather as complementary element that have worked together to make GIS-T the dynamic field that it is today (Miller and Shaw).
9

Bus trip optimization at directional level in GIS
Each of these models represents a structure that has been accepted by a group of users, and each must be respected for its utility. This section will briefly discuss some of the more prominent GIS-T data models as a guide to whom we can refer when describing transportation objects or activities. The development process of the ArcGIS Transportation Data Model has benefited from each of these models and seeks to provide a structure that can integrate with any of them (Demirel 2004).
2.1.1 Network models
Since the transportation network is a central element to so many GIS-T applications, the underlying network representation is of primary importance. Networks are generally represented as a set of points and a set of lines that represents connections between those points. Although the points may be referred to as nodes or vertices, and the lines may be called arcs or links, the idea of connectivity is independent of the terminology used. The connectivity of a network is often referred to as its topology (Bell, Iida et al. 1997). Networks that are constructed from these sets of lines and points have certain provable topological properties, and there is a branch of mathematics called Graph Theory that explores those properties (LU Huapu and Ye 2007). When these topological properties are known, it is possible to specify a network model that is most appropriate for a specific group of applications. By far the most prolific network structure for GIS-T applications has been the model accepted by the U.S. Bureau of the Census for its Topologically Integrated Geographic Encoding and Referencing (TIGER) files. The TIGER model had developed from some earlier network data models, and it was marked by its adherence to the principle of planar enforcement. Planar enforcement simply means that all lines in the network are forced into a single plane, and all intersections of lines are defined in that plane. Therefore, everywhere two lines in the network cross there exists a node in the TIGER network model (Choi and Jang 2000). This model proved to be extremely valuable to the Bureau of the Census because the planar enforcement enabled the creation of polygonal boundaries from the lines that made up the network. Since the Bureau of the Census is charged with placing the residence of every United States citizen into a polygon for the purpose of apportioning seats in the House of Representatives, this property was essential (Choi and Jang 2000). The TIGER file turns to be extremely important for several of reasons used by people. First, national coverage of transportation network and network features are contained in the TIGER files. Secondly, because of the public domain, the TIGER files can be on-time and inexpensively update and employed for detailed analysis. The Bureau of the census in combination collects the demographic information together with the spatial reference files can offer opportunities for further geographic research. The TIGER files still dominate the data source area for other advantage. Moreover, today’s much value-added data is based on these TIGER files. However, those who were charged with developing transportation-related applications found that the planar-enforced TIGER model presented several difficulties. First, many transportation applications are not concerned with the polygons that may have transportation features as their boundaries. It is the
10

Bus trip optimization at directional level in GIS
transportation features themselves that are of interest. Secondly, the planar enforcement that was needed to generate polygons also had the effect of splitting transportation features into many small segments whenever two features crossed in the plane. This occurred whether the intersection was between two transportation features or between a transportation feature and some other type of feature such as a municipal or county boundary line. Therefore, there were many "intersections" in the network data structure that did not correspond to any actual intersection in the transportation network at all. Furthermore, this unneeded proliferation of network segments unnecessarily complicated data entry and maintenance functions (Duff-Riddell and Bester 2005). Perhaps even more important, there were intersections in the transportation network that were not accurately represented by the intersections in the network model. A common example is that of the bridge/tunnel intersection—also known as a "brunnel" (Marin 2007). A brunnel can be a type of intersection between transportation features, but it is not one where any turns can take place. Therefore, any routing algorithms or other processes had to be informed about these types of intersections through the addition of turn restrictions or other impedances. These problems for the use of network models within GIS for transportation applications were not insignificant, and although many different workarounds were proposed for these problems they often took substantial time and effort to implement (Peng and Fan 2007). For this reason many transportation professionals sought solutions for their application needs outside the boundaries of GIS. Others persevered, however, given the spatial analytic and cartographic advantages that GIS could offer. In the recent past several innovative developments have occurred in the area of network modelling—most notably, the development of nonplanar network models for transportation that relax the requirements imposed by planar enforcement (Uchida, Sumalee et al. 2007). These allow for a more useful and accurate representation of transportation features and their interconnections. There has also been innovative functionality for the editing and maintenance of such networks. Many of these advances have occurred within GIS. Research continues to provide advances in the flexibility and utility of network models for transportation applications.
2.1.2 Process models
Data modelling for transportation is most certainly not limited to the structure of the transportation networks (Duff-Riddell and Bester 2005). There is a group of models that is concerned with how transportation activities are conducted. Instead of focusing on any single element of a transportation procedure, these models seek to organize many elements into a model that defines a process by which some transportation planning or maintenance activity can take place. Perhaps the most widely known transportation process model is the Urban Transportation Planning System (UTPS)—also known as the 4-Step travel demand model. Although there are many variations of this model, the four essential elements in this system are 1) Trip Generation 2) Trip Distribution 3) Modal Split 4) Traffic Assignment
11

Bus trip optimization at directional level in GIS
Thus, travellers are considered based on their origins and destinations, the modes of transportation (bus, car, bicycle, train) they use are investigated, and the network over which they travel acts as the supply of transportation resources available for the entire system. By building UTPS models forecasts can be made about the demand for transportation resources under different conditions (Chen, Li et al. 2007). If construction is scheduled for some part of the network, or if new network segments are to be added, a UTPS model can help determine the changes in transportation demand that will result from such changes. These forecasts allow transportation professionals to plan for future transportation needs in their geographic areas. Several software packages have successfully implemented UTPS transportation systems and much effort and resources have been expended on applying these systems to major transportation networks. Today, some transportation professionals are looking beyond the UTPS systems to GIS for additional capabilities. Another set of prominent process models has been concerned with the process of implementing multimodal transportation location referencing systems (LRS) (Duff-Riddell and Bester 2005). The National Cooperative Highway Research Program (NCHRP) has supported such an effort (commonly referred to as the 20–27 models based on the NCHRP Project number), and several of the resulting iterations of LRS models have gained substantial support among transportation professionals. Generally speaking, these models have defined a linear datum that can serve as a base for many different network representations (both logical and cartographic). This datum is composed of anchor points and anchor sections that connect the points. Once the datum is constructed, transformations can be made between logical network models or cartographic representations of those models. Most important, this datum allows the capture of location references based on well- defined locations in the field. Any transportation element of interest can then be located based on its reference to this datum (Hensher and Button). This location referencing process is of great utility to many transportation professionals who must maintain the transportation network and its associated assets. Location references can be used to direct maintenance crews to the location of a traffic sign that needs to be replaced. A location reference can be used to guide construction crews to a location along a network segment that needs to be repaved. Location references can be used to create inventories of assets or the conditions of those assets. By implementing a process of location referencing, and capturing these references for the management of transportation networks, information can more easily be shared among different agencies. Many other transportation process models exist, and it could be said that virtually every transportation management agency implements its own variation of a process model considering its particular scope and requirements. For the purposes of this review it is important to note that process models are common and that transportation elements must be able to be associated in order to satisfy the needs of application developers who must implement such process models. Since the urban transport planning is the early stage in the transit assignment model. It provides the trip guidance for passengers. And then, based on this information, the distribution of passengers’ volume in the traffic network can be analysed and further to do the transit assignment.
12

Bus trip optimization at directional level in GIS
2.1.3 Object models
The last general group of transportation models considered here is termed object models. Object models are those that seek to identify or enumerate as many transportation objects as possible and logically organize them in such a way that they can be most profitably used (Miller and Shaw). A notable effort to accomplish these goals is referred to as the Geographic Data Files (GDF) (Dueker and Butler 1998). GDF has been developed in Europe and describes road and road-related data. It specifies rules for data capture and the attribution of objects. GDF specifies topological relationships and has several levels of description for different representations of objects. Related to this type of object model is the idea of an enterprise GIS-T data model. Enterprise models recognize that many elements must be combined to provide an effective transportation system. Thus, enterprise models integrate network models and process models with cartographic entities. The relationships among them can then be defined. Finally, there are several standards that have been developed or are currently under development that promise to increasingly improve the ability to integrate and share data sets. Since the work presented in this document is an essential data model rather than an effort to define another standard, we will not review those standards at this time. However, we hope to provide a data model that will act as a practical transition between the user's application of transportation data and the standards that have been implemented in the creation of that data. We hope to support the standards that play an integral role in defining the transportation GIS community.
2.2 Transit trip optimization approach
According to the passengers’ travel psychological consideration, the public traffic model of optimal route is proposed, which primary goal is minimal transfer times and the second goal is shortest travel time. In the aspect of public traffic network description, Anez (1996) uses the allelomorph chart to describe the traffic network which can cover public traffic routes; Choi (2000) discusses the method that how to use the GIS techniques to produce public traffic routes and stop from the geography datum. Huang at al (2007) researches the relationship between public traffic entity and basic road network in GIS, which provides the foundation of the mathematic description of public traffic network. In the aspect of optimal route algorithm, some researchers bring forward the algorithm from different point of view, because the index of ’optimum’ differs in thousands ways. Considering the characteristics of public traffic network, Zhang (1992) proposes a kind of several shortest route algorithm on the basis of popularization of Floyd algorithm; Koncz (2002) proposes the static public traffic network several routes selection algorithm with the least transfer times as the primary goal and the shortest travel distance as the second goal; Yang (2000) designs the route selection model with the least transfer times and the shortest travel distance as goal. The passengers’ travel psychoanalysis investigative statistic of correlative literatures shows that people will consider transfer times, travel time and travel distance orderly when they take buses. Computer-based trip planning frequently employs optimal path (or shortest path) algorithms. The classic shortest path problem consists of finding, in an oriented graph, a feasible path that links a given
13

Bus trip optimization at directional level in GIS
origin node to a given destination node and minimizes the sum of its arc costs. The standard algorithm that were established by Dijkstra (Dijkstra 1959),selected as case studies. In the evaluation phase, a network that comprised subway and bus lines in Guangzhou was selected. The uniqueness of the system lies in the combination of database management and trip planning into a seamlessly integrated package. Although the trip planning application can currently only be run on a personal computer, it will become a D4-level system – according to the scoring scheme of Peng and Huang (Peng and Huang 2000) – if it is developed and deployed on the web.
2.3 Network analyst in ArcGIS
The ArcGIS Network Analyst extension allows you to build a network dataset and perform analysis on a network dataset.
2.3.1 Function of network analyst extension
The Network Analyst is a combination of various functions for adding and modifying network locations, generating directions, identifying network features, building networks, and performing analysis on network datasets. The Network Analyst drop-down menu provides you with commands for creating new analysis layers for route, service area, closest facility, or origin-destination cost matrices.
1. Open or close the Network Analyst Window with the Network Analyst Window button, and show directions with the Directions button.
2. Create new network locations for use in network analysis with the Create Network Location tool.
3. Select or move network locations using the Select/Move Network Location tool. 4. Compute the analysis using the Solve command. 5. Get the travel guidance in the Direction window, which displays in ArcMap after the
generation of a route in route analysis. The direction window gives the following information for travellers. The Directions Window displays turn-by-turn directions and maps with the impedance. If the impedance was set to time, the Directions Window displays the time taken for each
segment of the route. Additionally the Directions Window can display the length of each segment.
2.3.2 Best route in Network Analyst
2.3.2.1 What's the best route
Whether finding a simple route between two locations or one that visits several locations, people usually try to take the best route. But best route can mean different things in different situations. The best route can be the quickest, shortest, or most scenic route, depending on the impedance chosen. Any cost attribute can be chosen as the impedance, which is particularly minimized while determining the route (Fan and Machemehl 2004). If the impedance is time, then the best route is the quickest route. Hence, the best route can be defined as the route that has the lowest impedance, where the impedance is chosen by the user. Any valid network cost attribute can be used as the impedance when determining the best route (Bielli, Boulmakoul et al. 2006).
14

Bus trip optimization at directional level in GIS
2.3.2.2 Finding the best route
ArcGIS Network Analyst can find the best way to get from one location to another or the best way to visit several locations. The locations can be specified interactively by placing points on the screen, by entering an address, or by using points in an existing feature class or feature layer. In this way, the user can determine the best route the order of locations specified before. Alternatively, ArcGIS Network Analyst can determine the best sequence to visit the locations as well.
2.3.3 Network datasets in Network Analyst
2.3.3.1 What is a network dataset
The network datasets are the data source which used to do the Network Analyst in ArcGIS. It created from various feature or types of data source which participate in this network. Besides, this network datasets incorporates an advanced connectivity model that used to show complex scenarios, for example, the multimodal transportation networks (Bielli, Caramia et al. 2002). The attributes of network datasets indentify impedances, restrictions, and hierarchy of the network. The components of network datasets are usually lines, points and turns.
2.3.3.2 Network elements
There are three kinds of network elements: edges, junctions, and turns. Edges are elements that connect to other elements (junctions). Junctions connect edges and facilitate navigation from one edge to another. Turn elements record information about movement between two or more edges (A. Barra, L. Carvalho et al. 2007).
2.3.4 Connectivity of the network datasets
When I create my network dataset, I have to determine which kinds of elements are created from features, such us the edge and junction. In order to get the accurate network analysis results, it is important to ensure the edges and junctions are formed correctly. Connectivity in a network dataset is based on geometric coincidences of line endpoints, line vertices, and points and applying connectivity rules that you set as properties of the network dataset (Horn 2002). Edges in the same connectivity group can be made to connect in two ways, set by the connectivity policy on the edge source.(Figure 2-1)
If you set ‘endpoint’ connectivity, then line features become edges joining only at coincident endpoints.
j4
j1
j2
j3
e1
e2
L1
L2
Figure 2-1 Connectivity rules one
In this case, line feature L1 becomes edge element e1 and line feature L2 becomes edge element e2. There will always be one edge element created for one line feature with the connectivity policy.
15

Bus trip optimization at directional level in GIS
Building networks with endpoint connectivity is one way to model crossing objects, such as bridges. To model this case, the two sources, bridges and streets, are placed in the same connectivity group (Figure 2-2). The Streets source is assigned any vertex connectivity to allow street features to connect to other street features at coincident vertices. The Bridges source is assigned endpoint connectivity. This means bridges connect to other edge features only at their endpoints. Consequently, any street going under the bridges will not be connected to the bridge. The bridge will connect to other streets at its endpoints.
Figure 2-2 Connecting edges within a connectivity group
Bridge
Connect
Not Connected
If you set ‘any vertex’ connectivity, line features are split into multiple edges at coincident vertices. Setting this policy is important if your street data is structured such that streets meet other streets at vertices.(Figure 2-3)
L1
L2
j1e1
j2
j4j3
e2
e3 e4
j3
Figure 2-3 Connectivity rules two
In this case, two plotlines’ crossing at a shared vertex position will be split into four edges, with a junction at the vertex. Edges e1 and e2 are identified with the source feature class and object ID of line feature L1. Edges e2 and e4 are identified with the source feature class and object ID of line feature L2. Junction j3 will be a newly created system junction. Junctions j1, j2, j4, and j5 will either be system junctions or junctions from coincident points from a source feature class.
2.3.5 Network attribute
Network attributes are properties of the network elements that control traversability over the network (Lee and Vuchic 2005). Examples of attributes include the time to travel a given length of road, which streets are restricted for which vehicles, the speeds along a given road, and which streets are ruled only one-way. Network attributes have five basic properties: name, usage type, units, data type, and use by default.
The usage type specifies how the attribute will be used during analysis, which is identified as a cost, descriptor, restriction, or hierarchy.
16

Bus trip optimization at directional level in GIS
Units of a cost attribute are either distance or time units (for example, centimetres, meters, miles, minutes, and seconds). Descriptors, hierarchies, and restrictions have unknown units.
Data types can be either Boolean, integer, float, or double. Cost attributes cannot be a Boolean data type. Restrictions are always Boolean, whereas a hierarchy is always an integer.
Use by default setting will automatically set those attributes on a newly created network analysis layer.
The detail definitions of those attributes are as follows,
1. Cost Certain attributes are used to measure and model impedances, such as travel time (transit time on a street) or demand (the volume of garbage picked up on a street). These attributes are distributed along an edge; that is, they are divided proportionately along the length of an edge.
2. Descriptors Descriptors are attributes that describe characteristics of the network or its elements. Unlike costs, descriptors are not apportioned. This means that the value does not depend on the length of the edge element.
3. Restrictions Restrictions can be identified for particular elements, such that during an analysis, restricted elements cannot be traversed. For example, one-way streets can be modelled with a restriction attribute, so they can only be traversed from one end to another and not in the reverse direction
4. Hierarchy Hierarchy is the order or grade assigned to network elements. A street network might have a road class hierarchy for separating interstates from local roads. In finding a shortest path from one point to another, the user preference to take or avoid interstates can be modelled through a hierarchy. In ArcGIS Network Analyst extension, different classes of hierarchy can be grouped into three ranges: primary roads, secondary roads, and local roads.
2.3.6 Turns in the network dataset
Turns can be made at any junction where edges connect. There are n² possible turns at every network junction, where n is the number of edges connected at that junction (Teodorovi, cacute et al. 2005). Even at a junction with a single edge, it is possible to make one U-turn (Figure 2-4).
U-turn
Right Left
Straight transition
Figure 2-4 Turns in the network dataset
17

Bus trip optimization at directional level in GIS
2.3.6.1 Multi-edge turns
A simple turning movement between two edges connected at a junction is referred to as a two-edge turn. ArcGIS Network Analyst supports modelling multi-edge turns. A multi-edge turn is a movement from one network edge element to another through a sequence of connected intersediate edge elements. These intermediate edges are referred to as the interior edges of a turn (Wong and Tong 1998). In a street network, the interior edges of a turn are typically those edge elements that represent the interior of an intersection of divided roads.
Figure 2-5 Multi-edge turn in divided roads
2.3.6.2 U-turns
A U-turn is a movement from an edge element through one of its ends back onto itself. It is typically modelled as a turn with two entries in the edge sequence, where both entries are the same edge element.
Figure 2-6 U-turn in same edge
When dealing with divided roads, a U-turn is modelled as a multi-edge turn, where edges f and e are exterior edges and c, d, and a are interior edges.
Figure 2-7 U-turn in divided roads
Using ArcGIS Network analyst extension, it is possible to find the optimum/minimal path through the network based on the impedances that have been defined. Having the walk, drive, and transit paths all
18

Bus trip optimization at directional level in GIS
connected allowed the software to consider optimum paths for an entire trip using different modes (Zhao and Zeng 2007). For instance, the walk to a transit stop, then to a bus stop and through the transit network and then the walk to the destination could be determined. The nearest bus stop might not be the best transit option, for instance, walking a little further to another stop might allow a transit route that would be direct to the destination and be more desirable.
19

Bus trip optimization at directional level in GIS
3 Transportation Characteristic in Wuhan City
This chapter introduces the case study area. The development of the modern transport in Wuhan and the problems now existing will be discussed.
3.1 A profile of study area
The study area of this research is urban built up area of Wuhan city. Wuhan is the capital city of Hubei province (Figure 3-1), located in the central part of China. As one of the most important economic and business hubs in central China, Wuhan is one of the few transportation hubs in China with a reasonably efficient transportation system. Not only is the city backed by the Yangtze River, but an established railway system, the huge Yangtze River Bridge and an international airport all allow for convenient transport to the rest of China and elsewhere. With development of the city, various modes of transportation have made the city a busy place for passengers and goods transfer, which contribute much to the local traffic development, as well as to the problems.
Figure 3-1 Wuhan city
3.2 Characteristics of urban transport in Wuhan
In Wuhan, the bus, ferry, light rail, taxi, private car and bicycle are common means of transportation. According to the statistics bulletin 2007, the vehicles possessing capacity in Wuhan is 480,000, the
20

Bus trip optimization at directional level in GIS
number of cars is 388,000. Regarding the total population, it is easy to deduce that most of citizens travel outdoor by public transport or on foot. Some available government information from the official website of Wuhan municipal construction committee verifies this too. It demonstrates that 62.5 percent of total residential traffics are non-motorized transportation and 40.5 percent of the total traffics are walking. (Figure 3-2)
Figure 3-2 Wuhan bus system structure
3.2.1 Transport development
3.2.1.1 Overview of the development in motor industry
In Wuhan, the physical structure as presented in Figure 3c indicates that the two rivers form a bottleneck for urban traffic. During the last decades, enormous efforts have been made on the restructuring and widening existing streets. With the development of industrialization and urbanization in Wuhan, the motorized travel mode changes along with the transport needs of residents, especially since the 1990s and began to enter a period of rapid growth (Figure 3-3).
Figure 3-3 Mass transit amount of passenger transport 1990 - 2007(*10000 person) (Institute of Urban transport management in China Academy of Management Science 2008)
3.2.1.2 Development of public transport
The urban public transport mainly comprises bus, rail transit, mini-bus, taxi, ferry. Public transport has been identified as the critical means to meet the travel demand of urban passengers in China. The volume of this situation shows in Figure 3-4.
21

Bus trip optimization at directional level in GIS
Index Bus Rail transit Mini-bus Taxi Ferry Total
Volume in year(* 10000) 139000 925 13708 40500 1035 195168
Proportion in total(%) 71.2 0.47 7.0 20.8 0.53 100
Increase over the previous year(%)
12.7 23.3 5.9 0 10.5 9.3
Figure 3-4 Wuhan Bus Transit Passenger Indicators in 2007
(Institute of Urban transport management in China Academy of Management Science 2008) The increasing in volume of bus travelling indicates the improvement of the level in scientific operating and management. This will not only make social and economic benefits for public bus, but also promote the self-construction of public transport development.
3.3 Importance of public transport
In Wuhan, the physical structure as presented in the previous section indicates that the two rivers form the bottleneck for urban traffic. During the last two decades, various aspects of efforts have been made on reconstructing and widening existing streets, such as the important part in the city construction. However, the road density has been changed little, from 6.46 km/km2 in 1997 to 6.62 km/km2 in 2007 (Wuhan Statistical Bureau, 2008). The empirical information from the developed countries has shown that the construction of urban road always can not keep up with the growth rate of traffic volume. It is not realistic to simply rely on the expansion of urban road to resolve the congestion problem. The key to solve the problem should make full use of limited road resources, and actively exploit the potential ability of public bus, which is means of delivery with a large capacity, high efficiency. The development of public buses with large-capacity is the key aspect and the first condition to optimize the modes of urban transit, to rebuild the bus route structure, and to improve the quality of urban transport system as well as to reduce traffic congestion. Comparing with cars, bicycles and other means of individual transport, public bus occupies the smallest off-road to transport the equivalent number of passengers. Thus, this pressure on the Wuhan transport system have been caused by rapidly increasing travel demands as well as by a failure to respond to these demands. Under the condition of market economy, the urban public transport in Wuhan has form the integrated transport system, with public bus as main role, taxis and mini bus as the assistance and the supplement of ferry. The continued improvement in the level and comfort of public transport service meets the transit needs of different passengers. The convenient public bus is still the main mode of public transit in Wuhan nowadays, which takes up 72% of travel volume (Wuhan Statistical Bureau, 2008).
3.4 Transport challenges
With economic development, conventional buses can no longer cope with the rapid increase in transport demands. Until 2007, the public bus system in Wuhan includes 274 bus lines; the increase rate compared with last year is 21%, and 2446 bus stops. The total length of the bus route network is 1040 km, the increase rate is 23%. The number of buses is 6600, with the increase of 10%. The number of people make normal bus travel is 1,390,000,000 per year, with the increase of 13%.
22

Bus trip optimization at directional level in GIS
However, the pressure of ever growth demands on an inadequate street network challenges the urban transportation systems. Consequently, the problems existing such as congestion, accidents, environmental degradation and urban sprawl needs the administration, as well as the technical sections, to improve the efficiency and adequacy in trip guidance (Jau-Ming, Chih-Hung et al. 2008). Bus routes and stops are indispensable elements in the city tourism map for giving clear trip guidance to the tourists. Nowadays, both in the printed and digital format of maps, a great emphasis have been put on the improvement of the accuracy of location of these elements. Especially, in the bus-oriented cities, due to the complicated distribution of road network and land-use structure, representation of bus routes and stops is always a difficult issue. The obstacles are manifested in the following aspects: Firstly, bus routes usually overlap in attractive areas or called hot spot and then spread out in other areas in reality. For example, in Wuhan, a metropolitan city with over 7 million people in middle China, the statistics show there are even 10 bus lines overlapped in some road segment. In this case, for the purpose of getting friendlier trip guidance, it is impossible to display all the repeated lines in the map. Normally treatment method is to draw a simplified symbol line to indicate bus route. Secondly, in Wuhan for example, in some place with high volume of traffic flow, the bus stop in this area often has more then one stop site location, so as to distribute the buses. In this complex situation, because of too many bus passing through one site will cause traffic chaos, the bus site has to be separated into 2 stops which usually only 50 meters far away. Thus, the representation of the exact location of the bus routes and stops has no doubt to take the current situation into consideration. Facing the increasingly complex network of public transport, the optimization of public bus transit route becomes the common task to the planners and travellers. Urban public transportation network is the dynamic network with overlapping bus lines. In this circumstance, the transfer stops in the important node of transit network often have complex spatial distribution. As a result of this specificity, it brings out problems when applying the common shortest path algorithms in generating the optimal transit routes. In the perspective of bus travellers, on the basis of their different social, economic, professional backgrounds, it makes much more difficult to find the appropriate algorithm of optimal bus transit route when considering different travel preferences, such as travel time, cost and transfer numbers.
23

Bus trip optimization at directional level in GIS
4 Bus Network Construction at the Directional Level
4.1 Introduction of the multi-tier bus data model
From the geospatial perspective, a bus line comprises in-bound and out-bound routes, each route have a stop site at a bus stop. Therefore a bus stop is usually consists of two stop sites along the streets. A simplified geometric representation is applied to identify stops and routes. In this way, the exact geographical location of the stop and bus line are neglected. However, in the real world complex bus system, the situation is much more sophisticated. To consider the different directions of each bus line and the usual opposite direction of the stop along one side of the street are important for transport analysis, especially for giving the trip guidance for the travellers. Besides, when too much bus lines converge at one stop junction, the stop sites are usually placed along the street with considerable walking distance. The multi-tier transit data model is proposed with two major objectives. Firstly, to represent complicated transit structure, especially the bus transit system in Chinese cities. Secondly, to develop a general framework for bus transit related applications, ranging from transit planning to user trip guidance (Huang and Wang 2007). The model is composed of entities that include objects (non-spatial), features (spatial) and network, and sets up these entities at three levels: the semantic level, the virtual level and the directional level. Routes and stops are the fundamental entities in all three levels, and a spatial transit network may be constructed at either the virtual level or the directional level (Figure 4-1).
a) The Semantic Tier: routes and stops are non-spatial objects with attributes. In most cases, in addition to line objects, directional route objects are included. This level is suitable for situations where no geographical representation is required, such as information dissemination and route query on the web.
b) The Virtual Tier: spatial features are defined in an aggregated manner with attributes. A bus line is represented with a line feature (Virtual Route), without considering the route direction; A bus stop is represented with a virtual point feature (Virtual Stop), neglecting the detailed bus site locations. This level is best applied in transit planning, including transit assignment and route-stop design, as well as ITS applications.
c) The Directional Tier: routes and stops are represented at the true geographical locations (Directional Route and Directional Stop). Attributes are attached to these features. Directional routes are spatially delineated along the real running paths (usually the edges of streets). This level is suitable for ITS applications such as bus trip guidance and facility management, and for cities where inbound and outbound routes do not follow the same street.
24

Bus trip optimization at directional level in GIS
Figure 4-1 The three-tier framework for the urban transit system (Huang and Wang 2007)
The directional level is the lowest tier and detailed structure in multi-tier. With availability of the directional stops, it is possible to model walking links among the stops. This walking links may be essential in real complicated situation, yet failed to take into consideration in the usual bus trip optimization methods. The impedance for these walking links can be identified by the lengths, walking speed, and bus speed. Besides, the transfer impedance can be computed more precisely in this directional level of data model, with considering the walking route and walking time. A big difference between the bus network and a normal street network is that the bus network contains large amounts of overlapping route segments. In bus oriented cities, such as Wuhan, there are even 20 bus lines between two stops in the same road segment. Such high rate of overlapping makes the construction and representation of bus routes network to be a tough and time-consuming project. At the directional level of network presentation, the more precise route identification can be applied in the route optimization process.
4.2 Network in directional level of bus system in Wuhan
According to the principle of the directional level of data model, the network in this detailed level of bus system in Wuhan city is constructed as Figure 4-2. The directional level of bus network is the DirNetwork that is made up of directional routes and stops, as well as walking routes. The walking routes are introduced at this detailed level to connect individual directional atop sites within a complex stop junction. In DirNetwork, the bus routes are directional, and the walking routes are bi-directional.
25

Bus trip optimization at directional level in GIS
Figure 4-2 Network of city entire bus system
4.2.1 Elements of the transit network
The concrete definitions of elements in this transit network and the rules which are set in the network construction are as follows:
4.2.1.1 Fundamental elements
a) Transit directional stop (DirBusStop): It is sited on the location of the bus board.
Space definition rules:
Attached to the sideline of the road;
Located through the on-site survey.
Figure 4-3 Identification of the directional stop in the network
b) Transit directional route (DirBusRoute): They are the go or back route of the bus, which are labeled as ‘Line name + go/back signal’, such as 5190 and 5191.
Space definition rules:
to line (0): → Wuchang, Hankou and Hanyang → Hankou, Wuchang, Hanyang → East → West, North → South / clockwise
26

Bus trip optimization at directional level in GIS
to the back line (1): → Wuchang, Hankou and Hanyang → Hankou, Wuchang, Hanyang → West → East, South → North, outside / counter-clockwise
Figure 4-4 Identification of the directional bus lines in the network
c) Walking route (Walkroute) Spatial definition rules:
Walking routes finish at the directional stops at both ends; The location of the walking route is determined by the actual situation; Walking routes are bi-directional.
Figure 4-5 Identification of the walking routes in the network
4.2.1.2 Network datasets built for performing network analysis
DirNetwork_ND: The DirBusRoute and Walkroute compose the edges of the network, whereas the DirBusStop build up the nodes of the network. The DirNetwork has the following characteristics:
A DirBusRoute is an one-directional edge, whose to-from direction is infinite A WalkRoute is a two-directional edge, with equal from-to and to-from impedance A Walkroute has much higher impedance rate than the DirBusRoute A WalkRoute may or may not cross a street, with a crossing walk generating high impedance
than a non-crossing walk The DirNetwork is constructed by taking relevant elements from the Wuhan fundamental database. Several rules are applied to the network in ArcGIS, including defining the cost, restriction, descriptor and hierarchy for evaluating each type of edges (DirBusRoute and WalkRoute). The definition of the
27

Bus trip optimization at directional level in GIS
DirBusRoute and WalkRoute edges are listed in Figure 4-6. The descriptor and hierarchy are not necessary for such network.
Edge Direction Cost Restriction Descriptor Hierarchy
From-To Impedance Traversable True 0 DirBusRoute
To-From 0 Restricted False 0
Walkroute Both Impedance Traversable True 0
Figure 4-6 The definition of edge element in ArcGIS Based on the DirNetwork defined with the above rules, a simple optimal route searching can be applied within the system.
4.2.2 Analysis and application of the network
There are 526 stops stores in the DirBusStop database, and 95 lines in the DirBusRoute. The attribute of the DirBusStop records the DirStopID and the name of each directional stop. The attribute of the DirBusRoute stores the DirBusRouteID, startstopID, endstopID, length, total number of stops in this bus line, and the travel time (minute) with the assumption of average speed. If the travellers want to find out all the bus lines that go through the particular directional bus stop for the normal trip information, we can integrate the information of these data by means of the relationship of the data. For example, the directional bus stop is named “中南路前站 (ZhongNan Lu Qian Zhan)” with the ID---B0174 (Figure 4-7). We select by attribute in the DirBusRoute_SpatialJoin layer and find the different bus lines go through this stop (Figure 4-8). The bus numbers are 411, 522, 577, 578, and 537. The DirBusRoute_SpatialJoin layer stores all the directional routes which pass the directional stop. The attribute of this data indicates the relationship between the bus lines and the bus stops. It gives the information such as the start and end stop ID of one particular bus line, as well as the entire directional stops along this particular bus line.
Figure 4-7 Identification of the selected bus stop
28

Bus trip optimization at directional level in GIS
Figure 4-8 The bus lines information passing the stop
29

Bus trip optimization at directional level in GIS
5 Optimization of Transit Trip at the Directional Level
5.1 Problems with current route searching tool in ArcGIS
Since ArcGIS Network Analyst extension can be used to find out the shortest route if we give the origin point and destination point, the simple example manifests the usage of the trip guidance, especially the shortcoming of this method. In the ArcGIS interface, the user enters two points as show in the Figure 5-1. One locates in Hankou of Wuhan city, the other is in Wuchang of Wuhan city. After solving the request, the Network Analyst function provides the optimal transit route based on the directional level of Wuhan bus system network.
Figure 5-1 Generate the optimal route for the given two points
Walking for thetransfer
Optimal transit routes
Figure 5-2 Simple optimal transit path use the ArcGIS Network Analyst function
30

Bus trip optimization at directional level in GIS
Figure 5-3 Detail information of the transfer
Route of Bus No.519
Route of Bus No.523
Transfer stop
Figure 5-4 Trip guidance window in ArcGIS
In the trip guidance window (Figure 5-4), we can obtain the travel assistant information. First walk to the directional bus stop in the north east. take the bus line Nr.2 or Nr.31 or Nr.523 or Nr.708 to the transfer stop 1, walk across the street (the DirWalkID is 192) (Figure 5-2), transfer to the bus Nr. 523 for the 3230.4 m drive, then reach to the transfer stop 2 (Figure 5-3). In the figure 5.3, it shows clearly that the bus Nr.523 turns left in the next corner from the transfer stop. So, the passenger should change to take the bus Nr. 519 for 5803.4 meters to arrive at the destination stop. The geographical statistics indicates the total distance of this optimal transit route is 10007.4 m. The sample above demonstrates how a bus route network is constructed at the directional level including directional bus routes and directional walk routes. The directional Walkroute feature is used for accurately searching in optimal route finding. Moreover, this information can be better realized at such detailed spatial level.
31

Bus trip optimization at directional level in GIS
Apparently, the sample indicates the shortcomings in the existing transit trip information system. By no means, the ArcGIS network analyst function can not fulfill the task to provide the clear and understandable transit trip guidance. The problems referenced to the previous sample can be divided as following:
According to the trip guidance window gives by the GIS package (Figure 5-4), the optimal route finding function could not give the exact advice which bus to take clearly for the normal passenger. In fact, only the network designer or geographer can read the window and then get the optimal travel trip advice from it. The number of bus line and the name of transfer stop are in the format of database. Furthermore, the information of walk route and the mode of the transfer (non-cross street or cross the street) needs deep analyzing. In order to provide detailed transfer guidance, the transit system has to be improved to make clear definition of the two types of edges, definition of the bus headway impedance at potential transfer points, as well as searching for the best transfer plan.
The result of this kind of network analyst also could not tell exactly how many transfers have to be made, neither from the trip guidance window nor from other information table. The number of transfer is important information in the travellers’ perspective, and can not to ignore by the trip guidance providers. Travellers use this type of information to judge whether this optimal route is suitable and adoptable. In some special cases, passengers prefer to take longer travel time but no transfer for the convenient consideration.
The functions ebbed in ArcGIS are limited in searching for multiple optimal routes in the directional level. It only gives one best route with least travel time without taking the least transfer aspect into consideration. Thus, travellers can not compare optimal routes with referenced to his (hers) own preference.
5.2 An improved algorithm
5.2.1 The objectives
In real travel situation, in general, passengers make choices to take least time or least transfers. Correspondingly, the algorithms for getting optimal transit route goes to two modes: one is for least number of transfers at the cost of travel time. The other is to obtain the shortest distance in space at the cost of transfer times (Modesti and Sciomachen 1998). The first mode seeks the least transfer times through the continually expanding, sorting and making intersections towards the data collection of the bus system. Finally, it aims to choose the path between one O-D pair with least transfers. The second mode goals to search the spatial shortest distance between O-D pair in the existing transit network, without considering the factor of transfer (Lam, Wu et al. 2003). As the high density of the spatial distribution of the bus system network, high rate of repeated lines, and the complex of transfer situation, it will merge strange or unacceptable advices if only resorting to one simple mode (Koncz, Greenfeld et al. 1996). For instance, one travel route with least transfer times sometimes has the impossibly acceptable travel distance. That is not the appropriate trip guidance system for passengers to use.
Moreover, because of the different purposes of passengers, the preference of them goes to be different. Some people prefer to be provided with several alternative routes with different considering focus. In this circumstance, it is important to find out multiple optimal transit routes. The best path with 0 time’s transfer and a bit long distance is suitable for some passengers with heavy luggage for example. The second best path with 1 or 2 times’ transfer but not the shortest route can be chosen by the travellers
32

Bus trip optimization at directional level in GIS
who want to take less travel time to reach destination. Based on this consideration, the existing function of Network Analyst in ArcGIS fails to generate these multiple optimal routes. So, the improved methodology is needed to achieve this target.
5.2.2 The general process
The process to generate multiple optimal routes for trip guidance can be understood as the following graph in general:
Figure 5-5 The process of trip guidance GIS prototype
In the process described above, the travel strategy connects two steps. Meanwhile, in the system, the travel strategy means to determine the travel impedance for the further computation. Generally, the impedances are travel time or travel length, and transfer times. In this GIS prototype, travel time is used to be the impedance for the entire network analysis. Besides, the system applies time to measure length in the same spatial context. After the consideration of impedance, using the improved algorithm to generate optimal route is the core of the system. The result of this step is to get the multiple optimal routes. The algorithm used to gain this achievement is to change the attribute of the network to spur the next searching round. Usually, the parameter of the network is the turn factor. The restriction of this parameter in the transfer stop makes another searched path. In such situation, the second optimal route with the same impedance but different travel information comes out.
The time-based optimization of bus trips can be implemented with the directional bus network, i.e., the DirNetwork. In the theoretical perspective, at the directional level, all the detailed network elements can be modelled and evaluated more precisely, including walking time from origin place to starting stop, from ending stop to destination, also the transfer time, on-vehicle time, waiting time at each stop etc… The network is composed of edges from bus route and walk route, as well as DirStops which connecting the route edges. The pedestrian route is simplified to walking route that connects DirStops in this study, but it can be fully incorporated into the network when the other kinds of data are available.
Based on the detailed directional level of data model, the transfer impedance can be precisely evaluated for better analysis. The bus trip optimization based on time impedance has to be carried out with a looped procedure. With the general shortest path algorithm, each run can only produce one solution. But for the bus trip guidance, usually there exists several possible optimal routes or called multiple optimal paths. To acquire these alternative routes, the developed algorithm has to be used to extend the function of the Network Analysis in ArcGIS. The background for the programming is .NET
33

Bus trip optimization at directional level in GIS
in the ArcGIS circumstance. On the basis of this algorithm, the user interface should be developed towards these specific bus transit applications. Also by this usage, the representations at the detailed directional spatial levels allow more accurate calculation of travel time during transit trip searching.
As the previous discussion, bus stops of the optimal route with network elements can be derived by applying general optimal path finding functions already existing in most GIS packages. In the DirNetwork, each DirRoute is regarded as a spatial feature in the DirRoute network, and each DirRoute produces spatially overlapped edges because of existing overlapping bus routes in the city public bus system. When getting an optimal path, it computes out the time cost of this path as well. However, a special procedure can acquire useful transfer information and trace the matched edges and turns in the optimal path back to the DirRoutes network. In practice, an city bus transit system usually have more than one optimal routes between any O-D pair due to the route overlapping phenomenon and to release the pressure of high volume of travellers. With the increasing sophisticated situation, it is significant demand to find all possible optimal trips, as well as to improve the route searching system. To fulfill this task, some of the network attributes should be manipulated during the computing process. Based on these criteria, one single optimal route can be generated for one identified pair of DirStops. Besides, to search for alternative routes for more personalized trip guidance in order to satisfy different travel demand, attributes of the network which used to computing out previous optimal route should be modified temporarily for facilitate next round. This task is carried out by making transfer restriction.
5.2.3 The algorithm
In this research, minimizing travel time of travel route is the bus trip optimizing objective. Accordingly, the network elements need to be weighted with time cost separately as following:
On-vehicle time along DirRoute: the quotient of route length divided by average bus speed. The assumption in this study is to set equal travel speed for all bus routes and all areas of the city, i.e. 20km/hour. However, the travel speed can be edited by investigation or incorporated information from other sources.
Waiting time at transfer stop: the waiting time is averaged by the headways of bus routes. In this study, this waiting time is seen as the transfer time spent by the travelers at the bus stop for the simplified reason. In this case, if there is no transfer situation happens, no additional time is added to the total travel time. Otherwise, addition of transfer time will be computed into the cumulative time ultimately. The principle about the value of this attribute is set in advance when build the network (Figure 5-6, Figure 5-7).
34

Bus trip optimization at directional level in GIS
Figure 5-6 The Network Dataset Properties
Figure 5-7 Script Evaluators of the turn attribute
The VB code is used to value the transfer time at the turn point. It supposes the transfer time is 5 min if the SourceID is the same, which means travelers take the same mode of transportation (walk or bus); meanwhile if the EdgeID is the different, which means travelers change to a different bus line in this stop. Besides, the transfer time is deemed as 0 min.
35

Bus trip optimization at directional level in GIS
This VB code calculates the walking time between DirStops. The walking route length is evaluated by the averaged walking speed. Non-crossing route and cross-street walking route are two normal different situations. The cross-street case will get lower speed than non-crossing walking. The alternative route finding process is a looped process (Figure 5-8).
Route compute model
Search for one best route using network analyst, record the directional information and time
information “FirstTime” of this route
In this best route, set “Turn” of Stop No.i (i=1.2…)to the maximum in order to restrict
turning in this stop
Set attributes of network, update attributes, re-generate route
Record new directional information and time information “TravelTime(i)”
Identify start stop A and end stop B
Record this route with travel informations
TravelTime i<=FirstTime+TimeDifferent
NO
YES
Generate complete trip report
Figure 5-8 The flowchart of the improved algorithm
The basic ides of this algorithm is that, after the optimal route in the previous round is identified, the attribute on this route is changed to facilitate computing in the next round. There are two preliminary cases in changing network attribute, one is that the previous route is one bus route without any transfer; the other is that there exist transfers. For the first case, the bus route is temporarily removed from the network. For the second case, the impedance is set to infinite sequentially for each transfer point. The criteria for stopping computing is set in advance, for example, when the time cost becomes higher, or the cost difference reaches a certain level. In this research, the stop criteria are the time difference between total travel time of the first best optimal route and the last best optimal route. When the time
36

Bus trip optimization at directional level in GIS
difference reaches the restriction which entered in the system interface beforehand, the algorithm will jump out of the cycle. Afterwards, generate these multiple routes and store these calculation results with relevant network elements in the database simultaneously. The last step of the algorithm is to form the routes information table and trip guidance window as for the system’s requirements.
5.3 A bus optimization prototype in ArcGIS
5.3.1 Overview of the prototype
This multi-optimal transit trip guidance system is typically a GIS prototype. A prototype has been developed using ArcGIS Engine and use .NET language as development environment. The independent system invokes relative network analysis functions in ArcEngine based on Visual Studio 2005. The interface of this GIS prototype is showed in Figure 5-9.
Figure 5-9 Overview of bus optimization prototype
5.3.1.1 Background of the prototype development
ArcGIS Engine is a collection of GIS components and developer resources that can be embedded, allowing you to add dynamic mapping and GIS capabilities to existing applications or build new custom mapping applications. ArcGIS Engine includes the core set of components from which ArcGIS Desktop products are built. ArcGIS Engine provides new and improved tools for developers as well as new deployment options and resources. ArcGIS Engine is a set of the core ArcObjects components packaged together for developers to build custom GIS and mapping applications. These objects are platform neutral and can be called from various APIs. Developers can extend the object libraries and have complete control over the look and feel of their applications' user interfaces (ESRI White Paper 2004). With ArcGIS Engine, it provides GIS tools, such as Pan, Zoom, Identify, Selection, and Editing, to interact with maps. Furthermore, it can incorporate some powerful capabilities in specific applications. ArcGIS Engine has the functions about solving and performing network analysis in order to find the
37

Bus trip optimization at directional level in GIS
best routes between original point and end point, also can determine which routes should be assigned. ArcGIS Engine has various kinds of objects libraries to fulfill different tasks. Network Analysis class library provides objects for loading network data in the geographic database and provides the object used to analyze the network which loaded in the geographic database. Developers can extend the class library in Network Analysis in order to customize the network tracking. ArcGIS Engine is suitable for building basic mapping to advanced GIS applications. ArcGIS Engine supports a variety of developer languages for its use including COM, .NET, Java, and C++. To sum up, ArcGIS Engine is that GIS framework, created in response to requests that ArcObjects and supporting developer resources be packaged for fast, comprehensive, and cost-effective delivery of GIS and mapping applications that reach beyond the traditional GIS user (ESRI White Paper 2004).
5.3.2 Functions of the prototype
Like the ArcGIS network analyst extension, the multi-optimal transit trip guidance system has the basic map managing functions, such as add data, room in or out, full extent view, identify features, etc... It can also create new route for the further network analyst by adding new layer with network attributes such as stops, barriers. And the route layer has particular properties (Figure 5-10)
Figure 5-10 Properties of the added layer
As we can see, the impedance for the optimal route which will come out after the network analyst is the travel time only. In terms of this, optimization of total travel time is the first concerning in transit trip optimization process.
The improved functions in this GIS prototype aim to provide multiple optimal routes for the travellers. The designed criterion to stop the computation is the time difference between the results of the first calculation round and the last round. By applying the improved algorithm, the route searching can cover all the paths between the identified O-D pair in the network, with the restriction of time difference.
38

Bus trip optimization at directional level in GIS
Moreover, the results contain exactly the detailed geographical trip information, such as Bus line Number, bus route distance, on-vehicle time, the name of starting bus stop, the name of transfer stop, and the distance of walk route to reach the transfer stop, and the walk time. These information stores in the temporary database integrated in the system and displays in the results table for clear comparison.
Finally, the trip guidance window pops up to provide all the optimal routes between the previous entered O-D pairs (the assumption is the start point and the end point are both bus stops, but not the place such as home and office as the original place, or markets and train stations as the destination. The information in this designed window gives the travelers is: from the start stop, take which bus number to get the transfer stop, the transfer stop name is what; if needs taking a walk to the transfer to the transfer stop, where is the walking route, and the distance is how many kilometers; then change to which bus number to get the next transfer stop (if the second transfer necessary), the stop name to get off the bus. Overall, the statistic information is how much time the travelers should spend in this optimal route, and how many transfers should make the route.
5.4 Experimental results in Wuhan
To reflect this process, typical examples are presented in the following to show the functions of the developed functions and the output by using this GIS prototype. The conventional bus system database of Wuhan City used to do the transit trip optimization contains three towns which composes the main urban area. It directly adopts manual recording method to get the data, and adapt to the basic road spatially. At the directional level, there exist directional stops, directional bus routes and directional walk route for detailed representation of real situation of bus system. It applies Personal Geodatabase in ESRI to construct the entire database. In addition, the database can be entered、edited、displayed as well as solving the network optimization.
5.4.1 Case One
Open the mxd file of Directional bus system network in the developed GIS prototype, the interface displays in the following figure (Figure 5-11).
Figure 5-11 Network analyst application in the GIS prototype
39

Bus trip optimization at directional level in GIS
This GIS prototype automatically calls the geodatabase that stores the geographical and attribute information of the network. In order to determine the O-D pair, in the drop-down list, it shows the Chinese name of each bus stop. These are two ways for users to identify the stop: one is directly select the stop referenced to its Chinese name in the list; the other is directly the stop in the map according to its location by zooming in the map. Afterwards, entering the stop criteria in time unit aims to set the principle to stop the loop calculation in generating multiple optimal routes in the next step. To reflect the functions and usages in this GIS prototype, three typical examples are presented following.
The start stop is “解放公园路(Jie Fang Park Road)” which is the bus stop adjacent to the Jie Fang Park. The end stop for this trip is “汉口火车站东站(HanKou Train Station Eastern Side)”which is the bus stop on the eastern side of the train station located in the HanKou town.
Like the ArcGIS Network Analyst application, after identifying the O-D pair, the next step is to create new road for the network analyst. The corresponding attributes of the route will list to indicate the network elements.
In the terms of the design of the adopted algorithm, the setting of the stop criteria is essential before the calculation. Here, it uses 5 min as the time difference between the first optimal route and the last optimal route which generates by the system. Otherwise, the loop process will allow continuing to search out the optimal routes. But most of this kind of results can not be accept as a reasonable guidance, neither to be a significative advice. In other words, in the aspect of impedance, without time difference restriction, the results commonly have longer travel time or complicated transfer situation. Apparently, this is not the objective to carry out the analysis. In the perspective of software engineering, the stop principle is indivisible part in the system design.
Then click the “search” bottom to start the path query. (Figure 5-12)
Figure 5-12 Case 1: O-D pair application of the system
The table in the Figure 5-13 is the database formatted after the searching process. As the discussion before, the elements’ attributes of the multiple optimal routes which determined by the O-D pair shows the geographical information of the routes. The useful information can be understood as
40

Bus trip optimization at directional level in GIS
following: Route 1: There are 3 segments in this route. The passenger needs to take bus line Nr.509 in
direction “0” (means the bus runs in the direction from west to east). It spends 13 min on-vehicle. Then take a 5 min walk to the transfer stop, finally change to the bus line Nr. “10” in the same direction to get to the end point. The total time of this optimal route is 22 min.
Route 2: In the second optimal route, comparing with the first one, the difference is when the passenger gets off the bus line Nr.509, he or she directly changes to bus line Nr.208 in the same stop without any walking. But because of the different locations of bus stops’ distribution, the passenger requires to get off the bus and finally walk to the end stop. The cumulative time of this process, passenger spends 23 min in the entire trip.
Figure 5-13 Case 1: attributes of multiple optimal routes in database
In the light of this information of optimal routs stores in database with needs to be interpreted into general guidance language for understandable reason. As a result, the further step is to translate this geographical information into emphasized line displayed in the map as it shows in Figure 5-12. At the mean time, more convenient pattern is to offer a trip guidance window, which is also the expectation in this study. The envisaged result is as following figure (Figure 5-14).
TRIP GUIDANCE Route 1: Total 22 min, One transfer time, From 解放公园站(Jie Fang Park Road), Take Bus NO.509, Get off at Stop 机场河路(Ji Chang He Road), Walk along the road , Transfer to Bus 10 To 汉口火车站东站(HanKou Train Station Eastern Side). Route 2: Total 23 min, One transfer time, From 解放公园站(Jie Fang Park Road), Take Bus NO.509, Get off at Stop 三眼桥站(San Yan Qiao Stop), Transfer to Bus 208 to 武汉博物馆站 (Wuhan Museum Stop), Walk To 汉口火车站东站(HanKou Train Station Eastern Side).
Figure 5-14 Case 1: Trip guidance information (sample interface)
5.4.2 Case Two
The same mxd file used in this case study. As the case one discussed in the previous section, the identical procedure is taken in this GIS prototype. The start stop is “解放公园路(Jie Fang Park Road)” which is the bus stop adjacent to the Jie Fang Park. The end stop for this trip is “广八路(Guang Ba Road)”which is the bus stop on the main gate of Wuhan University located in the WuChang town. The stop criteria also can be set as 5 min. Thus, search for the multiple optimal routes. The results of generating multiple optimal routes show in the Figure 5-15. And the information of the temporary database lists as Figure 5-16.
41

Bus trip optimization at directional level in GIS
Such as seen, the start and end stop are situated in different town in Wuhan City which is divided into three part by two rivers running over. Therefore, the trip crosses the river through either of the bridges over the river. In this way, two distinctly different route trends exist as showed for three colors in the map. Some segments of routes overlaps in one color for the clear representation. In the information table, the five alternatives of optimal routes indicate peculiar characteristics. The Route 1 has least travel time but with indispensable walk route for taking a transfer (Figure 5-17). The Route 2 and 3 have 1 min time difference but take absolutely different route trend. This situation sometimes might be taken into consideration when there is a high traffic jam in Changjiang NO.1 River, the trip through Changjiang NO.2 River will be better choice. In other circumstance, part of citizens may prefer the scenery along the Route 3, which will surely ignore several minutes extra. The advantage of Route 4 is short walking distance. Route 5 is another choice for the transfer from taking Bus line Nr.724 in the first part of trip.
Figure 5-15 Case 2: O-D pair application of the system
Figure 5-16 Case 2: attributes of multiple optimal routes in database
42

Bus trip optimization at directional level in GIS
Figure 5-17 Case 2: walking route of the transfer The more alternatives for travelers to choose, the more aspects need to be compared to find the most suitable one. The trip guidance window also satisfies these requirements.
TRIP GUIDANCE
Route 1: Total 50 min, One transfer time, From 解放公园站(Jie Fang Park Road), Take Bus 10, Get off at Stop 首义路前站(Shou Yi Road 1), Walk across the road , Transfer to Bus 608 To 广八路(Guang Ba Road).
Route 2: Total 52 min, One transfer time, From 解放公园站(Jie Fang Park Road), Take Bus 24, Get off at Stop 江汉路站(Jiang Han Road Stop), Transfer to Bus 608 To 广八路(Guang Ba Road).
Route 3: Total 53 min, One transfer time, From 解放公园站(Jie Fang Park Road), Take Bus 724, Get off at Stop 省邮电干校(You Dian Gan Xiao), Transfer to Bus 552 To 广八路
(Guang Ba Road)).
Route 4: Total 54 min, One transfer time, From 解放公园站(Jie Fang Park Road), Take Bus 724, Get off at Stop 省邮电干校(You Dian Gan Xiao), Walk along the road , Transfer to Bus 515 To 广八路(Guang Ba Road).
Route 5: Total 55 min, One transfer time, From 解放公园站(Jie Fang Park Road), Take Bus 724, Get off at Stop 省邮电干校(You Dian Gan Xiao), Walk along the road , Transfer to Bus 572 To 广八路(Guang Ba Road).
Figure 5-18 Case 2: Trip guidance information (sample interface)
5.4.3 Conclusions
In the circumstance of determining the average bus speed, bus headway, average travel time by the passengers, through the adjustment to impedances’ values of relevant elements in the directional public transport network, the developed GIS prototype can obtain the optimal transit trip guidance. By analyzing the original data, in the interval restriction of travel time, all the comparable distance has been calculated. Thus, in the presented algorithm, the routes generated cover all the possible results based on the data applied. And in the perspective of travel time, the route listed firstly is the most optimal trip. Nevertheless, theoretically speaking, the alternatives provided in the trip guidance window with majority of the geographical information are also acceptable. Certain route needs first walking; others may require walking to the transfer bus station in half-way. Therefore, this methodology introduced simultaneously bases on the merits of shortest distance and least transfers. It should be noted that some of the results are very close, but can meet travelers’ different principles. That is to say, people can choose to walk longer to avoid making a transfer, and those who are not
43

Bus trip optimization at directional level in GIS
willing to walk can take the least transfer for the reason of time saving. The transfer plans advised in the guidance window actually is the significance part of variety of transfer plans. There are other similar situation, such as Route 5190 and 100 repeat several route segments. The passengers can make a transfer in either bus stop in these lines and achieve the same optimized objective. In fact, these transfer stops of candidates can be pointed out one by one. To simplify the problem and calculation process in this study only considers the situation in the first transfer point. This bus trip optimization prototype is characterized by the following two features:
At the basis of existing directional bus network, the system targets at getting the optimal path with the shortest distance spatially, then to calculating the feasible transfer plan, finally generating optimal routes with the least number of transfers and the shortest accumulative travel distance.
According to the improved algorithm used in this GIS prototype, it can supply complete optimal routes in the identified O-D within the time restriction. The alternatives of optimal travel routes with difference impedance (transfer time and route distance) can be attained for the purpose of provide human-based trip guidance.
Comparing with the algorithm which exclusively based on the least transfer times or on shortest travel distance, the improved algorithm introduced in this research may have lower efficiency, but obviously the analysis results are more comprehensive, and better reflect travelers’ mode of thinking. This methodology used here not only to calculate the final comparable trip guidance, also provide explicit guidelines for transfer plan. This guide has detailed graphics and text in two ways’ expression, and specifies the choice of directional bus stop when needs to make a transfer, as well as the direction of walking movement. The cause lies in the fact is, in the complex urban environment, this kind of information is significant for passengers to obtain for travel. In addition, due to good support of the directional bus system network, this methodology has nice expansibility by means of replacing impedance of time into transfer times, walking distance and comfort level.
44

Bus trip optimization at directional level in GIS
6 Conclusions and recommendations
6.1 General conclusions
With public transport system in Wuhan as the instance, based on the existing transit network database, this research examined the methodology of bus trip optimization with the shortest distance as the goal and then calculating the optimal routes with least transfer time. The present research also brings forward multiple optimal transit routes with the reflection of reality transfer condition of the public traffic network at the directional level. Major contributions include:
The directional level of a multi-tier data model is applied to reflect the real world situation of bus transits in most large Chinese cities. The bus routes network at the directional level can meet the needs to provide accurate solution for the trip guidance with complex transfer situation.
The bus trip optimization modeled at the directional level makes more comprehensive evaluation on different travel impedance, incorporating on-board time and transfer time.
The prototype developed in ArcGIS framework fulfils the purpose to get multiple optimal routes for the trip guidance. The multiple optimal paths provide the travelers with flexibility in choosing preferred trip path.
The results represented in the detailed spatial data level explicitly indicate transfer information, including walking distances and directions between transfer points. The travel information can be easily interpreted into clear and understandable trip guidance.
6.2 Results against research objectives
The correspondence of results with the study objectives and the research questions stated in the first chapter of this research will be the evidence in order to draw the general conclusion of this research. The main objective of this presented research is to find the way to improve the accuracy of representing the complicated path and stops in bus routes system, and to provide efficient transit information service and sound optimal route guidance. Consequently, the study objectives will be briefly evaluated in the light of the findings of the present research.
To present and analyze the transit features at directional spatial level of transit data model
For trip guidance, origin-destination pair, travel time, optimal route, transfer situation including walking path, and traveller characteristics have to be identified for more realistic representation, as well as further more precise evaluation. In the study, these specific elements of network have been associated with the bus transit route network including fairly complete geographical information at the directional level. With availability of the directional bus routes and stops, the transfer situation including walking links between transfer stops can be modelled for the precise computation of travel impedance and more visible display of optimal trip.
To improve the shortest route algorithm for the multiple optimal path searching
45

Bus trip optimization at directional level in GIS
The restriction of the general algorithm of transit trip eliminates the walking time or waiting time in solving the transfer situation. However, in this research, these aspects of travel impedance are responded and computed at the directional level. The routes optimization procedure was formulated and discussed to meet this target. The improved algorithm also aims at search for the multiple routes with predefine principle. The loop process with round feedback to the bus routes network makes the route finding procedure operable. The design idea for the algorithm integrates both the aspects of cumulative travel time and total number of transfer. The calculated results achieve the predefined objective.
To find and generate multiple optimal bus route between one identified O-D pair at directional level
By applying the improved algorithm, the GIS prototype of bus routes analysis system is developed to generate the optimal paths. Among the benefits that can be gained, the bus trip optimization modelled at the directional level makes comprehensive evaluation of the time cost. And the importance attached to the explicit presentation enhances and facilitates coordinated transfers. From the experimental practice, particularly it is found more appropriate and effective results indicate the reasonable optimal trip routes at the directional spatial level between one O-D pair through the developed prototype. The high significance of the geographical information of the optimal routes illustrates that the developed prototype allows us to use this effective and efficient route searching model to get optimal routes with different travel plans. Further more; it is proved that the modelling used and the searching algorithm adopted are feasible.
To provide trip guidance with detailed transfer information for bus travellers
For the transport GIS prototype that is applicable for the detailed transfer guidance, much effort has made on the interpretation of the geographical network data into transit assistance information. The detailed network features enables more accurate trip guidance. In this research, through the attributes of the multiple optimal routes obtained before, the prototype realizes the function to provide comprehensive and appropriate transit information for the users. Moreover, the marked optimal route in the visible map together with the textual trip guidance information improves the quality of service.
6.3 Study area recommendations
A general observation on the study area that can be generalized over the large Chinese cities shows that no schedules are available at the buses or at the bus stops and consequently passengers’ arrivals to the stops are completely random. The information on buses schedules can be integrated with the real-time information on buses location and its expected time of arrival to the stop, through which passengers can know exactly the waiting time till the next service, is available. The integration of this effectual information can prevent the roughly assumption of bus headway time and the waiting time at the stop. Take this into consideration, the transfer situation can be proposed with higher rate of time accuracy.
The construction of basic transportation GIS spatial database needs continuous updating and revising. The latest maps of road network and public routes network are significant usage in large ranking of application. Particularly, the project of multiple level of data representation is required to be emphasized. In the application of bus trip optimization, this comprehensive data enables the precise evaluation of route elements.
46

Bus trip optimization at directional level in GIS
6.4 Further research recommendations
Because of time and fieldwork data limitations, a number of assumptions have been made while pursuing the present research. Possible areas of extension for the present research are summarized below:
Data preparation In this research, the existing transit network at the directional level in Wuhan city has 95-line bus routes, 415-line walk route and 526 bus stops. The Gradual improvement of the original data is the essential work for the further accurate analysis. The walk route, used to reflect the complex reality situation, presented at the directional level should pay more attention to the mode of transfer. The mode includes through pedestrian crosswalk, over-bridge cross and underpass passage. The format used in this research is the direct cross from the stop to the opposite side of the street, or link the opposite two bus stops. Nevertheless, the cross in the reality is required to make in designated place. So this kind of simplicity needs to be adjustment and edition.
Methods integration The methodology used in the present research only use the travel time to be the impedance for the entire network analysis. As a result, the multiple optimal is listed in the sequence by the cumulative travel time. And the principle of the calculation is with the first consideration of least travel time. Afterwards, the prototype searches for the transit information of the transfer situation. The different identification of impedance determines the principle of results calculation. Generally, the impedances involve travel time, travel distance and number of transfer times. In further research, the improvement of the method to generate optimal routes can be made on the integration of different travel impedance. In such a case, the optimal routes have more comprehensive optimized transit elements. Apparently, this kind of trip will be ideal for the passengers to take.
Level combination Since the directional data level is the most detailed level in multi-tier data model, the semantic level and virtual level can be combined to better present the bus routes system. It is worth noting that although most GIS packages are capable of solving geometrically overlapping lines, the manipulation of the network features at multi-tier needs specifically defined functions. The following aspects are supposed to be next research step: (1) to build semantic and topographical relationship between bus route network features at different levels. The case can be shown that he directional bus stop is dependent on its relevant stop at the virtual level. (2) to construct the connectivity between stops and routes both at directional level and virtual level. For instance, the virtual bus stop is exclusively connected to the virtual bus route. (3) to specifically identify the route segment in the situation of the overlapping routes. Besides, the modification of its network attributes, such as the transfer attributes, is also essential.
Transit assignment application Generally speaking, the intelligent transport support system for bus transit trip query contains the following functions: (1) to evaluate the existing distribution characteristic of passenger volume in bus system. (2) to find out the optimal paths according to the passenger assignment based on the bus route network. (3) to search the bus route and transfer stop in the optimal routes. (4) to provide bus transfer plan. (5) to display travel route by marking the optimal bus route and transfer bus stop in the map. In
47

Bus trip optimization at directional level in GIS
the present research, the optimal routes are dependent upon the predefined O-D pair. If the data of transit assignment is available, the distribution of transit passenger in the bus system network can be obtained through the calculation of the optimal routes between all O-D pairs. Afterwards, the analysis of the results can indicate, for example, 80 % of the travelers choose the first optimal path with the shortest travel distance, and approximately 20% of the travelers prefer to take the second optimal route with the least number of transfer. This kind of application makes the statistics analysis more practical significance.
Schedule or time-based approach In this research, the schedule or time-based approach has less emphasized. However, it is more effective than the simple headway based trip optimization. In fact, two aspects would be important foe the application of this approach: (1) to have the complete time-table for each bus line. (2) to operate the bus system according to schedule. Existing applications either emphasize on the predictable rail system (Tong and Wong 1999) or point out the advanced bus transit system (e.g. BRT) (Wahba and Shalaby 2006). For most Chinese cities, such in Wuhan, due to the complex structure of road network and the increasing large population, the bus operation cannot be quite reliable. Both for practical and theoretical, an average time cost is necessary. However, because of the advanced ability of the presentation at the directional data level, the schedule information can be incorporated with some adjustment. The later analysis will be on this area to step further to more accurate and comprehensive trip guidance. With the application of GPS, the real time bus information also can be added into the system.
48
Bus trip optimization at directional level in GIS
Reference
A. Barra, L. Carvalho, et al. (2007). Solving the Transit Network Design problem with Constraint Programming. 11th World Conference in Transport Research - WCTR 2007. University of California, Berkeley, USA.
Bell, M. G. H., Y. Iida, et al. (1997, 1997). "Transportation network analysis."
Bielli, M., A. Boulmakoul, et al. (2006). "Object modeling and path computation for multimodal travel systems." European Journal of Operational Research 175(3): 1705-1730.
Bielli, M., M. Caramia, et al. (2002). "Genetic algorithms in bus network optimization." Transportation Research Part C: Emerging Technologies 10(1): 19-34.
Chang, T.-Y. (2005). Development of Dynamic Transportation Planning Procedures–Integration of Transit Assignment. Graduate Institute of Traffic and Transportation Engineering and Management.
Chen, Y.-Z., N. Li, et al. (2007). "A study on some urban bus transport networks." Physica A: Statistical Mechanics and its Applications 376: 747-754.
Choi, K. and W. Jang (2000). "Development of a transit network from a street map database with spatial analysis and dynamic segmentation." Transportation Research Part C: Emerging Technologies 8(1-6): 129-146.
Demirel, H. (2004). "A dynamic multi-dimensional conceptual data model for transportation applications." ISPRS Journal of Photogrammetry & Remote Sensing 58: 301-314.
Dijkstra, E. W. (1959). "A note on two problems in conexion with graphs." Num. Mathematik 1: 269 - 271.
Dueker, K. J. and J. A. Butler (1998). "GIS-T enterprise data model with suggested implementation choice." URISA Journal 10(1): 12-36.
Duff-Riddell, W. R. and C. J. Bester (2005). "Network modeling approach to transit network design." Journal of Urban Planning and Development-Asce 131(2): 87-97.
ESRI White Paper (2004). Delivering Custom GIS Applications With ArcGIS Engine.
Fan, W. and R. B. Machemehl (2004). Optimal Transit Route Network Design Problem--Algorithms, Implementations, and Numerical Results, Center for Transportation Research
University of Texas at Austin.
49

Bus trip optimization at directional level in GIS
Hensher, D. A. and K. J. Button, Eds. Handbook of Transport Modelling.
Horn, M. E. T. (2002). "Multi-modal and demand-responsive passenger transport systems: a modelling framework with embedded control systems." Transportation Research Part A: Policy and Practice 36(2): 167-188.
Hou, G., K. Zhou, et al. (2007). Algorithm for Public Transit Trip with Minimal Transfer Times and Shortest Travel Time. Knowledge Science, Engineering and Management: 562-567.
Huang, R. (2007). "A Schedule-based Pathfinding Algorithm for Transit Networks Using Pattern First Search." GeoInformatica 11(2): 269-285.
Huang, Z. (2006). A Multi-Tier Data Model for Bus Transit and Its Application in Chinese Cities. Geoinformatics 2006:GNSS and Integrated Geospatial Applictions. D. Li and L. Xia. Wuhan, China, SPIE - The International Society for Optical Engineering. 6418: 64180Z(1-12).
Huang, Z. and D. Wang (2007). "Urban Bus Trip Optimization Based on a Multi-tier Transit Data Model."
Institute of Urban transport management in China Academy of Management Science (2008). "Retrospect and Prospect of the Development of Wuhan Urban Transport " The Second Urban Transportation High-Ranking Forum.
Jau-Ming, S., C. Chih-Hung, et al. (2008). Development of Trip Planning Systems on Public Transit in Taiwan. Networking, Sensing and Control, 2008. ICNSC 2008. IEEE International Conference on.
Koncz, N., J. Greenfeld, et al. (1996). "A strategy for solving static multiple-optimal-path transit network problems." Journal of Transportation Engineering.(May/June): 218-225.
Konstantinos Evangelidis, P. P., Demetrios Panayotakopoulos. (2001). "Considering network demand issues in GIS Transportation Data Modelling." from gis2.esri.com.
Lam, W., Z. Wu, et al. (2003). "Estimation of Transit Origin–Destination Matrices from Passenger Counts Using a Frequency-Based Approach." Journal of Mathematical Modelling and Algorithms 2(4): 329-348.
Lee, Y. J. and V. R. Vuchic (2005). "Transit network design with variable demand." Journal of Transportation Engineering-Asce 131(1): 1-10.
Li, Q., Y. Wang, et al. (2008). "Readjustment Effect Analysis of Public Bus Network in Beijing." Journal of Transportation Systems Engineering and Information Technology 8(2): 27-33.
LU Huapu and S. Ye (2007). "Complexity of Public Transport Networks." TSINGHUA SCIENCE AND TECHNOLOGY 12(2): 204-213.
Marin, A. (2007). "An extension to rapid transit network design problem." Top 15(2): 231-241.
Miller, J. and S.-L. Shaw "GIS-T DATA MODELS." Oxford University Press.
50

Bus trip optimization at directional level in GIS
Modesti, P. and A. Sciomachen (1998). "A utility measure for finding multiobjective shortest paths in urban multimodal transportation networks." European Journal of Operational Research 111(3): 495-508.
Peng, S. and H. S. L. Fan (2007). "A New Computational Model for the Design of an Urban Inter-modal Public Transit Network." Computer-Aided Civil and Infrastructure Engineering 22(7): 499-510.
Peng, Z. R. and R. Huang (2000). "Design and development of interactive trip planning for web-based transit information systems." Transportation Research Part C: Emerging Technologies 8(1-6): 409-425.
PEUQUET, D. (1984). "A Conceptual Framework And Comparison Of Spatial Data Models." Cartographica: International Journal of Geographical Information Science, 21(4): 66-113.
Sheth, C., K. Triantis, et al. (2007). "Performance evaluation of bus routes: A provider and passenger perspective." Transportation Research Part E: Logistics and Transportation Review 43(4): 453-478.
TAN, M.-C., C.-O. TONG, et al. (2004). "Study and Implimatation Of a Decision Support System For Urban Mass Transit Service Planning." Information Technology Management XV.
Teodorovi, cacute, et al. (2005). "Schedule synchronization in public transit using the fuzzy ant system." Transportation Planning and Technology 28(1): 47 - 76.
Tong, C. O. and S. C. Wong (1999). "A schedule-based time-dependent trip assignment model for transit networks." Journal of Advanced Transportation 33(3): 371-388.
Uchida, K., A. Sumalee, et al. (2007). "A Study on Network Design Problems for Multi-modal Networks by Probit-based Stochastic User Equilibrium." Networks and Spatial Economics 7(3): 213-240.
Wahba, M. and A. Shalaby (2006). A General Multi-agent Modelling Framework for the Transit Assignment Problem – A Learning-Based Approach. Innovative Internet Community Systems: 276-295.
Wong, S. C. and C. O. Tong (1998). "Estimation of time-dependent origin-destination matrices for transit networks." Transportation Research Part B: Methodological 32(1): 35-48.
Zhao, F. and X. G. Zeng (2007). "Optimization of transit route network, vehicle headways and timetables for large-scale transit networks." European Journal of Operational Research 186(2): 841-855.
51