buru energy ltd (bru) buru energy · buru energy ltd (bru) cer ... our 12-month forward valuation...
TRANSCRIPT

Page 1 of 16
Buru Energy Ltd (BRU)
Oil
& G
as: P
rodu
cer
Brief Business Description:
Hartleys Brief Investment Conclusion
Chairman & CEO:
Eric Streitberg Executive Chairman
Substantial Shareholders:
Birkdale Enterprises Pty Ltd 8%
Chemco Pty Ltd 8%
E C Streitberg 7%
Company Address:
Issued Capital: 432m
- fully diluted 437m
Market Cap: $125.3m
- fully diluted $126.6m
Debt (end CY17)
Cash (end CY17)
FY16A FY17F FY18F
Prod ('000 bbl) 23 133 913
Op Cash Flw -$10m $1m $23m
Free Cash Flw $0m -$13m $5m
NPAT* (A$m) -$14m -$7m $15m
EPS ($c, bas)* (3.3) (1.5) 3.44
P/E (basic)* -8.8x -19.0x 8.4x
EV / EBIT -8.9x -11.6x 5.6x
EV / EBITDA -12.7x -19.1x 4.8x
N.D. / equity -16% -15% -18%
Net Cash End $8.8m $9.2m $14.3m
*normalised
Source: Hartleys Research
Authors:
Aiden Bradley
Industrials and Energy Analyst
Ph: +61 8 9268 2876
Hartleys has provided corporate advice within the
past 12 months and continues to provide
corporate advice to Buru Energy Limited, for
which it has earned fees and continues to earn
fees.
12mth Price Target: $0.66
BRU.asxSpeculative Buy
7 Feb 2018
Share Price: $0.29
$7.5m
$16.9m
BRU is an oil producer and explorer with a core
focus on the Canning Basin. Key asset is the
Ungani Oil Field.
BRU generates cash flow from oil sales from the
Ungani Oil Field with additional upside potential
from further development. BRU has an extensive
exploration acreage position.
16 Ord Street
West Perth
WA 6872
BURU ENERGY LTD (BRU)
Houston, We Have Liftoff! Buru Energy Ltd (‘BRU’ or ‘the Company’) is nearing the completion of their
Ungani Field Accelerated Development Programme (‘UADP’). Subject to
some weather delays, it would seem that the four well workover and drilling
programme has been a success. The Company is now targeting an increase
in production towards 3,000bopd over the coming two quarters. With this
foundation now in place, the management team can focus on securing
funding / a farm in for follow up exploration drilling along the Ungani Trend.
This process is already well advanced with the Company also attending
NAPE in Houston this week, one of the Oil industry’s premier marketplaces
for the buying, selling and trading of prospects and producing properties.
Ungani Accelerated Development Program, is just the start. In our initiation report ‘Beauty in Simplicity’, (8/11/17) we outlined a number
of potential catalysts over the next 12 months, starting with the UADP. This is
expected to be followed up by securing support/funding for follow up oil
exploration along the Ungani Trend. The potential for further exploration along
the Ungani Trend has obviously been boosted by the successful development
at Ungani. We believe that it is highly likely that further Ungani lookalike fields
do exist, the challenge will be finding them given the relative lack of wells and
large areal size of the play. Beyond that, further positives may materialise
from progress on their gas portfolio opportunities (including appraisal by
Mitsubishi in nearby permits) and their high leverage to oil prices.
Our 12-month forward valuation is A$0.66 per share. Our 12-month forward valuation and target price of A$0.66ps (down 1c on
slightly higher costs) has been based on a successful outcome of the UADP
and our NPV10 assumptions for the Ungani Oil Field (3,000bopd peak
production, 9.6mmbbl recoverable oil and a A$100/bbl long run oil price). It
also contains a heavily risked value for future oil potential along the Ungani
Trend. We also include a value for the Goldwyer unconventional oil potential
and Laurel Formation gas potential based on a peer value for similar early
stage resource plays. On the basis of the upside to our target price and
continued pipeline of catalysts we continue to rate BRU a Speculative Buy.
Key Chart: BRU Valuation – Ungani UADP success
Source: Hartleys Research.
Hartleys Limited ABN 33 104 195 057 (AFSL 230052) 141 St Georges Terrace, Perth, Western Australia, 6000
Hartleys does and seeks to do business with companies covered in its research reports. As a result, investors should be aware that the
firm may have a conflict of interest that could affect the objectivity of this report. Investors should consider this report as only a single
factor in making their investment decision. Further information concerning Hartleys’ regulatory disclosures can be found on Hartleys
website www.hartleys.com.au
0.00
0.05
0.10
0.15
0.20
0.25
0.30
0.35
0.40
.
.5
1.
1.5
2.
2.5
3.
3.5
4.
Feb-18Oct-17Jun-17Feb-17
Volume - RHS
BRU Shareprice - LHS
Sector (S&P/ASX SMALL RESOURCES) - LHS
A$ M
Buru Energy
Source: IRESS

Hartleys Limited Buru Energy Ltd (BRU) 7 February 2018
Page 2 of 16
SUMMARY MODEL
Buru Energy Limited Share Price
BRU $0.290 Speculative Buy
Key Market Information Directors Company Information
Share Price $0.29 Eric Streitberg Executive Chairman Level 2
Market Capitalisation $125m Eve How ell NED 16 Ord Street
Robert Willes NED West Perth
Issued Capital 432m Shane McDermott Head of Finance & Company Secretary WA 6872
Issued Capital (fully diluted inc. ITM options) 437m w w w .buruenergy.com
Options 4.6m
EV $116m
Net Debt -$9m Substantial Shareholders m shares %
Valuation 2 Birkdale Enterprises Pty Ltd 35.7 8.3%12 Month Price Target $ ps 0.66 3 Chemco Pty Ltd 33.3 7.7%
5 E C Streitberg 29.7 6.9%
P&L Unit 2015A 2016A 2017F 2018F 2019F 6
7 Production Summary Unit Pre-16 2016A 2017F 2018F 2019F
Net Revenue 3.5 0.2 7.9 60.4 79.8 8
COGS (5.3) (1.4) (6.0) (28.8) (35.4) 9 Oil '000 bbl 597 23 133 913 1,095
EBITDAX (8.4) (9.1) (6.1) 24.3 39.5 #
Depreciation/Amort (3.5) (4.0) (4.0) (3.3) (6.8)
EBIT (11.9) (13.1) (10.0) 20.9 32.6
Net Interest 5.1 (1.2) 0.5 0.5 0.8 Price Assumptions Unit 2015A 2016A 2017F 2018F 2019F
Pre-Tax Profit (6.8) (14.3) (9.5) 21.4 33.4
Tax Expense - - 2.9 (6.4) (10.0) Oil A$/bbl 69.60 58.56 66.67 73.33 80.00
NPAT (6.8) (14.3) (6.7) 15.0 23.4
Abnormal Items (32.1) (19.5) - - -
Reported Profit (38.9) (33.8) (6.7) 15.0 23.4
Share Price Valuation (NAV)
Balance Sheet 2015A 2016A 2017F 2018F 2019F
A$ m Un-risked Risking Risked cps
Cash 33.9 21.1 16.4 19.1 31.9 Ungani 198.0 100% 198.0 45.4
Other Current Assets 5.0 3.3 2.5 8.1 10.3 Other Exploration 537.4 16% 85.3 19.5
Total Current Assets 38.9 24.3 18.9 27.1 42.3 Gas Option 875.0 3% 21.9 5.0
Property, Plant & Equip. 34.8 26.8 22.8 50.5 55.7 Net Debt & Corp. -16.0 -3.7
Exploration 48.2 22.0 33.2 17.6 19.8
Investments/other 0.1 0.1 0.1 0.1 0.1 Valuation 66
Tot Non-Curr. Assets 83.2 48.8 56.1 68.1 75.6
Total Assets 124.7 73.2 75.0 95.3 117.8
Petroleum Tenements
Payables 7.7 0.6 0.5 8.3 9.9
ST Debt + other 1.4 1.3 1.3 1.3 1.3 Permit JV Partner % Interest
Total Curr. Liabilities 9.0 1.9 1.8 9.5 11.1 L6* 100%
Long Term Borrow ings 21.5 11.0 6.0 3.5 1.0 L8 100%
Other 4.1 4.1 4.1 4.1 4.1 L17 100%
Total Non-Curr. Liabil. 25.6 15.1 10.1 7.6 5.1 L20 100%
Total Liabilities 34.6 16.9 11.8 17.1 16.2 L21 100%
PL7 100%
Net Assets 90.0 56.2 63.2 78.2 101.6 PL109 100%
EP129* 100%
Cashflow 2015A 2016A 2017F 2018F 2019F EP391 100%
EP428 100%
EBITDA (8.4) (9.1) (6.1) 24.3 39.5 EP431 100%
Chg WC 2.7 (5.3) 0.6 2.2 (0.6) EP436 100%
Interest 5.1 (1.2) 0.5 0.5 0.8 EP457 Mitsubishi 37.5% 37.5%
Tax - - 2.9 (6.4) (10.0) Rey Resources 25%
Other (7.2) 5.7 2.6 2.2 0.5 EP458 Mitsubishi 37.5% 37.5%
Gross Cash Flow (7.8) (9.9) 0.6 22.7 30.2 Rey Resources 25%
Capex (21.6) (5.8) (13.9) (17.6) (14.8) *Excluding Backreef Area
Other (4.1) 15.5 - - -
Free Cash Flow (33.5) (0.3) (13.3) 5.1 15.4
Share Issuance 0.0 0.0 13.7 0.0 0.0
Debt Issuance 7.4 (12.5) (5.0) (2.5) (2.5)
Dividend 0.0 0.0 0.0 0.0 0.0
Other 0.1 (0.0) 0.0 0.0 0.0
Net Chang in Cash (26.0) (12.8) (4.6) 2.6 12.9
Ratio Analysis Unit 2015A 2016A 2017F 2018F 2019F
Free Cash Flow / share A¢ (7.7) (0.1) (3.1) 1.2 3.5
Cashflow Multiple X (3.8) (404.5) (9.5) 24.6 8.2
Earnings Per Share A¢ (1.6) (3.3) (1.5) 3.4 5.4
Price to Earnings Ratio X (18.6) (8.8) (19.0) 8.4 5.4
EV / EBIT X (9.7) (8.9) (11.6) 5.6 3.6
EV / EBITDA X (13.8) (12.7) (19.1) 4.8 2.9
Interest Cover X 1.6 na 12.1 na na
Net debt / Equity % na na na na na
Analyst : Aiden BradleyPhone: +61 8 9268 2876 Last updated
Sources: IRESS, Company Information, Hartleys Research
February 7, 2018
7 February 2018

Hartleys Limited Buru Energy Ltd (BRU) 7 February 2018
Page 3 of 16
HIGHLIGHTS BRU are nearing the completion of their Ungani Field Accelerated Development
Programme (‘UADP’). Subject to some weather delays, it would seem that the four
well workover and drilling programme has been a success. The Company is now
targeting an increase in production towards 3,000bopd over the coming two
quarters.
With this foundation now in place, the management team can focus on securing
funding / a farm in for follow up exploration drilling along the Ungani Trend. This
process is already well advanced with the Company also attending NAPE in
Houston this week, one of the Oil industry’s premier marketplaces for the buying,
selling and trading of prospects and producing properties.
http://napeexpo.com
Solid Foundation in Place:
The Ungani Field Accelerated Development Programme began with the successful
installation and commissioning of ESPs in Ungani 1ST1 and Ungani 2. The wells
have performed in line with expectations since the installation of the ESPs, and
additional trucking capacity has progressively come on line to enable increases in
production. As a result, oil production during the recent quarter was 83,870 bbls. Oil
sales during the quarter were 54,981 bbls at a realised price of ~AUD$76/bbl.
Fig. 1: Ungani Field Accelerated Development Programme
Source: BRU
Ungani Phase 2 surface upgrades were completed to provide extra storage and
processing capacity for the new wells. The current estimate for the final cost of the
Ungani drilling program is $11.5m which includes the drilling of the Ungani 4 and
Ungani 5 development wells, flow testing operations for both wells and injectivity
testing at Ungani 3. The original budget for the Ungani drilling program was $9.5m
which was based on a sidetrack of Ungani 3 and the Ungani 4 development well.
The cost differential has been caused by several factors including the change in
scope to Ungani 5 and equipment and weather-related delays.
The forward plan is to continue to build production and transport capacity to the
target rate of 3,000 barrels of oil per day by early Q2 2018.
Q2 2017 - Production restart - 1,000 bopd
Q4 2017 - Install ESP’s - Upgrade facilities - 1500 bopd
Q4 2017/Q1 2018 - Drill, complete and flow test Ungani 4/5
Q1 2018 - Hook up Ungani 4 - Phase 3 facility upgrade - Target 2,000 bopd

Hartleys Limited Buru Energy Ltd (BRU) 7 February 2018
Page 4 of 16
Q2 2018 - Flowline for Ungani 5 - Target 3,000 bopd
Cash at the end of the quarter was $16.8m with the Company forecasting a cash
outflow of $10.3 million in the March 2018 quarter. However, production cash inflows
are set to increase materially from 2Q18, in line with the substantial increase in
production.
Fig. 2: Ungani Well Locations
Source: BRU
Ungani 4 Well Review:
The Ungani 4 well was drilled principally to provide an additional drainage point in
the Ungani Oil Field with targeted production of 1,000bopd from this well. Ungani 4
reached a total depth of 2,249m and encountered a gross oil column in excess of
60m. This compares to an oil column of 58m at Ungani 1ST1 and 54m in Ungani 2.
Drill cuttings and oil shows observed while drilling through the reservoir are
consistent with the other producing wells in the field.
Given the positive results of the Ungani 4 well, construction of the flowline from
Ungani 4 back to the production facility was undertaken to immediately put the well
into production following its completion.
There has been a slight delay in bringing Ungani 4 into production. BRU were unable
to obtain wireline logs of the well. While repairing the wireline unit the shale section
above the reservoir seems to have become plugged (bridged-off). The equipment
required to obtain logs and complete the well was not originally available on site.
Following a period of exceptionally heavy rains during January causing the closure
of roads in the area, the test program is now set to commence in late February.
Ungani 5 well review:
The objective of Ungani 5 is to confirm circa 3mmbbls of resources in the eastern
fault block and upon success potentially increase overall field production to
3,000bopd.

Hartleys Limited Buru Energy Ltd (BRU) 7 February 2018
Page 5 of 16
The top of the Ungani Dolomite was encountered as prognosed at 2,122.4 metres.
The overlying Ungani Shale section was a similar thickness to other wells in the field
in contrast to its anomalously thin section in Ungani 3.
Good to excellent oil shows were noted in cuttings samples from 2,122.4 metres to
2,215 metres measured depth.
Fig. 3: Ungani Production
Source: BRU
Valuation Impact In our initiation note ‘Beauty in Simplicity’ (8th November 2018) we outlined a number
of potential catalysts and potential milestones over the next 12 months that we
expected to drive the current price up towards our target. These included;
1.CY17: Ungani Accelerated Development Program.
2. CY18: Follow Up Oil Exploration.
3.CY18/19: Gas Appraisal by Mitsubishi.
And that BRU was also highly leveraged to rising oil prices.
Our 12-month forward valuation and target price assumed a successful result at
Ungani 4 & 5 and our base case NPV10 for the Ungani Oil Field (3,000bopd peak
production, 9.6mmbbl recoverable oil and a A$100/bbl long run oil price). Post the

Hartleys Limited Buru Energy Ltd (BRU) 7 February 2018
Page 6 of 16
successful Accelerated Development Programme we have largely left this
unchanged (a one cent downgrade on the back of a slightly higher budget).
Fig. 4: Ungani Production
Source: Hartleys Research
Over the future life of the field we estimate that Ungani will generate close to $400m
of free cash flow after tax (and an NPV of roughly A$21.15 per barrel) on the basis
of our long run Brent price of US$75/bbl (and an AUD/USD of 0.75c).
Fig. 5: Ungani Net Cash Flow
Source: Hartleys Research
Beyond the Ungani Field, our valuation also contains a heavily risked value for future
oil potential along the Ungani Trend. We now expect management to focus on
securing funding for this programme, principally by way of industry farm out.
We also include a value for the Goldwyer unconventional oil potential and Laurel
Formation gas potential based on a peer value for similar early stage resource plays.

Hartleys Limited Buru Energy Ltd (BRU) 7 February 2018
Page 7 of 16
On the basis of the upside to our 12-month target price and pipeline of catalysts we
rate BRU a Speculative Buy.
Fig. 6: BRU Prior (8 th November) Valuation – Base Case
Source: Hartleys Research. Research note ‘Beauty in Simplicity’ (8th November 2018)
Fig. 7: BRU Prior (Current) Valuation – Base Case
Source: Hartleys Research.
Oil Price Leverage: As a relatively fixed cost oil producer, BRU through its Ungani
project has significant leverage to the oil price. Additionally, at higher oil prices the
likelihood of funding future exploration would also increase as the appetite for further
exploration in the Canning Basin will ebb and flow with prevailing international oil
and domestic gas prices.
Fig. 8: Ungani NPV10 at Differing Oil Prices
Source: Hartleys Research
Share Price Valuation (NAV)
A$ m Un-risked Risking Risked cps
Ungani Uplift 105.0 100% 105.0 23.8
Ungani + 4&5 98.0 100% 98.0 22.2
Other Exploration 537.4 16% 85.3 19.4
Gas Option 875.0 3% 21.9 5.0
Net Debt & Corp. -16.5 -3.8
Valuation 67
Share Price Valuation (NAV)
A$ m Un-risked Risking Risked cps
Ungani 198.0 100% 198.0 44.9
Other Exploration 537.4 16% 85.3 19.4
Gas Option 875.0 3% 21.9 5.0
Net Debt & Corp. -16.0 -3.6
Valuation 66
Hartleys Limited Buru Energy Ltd (BRU) 7 February 2018
Page 8 of 16
Timetable of Events / Catalysts:
✓ CY17: Ungani Accelerated Development Program
2: CY18: Ungani Trend Oil Exploration
3: Timing Uncertain: Unconventional Oil appraisal
4: CY18/19: Gas Appraisal
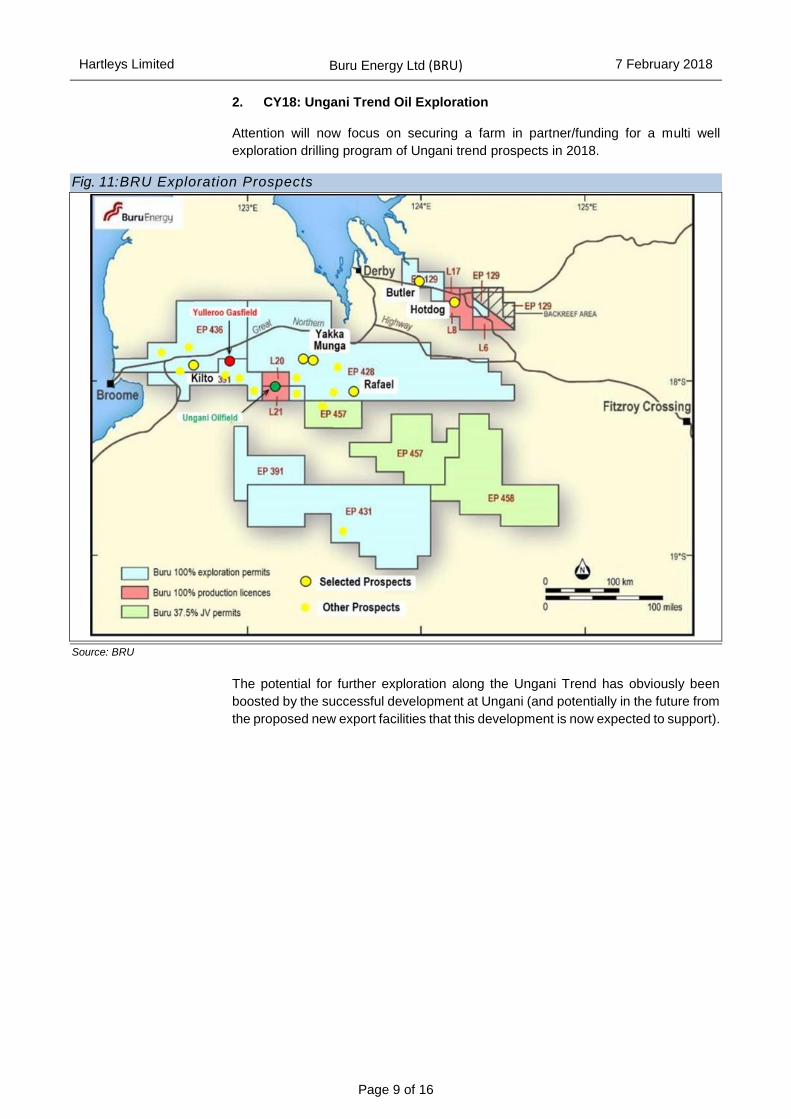
1: Ungani Accelerated Development Program (NEAR COMPLETE)
Overall the Ungani Accelerated Development Program has the potential to increase
production to 3,000 bopd and provide a 50% uplift in the resource base. A successful
Ungani resource upgrade could underpin the future development of a Broome export
facility (cost estimate of at $18m) that significantly increases the long-term oil
production operating margin and supports future oil exploration activities.
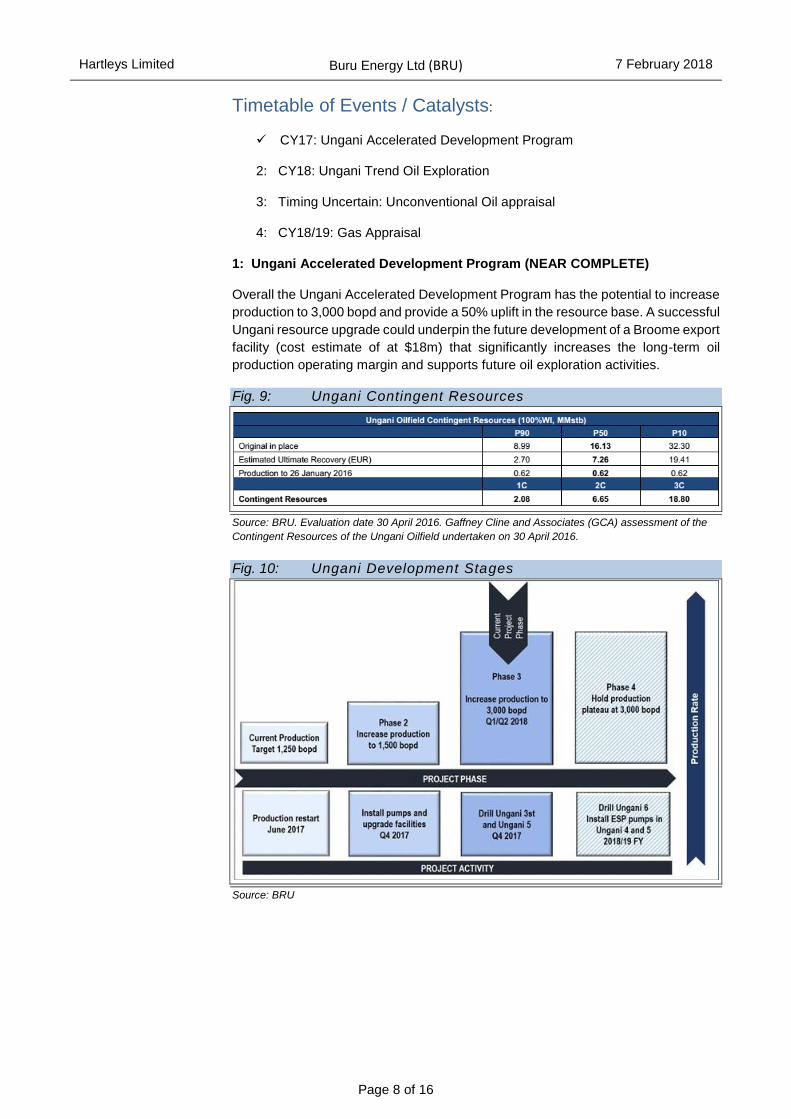
Fig. 9: Ungani Contingent Resources
Source: BRU. Evaluation date 30 April 2016. Gaffney Cline and Associates (GCA) assessment of the
Contingent Resources of the Ungani Oilfield undertaken on 30 April 2016.
Fig. 10: Ungani Development Stages
Source: BRU
Hartleys Limited Buru Energy Ltd (BRU) 7 February 2018
Page 9 of 16
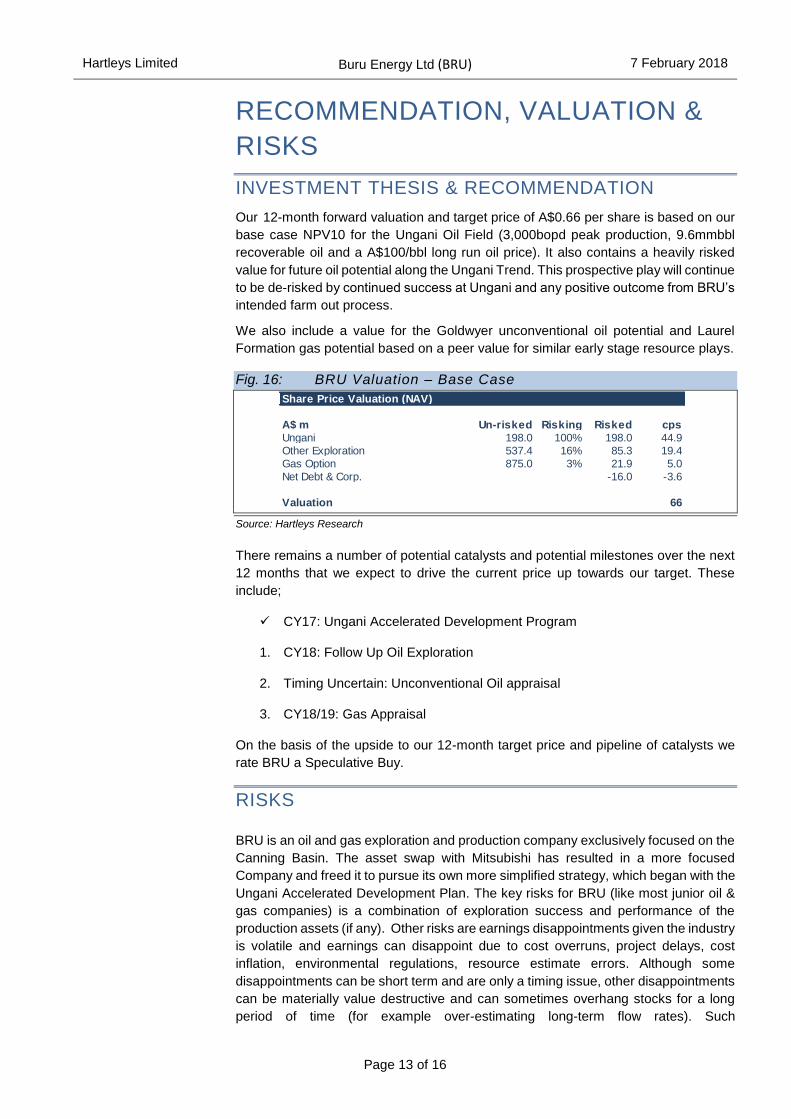
2. CY18: Ungani Trend Oil Exploration
Attention will now focus on securing a farm in partner/funding for a multi well
exploration drilling program of Ungani trend prospects in 2018.
Fig. 11: BRU Exploration Prospects
Source: BRU
The potential for further exploration along the Ungani Trend has obviously been
boosted by the successful development at Ungani (and potentially in the future from
the proposed new export facilities that this development is now expected to support).

Hartleys Limited Buru Energy Ltd (BRU) 7 February 2018
Page 10 of 16
Fig. 12: Ungani Cross Section
Source: BRU
We believe that it is highly likely that further Ungani lookalike fields do exist, the
challenge will be finding them given the relative lack of wells and large aerial size of
the play.
Fig. 13: Ungani Development Stages
Source: BRU
3: Unconventional Oil appraisal (Timing Uncertain)
Finder Exploration’s Theia-1 well in the Goldwyer Formation was very encouraging.
Theia-1 was a test of the Middle Ordovician Goldwyer III liquids rich resource play
and early assessment of the well results appear to validate the geological model and
substantially de-risk the play. However, there is currently a moratorium on hydraulic
fracturing in WA and the future of fracking in WA will be decided following an
independent scientific inquiry, chaired by Environmental Protection Authority
chairperson Tom Hatton. Hence the timing of further testing on Exploration Permit
EP 493 by Finder is uncertain and similarly the knock-on impact this testing would
have had on BRU’s surrounding large acreage position.
4: CY18/19: Gas Appraisal
The appraisal of the Yulleroo gas resource is also subject to the timing of the WA
fraccing enquiry and is expected to be delayed until 2019/20. BRU has identified a
world scale gas condensate resource base in the Laurel Formation in the Canning
Basin and subsequent to the transaction with Mitsubishi, Buru Energy has a 100%

Hartleys Limited Buru Energy Ltd (BRU) 7 February 2018
Page 11 of 16
interest of the Yulleroo Gasfield and the gas resources in the other areas of the
basin outside EP 371.
Fig. 14: Goldwyer and Laurel Formation Prospectivity
Source: BRU
Subsequent to the end of the quarter RISC Advisory Pty Ltd (RISC) completed an
independent assessment of the tight gas and hydrocarbon liquid resources of the
Yulleroo Field within exploration permits EP 391 and EP 436. RISC has estimated
Contingent and Prospective Resource sales gas and associated liquids in the
Yulleroo Field as at 1 December 2017 as follows:
The forward plan for the Yulleroo Field is not currently being progressed due to the
WA Government fraccing moratorium.
Fig. 15: Yulleroo Field Resources*
Source: Hartleys Research.

Hartleys Limited Buru Energy Ltd (BRU) 7 February 2018
Page 12 of 16
*RISC’s Contingent Resource and Prospective Resource assessment has been prepared using the
probabilistic method and an evaluation date of 1 December 2017. Contingent Resources are quantities
of petroleum estimates as of a given date to be potentially recoverable from known accumulations by
application of development project(s) but which are not currently considered to be commercially
recoverable due to one or more contingencies. Contingent Resources are a class of discovered
recoverable resources. Prospective Resources are estimated quantities of petroleum that may
potentially be recovered by the application of a future development project(s) that relate to
undiscovered accumulations. These estimates have both an associated risk of discovery and a risk of
development. Further exploration, appraisal and evaluation is required to determine the existence of a
significant quantity of potentially moveable hydrocarbons. The full resource statement is set out in
accordance with ASX Listing Rules in Buru’s ASX release of 18 January 2018. Buru Energy is not
aware of any new information or data that materially affects the information included in the 18 January
2018 release and all material assumptions and technical parameters underpinning the estimates in that
release continue to apply and have not materially changed.
Hartleys Limited Buru Energy Ltd (BRU) 7 February 2018
Page 13 of 16
RECOMMENDATION, VALUATION &
RISKS
INVESTMENT THESIS & RECOMMENDATION
Our 12-month forward valuation and target price of A$0.66 per share is based on our
base case NPV10 for the Ungani Oil Field (3,000bopd peak production, 9.6mmbbl
recoverable oil and a A$100/bbl long run oil price). It also contains a heavily risked
value for future oil potential along the Ungani Trend. This prospective play will continue
to be de-risked by continued success at Ungani and any positive outcome from BRU’s
intended farm out process.
We also include a value for the Goldwyer unconventional oil potential and Laurel
Formation gas potential based on a peer value for similar early stage resource plays.
Fig. 16: BRU Valuation – Base Case
Source: Hartleys Research
There remains a number of potential catalysts and potential milestones over the next
12 months that we expect to drive the current price up towards our target. These
include;
✓ CY17: Ungani Accelerated Development Program
1. CY18: Follow Up Oil Exploration
2. Timing Uncertain: Unconventional Oil appraisal
3. CY18/19: Gas Appraisal
On the basis of the upside to our 12-month target price and pipeline of catalysts we
rate BRU a Speculative Buy.
RISKS
BRU is an oil and gas exploration and production company exclusively focused on the
Canning Basin. The asset swap with Mitsubishi has resulted in a more focused
Company and freed it to pursue its own more simplified strategy, which began with the
Ungani Accelerated Development Plan. The key risks for BRU (like most junior oil &
gas companies) is a combination of exploration success and performance of the
production assets (if any). Other risks are earnings disappointments given the industry
is volatile and earnings can disappoint due to cost overruns, project delays, cost
inflation, environmental regulations, resource estimate errors. Although some
disappointments can be short term and are only a timing issue, other disappointments
can be materially value destructive and can sometimes overhang stocks for a long
period of time (for example over-estimating long-term flow rates). Such
Share Price Valuation (NAV)
A$ m Un-risked Risking Risked cps
Ungani 198.0 100% 198.0 44.9
Other Exploration 537.4 16% 85.3 19.4
Gas Option 875.0 3% 21.9 5.0
Net Debt & Corp. -16.0 -3.6
Valuation 66

Hartleys Limited Buru Energy Ltd (BRU) 7 February 2018
Page 14 of 16
disappointments can be very difficult to predict and share price reactions can be
severe and immediate upon disclosure by the company.
High financial leverage (if it exists at that time) would add to the problem. Investing in
explorers is very risky given the value of the company (exploration value) in essence
assumes that the market will recognise a portion of potential value before the results
of an exploration program are known, conscious that the ultimate chance of success
is low (typically 1%-20%) and that failure is much more likely, in most cases.
Fig. 17: Key assumptions and risks for valuation Assumption Risk of not realising
assumption Risk to valuation if
assumption is incorrect
Comment
Ungani Production, Reserves and Exploration Upside.
Moderate
High
We assume that Ungani production reached the Company target of 3,000bopd in CY19. This is reliant on a positive result at the Ungani 4 and Ungani 5 development wells. We also assume
total recovery of just over 9.6mmbbl, which is at the top end of outcome range, so has some risk
to the downside. While we feel (post Ungani drilling and recent rise in oil prices) that our
exploration value is extremely conservative, it is reliant on securing a farm in partner / funding, so
may not eventuate in a timely manner.
Tax Rate Moderate Low While our assumptions on reserves are at the top
end of expectations and our oil price also seems to be above consensus, we have been
conservative in our treatment of tax for Ungani, and have only given BRU the benefit of a
proportion of their available tax credits. Hence, our tax/Government take may be too high
(especially at lower production/reserve and/or oil price scenarios)
Capital Commitments Moderate High Drilling and completion costs have historically
been very high in the Canning Basin. However, the current downturn in the oil price has resulted in a significant decline in service costs. Current
estimates for Ungani 4 as an example are A$4.7m for drill and completion (less than half
what we estimate it would have cost at the peak of the last cycle). Going forward capital costs are
likely to rise and fall with prevailing oil prices.
Oil Price and currency Forecasts
Moderate High From recent cyclical lows we had expected the Brent oil price to recover towards the top end of its current US$40-60/bbl trading range before
breaking out to a higher US$60-75/bbl price band from FY19 as lower cost onshore US production peaks. So, prices in our opinion have obviously overshot in the near term, but the medium-term
trend remains bullish and higher from recent year lows. The Ungani Oilfield and hence BRU is highly leveraged to the oil price. Our long run AUD / USD is US$0.75. A rising AUD would
impact BRU negatively as they have a significant proportion of their cost base in AUD.
Western Australian drilling legislation
Moderate High BRU is exclusively focused on the Canning Basin in Western Australia. Hence it is at risk from changes to Petroleum Legislation and Title issues in the Canning Basin itself. Fracture
stimulation is currently not allowed in WA, until a Government led review is complete. This will
directly impact BRU’s ability to explore its Goldwyer Unconventional Oil and Laurel
Formation Gas potential.
Conclusion We believe our Ungani Field assumptions are achievable and have a moderate to high level of
confidence in both our forward capex and macro assumptions
Source: Hartleys Research
Hartleys Limited Buru Energy Ltd (BRU) 7 February 2018
Page 15 of 16
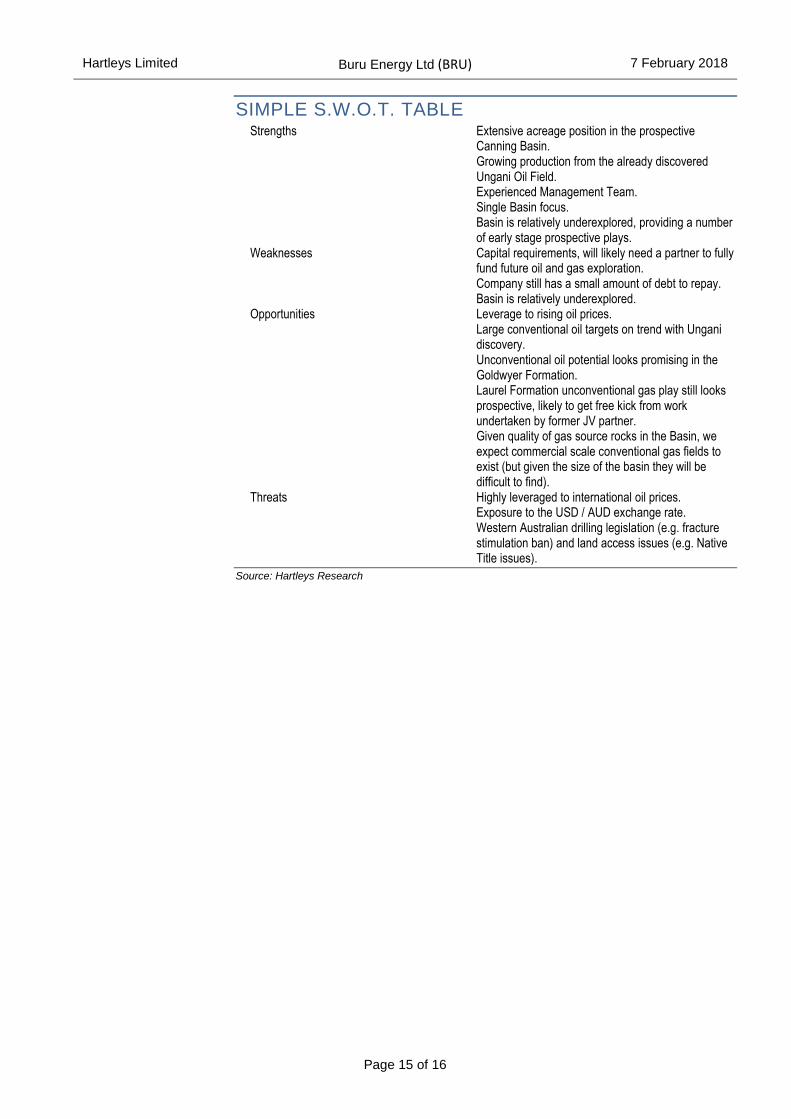
SIMPLE S.W.O.T. TABLE Strengths Extensive acreage position in the prospective
Canning Basin. Growing production from the already discovered Ungani Oil Field. Experienced Management Team. Single Basin focus. Basin is relatively underexplored, providing a number of early stage prospective plays.
Weaknesses Capital requirements, will likely need a partner to fully fund future oil and gas exploration. Company still has a small amount of debt to repay. Basin is relatively underexplored.
Opportunities Leverage to rising oil prices. Large conventional oil targets on trend with Ungani discovery. Unconventional oil potential looks promising in the Goldwyer Formation. Laurel Formation unconventional gas play still looks prospective, likely to get free kick from work undertaken by former JV partner. Given quality of gas source rocks in the Basin, we expect commercial scale conventional gas fields to exist (but given the size of the basin they will be difficult to find).
Threats Highly leveraged to international oil prices. Exposure to the USD / AUD exchange rate. Western Australian drilling legislation (e.g. fracture stimulation ban) and land access issues (e.g. Native Title issues).
Source: Hartleys Research

Page 16 of 16
HARTLEYS CORPORATE DIRECTORY Research Trent Barnett Head of Research +61 8 9268 3052
Mike Millikan Resources Analyst +61 8 9268 2805
John Macdonald Resources Analyst +61 8 9268 3020
Paul Howard Resources Analyst +61 8 9268 3045
Aiden Bradley Research Analyst +61 8 9268 2876
Oliver Stevens Research Analyst +61 8 9268 2879
Michael Scantlebury Junior Analyst +61 8 9268 2837
Janine Bell Research Assistant +61 8 9268 2831
Corporate Finance Dale Bryan Director & Head of
Corp Fin.
+61 8 9268 2829
Richard Simpson Director +61 8 9268 2824
Ben Crossing Director +61 8 9268 3047
Ben Wale Associate Director +61 8 9268 3055
Stephen Kite Associate Director +61 8 9268 3050
Scott Weir Associate Director +61 8 9268 2821
Scott Stephens Associate Director +61 8 9268 2819
Rhys Simpson Manager +61 8 9268 2851
Registered Office
Level 6, 141 St Georges TcePostal Address:
PerthWA 6000 GPO Box 2777
Australia Perth WA 6001
PH:+61 8 9268 2888 FX: +61 8 9268 2800
www.hartleys.com.au [email protected]
Note: personal email addresses of company employees are
structured in the following
manner:[email protected]
Hartleys Recommendation Categories
Buy Share price appreciation anticipated.
Accumulate Share price appreciation anticipated but the risk/reward is
not as attractive as a “Buy”. Alternatively, for the share
price to rise it may be contingent on the outcome of an
uncertain or distant event. Analyst will often indicate a
price level at which it may become a “Buy”.
Neutral Take no action. Upside & downside risk/reward is evenly
balanced.
Reduce /
Take profits
It is anticipated to be unlikely that there will be gains over
the investment time horizon but there is a possibility of
some price weakness over that period.
Sell Significant price depreciation anticipated.
No Rating No recommendation.
Speculative
Buy
Share price could be volatile. While it is anticipated that,
on a risk/reward basis, an investment is attractive, there
is at least one identifiable risk that has a meaningful
possibility of occurring, which, if it did occur, could lead to
significant share price reduction. Consequently, the
investment is considered high risk.
Institutional Sales Carrick Ryan +61 8 9268 2864
Justin Stewart +61 8 9268 3062
Simon van den Berg +61 8 9268 2867
Chris Chong +61 8 9268 2817
Digby Gilmour +61 8 9268 2814
Veronika Tkacova +61 8 9268 3053
Wealth Management Nicola Bond +61 8 9268 2840
Bradley Booth +61 8 9268 2873
Adrian Brant +61 8 9268 3065
Nathan Bray +61 8 9268 2874
Sven Burrell +61 8 9268 2847
Simon Casey +61 8 9268 2875
Tony Chien +61 8 9268 2850
Tim Cottee +61 8 9268 3064
David Cross +61 8 9268 2860
Nicholas Draper +61 8 9268 2883
John Featherby +61 8 9268 2811
Ben Fleay +61 8 9268 2844
James Gatti +61 8 9268 3025
John Goodlad +61 8 9268 2890
Andrew Gribble +61 8 9268 2842
David Hainsworth +61 8 9268 3040
Murray Jacob +61 8 9268 2892
Gavin Lehmann +61 8 9268 2895
Shane Lehmann +61 8 9268 2897
Steven Loxley +61 8 9268 2857
Andrew Macnaughtan +61 8 9268 2898
Scott Metcalf +61 8 9268 2807
David Michael +61 8 9268 2835
Jamie Moullin +61 8 9268 2856
Chris Munro +61 8 9268 2858
Michael Munro +61 8 9268 2820
Ian Parker +61 8 9268 2810
Matthew Parker +61 8 9268 2826
Charlie Ransom
(CEO)
+61 8 9268 2868
Mark Sandford +61 8 9268 3066
David Smyth +61 8 9268 2839
Greg Soudure +61 8 9268 2834
Sonya Soudure +61 8 9268 2865
Dirk Vanderstruyf +61 8 9268 2855
Samuel Williams +61 8 9268 3041
Jayme Walsh +61 8 9268 2828
Disclaimer/Disclosure
The author of this publication, Hartleys Limited ABN 33 104 195 057 (“Hartleys”), its Directors and their Associates from time to time may hold
shares in the security/securities mentioned in this Research document and therefore may benefit from any increase in the price of those securities.
Hartleys and its Advisers may earn brokerage, fees, commissions, other benefits or advantages as a result of a transaction arising from any advice
mentioned in publications to clients.
Hartleys has provided corporate advice within the past 12 months and continues to provide corporate advice to Buru Energy Limited, for which it
has earned fees and continues to earn fees.
Any financial product advice contained in this document is unsolicited general information only. Do not act on this advice without first consulting
your investment adviser to determine whether the advice is appropriate for your investment objectives, financial situation and particular needs.
Hartleys believes that any information or advice (including any financial product advice) contained in this document is accurate when issued.
Hartleys however, does not warrant its accuracy or reliability. Hartleys, its officers, agents and employees exclude all liability whatsoever, in
negligence or otherwise, for any loss or damage relating to this document to the full extent permitted by law.