burraga copper project - paterson resources
TRANSCRIPT

Burraga Exploration Pty Ltd
11
Burraga Copper Project Prefeasibility Study
Paul Pyke

2
Executive Summary
Introduction Burraga Exploration Pty Ltd (BCPL) has Exploration Licence (EL) 6463 in NSW, which contains the old Burraga copper mine. A tailings dump occurs on the property below the old treatment works, along with two slag dumps where ore smelting operations occurred. This scoping study assesses the potential of reprocessing both the tailings and the slag from these dumps to produce a copper concentrate for sale. Additionally, mining and processing of a copper ore from a small open-cut mine at Burraga will be considered in this study. For the purposes of the study the quantities and grades of each of the feed sources used are shown in Table 1.
Material Feed Quantity (tonnes) Grade (% Copper) Tailings 234,000 1.20 Slag 140,000 0.90 Ore 1,000,000 1.00 Total 1,374,000 1.01
Table 1 Plant Feed quantity and Copper Grade
The Burraga project area is situated immediately to the east and south-east of the township of Burraga, NSW, approximately 68 kilometres by road south of Bathurst. Oberon, the nearest large regional town, is 49 kilometres by road to the north-east.
History The Burraga copper mine operated from 1878 and was owned by various companies until its closure in 1961 and was formerly known as the Thompsons Creek mine, the Lloyd copper mine and the Excelsior copper mine. The main period of production was during ownership by the Lloyd Copper Mining Company from 1900 to 1918.
Historic mining activity at Burraga produced approximately 18,000 tonnes of copper metal, with silver and possibly gold credits and was the biggest copper mine in NSW in its day. The historical copper mining at Burraga, on the Lloyd’s underground mine yielded over half a million tonnes with a high average recovered grade of 3.6% Cu per tonne. Periods of higher grade mining of over 10% occurred.
The tailings dump is situated on the property below the old treatment works. The gravity separation process, using jigs and vibrating tables, employed in this plant for ore treatment were quite inefficient and resulted in losses to the tailings of at least 1 percent copper. Two slag dumps also exist at the site as a result of the smelting operations conducted to recover the copper. The smaller and older slag dump was formed prior to Lloyd’s taking ownership of the mine in 1900 and is situated at the north end of the project site. The second, and larger slag dump, was from the Lloyd period and is situated just to the north of the tailings dump.

3
Site Access The Burraga project is located immediately to the east and south-east of the township of Burraga, NSW. The area is accessed by the main Oberon-Burraga road, which runs just to the north of the project area, then a series of rural connecting dirt roads which pass through the project. The dirt roads are of good quality because they are used by the logging trucks when harvesting the pine plantations.
Operating Approvals A mining lease will be required from the State Government before the project can commence. The mining lease cannot be granted unless appropriate development consent under the “Environmental Planning and Assessment Act 1979” is in force in respect of the land.
The available land tenure maps show there is a small block of crown land within the project area. If part of the mining lease includes crown land then the native title provisions will be activated and therefore ownership of this land requires clarification.
The process for regulating development through the development application and development consent process comes under Part 4 of the EPA Act.
This project would be a Part 4 development proposal because it does not meet any of the criteria to be classified as a Part 3A project and therefore development approval comes under the Local Government Act 1993.
Burraga is in the Oberon Council and therefore the development application will be submitted to this local government authority. The Development Application (DA) must be accompanied by
1. An Environment Impact Statement (EIS), and 2. If on land that is part of a critical habitat a Species Impact Statement (SIS) in
accordance with Division 2 of Part 6 of the “Threatened Species Conservation Act 1995.”
Schedule 2 of the EPA Regulations 2000 set out the matters which an EIS must address. This includes any guidelines issued by the Director-General of Planning, a description of the measures proposed to mitigate the effect on the environment, and a justification for the project which addresses the principles of ecologically sustainable development.
It has been assumed that no SIS will be required for this project because historical mining, with subsequent clearing of the native timber for fuel and mine support, and more recent pine plantation forestry on the cleared land has resulted in significant change to the local environment, therefore eliminating it as a critical habitat.
Table 2 details the estimated time for each stage of the approval process.

4
Approval Time Estimate (Months) Environmental Impact Statement 5-7 Development Approval 6-8 Mining Lease 11-15 (Total of Above)
Table 2 Estimated Approval Times
Tailings and Slag Mining Tailings and slag will be mined by excavator and road trucks for haulage to the plant site. Both will be campaigned at regular intervals to ensure an adequate supply of plant feed is stockpiled at the plant. A dozer may be required for pushing tailings to the loading point.
Tailings and Slag Processing Test work on a sample of tailings in 1969 using flotation was successful in recovering up to 83% of the copper into a rougher concentrate. The tailings material contains predominantly fine grained chalcopyrite and some malachite as the principle valuable mineral. No previous test work has been completed on slag samples. Assays of tailings samples have indicated an average grade of 1.2% copper whereas the few assays on the Lloyd slag dump have consistently returned 0.9% copper.
Two auger samples of tailings, Met 1 and Met 2, were collected in May 2011 for a metallurgical test program to be completed by Amdel to further assess the recovery of copper minerals by flotation and to generate sufficient information to complete a feasibility design. A third sample collected from the surface of the main slag heap will also be tested. By using different reagents and CPS (controlled potential sulphidisation) an improved performance in the copper recoveries and grade will be produced than that achieved in 1969.
The size analysis for samples Met 1 and Met 2 were both very coarse and reflect the processing method of that period. The Ball Mill Work Index (BMWI) for Met 1 and Met 2 samples was determined at 16.3 and 17.2 kWh/t, respectively. The BMWI for the slag sample was 26.9 kWh/t.
The average rougher flotation copper recovery for the Met 1 and 2 tailings samples at 76.9% was less than the 1969 result possibly due to the increased oxidation that has occurred in the intervening years. The Met 3 slag sample returned a rougher copper recovery of 70.6%. Locked cycle cleaner flotation tests were conducted for each of the three samples at the optimised conditions with the results given in Table 3. Apart from gold recovery for the Met 3 sample, silver and gold recoveries were at the same level as copper.

5
Met 1 and 2 Average
Metal Head Tail Concentrate Recovery %
Cu
Ag
Au
Yield
1.18%
8.5 ppm
0.16 ppm
0.40 %
2.5 ppm
0.04 ppm
24.54 %
177 ppm
4.58 ppm
2.85 %
67.3
71.9
74.2
Met 3
Cu
Ag
Au
Yield
0.90 %
6 ppm
0.14 ppm
0.42 %
2 ppm
0.12 ppm
21.27 %
163 ppm
4.50 ppm
2.1 %
54.4
67.5
14.7
Table 4 Locked Cycle Metal Recoveries
Based on the metallurgical information available from this test program a conceptual process circuit has been developed to process both the tailings and slag to produce copper concentrate for sale. The initial circuit will process tailings only and includes a ball mill for grinding the tailings to liberate the copper minerals, followed by rougher and cleaner flotation and dewatering of the flotation concentrate.
At the completion of tailings processing the plant will be upgraded to include primary crushing and SAG milling so that the slag material can be processed.
Copper concentrate will be trucked to a nearby rail siding and then transported to a port for shipment to the smelters in Asia.
Capital and operating costs have been developed for the process circuits and infrastructure as described above.
Figure 1 is a conceptual site plan for the reprocessing of tailings and slag.

6
Figure 1 Conceptual Site Plan

7
Ore Mining and Processing Mining of ore will be by conventional open cut methods using drill and blast, loading by excavators and off highway haul trucks. A maximum pit depth of 150 metres and an ore to waste ratio of 1:2 have been used as the basic assumptions to determine mining costs.
The process circuit for treating mined ore will be the same as for processing the slag dumps which require primary crushing prior to milling to feed the flotation circuit. Additional milling capacity to that used for treating the tailings will be required, which will be achieved by the inclusion of a SAG mill into the grinding circuit.
Project Cost Estimates Two throughput options have been considered for processing of the tailings and slag at the Burraga Mine, viz.
1. 150,000 tonnes per annum, and 2. 300,000 tonnes per annum.
Capital and operating costs along with projected cashflow estimates have been made for both scenarios.
Capital Cost Capital cost estimates for the two throughput scenarios are summarised in Table 4.
Item 150k tpa ($) 300k tpa ($) Metallurgical Tests 53,000 53,000 Permitting 420,000 420,000 Plant and Infrastructure 8,014,000 9,856,000 Deferred Capital
- Plant Upgrade - TSF stages
2,869,000 1,000,000
2,869,000 1,000,000
Residual Capital Return -1,088,000 -1,273,000 Total 11,268,000 12,925,000
Table 4 Capital Expenditure Summary
Operating Cost The operating costs are summarised in Table 5 for the various operating scenarios and the two throughput rates considered.

8
Item Tailings ($/t) Slag ($/t) Ore ($/t) 150k 300k 150k 300k 150k 300k
Mining 3.00 3.00 3.00 3.00 12.00 9.00 Processing 12.00 6.95 16.00 10.30 16.00 10.30 G & A 1.80 1.00 1.80 1.00 1.80 1.00 Concentrate Charges 5.65 5.65 5.65 5.65 6.20 6.20 Reclamation 0.10 0.10 0.10 0.10 0.10 0.10 Total 22.55 16.30 27.05 20.05 36.10 26.60
Table 5 Operating Cost Summary
Project Cashflow A cashflow model was developed for the two throughput options considered using a copper price of $10,000 per tonne. Silver and gold credits have also been included. The option of toll treating the tailings and slag at the proposed Sultan Corporation Limited’s Peelwood plant was also considered.
Project construction capital cost estimates including pre-production costs, ongoing capital costs and capital depreciation have been included in the projections of Project cash flow. Table 6 below shows the results of this analysis. No allowance for inflation has been included.
Item 150k tpa 300k tpa Toll treatment T & S1 Total2 T & S Total T & S Total
Life of Mine (Yrs)
2.0
8.7
1.0
4.4
2.7
11.6
Total Mill Throughput (‘000t) Total Copper Produced (t) Total Silver Produced (oz) Total Gold Produced (oz)
374
2,575 65,679
796
1,374
10,900 293,185
4,275
374
2,575 65,679
796
1,374
10,900 293,185
4,275
374
2,575 65,679
796
1,374
10,900 293,185
4,275
Initial Project Capital Cost ($M) Deferred Capital Cost ($M) Life of Mine Operating Cost ($M)
8.5 1.7 9.0
8.5 3.9
45.1
10.3 1.7 6.7
10.3 3.9
33.3
0.5 0.0
18.0
0.5 0.0
71.8
NPV ($M)
- 0% Discount Rate - 10 % “ “
8.1 6.5
67.9 38.3
8.5 7.1
76.7 53.2
10.4 8.2
51.9 25.2
1 = Tailings and slag reprocessing 2 = Tailings, slag and ore processing
Table 6 Financial Summary

9
Project Schedule The project schedule requires 24 months before production commences for each throughput scenario. Over half of this time, 13 months, will be required to obtain the necessary approvals before site construction works can commence. To minimise the construction time it is proposed to undertake design of the plant and infrastructure during the permitting period. The time to complete operations depends on the production rate chosen.
Conclusions and Recommendations The following conclusions and recommendations have been drawn from this study.
1. The study has shown that the economics of reprocessing the tailings are positive for the three scenarios considered.
2. Including 1.0 million tonne of ore @1.0% copper into each scenario considerably enhances the economics of the project.
3. If processing tailings and slag only is considered then toll treating at the nearby Peelwood plant is the best economic option, however the delay in this occurring probably excludes this option.
4. The 300k tpa scenario is the preferred option if all processing is to occur at the Burraga site.
5. The economics are sufficiently favourable to progress the 300k tpa option to feasibility study and the process of generating the necessary information for the study should commence.
6. Additional metallurgical test work is required on samples of tailings, slag and ore to generate information for a more detailed study.
Due to the length of the approval process it is recommended that this commences with the feasibility study by undertaking the EIS when the basics of the project has been determined.

10
Contents Executive Summary .................................................................................................................... 2
Introduction............................................................................................................................ 2
History .................................................................................................................................... 2
Site Access .............................................................................................................................. 3
Operating Approvals .............................................................................................................. 3
Tailings and Slag Mining ......................................................................................................... 4
Tailings and Slag Processing ................................................................................................... 4
Ore Mining and Processing .................................................................................................... 7
Project Cost Estimates ............................................................................................................ 7
Capital Cost ......................................................................................................................... 7
Operating Cost .................................................................................................................... 7
Project Cashflow ..................................................................................................................... 8
Project Schedule ..................................................................................................................... 9
Conclusions and Recommendations ...................................................................................... 9
1 Introduction ...................................................................................................................... 13
1.1 Location and Setting .................................................................................................. 13
1.2 Project History ........................................................................................................... 14
1.3 Site Access ................................................................................................................. 16
2 Operating Approvals ......................................................................................................... 16
2.1 Approval Process ....................................................................................................... 16
2.2 Development Approval ............................................................................................. 17
2.3 Environmental Impact Statement ............................................................................. 18
2.4 Species Impact Statement ......................................................................................... 18
2.4.1 Biodiversity Certification ......................................................................................... 18
2.4.2 Biobanking Statements ............................................................................................ 19
2.4.3 Public Notification Requirements ............................................................................ 19
2.4.4 Concurrence of Director-General or Environment Minister ................................... 19
2.5 Approval Timeline ..................................................................................................... 19
3 Resource Estimate ............................................................................................................ 20
3.1 Geomodelling Resource Estimate ............................................................................. 20
3.1.1 Tailings ............................................................................................................... 20
11
3.1.2 Slag ..................................................................................................................... 24
3.2 Estimate from Historical Production ......................................................................... 25
3.2 In Ground Ore ............................................................................................................ 26
4 Tailings and Slag Mining and Processing .......................................................................... 26
4.1 Mining ....................................................................................................................... 26
4.2 Metallurgy ................................................................................................................. 27
4.2.1 Tailings ............................................................................................................... 27
4.2.2 Slag ..................................................................................................................... 34
4.2.3 Run of Mine Ore ................................................................................................. 37
4.3 Process Design ........................................................................................................... 37
4.3.1 Throughput Options ........................................................................................... 37
4.3.2 Conceptual Flow Sheet ...................................................................................... 38
4.3.3 Design Criteria .................................................................................................... 41
4.4 Process Description ................................................................................................... 42
4.4.1 Primary Crushing ................................................................................................ 43
4.4.2 Crushed Ore and Tailings Feed .......................................................................... 43
4.4.3 Grinding .............................................................................................................. 43
4.4.4 Flotation ............................................................................................................. 44
4.4.5 Concentrate Thickening, Filtering and Handling ............................................... 44
4.4.6 Process Water .................................................................................................... 44
4.4.7 Reagents ............................................................................................................. 45
4.4.8 Utilities ............................................................................................................... 45
4.5 Process Infrastructure ............................................................................................... 45
4.5.1 Tailings Storage Facility ...................................................................................... 45
4.5.2 Raw Water Supply .............................................................................................. 45
4.5.3 Power Supply ..................................................................................................... 46
4.5.4 Site Access Roads ............................................................................................... 46
5 Ore Mining and Processing ............................................................................................... 49
5.1 Mining ....................................................................................................................... 49
5.2 Processing .................................................................................................................. 49
6 Capital Cost Estimate ........................................................................................................ 49
6.1 Metallurgical Testing ................................................................................................. 49
12
6.2 Permitting Cost .......................................................................................................... 49
6.3 Process Plant and Infrastructure Cost ....................................................................... 50
6.4 Deferred Capital Cost ................................................................................................ 51
6.5 Residual Capital Return ............................................................................................. 51
6.6 Closure Reclamation and Rehabilitation Cost ........................................................... 51
7 Operating Cost Estimate ................................................................................................... 51
7.1 Mining Operating Cost .............................................................................................. 52
7.2 Process Operating Cost ............................................................................................. 52
7.3 General and Administration Cost .............................................................................. 53
7.4 Concentrate Charges ................................................................................................. 53
7.5 Reclamation ............................................................................................................... 53
8 Project Cashflow ............................................................................................................... 53
8.1 300k Tonnes per Annum ........................................................................................... 53
8.2 150k Tonnes per Annum ........................................................................................... 55
9 Other Options ................................................................................................................... 56
9.1 Toll Treatment at a Nearby Plant .............................................................................. 56
9.2 Toll Treatment of Other Ores .................................................................................... 58
10 Project Schedule ........................................................................................................... 59
11 Economic Comparison .................................................................................................. 61
12 Conclusions and Recommendations ............................................................................. 62
13 References .................................................................................................................... 62

13
1 Introduction Burraga Exploration Pty Ltd has Exploration Licence (EL) 6463 in NSW, which contains the old Burraga copper mine. A tailings dump occurs on the property below the old treatment works, along with two slag dumps where ore smelting operations occurred. This prefeasibilty study assesses the potential of reprocessing both the tailings and the slag from these dumps to produce a copper concentrate for sale. Additionally, mining and processing of a copper ore from a small open-cut mine at Burraga will be considered in this study.
1.1 Location and Setting The Burraga project area is situated immediately to the east and south-east of the township of Burraga, NSW, approximately 68 kilometres by road south of Bathurst. Oberon, the nearest large regional town, is 49 kilometres by road to the north-east.
The area is primarily utilised for forestry with stands of old and re-growth native vegetation, and pine plantation in most of the areas that were cleared of the original worthwhile timber for fuel during the operating years of the mine.
Figure 1.1 details the location of the Burraga project within EL 6463 whereas Figure 1.2 depicts an aerial view of the site showing the tailings dump and one of the slag dumps surrounded by predominantly pine plantation.
Figure 1.1 Burraga Location

14
Figure 1.2 An Ariel View of the Project Site
1.2 Project History The Burraga copper mine is adjacent to the village of Burraga, NSW. The mine was first opened in 1878 and was mined by various owners until it closed in 1961. Historic mining activity at Burraga produced approximately 18,000 tonnes of copper metal, with silver and possibly gold credits and was the biggest copper mine in NSW in its day. The main production period was when the mine was owned by the Lloyd Copper Mining Company between 1900 and 1918. The historical copper mining at Burraga, from the underground mine yielded over half a million tonnes with a high average recovered grade of 3.6% Cu per tonne. Periods of higher grade mining of over 10% copper occurred.
The tailings dump is situated on the property below the old treatment works, which was established in 1900. The gravity separation process, using jigs and vibrating tables, employed in this plant for ore treatment were quite inefficient and resulted in losses to the tailings of at least 1 percent copper. Subsequent assays of the dump material have indicated grades from 0.9 percent to 1.3 percent copper with estimates of the quantity of tailings varying. The estimate of the Lloyds Mine tailings resource is significantly less than historical production (470,000t), but comparable to historically reported tailings tonnages (300,000 tons). The difference is because all the ore was direct smelted prior to construction of the
Slag
Tailings

15
treatment plant in 1900 and after hand picking high grade lump ore from the treatment plant feed for direct smelting was practised.
Figure 1.3 A Historic Photograph of the Lloyds Copper Mine, Burraga NSW.
Two slag dumps also exist at the site as a result of the smelting operations conducted to recover the copper. The smaller and older slag dump was formed prior to Lloyd’s taking ownership of the mine in 1900 and is situated at the north end of the project site. In 1882 it was reported that five reverberatory furnaces were operating at this location. The second, and larger slag dump, was from the from the Lloyd period and is situated just to the north of the tailings dump. Prior to smelting in the reverberatory furnace the hand-picked lump ore and concentrate from the treatment plant were calcined to remove some of the sulphur. The reverberatory furnace had a hearth 52’ x 20’ and was the largest in the world at that time. Copper matte was despatched to Lithgow for refining. The locations of the tailings and slag dumps are shown in Figure 4.5.
Figure 1.4 Photograph of tailings dump potentially containing 3,600t of Copper

16
Figure 1.5 Photograph of the Lloyd’s Slag Dump
1.3 Site Access The Burraga project is located immediately to the east and south-east of the township of Burraga, NSW. The area is accessed by the main Oberon-Burraga road, which runs just to the north of the project area, then a series of rural connecting dirt roads which pass through the project. The dirt roads are of good quality because they are used by the logging trucks when harvesting the pine plantations.
2 Operating Approvals
2.1 Approval Process A mining lease will be required from the State Government before the project can commence. The mining lease cannot be granted unless appropriate development consent under the “Environmental Planning and Assessment Act 1979” is in force in respect of the land.
The available land tenure maps show there is a small block of crown land within the project area. If part of the mining lease includes crown land then the native title provisions will be activated and therefore ownership of this land requires clarification.

17
2.2 Development Approval
There are three main elements to the legislative scheme which regulates planning and development in NSW.
These are:
• the Environmental Planning and Assessment Act 1979, which sets out the major concepts and principles, including Part 4 which deals with development applications,
• environmental planning instruments, ie LEPs and SEPPs, which set out when development consent is required, and which often nominate the consent authority for specific types of development, and
• the Environment Planning and Assessment Regulation 2000, which contains many of the details for the various processes set out under the Act.
Under this legislative scheme, development proposals can fall into one of three categories:
• Part 3A projects: major projects of State or regional significance. • Part 4 development proposals: these are dealt with through the development
application process. • Part 5 development proposals: covers proposals which do not fall under either Part
3A or Part 4. These are usually infrastructure projects.
The process for regulating development through the development application and development consent process comes under Part 4 of the EPA Act.
Development for major government projects, such as for infrastructure, and State significant development (Part 3A projects), is also regulated under the EPA Act.
The Land and Environment Court hears appeals against development consents and hears enforcement cases under the EPA Act.
The Minister for Planning is ultimately responsible for the EPA. The Act is administered by the NSW Department of Planning.
In many cases, however, the EPA Act delegates responsibility to local councils to make decisions under the EPA Act regarding individual developments.
This project would be a Part 4 development proposal because it does not meet any of the criteria to be classified as a Part 3A project and therefore development approval comes under the Local Government Act 1993.
Burraga is in the Oberon Council and therefore the development application will be submitted to this local government authority. The Development Application (DA) must be accompanied by

18
3. An Environment Impact Statement (EIS), and 4. If on land that is part of a critical habitat a Species Impact Statement (SIS) in
accordance with Division 2 of Part 6 of the “Threatened Species Conservation Act 1995.”
2.3 Environmental Impact Statement The EIS must accompany the DA. The EIS can be prepared by the applicant, but it is usually a very complex document which is prepared by a consultant on behalf of the applicant. An EIS should give a detailed analysis of all potential areas of concern in relation to the development. It should be written in easy to understand language and contain material which would alert lay people and specialists to the problems inherent in carrying out the activity.
Schedule 2 of the EPA Regulations 2000 set out the matters which an EIS must address. This includes any guidelines issued by the Director-General of Planning, a description of the measures proposed to mitigate the effect on the environment, and a justification for the project which addresses the principles of ecologically sustainable development.
2.4 Species Impact Statement
If a development is on land containing critical habitat or is likely to significantly affect threatened species, populations or ecological communities, then the development application must be accompanied by a species impact statement.
In deciding whether there is likely to be a significant impact on threatened species, a consent authority must apply the "7-part test" set out in section 5A of the EPA Act (formerly the "8-part test"). This includes factors such as whether the action is likely to place a viable local population of the species at risk of extinction, and whether the action is likely to result in the fragmentation or isolation of habitat.
Similarly, an SIS must be prepared if there is likely to be a significant impact on threatened fish or marine vegetation protected under the Fisheries Management Act 1994.
2.4.1 Biodiversity Certification
In October 2005, new provisions came into force under the TSC Act (Div 5, s 126G - 126N) allowing the Environment Minister to confer biodiversity certification on environmental planning.
There are two types of biodiversity certification:
• Certification of EPIs (LEPs and SEPPs) (s 126G - N)(described below), and • Certification of the Native Vegetation Reform Package (s 126B - F) (Clearing
Vegetation, section 2.4.4).

19
The effect of biodiversity certification is that developments will not need to have a species impact statement. Under the biodiversity certification provisions, any development for which development consent is required (under EPA Act Part 4), or a Part 5 activity, is automatically assumed not to have a significant impact on threatened species, populations or ecological communities, thereby avoiding the need for a species impact statement (s 126I(1), (2)).
2.4.2 Biobanking Statements
In 2008, the NSW Government introduced a new scheme to protect threatened species known as the Biobanking Scheme. The Scheme was created by inserting a new Part 7A (Biodiversity banking) into the Threatened Species Conservation Act 1995 which came into force on 4 December 2006.
However, in practice, the Biobanking Scheme did not commence operation until 11 July 2008 when the supporting regulations and methodologies were gazetted ( TSC Act, s 127B(9)).
Participation in the Scheme is voluntary. A developer who obtains a biobanking statement will not need to carry out a species impact statement, as the development will then be "deemed" not to significantly affect threatened species ( TSC Act, s 127ZO, 127ZP).
2.4.3 Public Notification Requirements
A development application which is accompanied by a species impact statement is declared to be "advertised development" and must therefore be advertised in accordance with the requirements for advertised development.
2.4.4 Concurrence of Director-General or Environment Minister
DA’s which are likely to significantly affect threatened species cannot be approved without the concurrence (agreement) of the Director-General of National Parks and Wildlife, or in some cases, the Environment Minister (unless a biobanking statement has been issued).
In deciding whether or not to grant concurrence, the Director-General or Environment Minister must take a range of factors into account, including any species impact statement, any public submissions, and the principles of ecologically sustainable development.
The Director-General or Environment Minister has the power to either approve or refuse the DA, or to impose additional conditions on the development concerning the protection of threatened species.
2.5 Approval Timeline Table 2.1 details the estimated time for each stage of the approval process. It has been assumed that no SIS will be required for this project because historical mining, with subsequent clearing of the native timber for fuel and mine support, and more recent pine

20
plantation forestry on the cleared land has resulted in significant change to the local environment, therefore eliminating it as a critical habitat.
Approval Time Estimate (Months) Environmental Impact Statement 5-7 Development Approval 6-8 Mining Lease 11-15 (Total of Above)
Table 2.1 Estimated Approval Times
3 Resource Estimate
3.1 Geomodelling Resource Estimate Geomodelling (GML)1 has undertaken an assessment of the geological setting, exploration potential and resources within EL 6463. Details from this report are included in the subsequent sections.
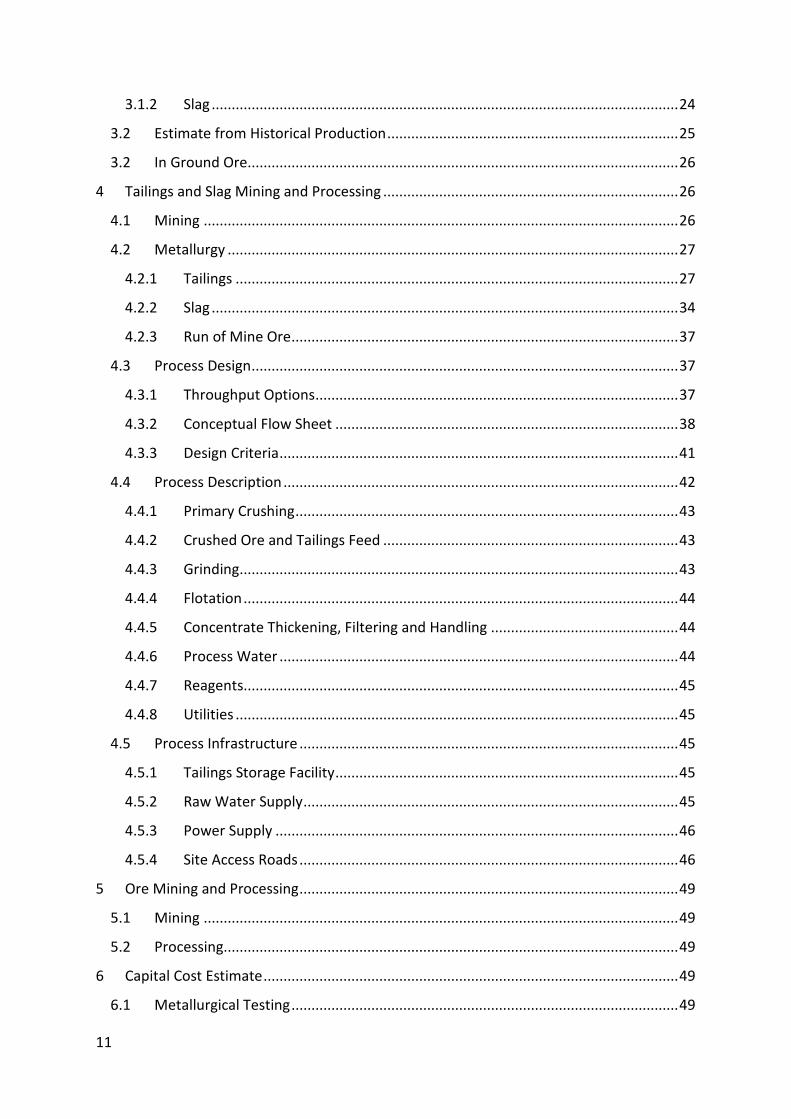
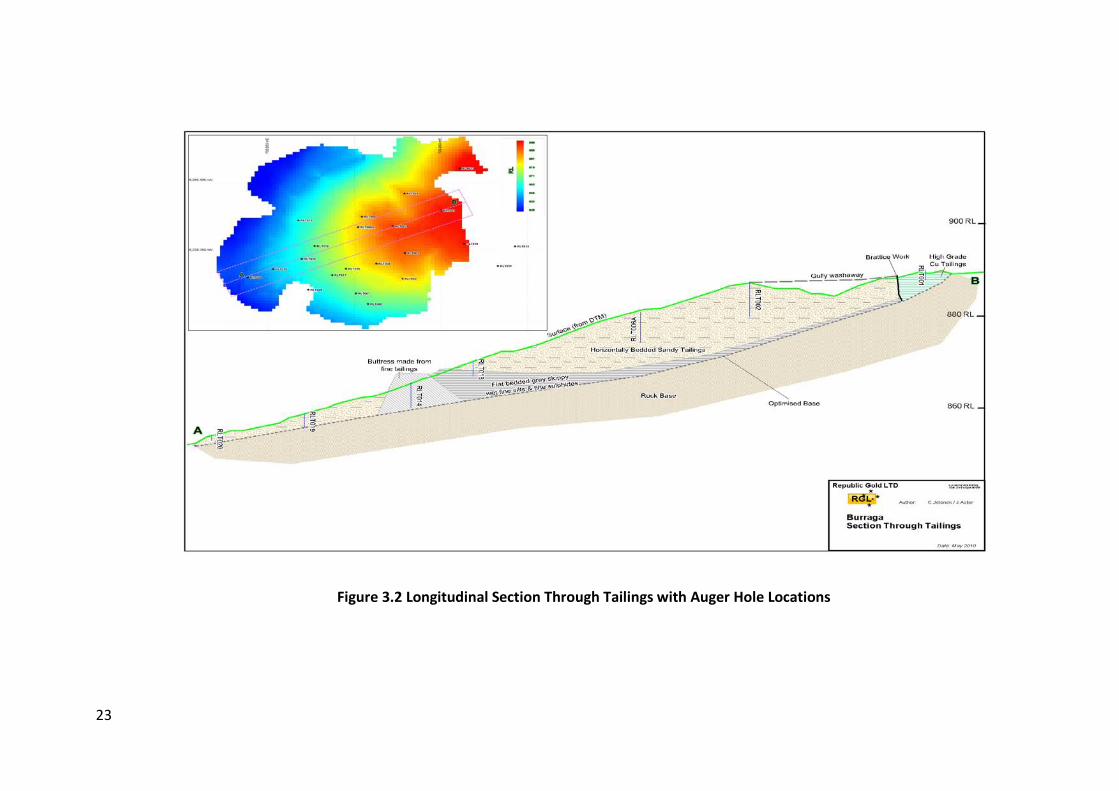
3.1.1 Tailings In May 2010 Republic Gold Limited completed a sampling program of the tailings sands using an auger with samples collected for analysis at one metre intervals. This sampling is considered the most comprehensive program completed so far with the results shown in Tables 3.1 and 3.2, and Figures 3.1 and 3.2.

21
Auger Hole ID East84 North84 RL
Depth Drilled (m)
Intervals Sampled
No. of Samples Comment
RLT-01 733837.1066 6239193.982 889.869 1.7 0 0 Not sampled. Same depth recovered as previous by RME. Samples already assayed to that depth
RLT-02 733809.2399 6239182.582 887.294 7.5 2 - 7.5 5 Hole re-entry @ 2m. Hole already assayed to 2m. No basement reached
RLT-03 733816.1822 6239163.092 885.889 6.5 2 - 6.5 5 Hole re-entry @ 2m. Hole already assayed to 2m. No basement reached
RLT-04 733799.6676 6239155.462 881.13 6.5 0 - 6.5 5 Hole re-entry @ 2m. Hole already assayed to 2m. No basement reached
RLT-05 733814.8582 6239144.437 880.316 6.0 2 - 6 4 Hole re-entry @ 2m. Hole already assayed to 2m. No basement reached
RLT-06A 733789.1413 6239181.928 880.61 6.5 0 - 6.5 6 New hole.
RLT-016 733782.0948 6239151.72 874.498 6.5 0 - 6.5 6 New hole. No basement reached
RLT-017 733774.1747 6239146.967 870.514 4.0 0 - 4 4 New Hole. Slurry and clays at 4m.
RLT-018 733763.9691 6239168.24 869.922 3.0 0 - 3 3 New Hole. Tailing sands to 2.5m. Clay from 2.5 down
RLT-014 733756.4812 6239158.846 865.398 5.3 2.5 - 5.3 3 Hole re-entry @ 2.5m. Clays at 5.3m
RLT-019 733739.9141 6239151.428 859.08 3.3 0 - 3.3 3 New hole. Basement/ pit wall reached at 3.3m.
RLT-020 733725.2104 6239145.397 854.127 1.1 0 - 1.1 1 New hole. Basement rock at 1.1m
RLT-021 733815.8971 6239206.389 883.206 7.4 0 - 7.4 7 New hole. No basement reached
Table 3.1 Burraga Mine Tailings Auger Hole Sample Locations

22
Figure 3.1 Cross Section Through Tailings with Auger Hole Locations
23
Figure 3.2 Longitudinal Section Through Tailings with Auger Hole Locations

24
Cu %
Au ppm
Ag ppm
As ppm
Pb ppm
Zn ppm
S %
1.33 0.30 10.25 80 455 1611 1.25
Table 3.2 Average Tailings Assays from May 2010 Auger Sampling
GML’s resource estimate for the tailings at Burraga, based on this data is shown in Table 3.3.
Lloyds Mine Tailings
Category Cutoff (Cu %)
tonnes Cu (%)
Au (g/t)
Ag (g/t)
Cu (t) Au (oz)
Ag (oz)
Indicated 0.0 125,000 1.2 0.3 10.0 1,500 1,200 40,100
Inferred 0.0 109,000 1.2 0.3 9.7 1,300 1,000 34,000
TOTAL 0.0 234,000 1.2 0.3 9.8 2,800 2,200 74,100
Table 3.3 Lloyds Mine Tailings Resources in EL6463.
The estimate of the Lloyds Mine tailings resource is significantly less than historical production (470,000t), but comparable to historically reported tailings tonnages (300,000 tons). ), The difference is probably because considerable amounts of the ore were direct smelted. The concentrator was not erected until 1900 when Lloyds purchased the mine.
The Lloyds Mine Tailings resource estimate is based on vertical auger holes drilled on a roughly 10m by 20m grid. Grades were interpolated into a block model by inverse distance squared weighting of assays composited to 2.0 m and constrained within the volume between the surveyed upper surface and an interpreted basement surface. Volumes were converted to tonnages using a density of 1.6 t/m3, which was assumed based on the density of a typical unconsolidated sand. All material below the end of the auger holes is classified as inferred as the depth to basement is poorly constrained in these areas.
3.1.2 Slag A large slag heap from this time period also remains on site. This material contains visible native copper. Limited sampling of the slag has returned copper grades between 0.5% Cu and 1.0% Cu range. The quantity of slag is unknown, but the heap covers an area approximately 100 m by 100 m. Sequential copper leach assays of six slag samples indicates that a significant proportion (more than 70%) of the copper in the samples is potentially

25
amenable to either acid or ferric leaching. A second smaller slag heap from earlier working’s, exists 400m further north and covers an area approximately 100m by 20m.
GML did not provide a resource estimate for the slag but Jackson2 estimated the total quantity of slag in both dumps to be 175,000 tonnes assuming an average depth of 5m and a bulk density of 2.5. For the purposes of this study a slag quantity of 140,000 tonnes has been used as per Table 3.3.
Burraga Slag Dumps Quantity (t) Cu (%) Au (g/t) Ag (g/t) Cu (t) Au (oz) Ag (oz)
140,000 0.90 0.12 4.6 1,260 540 20,705
Table 3.3 Burraga Mine Slag Quantity and Grade
3.2 Estimate from Historical Production The total recorded ore production at Burraga was 470,000 tonnes from which 19,443 tonnes of copper metal was produced, i.e. a recovered copper grade of 4.14%. Production records show that of the 470,000 tonnes of ore mined 300,000 tonnes was processed through the ore treatment plant. Therefore 470,000 - 300,000 = 170,000 tonne of ore was directly smelted. An estimate of the tailings quantity can be calculated based on the 300,000 tonnes of processed ore. If we assume a head grade of 4% copper and say 75% recovery and that the bulk of the copper is in chalcopyrite then this gives a weight yield of about 15% to concentrate. Therefore the 300,000 t of plant feed x 15% = 45,000 tonne of concentrate to the smelters and 300,000 - 45,000 = 255,000 t to tailings. This compares favourably to GML’s tailings resource of 234,000 t when considering that some erosion of the tailings has occurred. Considering the ore and concentrate smelted. Total feed to the smelters = 170,000 t of ore + 45,000 t of concentrate = 215,000 t. Slag mass = ore feed - Cu production - oxidation weight loss + any flux additives Assuming 10% weight loss and 5% flux additives Slag mass = 215,000 - 19,500 - (215,000 x 10%) + (215,000 x 5%) = 184,750 t This slag estimate compares favourably to the estimate derived at in section 3.1.2. When you consider that some of the slag has been removed for road use then reducing the slag quantity to 140,000 tonnes provides a conservative estimate.

26
3.2 In Ground Ore The Lloyds Mine area is prospective for low grade copper mineralisation between, and forming a halo to, the historically mined veins plus remnant vein material. Un-mined down plunge extensions of the vein system are likely to be at the higher end of the targeted grade range. Together, these form an exploration target which is in the order of 3Mt to 10Mt at grades of 0.5% Cu to 2.0% Cu plus credits.
To define a resource in this area would require drilling an initial 50m by 50m pattern of vertical drillholes. Should this programme prove successful, then further infill drilling to 25m by 25m is recommended.
For the purposes of this study it has been assumed that 1Mt at a grade of 1.0% copper will be mined.
4 Tailings and Slag Mining and Processing
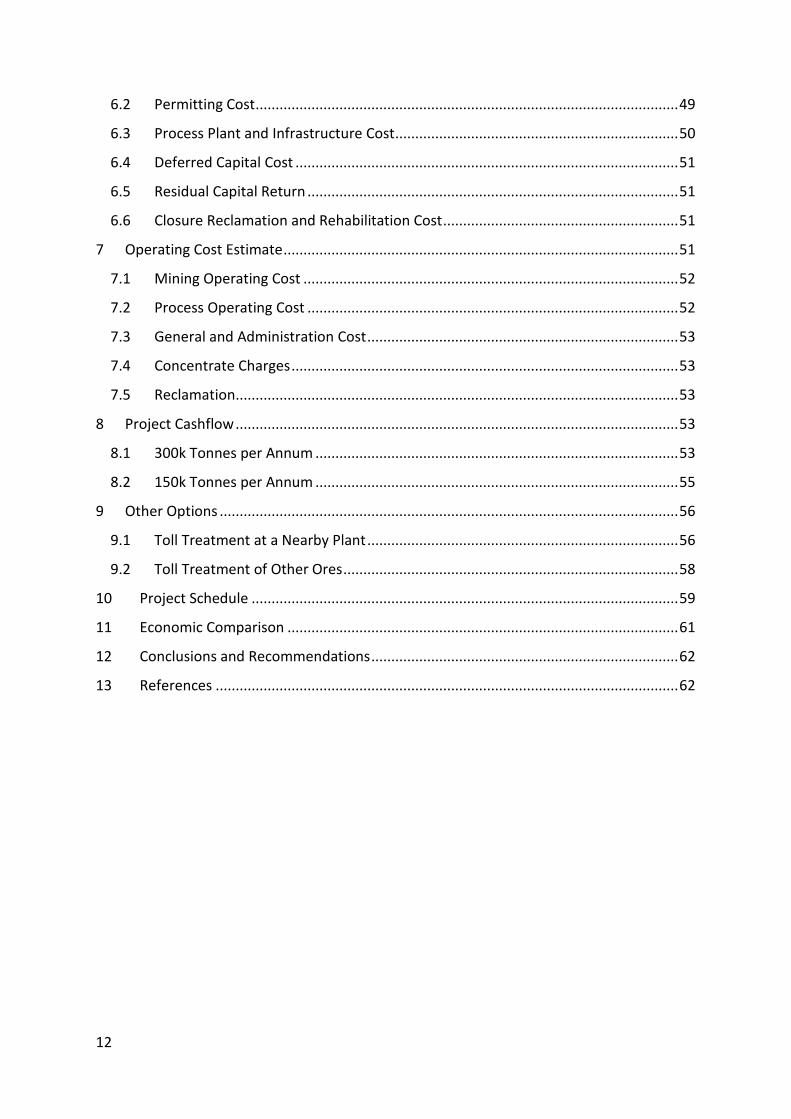
4.1 Mining Tailings and slag will be mined by excavator and road trucks for haulage to the plant site. Both will be campaigned at regular intervals to ensure an adequate supply of plant feed is stockpiled at the plant. A dozer may be required for pushing tailings to the loading point. Figure 4.1 shows the probable loading point for the tailings below the hill upon which they are situated.
27
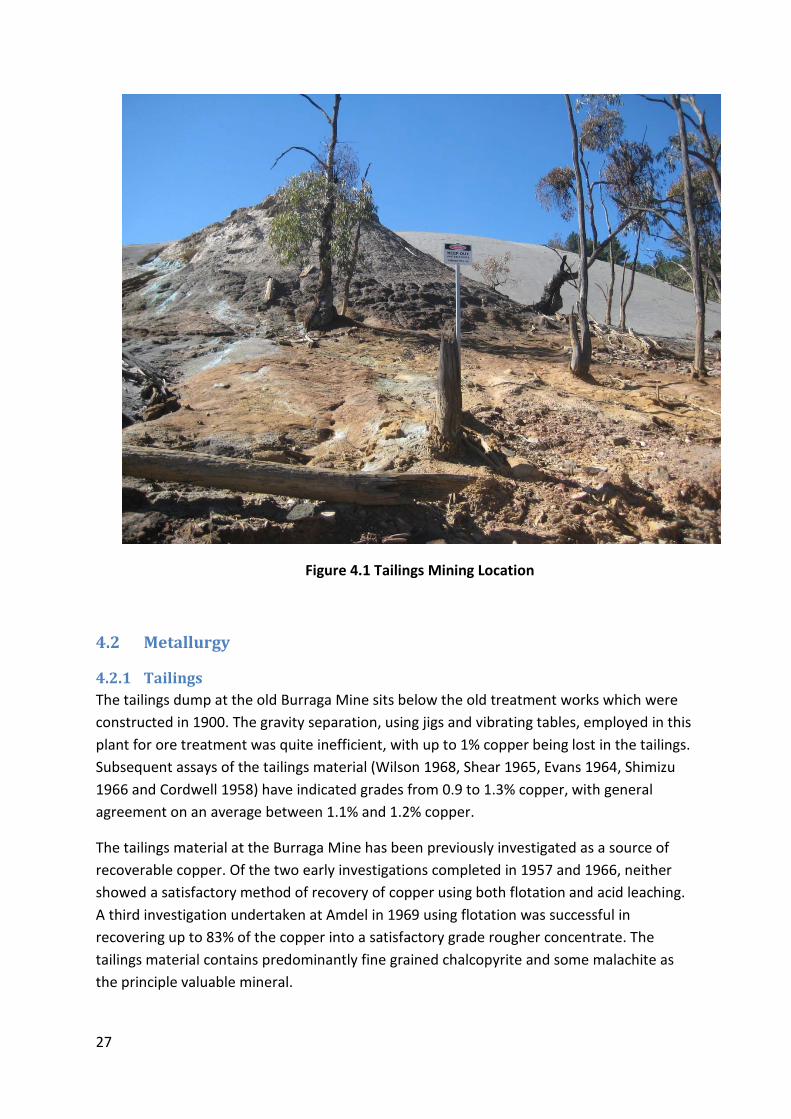
Figure 4.1 Tailings Mining Location
4.2 Metallurgy
4.2.1 Tailings The tailings dump at the old Burraga Mine sits below the old treatment works which were constructed in 1900. The gravity separation, using jigs and vibrating tables, employed in this plant for ore treatment was quite inefficient, with up to 1% copper being lost in the tailings. Subsequent assays of the tailings material (Wilson 1968, Shear 1965, Evans 1964, Shimizu 1966 and Cordwell 1958) have indicated grades from 0.9 to 1.3% copper, with general agreement on an average between 1.1% and 1.2% copper.
The tailings material at the Burraga Mine has been previously investigated as a source of recoverable copper. Of the two early investigations completed in 1957 and 1966, neither showed a satisfactory method of recovery of copper using both flotation and acid leaching. A third investigation undertaken at Amdel in 1969 using flotation was successful in recovering up to 83% of the copper into a satisfactory grade rougher concentrate. The tailings material contains predominantly fine grained chalcopyrite and some malachite as the principle valuable mineral.

28
Of the three reports on test programs completed on the Burraga Mine tailings only the last Amdel report is available.
1. R.J.T.C. Report of University of New South Wales, 15th December, 1966. 2. Woodcock, J., C.S.I.R.O. Ore Dressing Investigation Report No. 53C, 8th April, 1957. 3. Weir, Amdel Flotation Testing of Burraga Mine Dumps Report CME 2957-69, May,
1969.
The Amdel investigation into the recovery of copper minerals from the tailings has shown that a sulphide concentrate grade up to 25.6% copper and an oxide concentrate grade of up to 20.2% copper could be produced at a satisfactory recovery. The best total copper recovery obtained in rougher concentrates was 83.0%. Mineralogical examination of the tailings showed that liberation of the copper minerals is almost complete at 240 mesh (66 um) and consequently the tailings required fine grinding before beneficiation. The calculated head grades of the sample supplied varied between 1.05% and 1.19% compared with a stated value of 1.2% copper.
Two auger samples of tailings, Met 1 and Met 2, were collected in May 2011 for a metallurgical test program to be completed by Amdel to further assess the recovery of copper minerals by flotation and to generate sufficient information to complete a feasibility design. A third sample, Met 3, collected from the surface of the main slag heap will also be tested.
Amdel had previously completed a flotation testing program on a sample of the Burraga tailings in May 1969. These tests were done at a P80 of approximately 109um. Mineralogy on that sample indicated copper liberation (chalcopyrite and malachite) at 60 microns.
It is anticipated that by using different reagents and CPS (controlled potential sulphidisation) an improved performance in the copper recoveries and grade will be produced.
The samples will be treated in the following manner:-
1. Log and sort the samples on arrival to match with Burraga despatch. Dry in a low temperature oven overnight
2. The 2 tailings samples will be composited from 12 vertical intervals, these will be treated and assayed individually for Au, As, Bi, Cu,Pb, Zn,and Ag before combining.
3. Rotary split the samples to give 10kg for a standard Ball Mill Work index test and the balance split into 1000gram test charges for sizing and flotation tests.
4. Standard BMWI test (may need to change the closing screen size depending on the “feed sizing”).
5. Head assays and QXRD on each of the 3 samples. The head samples will be assayed for the full ICP-MET 1 suite and also Gold by FA1. All test products will be assayed for As, Bi, Cu, Pb, Zn and Ag, gold assays (MET5BS) may be included depending on the head assay values.

29
6. Size by assay on each sample from 1.18mm down to the –C5 fraction from cyclosizing, this will give information on the copper distribution in the material.
7. Grind determinations on the 3 samples to cover a grind range between P80=125um down to P80=63um.
8. Rougher sighter CPS flotation tests (P80=106um) on the 3 samples using SIPX and A4037 as the collectors with MIBC as the frother. Plus extra tests on the samples using alternate collectors A7249 and A3418A. Also extra tests at different grind sizes of P80=90um and P80=75um.
9. 2 stage cleaner flotation of each sample at the preferred conditions from step 8.
10. Cyclic flotation tests to determine the effect of the recycle streams on continuous operation. Using test conditions as determined from step 8 and step 9.
11. Size by assays on the flotation tailings from each sample (125um to –C5).
12. Bulk floats on each sample to produce concentrate for filtration and settlings tests.
13. Filtration tests on the cleaner concentrates from each sample.
14. Flocculant screening and settling tests on the concentrates and tailings from the 3 samples.
The test program is nearing completion with the available results to date presented below.
Interval sample analysis for Met 1 and Met 2 have been received and are shown in Table 4.1.
The size analysis for samples Met 1 and Met 2 were both very coarse and reflect the processing method of that period with the Met 1result shown in Table 4.2.
The Ball Mill Work Index (BMWI) for Met 1 and Met 2 samples was determined at 16.3 and 17.2 kWh/t, respectively.
Sample
Interval
Ag
ppm
Co
ppm
Cu
%
Fe
%
Mn
%
Ni
ppm
Pb
%
S
%
Zn
%
Au
ppm
Met 1-1-01 8 20 1.355 5.29 0.050 20 0.025 0.97 0.060 0.33
Met 1-1-02 9 20 1.305 5.32 0.065 40 0.030 1.27 0.060 0.20
Met 1-1-03 8 20 1.015 5.49 0.095 40 0.030 1.05 0.085 0.12
Met 1-2-01 9 20 1.200 5.59 0.100 60 0.030 1.12 0.085 0.12
Met 1-2-02 8 20 1.230 5.80 0.085 20 0.025 1.22 0.070 0.12
Met 1-2-03 12 60 1.025 5.68 0.090 100 0.030 1.08 0.095 0.08
Head (calc) 9 27 1.190 5.52 0.079 45 0.028 1.12 0.075 0.17
Met 2-2-01 7 40 1.150 5.42 0.075 20 0.020 1.02 0.105 0.12
Met 2-3-01 8 20 1.100 5.06 0.075 40 0.025 0.93 0.085 0.12

30
Met 2-3-02 8 20 1.105 5.30 0.090 120 0.025 1.24 0.075 0.20
Met 2-3-03 9 40 1.09 5.36 0.130 40 0.030 1.18 0.080 0.24
Met 2-3-04 9 40 1.095 5.46 0.095 40 0.025 1.09 0.080 0.45
Head (calc) 8 32 1.108 5.32 0.094 52 0.025 1.10 0.085 0.23
Table 4.1 Met 1 and Met 2 Sample Interval Analysis
Screen Size
(mm)
Cumulative Weight
% Passing
2.800
2.360
2.000
1.700
1.400
1.180
0.850
0.600
0.300
0.150
0.125
0.106
99.63
99.37
98.53
94.96
87.13
79.83
61.18
45.48
23.11
11.94
10.19
9.02
Table 4.2 Met 1 Sample Size Analysis
A series of flotation sighter tests to optimise flotation conditions were conducted on the Met 1 and 2 samples and the results are shown in Table 4.3. Copper recoveries were not as high as that achieved in the 1969 test program.
Sample Cu Recovery % Ag Recovery % Au Recovery %
Met 1 65.7
61.7
70.0
69.1
75.5
66.3
67.5
78.3
77.5
78.2
60.3
-
-
-
-
Met 2 71.7
78.2
67.7
78.4
82.5
-
Table 4.3 Met 1 and 2 Sighter Flotation Results

31
Following optimisation of the cleaner flotation a locked cycle test was completed on both the Met 1 and 2 samples to represent flotation performance in a plant with recirculating cleaner tail to the rougher feed. A total of 6 cycles were used and with the overall results shown in Tables 4.4 and 4.5.

32
Table 4.4 Met 1 Locked Cycle Test Result
Float Weight Assay RecoveryTime Cu Fe Ag Pb S Zn Au Cu Fe Ag Pb S Zn Aumin g % % % ppm % % % ppm % % % % % % %
20.06 1.7 27.1 29.2 215 0.22 27.6 1.08 5.05 24.9 7.5 24.9 8.0 34.4 18.4 29.519.24 1.6 15.0 19.9 220 0.26 13.8 0.59 4.45 13.2 4.9 24.4 8.8 16.5 9.6 25.070.61 6.0 4.38 12.1 70 0.15 2.51 0.22 1.20 14.1 10.9 28.5 18.4 11.0 12.9 24.73.49 0.3 28.2 8.9 34 0.25 5.40 0.63 0.67 4.5 0.4 0.7 1.5 1.2 1.9 0.717.16 1.5 12.5 11.6 31 0.24 3.62 0.41 0.51 9.8 2.5 3.1 7.4 3.9 6.0 2.678.23 6.7 3.64 11.0 16 0.15 1.53 0.22 0.28 13.0 11.0 7.2 21.1 7.4 14.3 6.4962.19 82.2 0.47 5.09 2 0.02 0.43 0.05 0.04 20.5 62.7 11.1 34.7 25.7 36.9 11.2
1170.98 100.0 1.87 6.67 15 0.05 1.38 0.10 0.29 100.0 100.0 100.0 100.0 100.0 100.0 100.0
Cumulative ProductsFloat Weight Assay RecoveryTime Cu Fe Ag Pb S Zn Au Cu Fe Ag Pb S Zn Aumin g % % % ppm % % % ppm % % % % % % %
20.06 1.7 27.1 29.2 215 0.22 27.6 1.08 5.05 24.9 7.5 24.9 8.0 34.4 18.4 29.539.30 3.4 21.2 24.6 217 0.24 20.8 0.84 4.76 38.1 12.4 49.4 16.8 50.9 28.0 54.5109.91 9.4 10.4 16.6 123 0.18 9.1 0.44 2.47 52.2 23.3 77.9 35.2 61.9 40.9 79.2
3.49 0.3 28.2 8.9 34 0.25 5.4 0.63 0.67 4.5 0.4 0.7 1.5 1.2 1.9 0.720.65 1.8 15.2 11.1 32 0.24 3.9 0.45 0.54 14.3 2.9 3.8 9.0 5.0 7.9 3.298.88 8.4 6.0 11.0 19 0.17 2.0 0.26 0.33 27.3 14.0 11.0 30.1 12.5 22.2 9.623.55 2.0 27.3 26.2 188 0.22 24.3 1.01 4.40 29.4 7.9 25.6 9.5 35.5 20.2 30.259.95 5.1 19.1 20.0 153 0.24 15.0 0.70 3.30 52.4 15.3 53.1 25.7 55.9 35.8 57.7208.79 17.8 8.3 14.0 74 0.17 5.7 0.35 1.46 79.5 37.3 88.9 65.3 74.3 63.1 88.8
Sulphide 1st Cleaner TailOxide 2nd Cleaner Conc
Product
Sulphide 2nd Cleaner ConcSulphide 2nd Cleaner Tail
Oxide 2nd Cleaner TailOxide 1st Cleaner TailRougher Tail
Sulphide 1st Cleaner ConcSulphide Rougher ConcOxide 2nd Cleaner Conc
Calculated HeadAssay Head
Product
Sulphide + Oxide Rougher Con
Oxide Rougher ConcSulphide + Oxide 2nd Clnr ConSulphide + Oxide 1st Clnr Con
Oxide 1st Cleaner Conc
Sulphide 2nd Cleaner Conc

33
Table 4.5 Met 2 Locked Cycle Test Result
Float Weight Assay RecoveryTime Cu Fe Ag Pb S Zn Au Cu Fe Ag Pb S Zn Aumin g % % % ppm % % % ppm % % % % % % %
27.53 2.3 22.6 26.0 184 0.29 23.4 0.94 4.55 31.8 8.9 28.6 16.4 39.5 18.1 34.626.11 2.1 12.7 18.7 156 0.24 12.0 0.43 1.20 17.0 6.1 23.0 13.1 19.2 7.9 8.680.38 6.6 3.40 11.7 45 0.11 2.47 0.21 1.55 14.0 11.7 20.4 18.4 12.2 11.5 34.45.63 0.5 18.0 9.64 40 0.29 3.20 1.17 5.75 5.2 0.7 1.3 3.4 1.1 4.6 8.920.28 1.7 6.39 11.0 28 0.19 2.23 0.48 0.28 6.6 2.8 3.2 7.8 2.8 6.7 1.690.41 7.4 2.02 10.0 14 0.11 1.02 0.22 0.05 9.3 11.3 7.1 20.7 5.7 13.9 1.2966.39 79.4 0.33 4.86 3 0.01 0.33 0.06 0.04 16.1 58.5 16.4 20.2 19.6 37.2 10.7
1216.73 100.0 1.61 6.59 15 0.04 1.34 0.12 0.30 100.0 100.0 100.0 100.0 100.0 100.0 100.0
Cumulative ProductsFloat Weight Assay RecoveryTime Cu Fe Ag Pb S Zn Au Cu Fe Ag Pb S Zn Aumin g % % % ppm % % % ppm % % % % % % %
27.53 2.3 22.6 26.0 184 0.29 23.4 0.94 4.55 31.8 8.9 28.6 16.4 39.5 18.1 34.653.64 4.4 17.8 22.4 170 0.26 17.9 0.69 2.92 48.8 15.0 51.6 29.4 58.7 26.0 43.2134.02 11.0 9.2 16.0 95 0.17 8.6 0.40 2.10 62.8 26.7 72.0 47.9 70.9 37.5 77.6
5.63 0.5 18.0 9.6 40 0.29 3.2 1.17 5.75 5.2 0.7 1.3 3.4 1.1 4.6 8.925.91 2.1 8.9 10.7 31 0.21 2.4 0.63 1.47 11.8 3.5 4.5 11.2 3.9 11.4 10.5116.32 9.6 3.6 10.2 18 0.13 1.3 0.31 0.37 21.1 14.7 11.6 32.0 9.5 25.3 11.733.16 2.7 21.8 23.2 160 0.29 20.0 0.98 4.75 37.0 9.6 29.9 19.8 40.6 22.7 43.579.55 6.5 14.9 18.6 125 0.25 12.8 0.67 2.45 60.6 18.5 56.1 40.7 62.6 37.3 53.7250.34 20.6 6.6 13.3 59 0.15 5.2 0.36 1.29 83.9 41.5 83.6 79.8 80.4 62.8 89.3Sulphide + Oxide Rougher Con
Oxide Rougher ConcSulphide + Oxide 2nd Clnr ConSulphide + Oxide 1st Clnr Con
Oxide 1st Cleaner Conc
Sulphide 2nd Cleaner Conc
Oxide 1st Cleaner TailRougher Tail
Sulphide 1st Cleaner ConcSulphide Rougher ConcOxide 2nd Cleaner Conc
Calculated HeadAssay Head
Product
Product
Sulphide 2nd Cleaner ConcSulphide 2nd Cleaner TailSulphide 1st Cleaner TailOxide 2nd Cleaner ConcOxide 2nd Cleaner Tail

34
Using the head grades and results of the locked cycle tests the recoveries for copper, silver and gold have been calculated and are represented in Table 4.6.
Met 1
Metal Head Tail Concentrate Recovery %
Cu
Ag
Au
Yield
1.22 %
8 ppm
0.18 ppm
0.47 %
2 ppm
0.04 ppm
27.26 %
188 ppm
4.40 ppm
2.4 %
62.6
75.8
78.5
Met 2
Cu
Ag
Au
Yield
1.13 %
9 ppm
0.13 ppm
0.33 %
3 ppm
0.04 ppm
21.82 %
166 ppm
4.75 ppm
3.3 %
71.9
67.9
69.9
Average
Cu
Ag
Au
Yield
1.18%
8.5 ppm
0.16 ppm
0.40 %
2.5 ppm
0.04 ppm
24.54 %
177 ppm
4.58 ppm
2.85 %
67.3
71.9
74.2
Table 4.6 Overall Metal Recoveries for Samples Met 1 and 2
4.2.2 Slag Very little information is available on the slag dumps at the Burraga Mine and no previous metallurgical test work has been undertaken on samples of slag. There are two main slag dumps at Burraga; the older dump is situated to the north closest to the Burraga township whereas the more recent dump is situated just to the north of the tailings dump.
Originally all the ore mined was directly smelted in reverbatory furnaces but following the purchase of the mine by the Lloyd Copper – Mining Company in 1899, and the construction of the treatment plant in 1900, the smelter feed became a combination of high grade lump and gravity concentrate. Prior to smelting in the reverberatory furnace the sulphide ore was calcined. The larger and more recent slag dump is from the Lloyd period of mine ownership whereas the older smaller dump pre-dates that period. In the Lloyd’s prospectus the old slag dump was listed as 100,000 tonnes of slag containing 6% copper but from actual workings was found to be 2.5% copper, i.e. some of the earlier slag was reprocessed.
Slag grab samples from the Lloyd’s dump have been collected and the analyses are represented in Table 4.7.

35
Sample ID Au ppm
Ag ppm
As ppm
Cu %
Pb ppm
Zn ppm
S %
242001 0.30 7 20 1.25 61 397 - 242002 0.10 4 38 1.01 85 1,120 - 242009 0.13 4 30 0.76 305 4,560 -
S001 0.105 3.6 157 0.729 695 6,150 0.29 S002 0.118 4.4 167 0.855 793 6,620 0.34 S003 0.117 3.9 189 0.785 923 7,690 0.34 S004 0.159 5.2 166 0.980 936 7,660 0.44 S005 0.008 3.5 154 0.752 813 6,770 0.33 S006 0.007 5.9 177 1.095 649 6,080 0.47
Average 0.116 4.6 122 0.913 72 5,227 0.37
Table 4.7 Lloyd’s Slag Dump Sample Analyses
The sample collected for metallurgical testing was taken from the larger Lloyd slag dump. The head assay for this sample, Met 3, is given in Table 4.8 and agrees favourably with the average result from earlier samples given in Table 4.8.
Au ppm
Ag ppm
Cu %
Fe %
Pb %
Zn %
S %
0.14 5 0.91 9.29 0.015 0.220 0.32
Table 4.8 Met 3 Slag Sample Analysis.
The BMWI was determined at the very high value of 26.9 kWh/t. The sighter test results for Met 3 are shown in Table 4.9.
Sample Cu Recovery % Ag Recovery % Au Recovery %
Met 3 64.0
70.6
66.4
69.0
80.3
-
Table 4.9 Met 3 Sighter Flotation Test Results.
Following optimisation of the cleaner flotation a locked cycle test was completed on the Met 3 sample to represent flotation performance in a plant with recirculating cleaner tail to the rougher feed. A total of 6 cycles were used and with the overall results shown in Tables 4.10.

36
Table 4.10 Met 3 Locked Cycle Test Result
Float Weight Assay RecoveryTime Cu Fe Ag Pb S Zn Au Cu Fe Ag Pb S Zn Aumin g % % % ppm % % % ppm % % % % % % %
1.0 9.27 0.8 28.0 14.6 210.0 0.180 12.6 0.36 5.20 20.4 1.1 23.5 12.5 26.0 1.2 14.02.0 11.61 1.0 15.9 14.4 126.0 0.105 6.8 0.35 3.95 14.5 1.4 17.7 9.1 17.7 1.4 13.3
28.18 2.5 6.55 14.9 52.0 0.060 2.5 0.36 1.95 14.5 3.4 17.7 12.7 15.7 3.6 16.0110.84 9.7 2.09 14.8 13.0 0.035 0.7 0.34 0.70 18.2 13.3 17.4 29.0 16.6 13.4 22.5979.62 86.0 0.42 10.2 2.0 0.005 0.1 0.23 0.12 32.4 80.9 23.7 36.7 24.0 80.3 34.2
1139.52 100.0 1.12 10.8 7.3 0.012 0.4 0.25 0.30 100.0 100.0 100.0 100.0 100.0 100.0 100.0
Cumulative ProductsFloat Weight Assay RecoveryTime Cu Fe Ag Pb S Zn Au Cu Fe Ag Pb S Zn Aumin g % % % ppm % % % ppm % % % % % % %
1.0 9.27 0.8 28.0 14.6 210.0 0.180 12.6 0.36 5.20 20.4 1.1 23.5 12.5 26.0 1.2 14.03.0 20.88 1.8 21.3 14.5 163.3 0.138 9.4 0.35 4.50 34.9 2.4 41.2 21.6 43.7 2.6 27.35.0 49.06 4.3 12.8 14.7 99.4 0.093 5.4 0.36 3.04 49.5 5.8 58.9 34.3 59.4 6.3 43.312.0 159.90 14.0 5.4 14.8 39.5 0.053 2.1 0.35 1.42 67.6 19.1 76.3 63.3 76.0 19.7 65.8
Product
Rougher Tail
Sulphide Cleaner Conc 1Sulphide Cleaner Conc 2Sulphide Cleaner 2 TailSulphide Cleaner 1 Tail
Sulphide Cleaner Conc 1Sulphide Cleaner Conc 1+2Sulphide Cleaner 1 Conc
Calculated HeadAssay Head
Sulphide Rougher Conc
Product

37
Using the head grades and results of the locked cycle tests the recoveries for copper, silver and gold have been calculated and are represented in Table 4.11.
Met 3
Metal Head Tail Concentrate Recovery %
Cu
Ag
Au
Yield
0.90 %
6 ppm
0.14 ppm
0.42 %
2 ppm
0.12 ppm
21.27 %
163 ppm
4.50 ppm
2.1 %
54.4
67.5
14.7
Table 4.11 Overall Metal Recoveries for Met 3 Sample
4.2.3 Run of Mine Ore No metallurgical test work has been undertaken on samples from the in-ground ore resource. Metallurgical characteristics, including copper flotation recoveries for oxide, transition and fresh ore, have been assumed based on experience and also the results obtained from the tailings samples.
4.3 Process Design
4.3.1 Throughput Options Two throughput options have been considered for processing of the tailings and slag at the Burraga Mine, viz.
3. 150,000 tonnes per annum, and 4. 300,000 tonnes per annum.
Option 2 was initially selected because the tailings quantity had been estimated at 300,000 tonnes and therefore treatment of the tailings would fit neatly into a 12 month period. However following a site visit it is thought that the tailings quantity has been over estimated and is more likely to be less than 200,000 tonnes and as low as 150,000 tonnes. Apart from visually estimating the quantity of tailings based on both experience and a volume estimate there is historical evidence showing that not all the ore mined post 1900 was treated in the plant but that higher grade lump ore was hand-picked and fed directly to the smelters.
Option 1 was also considered because the throughput rate fitted well with the capacity of the flotation plant and ball mill at the Adam’s plant at Tregoora, in far north Queensland. This plant, along with additional flotation cells in the “lay down yard,” is currently available to purchase.
Capital and operating costs along with projected cashflow estimates have been made for both scenarios.

38
4.3.2 Conceptual Flow Sheet A conceptual flow sheet, along with a mass balance, was developed to process and recovery copper from both the tailings and slag dumps at Burraga Mine. The flow sheet developed for processing the slag would also be suitable for handling run-of-mine (ROM) ore.
The 1969 Amdel report and the recent Met 1, 2 and 3 sample results were used as a basis for the conceptual flow sheet, however much of the mass balance required estimating based on experience. The mass balance has been completed with and without a tailings thickener to show the raw water requirements for both situations. A tailings thickener would be a large capital cost and if sufficient water is available it would be preferable not to include one in the plant design.
Figure 4.2 shows the conceptual flow sheet for tailings processing whereas Figure 4.3 shows the conceptual flow sheet for processing the slag and potentially ROM ore.

39

40

41
4.3.3 Design Criteria Table 4.12 lists the design criteria for the two throughput scenarios considered.
Item Unit Scenario 1 Scenario 2
Production Schedule Nominal plant throughput per year tpa 300,000 150,000 Operating days per year 365 365 Shifts per day 2 2 Hours per shift hrs 12 12 Availability % 91.3% 91.3% Operating hrs per year hrs 8,000 8,000 Ore throughput, nominal tph 38 19 Ore throughput, nominal for mass balance tpd 822 411 Ore throughput, nominal for design tpd 900 450 ROM Feed ROM Hopper Capacity m3 20.94 10.33 Feeder capacity, % of crusher feed % 115% 115% Apron Feeder Maximum Capacity (dry) tph 50.255 24.80 Plant Feed Crushed ore/Tailings Hopper Capacity m3 18.21 8.98 Feeder capacity, % of mill feed % 115% 115% Belt Feeder Maximum Capacity (dry) tph 43.7 21.56 Ball Mill Feed Conveyor Capacity (dry) tph 43.7 21.56 Grinding Circuit Operating Schedule Hrs/day 24 24 Availability % 92 92 Design Feed Rate (dry) tph 38 19 Ball Mill Feed um 600 600 Ball Mill Product um 106 106 Circulating Load % 200 200 Bond Ball Mill Work Index kWh/t 7 7 Circuit efficiency % 1.2 1.2 Ball Mill Pinion Power Required kW 319 158 Ball Mill Installed Power kW 350 200 Flotation Circuit Rougher/Scavenger Flotation Feed Rate (dry) tph 38 19 Volume Flow Rate m3/h 87.5 43.75 Residence Time min 6/12/12 6/12/12

42
Flotation Cells No 2/4/4 2/4/4 Cell Volume (individual) m3 4.375 2.1875 Cleaner Flotation Feed Rate (dry) tph 3.8 1.9 Volume Flow Rate m3/h 16.5 8.25 Residence Time min 6 6 Flotation Cells No 4 4 Cell Volume (individual) m3 0.4125 0.20625 Thickeners Flotation Tails Feed Rate (dry) tph 34.2 17.1 Volume Flow Rate m3/h 71.1 35.55 Solids w/w % 37 37 Settling rate t/h/m2 0.3 0.3 Thickener Diameter m 12.05 6.03 Thickener Underflow - Solids tph 34.2 17.1 - Volume m3/h 40.8 20.4 - Density 1.5 1.5 Thickener Overflow -Volume m3/h 30.3 15.15 Flotation Concentrate Feed Rate (dry) tph 1.2 0.6 Volume Flow Rate m3/h 7.4 3.7 Solids w/w % 14.6 7.3 Settling rate t/h/m2 0.3 0.3 Thickener Diameter m 2.26 1.13 Thickener Underflow - Solids tph 1.2 0.6 - Volume m3/h 1.2 0.6 - Density 1.7 1.7 Thickener Overflow -Volume m3/h 5 2.5 Concentrate Filtration Product solids (dry) tph 1.1 0.55 Moisture % 15 15 Filtrate Flow m3/h 1.9 0.95 Process water Process Water Tank Volume m3 60 30
Figure 4.12 Burraga Process Plant Design Criteria
4.4 Process Description The following is a process description for tailings processing and the processing of slag and ROM ore. The first section describing primary crushing is only required for slag and ROM

43
ore. At this early stage and at the level of this study no specific equipment types have been selected and hence equipment will only be described in general terms.
4.4.1 Primary Crushing This section only applies to slag and ROM ore.
Slag and ROM ore is trucked and stacked on the ROM pad. A front end loader (FEL) feeds the ROM bin at the appropriate rate to maintain a constant supply of ore to the primary jaw crusher. The ore from the ROM bin is fed via a fixed speed vibrating grizzly feeder that allows the -100mm material to bypass the jaw crusher whilst oversize reports to the jaw crusher to be crushed to nominally -100mm. Undersize from the grizzly feeder and crushed ore from the jaw crusher will both discharge onto a conveyor which discharges into the fine ore bin. The tail of this conveyor will extend back underneath the grizzly feeder to collect any spillage that falls through or around the feeder.
4.4.2 Crushed Ore and Tailings Feed The fine ore bin will initially be used as the tailings feed bin and then enlarged to provide surge capacity between the primary crusher and mill feed when processing slag and ROM ore. When used as the tailings feed bin the FEL will be used to feed the tailings into the bin through a fixed grizzly to remove any timber or other extraneous matter contained within the tailings.
The crushed ore and slag or tailings will be fed at a controlled rate using a variable speed belt feeder onto the mill feed conveyor which will in turn discharge to either the ball or SAG mill depending on the type of material being processed.
4.4.3 Grinding When processing tailings the mill feed conveyor will discharge to a ball mill. The tailings sands are quite coarse and will require further grinding to at least a P80 = 106um, if not finer, to liberate the copper minerals from gangue and to provide fresh surface for flotation recovery. The ball mill discharges into a sump from where it is pumped to the classifying cyclones to remove ground material from the circuit for flotation feed. Material too coarse will return to the ball mill feed for further grinding.
When processing slag or ROM ore the mill feed conveyor will discharge to a SAG mill that will be installed at the completion of tailings processing. Together with the existing ball mill there will then be sufficient grinding capacity to handle the -100mm crushed slag and ROM ore. The SAG mill discharges into the existing ball mill sump, which is now the common mill sump, and is pumped to the classifying cyclones with the cyclone overflow exiting the circuit as flotation feed. The coarse cyclone underflow will once again return to the ball mill for further grinding with the ball mill discharging into the common mill sump.

44
4.4.4 Flotation Cyclone overflow from the classifying cyclones gravitates to the conditioning tank for reagent mixing prior to flotation. The flotation collector is added into the conditioning tank and the reagent and pulp is mixed and maintained in suspension through the use of the tank agitator. The cleaner flotation tailings are also directed to the conditioning tank.
The conditioning tank is designed to overflow to provide feed to the flotation rougher cells with rougher tailings feeding the scavenger flotation cells. Frother is added to the feed of the first flotation cell and to the first scavenger cell. Tailings from the last scavenger cell gravitate to the tailings sump from where they will be pumped to the tailings storage facility. Depending on the adequacy of the raw water supply, it may be necessary to install a tailings thickener into the circuit to conserve water in which case the flotation tailings would be pumped or gravitate to the tailings thickener. The thickener underflow would then be pumped to the tailings storage facility and the thickener overflow would gravitate back to the process water tank.
Rougher and scavenger flotation concentrate will gravitate to a common froth sump and be pumped to the smaller flotation cleaner cells to upgrade the rougher concentrate. Reagents will be added where necessary to the cleaner flotation cells. The cleaner flotation concentrate will be fed to the concentrate thickener and tailings to the flotation conditioning tank.
The flotation circuit described is generic and is indicative of the circuit that would be required for slag and ROM processing, however for tailings the indications are that a two stage rougher and cleaner flotation circuit will be required to maximise recoveries of copper sulphide and copper oxide/carbonate minerals. The Amdel report shows that each require separate flotation conditions.
4.4.5 Concentrate Thickening, Filtering and Handling The cleaner flotation concentrate will be fed to the concentrate thickener to increase the solids density of the concentrate prior to feeding the concentrate filter. The concentrate thickener overflow water will return to the process water tank.
The thickened cleaner flotation concentrate is pumped to the concentrate filter for dewatering prior to being conveyed to the concentrate storage shed. The filtrate will return to the concentrate thickener feed. Copper concentrate will be loaded into containers and transported by road to the nearest suitable rail loading facility, at either Oberon or Goulburn, from where the concentrate containers are shipped by rail to port. From the port, either Newcastle or Port Kembla, the concentrate will be shipped to a port in China prior to smelting.
4.4.6 Process Water Process water will be pumped from the process water tank to the various parts of the circuit as shown in Figures 3.3 and 3.4. The concentrate thickener (and tailings thickener)

45
overflow water will return to the process water tank for re-use in the circuit. Decant from the tailings storage facility will also be pumped back to the process water tank as required. Raw water will be added to the process water tank as required to replace water losses in the circuit.
4.4.7 Reagents Reagents required will be flotation frother and collector(s), and flocculant for the thickener(s). Facilities will be constructed for the appropriate handling, storage and mixing of reagents to conform to the current regulations.
4.4.8 Utilities Utilities include the low and high pressure air supply, high pressure water, maintenance workshop and office.
A conceptual plant layout is shown in Figure 4.4 below.
4.5 Process Infrastructure
4.5.1 Tailings Storage Facility An appropriate site for the tailings storage facility (TSF) will be required with sufficient storage volume to contain tailings from the reprocessing of tailings and slag and potentially tailings from the processing of approximately one million tonnes of ore.
Construction of the TSF can be undertaken in stages to accommodate the production schedule. The starter TSF wall for tailings treatment will be constructed from borrow material from within the storage area as no mine waste is being generated. Further wall development will use mine waste. The tailings will be quite benign containing only a small quantity of residual flotation chemicals and some minor sulphide minerals. The presence of sulphide minerals does create a potential for acid mine drainage which will need to be properly addressed in the TSF design and monitoring during operation. At the completion of the operation the TSF will be capped and rehabilitated providing a better outcome than the current situation where the tailings are perched on a hillside with run-off collected in several small dams.
4.5.2 Raw Water Supply A raw water supply will be required for the processing operation with demand expected to be around 300 to 350 megalitres per year at 300,000 tonnes per annum production and no tailings thickener. If a tailings thickener is included in the circuit the raw water requirement will become less than half this amount. There are three potential options for a raw water supply, viz.
1. Constructing a containment dam on a nearby stream and pumping to the process facility.

46
2. Access water from the existing Burraga dam which is situated a couple of kilometres to the north. This dam was constructed by the Lloyd’s Copper-Mining Company in 1901 to provide a water supply to the Burraga Mine and covers an area of about 6 hectares with a maximum depth of 12 metres. The dam is now used as the Burraga township water supply and for recreational camping and fishing.
3. A combination of 1 and 2.
4.5.3 Power Supply It is estimated that a 1.5MVA power supply is required for the new facility. A small unused 10kVA single phase power supply exists at the site. This was most likely set up for a pine plantation site administration facility in the area.
Power supply to the Burraga area is from the Burraga 33/11kV Zone Substation situated approximately 7km from Burraga toward Oberon. The substation has two 2.5MVA transformers - one duty and one partially connected spare. The existing site supply is via a 1.8km 11kV spur line from the Burraga Township. Although this spur line has three phase conductors to the proposed plant site, these conductors will have to be upgraded for the new 1.5MVA power supply.
4.5.4 Site Access Roads The Burraga Mine site is serviced by good bitumen roads from both Goulburn and Oberon with only the last couple of kilometres being gravel road which is in good condition and can be readily further upgraded. Roads already exist from the tailings and both slag dumps to the proposed plant site but will require minimal upgrading to be suitable for the trucking of material. It is envisaged that this would be done using highway type trucks. Watering of the roads for dust suppression will be required.
If mining commences off highway mine trucks will be required for ore and waste haulage and appropriately constructed roads will be required to handle the heavy loads.
A conceptual site plan, excluding the open cut mine and haul road, is shown in Figure 4.5.

47
Figure 4.4 Conceptual Plant Layout

48
Figure 4.5 Overall Site Plan

49
5 Ore Mining and Processing
5.1 Mining Mining of ore will be by conventional open cut methods using drill and blast, loading by excavators and off highway haul trucks. A maximum pit depth of 150 metres and an ore to waste ratio of 1:2 have been used as the basic assumptions to determine mining costs. The mine operating cost was based on cost information from similar sized operations rather than developing costs from first principles. The quantity of ore and copper grade have been assumed as 1,000,000 tonnes at 1.0%, respectively.
5.2 Processing The process circuit for treating mined ore will be the same as for processing the slag dumps which require primary crushing prior to milling to feed the flotation circuit. Additional milling capacity to that used for treating the tailings will be required, which will be achieved by the inclusion of a SAG mill into the grinding circuit. The ore processing cost will be the same as that for processing the slag.
6 Capital Cost Estimate Capital cost estimates for the two throughput scenarios are summarised in Table 6.1.
Item 150k tpa ($) 300k tpa ($) Metallurgical Tests 53,000 53,000 Permitting 420,000 420,000 Plant and Infrastructure 8,014,000 9,856,000 Deferred Capital
- Plant Upgrade - TSF stages
2,869,000 1,000,000
2,869,000 1,000,000
Residual Capital Return -1,088,000 -1,273,000 Total 11,268,000 12,925,000
Table 6.1 Capital Expenditure Summary
6.1 Metallurgical Testing The current metallurgical test work program, estimated to cost $53,000, has been included in the capital cost estimate.
6.2 Permitting Cost The approval process has been detailed in section 2.0. The costs estimates associated with the approval process are detailed in Table 6.2.

50
Approval Cost ($) Mining Lease Application Development Application
- Application Preparation - Environmental Impact Study
15,000
5,000 400,000
Total Cost 420,000
Table 6.2 Permitting Cost Estimate
6.3 Process Plant and Infrastructure Cost A capital cost estimate +/- 30% has been derived for processing tailings at the two designated throughput rates. The primary crushing plant, increased crushed ore bin capacity and the addition of a SAG mill to the grinding circuit for slag and ore processing have only been estimated for the higher 300,000 tpa option. Based on the relatively small difference in capital cost estimates between the two tailings options it was considered that the upgrade cost to the small plant would not be too dissimilar to that of the larger plant, and was therefore used in both scenarios. Table 6.3 provides the detail of the capital cost estimate for each scenario.
Item 300k tpa $’000
150k tpa $’000
300k tpa Upgrade $’000
Process Plant Direct Costs Site Establishment Plant Earthworks Civil Works Mechanical Equipment Structural Piping Electrical & Instrumentation Platework Buildings Refurbishment (Tregoora Plant) Purchase Tregoora Plant2
Installation Freight
100 180 309
1,378 290 250 745
136
1,302 200
80
144 216 548 203 162 549
126 300 500 911 140
0
70 140
1,140 50 40
371 30 20
180 80
Process Plant Direct Total Cost 4,890 3,879 2,121 Other Direct Costs Mobile Equipment Site Earthworks
- Haul and access roads - Water Dams - Tailings Storage Facility - Field Piping from Burraga Dam
Power Supply Commissioning Consultants, Test work, Survey First Fills
350
200 300
1,350 152 400 200 150 200
350
150 200
1,350 121 320 150 150 150
100 40 30 20
Other Direct Total Cost 3,302 2,941 190
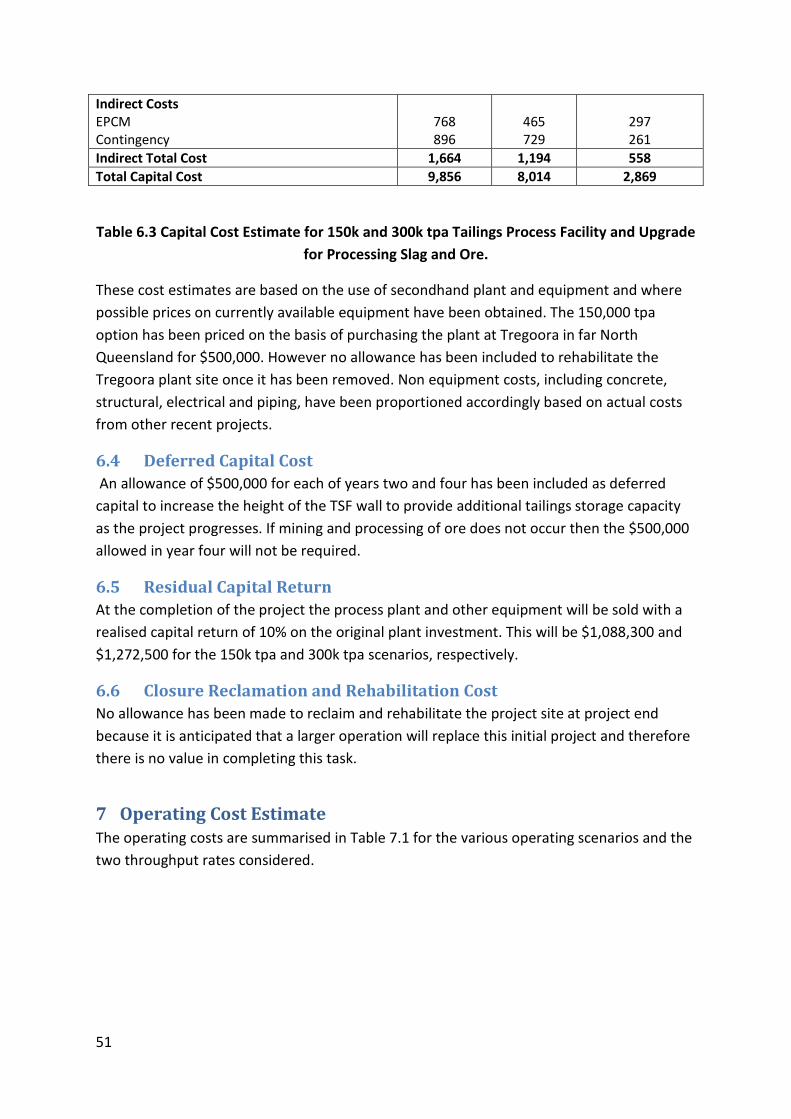
51
Indirect Costs EPCM Contingency
768 896
465 729
297 261
Indirect Total Cost 1,664 1,194 558 Total Capital Cost 9,856 8,014 2,869
Table 6.3 Capital Cost Estimate for 150k and 300k tpa Tailings Process Facility and Upgrade for Processing Slag and Ore.
These cost estimates are based on the use of secondhand plant and equipment and where possible prices on currently available equipment have been obtained. The 150,000 tpa option has been priced on the basis of purchasing the plant at Tregoora in far North Queensland for $500,000. However no allowance has been included to rehabilitate the Tregoora plant site once it has been removed. Non equipment costs, including concrete, structural, electrical and piping, have been proportioned accordingly based on actual costs from other recent projects.
6.4 Deferred Capital Cost An allowance of $500,000 for each of years two and four has been included as deferred capital to increase the height of the TSF wall to provide additional tailings storage capacity as the project progresses. If mining and processing of ore does not occur then the $500,000 allowed in year four will not be required.
6.5 Residual Capital Return At the completion of the project the process plant and other equipment will be sold with a realised capital return of 10% on the original plant investment. This will be $1,088,300 and $1,272,500 for the 150k tpa and 300k tpa scenarios, respectively.
6.6 Closure Reclamation and Rehabilitation Cost No allowance has been made to reclaim and rehabilitate the project site at project end because it is anticipated that a larger operation will replace this initial project and therefore there is no value in completing this task.
7 Operating Cost Estimate The operating costs are summarised in Table 7.1 for the various operating scenarios and the two throughput rates considered.

52
Item Tailings ($/t) Slag ($/t) Ore ($/t) 150k 300k 150k 300k 150k 300k
Mining 3.00 3.00 3.00 3.00 12.00 9.00 Processing 12.00 6.95 16.00 10.30 16.00 10.30 G & A 1.80 1.00 1.80 1.00 1.80 1.00 Concentrate Charges 5.65 5.65 5.65 5.65 6.20 6.20 Reclamation 0.10 0.10 0.10 0.10 0.10 0.10 Total 22.55 16.70 27.05 20.05 36.10 26.60
Table 7.1 Operating Cost Summary
7.1 Mining Operating Cost An indicative cost of $3.00 per tonne was obtained from a local Bendigo earthmoving contractor, who has experience in mining and trucking tailings, to mine and transport the tailings two kilometres to the proposed plant site. An allowance was included in the cost to push the tailings to the truck loading point because it was considered impractical to mine the face of the tailings dump, due to its location on the side of a hill. The cost also allows for watering of the truck route from the tailings dump to the plant site. This cost was also used for mining and transporting the slag to the plant site.
The cost used for mining ore was based on the cost estimate developed for another similarly sized Australian project to the 300, 000 tpa option and is $9.00 per tonne of ore. The cost used for 150,000 tpa was prorated from this cost and is $12.00 per tonne of ore. The placement and compaction of mine waste on the TSF wall are included in these costs.
7.2 Process Operating Cost Process operating costs were developed based on experience with other projects and on the metallurgical test work results available. Current consumable prices were obtained for flotation reagents, grinding media and flocculants. An estimate of the power cost, based on expected demand, was obtained from Essential Energy in NSW. The process operating costs are detailed in Table 7.2.
Item Tailings Processing ($/t) Slag/Ore Processing ($/t) 150k 300k 150k 300k
Crushing - - 0.15 0.15 Grinding 0.45 0.45 1.20 1.20 Flotation 0.41 0.41 0.41 0.41 Analytical 0.24 0.12 0.24 0.12 Maintenance 0.20 0.18 0.25 0.26 Power 4.43 2.23 6.31 4.19 Labour 5.62 2.81 6.48 3.24 Fuel 0.67 0.73 0.67 0.73 Total 12.02 6.93 16.02 10.30
Table 7.2 Process Operating Costs

53
7.3 General and Administration Cost General and Administration costs were based on other similar project costs. Costs of $1.80 and $1.00 per tonne were used for each scenario at 150k and 300k tpa, respectively.
7.4 Concentrate Charges Concentrate charges include transport of concentrate to the smelters in Asia, concentrate treatment and a refining charge.
A transport cost of $92.00 per tonne of concentrate was used and includes transport by truck to the nearest railhead, rail freight to Port Kembla and shipment to Asia, most likely China. This cost estimate was based on standard freight rates and compares favourably to the concentrate transport cost use by Lachlan Star in the nearby Bushranger project study.
Concentrate treatment and the copper refining costs have been $80.00 per tonne of concentrate and $0.08 per pound of copper, respectively, over the longer term but have recently dropped to $40 per tonne and $0.04 per pound. The longer term average costs have been used in this study. These costs equate to $5.65 and $6.20 per tonne of mill feed for tailings/slag and ore, respectively.
7.5 Reclamation A nominal cost of $0.10 per tonne has been included for ongoing reclamation of the tailings and slag dumps and the mining waste dump.
8 Project Cashflow A cashflow model was developed for the two throughput options considered using a copper price of $10,000 per tonne. Credits for gold and silver have also been included in the cashflow model but lead and zinc, although present in the tailings, slag and ore have not been allocated any value.
The low lead and zinc grades in the tailings and slag do not warrant attempting to recover either metal, however the zinc grade is sufficiently high enough to suggest that economic recoverable levels may exist in the ore.
Therefore some upside does exist to the projected cashflows.
8.1 300k Tonnes per Annum Table 8.1 is a summary of the project cashflow at a production rate of 300k tpa.

54
Table 8.1 300k tpa Cashflow Estimate
Year 0 1 2 3 4 5 6 7 TotalPhysicals
Tailings Mined t 234,000 - - - - - - 234,000Cu (Head Grade) % 1.20 - - - - - - 1.20Ag (Head Grade) g/t 8.50 - - - - - - 8.50Au (Head Grade) g/t 0.13 - - - - - - 0.13Slag Mined t 66,000 74,000 - - - - - 140,000Cu (Head Grade) % 0.90 0.90 - - - - - 0.90Ag (Head Grade) g/t 6.00 6.00 - - - - - 6.00Au (Head Grade) g/t 0.14 0.14 - - - - - 0.14Waste Mined t - 452,000 600,000 600,000 348,000 - - 2,000,000Ore mined t - 226,000 300,000 300,000 174,000 - - 1,000,000Cu (Head Grade) % - 1.00 1.00 1.00 1.00 - - 1.00Ag (Head Grade) g/t - 8.50 8.50 8.50 8.50 - - 8.50Au (Head Grade) g/t - 0.13 0.13 0.13 0.13 - - 0.13Total Movement t 300,000 752,000 900,000 900,000 522,000 - - 3,374,000
Concentrate t 8,055 6,074 6,864 10,200 5,916 - - 37,109Recovered Cu (Total) t 2,213 2,057 2,364 2,700 1,566 - - 10,900Recovered Ag (Total) oz 56,043 55,957 64,604 73,786 42,796 - - 293,185Recovered Au (Total) oz 747 757 988 1,128 655 - - 4,275
Capital CostsPlant & Infrastructure Direct Capital Expenditure $ -$9,856,000 -$2,869,000 $0 $0 $0 $0 $0 $0 -$12,725,000Permittings -$420,000 $0 $0 $0 $0 $0 $0 $0 -$420,000Metallurgical Testing -$53,000 $0 $0 $0 $0 $0 $0 $0 -$53,000Plant Sustaining Capital $0 $0 -$500,000 $0 -$500,000 $0 $0 $0 -$1,000,000Mining Equipment Capital Expenditure $ $0 $0 $0 $0 $0 $0 $0 $0 $0Other Direct Capital $0 $0 $0 $0 $0 $0 $0 $0 $0
Residual Capital Return $0 $0 $0 $0 $0 $0 $0 $1,272,500 $1,272,500Total Capital Cost $ -$10,329,000 -$2,869,000 -$500,000 $0 -$500,000 $0 $0 $1,272,500 -$12,925,500
Capital cost - opening balance $ 0 -$10,329,000 -$10,316,341 -$7,795,016 -$4,773,692 -$1,935,912 $0 $0 -$35,149,962Capital expenditure $ -$10,329,000 -$2,869,000 -$500,000 $0 -$500,000 $0 $0 $1,272,500 -$12,925,500Capital Value at Year End $ -$10,329,000 -$13,198,000 -$10,816,341 -$7,795,016 -$5,273,692 -$1,935,912 $0 $1,272,500 -$48,075,462Depreciation $ $0 $2,881,659 $3,021,324 $3,021,324 $3,337,780 $1,935,912 $0 $0 $14,198,000Written Down Value $ -$10,329,000 -$10,316,341 -$7,795,016 -$4,773,692 -$1,935,912 $0 $0 $1,272,500Accumulated depreciation $ $0 $2,881,659 $5,902,984 $8,924,308 $12,262,088 $14,198,000 $14,198,000 $14,198,000
Revenue10,000$ Revenue Cu $ $0 $22,129,200 $20,573,040 $23,640,000 $27,000,000 $15,660,000 $0 $0 $109,002,240
30$ Revenue Ag $ $0 $1,681,294 $1,678,702 $1,938,110 $2,213,577 $1,283,875 $0 $0 $8,795,5581,500$ Revenue Au $ $0 $1,120,304 $1,136,106 $1,482,084 $1,692,736 $981,787 $0 $0 $6,413,017
Total Revenue $ $0 $24,930,799 $23,387,848 $27,060,194 $30,906,313 $17,925,661 $0 $0 $124,210,815
Operating Cash Costs9.00$ Mining $ $0 $900,000 $2,256,000 $2,700,000 $2,700,000 $1,566,000 $0 $0 $10,122,000
10.30$ Processing $ $0 $2,306,100 $3,090,000 $3,090,000 $3,090,000 $1,792,200 $0 $0 $13,368,3001.00$ General & Administration $ $0 $300,000 $300,000 $300,000 $300,000 $174,000 $0 $0 $1,374,0000.10$ Reclamation $0 $30,000 $30,000 $30,000 $30,000 $17,400 $0 $0 $137,400
Total Operating Cash Cost $ $0 -$3,536,100 -$5,676,000 -$6,120,000 -$6,120,000 -$3,549,600 $0 $0 -$25,001,700
RoyaltyCu Royalty $ $0 $0 $0 $0 $0 $0 $0 $0 $0Total Royalty Payment $ $0 $0 $0 $0 $0 $0 $0 $0 $0
Other Cash CostsConcentrate Charges
$92.00 Transport (t/concentrate) $ $0 $741,060 $558,808 $631,488 $938,400 $544,272 $0 $0 $3,414,028$80.00 Treatment (t/concentrate) $ $0 $644,400 $485,920 $549,120 $816,000 $473,280 $0 $0 $2,968,720$0.08 Cu Refining (lb/copper) $ $0 $389,474 $362,086 $416,064 $475,200 $275,616 $0 $0 $1,918,439
Total Concentrate Charges $ $0 -$1,774,934 -$1,406,814 -$1,596,672 -$2,229,600 -$1,293,168 $0 $0 -$8,301,187
Profit $ $0 $19,619,765 $16,305,034 $19,343,522 $22,556,713 $13,082,893 $0 $0 $90,907,927
Non Cash CostsDepreciation $ $0 $2,881,659 $3,021,324 $3,021,324 $3,337,780 $1,935,912 $0 $0 $14,198,000Amortisation $ $0Total Non Cash Cost $ $0 $2,881,659 $3,021,324 $3,021,324 $3,337,780 $1,935,912 $0 $0 $14,198,000
CASHFLOW Operating $ $0 $19,619,765 $16,305,034 $19,343,522 $22,556,713 $13,082,893 $0 $0 $90,907,927
CASHFLOW Total $ -$10,329,000 $16,750,765 $15,805,034 $19,343,522 $22,056,713 $13,082,893 $0 $1,272,500 $77,982,427
EBITDA $ $0 $19,619,765 $16,305,034 $19,343,522 $22,556,713 $13,082,893 $0 $0 $90,907,927
EBIT $ $0 $16,738,106 $13,283,710 $16,322,198 $19,218,933 $11,146,981 $0 $0 $76,709,927NPV $ $53,187,299
10.0%IRR 162%

55
8.2 150k Tonnes per Annum Table 8.2 is a summary of the project cashflow at a production rate of 150k tpa.
Table 8.2 150k tpa Cashflow Estimate
Year 0 1 2 3 4 5 6 7 8 9 10 TotalPhysicals
Tailings Mined 150,000 84,000 - - - - - - - - 234,000Cu (Head Grade) % 1.20 1.20 - - - - - - - - 1.20Ag (Head Grade) g/t 8.50 8.50 - - - - - - - - 8.50Au (Head Grade) g/t 0.13 0.13 - - - - - - - - 0.13Slag Mined - 66,000 74,000 - - - - - - - 140,000Cu (Head Grade) % - 0.90 0.90 - - - - - - - 0.90Ag (Head Grade) g/t - 6.00 6.00 - - - - - - - 6.00Au (Head Grade) g/t - 0.14 0.14 - - - - - - - 0.14Waste Mined - - 152,000 300,000 300,000 300,000 300,000 300,000 300,000 48,000 2,000,000Ore mined - - 76,000 150,000 150,000 150,000 150,000 150,000 150,000 24,000 1,000,000Cu (Head Grade) % - - 1.00 1.00 1.00 1.00 1.00 1.00 1.00 1.00 1.00Ag (Head Grade) g/t - - 8.50 8.50 8.50 8.50 8.50 8.50 8.50 8.50 8.50Au (Head Grade) g/t - - 0.13 0.13 0.13 0.13 0.13 0.13 0.13 0.13 0.13Total Movement t 150,000 150,000 302,000 450,000 450,000 450,000 450,000 450,000 450,000 72,000 3,374,000
Concentrate t 4,275 3,780 3,074 3,000 3,000 3,864 5,100 5,100 5,100 816 37,109Recovered Cu (Total) t 1,211 1,002 932 1,125 1,125 1,239 1,350 1,350 1,350 216 10,900Recovered Ag (Total) oz 30,416 25,627 25,213 30,744 30,744 33,860 36,893 36,893 36,893 5,903 293,185Recovered Au (Total) oz 451 296 287 470 470 518 564 564 564 90 4,275
Capital CostsPlant & Infrastructure Direct Capital Expenditure $ -$8,014,000 -$2,869,000 $0 $0 $0 $0 $0 $0 $0 $0 $0 -$10,883,000Permitting -$420,000 $0 $0 $0 $0 $0 $0 $0 $0 $0 $0 -$420,000Metallurgical Testing -$53,000 $0 $0 $0 $0 $0 $0 $0 $0 $0 $0 -$53,000Plant Sustaining Capital $0 $0 $0 -$500,000 $0 $0 -$500,000 $0 $0 $0 $0 -$1,000,000Mining Equipment Capital Expenditure $ $0 $0 $0 $0 $0 $0 $0 $0 $0 $0 $0 $0Other Direct Capital $0 $0 $0 $0 $0 $0 $0 $0 $0 $0 $0 $0
Residual Capital Return $0 $0 $0 $0 $0 $0 $0 $0 $0 $0 $1,088,300 $1,088,300Total Capital Cost $ -$8,487,000 -$2,869,000 $0 -$500,000 $0 $0 -$500,000 $0 $0 $0 $1,088,300 -$11,267,700
Capital cost - opening balance $ 0 -$8,487,000 -$10,116,262 -$8,876,524 -$8,066,954 -$6,757,383 -$5,447,813 -$4,518,050 -$3,088,287 -$1,658,525 -$228,762 -$57,245,560Capital expenditure $ -$8,487,000 -$2,869,000 $0 -$500,000 $0 $0 -$500,000 $0 $0 $0 $1,088,300 -$11,267,700Capital Value at Year End $ -$8,487,000 -$11,356,000 -$10,116,262 -$9,376,524 -$8,066,954 -$6,757,383 -$5,947,813 -$4,518,050 -$3,088,287 -$1,658,525 $859,538 -$68,513,260Depreciation $ $0 $1,239,738 $1,239,738 $1,309,570 $1,309,570 $1,309,570 $1,429,763 $1,429,763 $1,429,763 $1,429,763 -$859,538 $11,267,700Written Down Value $ -$8,487,000 -$10,116,262 -$8,876,524 -$8,066,954 -$6,757,383 -$5,447,813 -$4,518,050 -$3,088,287 -$1,658,525 -$228,762 $0 -$57,245,560Accumulated depreciation $ $0 $1,239,738 $2,479,476 $3,789,046 $5,098,617 $6,408,187 $7,837,950 $9,267,713 $10,697,475 $12,127,238 $11,267,700
Revenue10,000$ Revenue Cu $ $0 $12,114,000 $10,015,200 $9,323,040 $11,250,000 $11,250,000 $12,390,000 $13,500,000 $13,500,000 $13,500,000 $2,160,000 $109,002,240
30$ Revenue Ag $ $0 $912,486 $768,809 $756,378 $922,324 $922,324 $1,015,786 $1,106,789 $1,106,789 $1,106,789 $177,086 $8,795,5581,500$ Revenue Au $ $0 $676,154 $444,151 $430,800 $705,306 $705,306 $776,778 $846,368 $846,368 $846,368 $135,419 $6,413,017
Total Revenue $ $0 $13,702,640 $11,228,159 $10,510,218 $12,877,630 $12,877,630 $14,182,564 $15,453,156 $15,453,156 $15,453,156 $2,472,505 $124,210,815
Operating Cash Costs12.00$ Mining $ $0 $450,000 $450,000 $1,134,000 $1,800,000 $1,800,000 $1,800,000 $1,800,000 $1,800,000 $1,800,000 $288,000 $13,122,00016.00$ Processing $ $0 $1,800,000 $2,064,000 $2,400,000 $2,400,000 $2,400,000 $2,400,000 $2,400,000 $2,400,000 $2,400,000 $384,000 $21,048,000
1.80$ General & Administration $ $0 $270,000 $270,000 $270,000 $270,000 $270,000 $270,000 $270,000 $270,000 $270,000 $43,200 $2,473,2000.10$ Reclamation $0 $15,000 $15,000 $15,000 $15,000 $15,000 $15,000 $15,000 $15,000 $15,000 $2,400 $137,400
Total Operating Cash Cost $ $0 -$2,535,000 -$2,799,000 -$3,819,000 -$4,485,000 -$4,485,000 -$4,485,000 -$4,485,000 -$4,485,000 -$4,485,000 -$717,600 -$36,780,600
RoyaltyCu Royalty $ $0 $0 $0 $0 $0 $0 $0 $0 $0 $0 $0 $0Total Royalty Payment $ $0 $0 $0 $0 $0 $0 $0 $0 $0 $0 $0 $0
Other Cash CostsConcentrate Charges
$92.00 Transport (t/concentrate) $ $0 $393,300 $347,760 $282,808 $276,000 $276,000 $355,488 $469,200 $469,200 $469,200 $75,072 $3,414,028$80.00 Treatment (t/concentrate) $ $0 $342,000 $302,400 $245,920 $240,000 $240,000 $309,120 $408,000 $408,000 $408,000 $65,280 $2,968,720$0.08 Cu Refining (lb/copper) $ $0 $213,206 $176,268 $164,086 $198,000 $198,000 $218,064 $237,600 $237,600 $237,600 $38,016 $1,918,439
Total Concentrate Charges $ $0 -$948,506 -$826,428 -$692,814 -$714,000 -$714,000 -$882,672 -$1,114,800 -$1,114,800 -$1,114,800 -$178,368 -$8,301,187
Profit $ $0 $10,219,133 $7,602,732 $5,998,404 $7,678,630 $7,678,630 $8,814,892 $9,853,356 $9,853,356 $9,853,356 $1,576,537 $79,129,027
Non Cash CostsDepreciation $ $0 $1,239,738 $1,239,738 $1,309,570 $1,309,570 $1,309,570 $1,429,763 $1,429,763 $1,429,763 $1,429,763 -$859,538 $11,267,700Amortisation $ $0Total Non Cash Cost $ $0 $1,239,738 $1,239,738 $1,309,570 $1,309,570 $1,309,570 $1,429,763 $1,429,763 $1,429,763 $1,429,763 -$859,538 $11,267,700
CASHFLOW Operating $ $0 $10,219,133 $7,602,732 $5,998,404 $7,678,630 $7,678,630 $8,814,892 $9,853,356 $9,853,356 $9,853,356 $1,576,537 $79,129,027
CASHFLOW $ -$8,487,000 $7,350,133 $7,602,732 $5,498,404 $7,678,630 $7,678,630 $8,314,892 $9,853,356 $9,853,356 $9,853,356 $2,664,837 $67,861,327
EBITDA $ $0 $10,219,133 $7,602,732 $5,998,404 $7,678,630 $7,678,630 $8,814,892 $9,853,356 $9,853,356 $9,853,356 $1,576,537 $79,129,027
EBIT $ $0 $8,979,395 $6,362,994 $4,688,834 $6,369,060 $6,369,060 $7,385,129 $8,423,594 $8,423,594 $8,423,594 $2,436,075 $67,861,327NPV $ $38,347,312
10.0%IRR 86%

56
9 Other Options
9.1 Toll Treatment at a Nearby Plant Sultan Corporation Limited is currently committed to developing the Peelwood project which is 20 kilometres south of Burraga. The Peelwood ore contains the base metals zinc, copper, lead from which they will produce both a zinc and copper concentrate, and therefore the processing circuit required would not be that dissimilar to the one proposed for processing at Burraga and could be readily modified to process Burraga material.
The Peelwood project will have a production rate of 112k tpa and with their current reserves of 360,000 tonnes the project will last 3.2 years. They have commenced the approvals process and are undertaking detail design in parallel and therefore it is anticipated that production would commence in approximately 18 months. Therefore the Peelwood plant would be available to accept Burraga material in approximately 4.7 years.
Figure 9.1 Location of Peelwood Relative to Burraga with Proposed Transport Route

57
Although Peelwood is only approximately 20 kilometres from Burraga there is no direct route between the two locations and material would have to be trucked 107 kilometres using the route marked in Figure 9.1. Using a trucking cost of $0.14 per tonne kilometre and inflating the Burraga process cost the toll treatment cost estimates shown in Table 9.1 were developed.
Item Tailings ($/t) Slag and Ore ($/t) Load and Haul 15.00 15.00 Toll Treatment 24.00 32.00 G & A 0.50 0.50 Total 39.50 47.50
Table 9.1 Toll Treatment Costs Using Peelwood Plant
No allowance has been made for any additional capital expenditure at Peelwood such as plant modifications and extensions to the tailings storage facility as these costs would be borne by the plant owner and allowed for in the toll treatment charge.
A cashflow has been developed for the toll treatment scenario and is shown in Table 9.2.

58
Table 9.2 Toll Treatment Cashflow
9.2 Toll Treatment of Other Ores There are quite a few other small base metal resources in the Burraga region and no operating plants to process the ores that potentially could be mined. Therefore it is reasonable to assume that there would be a demand for BEPL’s facility, once operations have ceased at Burraga, to toll treat ores from other small mines. No modelling of this option has been considered, however the total throughput of 300k tpa is used and an operating margin of $10/t this would generate $3M per year.
Year 0 1 2 3 4 5 6 7 8 9 10 11 12 13 TotalPhysicals
Tailings Mined 112,000 112,000 10,000 - - - - - - - - - - 234,000Cu (Head Grade) % 1.20 1.20 1.20 - - - - - - - - - - 1.20Ag (Head Grade) g/t 8.50 8.50 8.50 - - - - - - - - - - 8.50Au (Head Grade) g/t 0.13 0.13 0.13 - - - - - - - - - - 0.13Slag Mined - - 102,000 38,000 - - - - - - - - - 140,000Cu (Head Grade) % - - 0.90 0.90 - - - - - - - - - 0.90Ag (Head Grade) g/t - - 6.00 6.00 - - - - - - - - - 6.00Au (Head Grade) g/t - - 0.14 0.14 - - - - - - - - - 0.14Waste Mined - - - 148,000 224,000 224,000 224,000 224,000 224,000 224,000 224,000 224,000 60,000 2,000,000Ore mined - - - 74,000 112,000 112,000 112,000 112,000 112,000 112,000 112,000 112,000 30,000 1,000,000Cu (Head Grade) % - - - 1.00 1.00 1.00 1.00 1.00 1.00 1.00 1.00 1.00 1.00 1.00Ag (Head Grade) g/t - - - 8.50 8.50 8.50 8.50 8.50 8.50 8.50 8.50 8.50 8.50 8.50Au (Head Grade) g/t - - - 0.13 0.13 0.13 0.13 0.13 0.13 0.13 0.13 0.13 0.13 0.13Total Movement t 112,010 112,010 112,017 260,007 336,000 336,000 336,000 336,000 336,000 336,000 336,000 336,000 90,000 3,374,044
Mill Feed (Total) t 112,000 112,000 112,000 112,000 112,000 112,000 112,000 112,000 112,000 112,000 112,000 112,000 30,000 1,374,000Cu (Head Grade) % 1.20 1.20 0.93 0.97 1.00 1.00 1.00 1.00 1.00 1.00 1.00 1.00 1.00 1.02Ag (Head Grade) g/t 8.50 8.50 6.22 7.65 8.50 8.50 8.50 8.50 8.50 8.50 8.50 8.50 8.50 8.25Au (Head Grade) g/t 0.13 0.13 0.14 0.13 0.13 0.13 0.13 0.13 0.13 0.13 0.13 0.13 0.13 0.13
Concentrate t 3,192 3,192 2,427 2,278 2,240 2,240 2,290 2,998 3,808 3,808 3,808 3,808 1,020 37,109Recovered Cu (Total) t 905 905 580 741 840 840 848 941 1,008 1,008 1,008 1,008 270 10,900Recovered Ag (Total) oz 22,711 22,711 15,309 20,115 22,956 22,956 23,161 25,702 27,547 27,547 27,547 27,547 7,379 293,185Recovered Au (Total) oz 337 337 98 257 351 351 354 393 421 421 421 421 113 4,275
Capital CostsPlant & Infrastructure Direct Capital Expenditure $ $0 $0 $0 $0 $0 $0 $0 $0 $0 $0 $0 $0 $0 $0 $0Permitting -$420,000 $0 $0 $0 $0 $0 $0 $0 $0 $0 $0 $0 $0 $0 -$420,000Metallurgical Testing -$53,000 $0 $0 $0 $0 $0 $0 $0 $0 $0 $0 $0 $0 $0 -$53,000Plant Sustaining Capital $0 $0 $0 $0 $0 $0 $0 $0 $0 $0 $0 $0 $0 $0 $0Mining Equipment Capital Expenditure $ $0 $0 $0 $0 $0 $0 $0 $0 $0 $0 $0 $0 $0 $0 $0Other Direct Capital $0 $0 $0 $0 $0 $0 $0 $0 $0 $0 $0 $0 $0 $0 $0
Residual Capital Return $0 $0 $0 $0 $0 $0 $0 $0 $0 $0 $0 $0 $0 $0 $0Total Capital Cost $ -$473,000 $0 $0 $0 $0 $0 $0 $0 $0 $0 $0 $0 $0 $0 -$473,000
Capital cost - opening balance $ 0 -$473,000 -$433,583 -$394,167 -$354,750 -$315,333 -$275,917 -$236,500 -$197,083 -$157,667 -$118,250 -$78,833 -$39,417 $0 -$3,074,500Capital expenditure $ -$473,000 $0 $0 $0 $0 $0 $0 $0 $0 $0 $0 $0 $0 $0 -$473,000Capital Value at Year End $ -$473,000 -$473,000 -$433,583 -$394,167 -$354,750 -$315,333 -$275,917 -$236,500 -$197,083 -$157,667 -$118,250 -$78,833 -$39,417 $0 -$3,547,500Depreciation $ $0 $39,417 $39,417 $39,417 $39,417 $39,417 $39,417 $39,417 $39,417 $39,417 $39,417 $39,417 $39,417 $0 $473,000Written Down Value $ -$473,000 -$433,583 -$394,167 -$354,750 -$315,333 -$275,917 -$236,500 -$197,083 -$157,667 -$118,250 -$78,833 -$39,417 $0 $0Accumulated depreciation $ $0 $39,417 $78,833 $118,250 $157,667 $197,083 $236,500 $275,917 $315,333 $354,750 $394,167 $433,583 $473,000 $473,000
Revenue10,000$ Revenue Cu $ $0 $9,045,120 $9,045,120 $5,801,520 $7,410,480 $8,400,000 $8,400,000 $8,475,000 $9,405,000 $10,080,000 $10,080,000 $10,080,000 $10,080,000 $2,700,000 $109,002,240
30$ Revenue Ag $ $0 $681,323 $681,323 $459,276 $603,453 $688,668 $688,668 $694,817 $771,063 $826,402 $826,402 $826,402 $826,402 $221,358 $8,795,5581,500$ Revenue Au $ $0 $504,862 $504,862 $146,311 $385,666 $526,629 $526,629 $531,331 $589,636 $631,955 $631,955 $631,955 $631,955 $169,274 $6,413,017
Total Revenue $ $0 $10,231,304 $10,231,304 $6,407,107 $8,399,599 $9,615,297 $9,615,297 $9,701,148 $10,765,699 $11,538,357 $11,538,357 $11,538,357 $11,538,357 $3,090,631 $124,210,815
Operating Cash Costs12.00$ Mining $ $0 $0 $0 $0 $888,000 $1,344,000 $1,344,000 $1,344,000 $1,344,000 $1,344,000 $1,344,000 $1,344,000 $1,344,000 $360,000 $12,000,00015.00$ Load & Transport to Peelwood $ $0 $1,680,000 $1,680,000 $1,680,000 $1,680,000 $1,680,000 $1,680,000 $1,680,000 $1,680,000 $1,680,000 $1,680,000 $1,680,000 $1,680,000 $450,000 $20,610,00032.00$ Toll Treatment $ $0 $2,688,000 $2,688,000 $3,504,000 $3,584,000 $3,584,000 $3,584,000 $3,584,000 $3,584,000 $3,584,000 $3,584,000 $3,584,000 $3,584,000 $960,000 $42,096,000
0.50$ General & Administration $ $0 $56,000 $56,000 $56,000 $56,000 $56,000 $56,000 $56,000 $56,000 $56,000 $56,000 $56,000 $56,000 $15,000 $687,0000.10$ Reclamation $0 $11,200 $11,200 $11,200 $11,200 $11,200 $11,200 $11,200 $11,200 $11,200 $11,200 $11,200 $11,200 $3,000 $137,400
Total Operating Cash Cost $ $0 -$4,435,200 -$4,435,200 -$5,251,200 -$5,331,200 -$5,331,200 -$5,331,200 -$5,331,200 -$5,331,200 -$5,331,200 -$5,331,200 -$5,331,200 -$5,331,200 -$1,428,000 -$63,530,400
RoyaltyCu Royalty $ $0 $0 $0 $0 $0 $0 $0 $0 $0 $0 $0 $0 $0 $0 $0Total Royalty Payment $ $0 $0 $0 $0 $0 $0 $0 $0 $0 $0 $0 $0 $0 $0 $0
Other Cash CostsConcentrate Charges
$92.00 Transport (t/concentrate) $ $0 $293,664 $293,664 $223,284 $209,576 $206,080 $206,080 $210,680 $275,816 $350,336 $350,336 $350,336 $350,336 $93,840 $3,414,028$80.00 Treatment (t/concentrate) $ $0 $255,360 $255,360 $194,160 $182,240 $179,200 $179,200 $183,200 $239,840 $304,640 $304,640 $304,640 $304,640 $81,600 $2,968,720$0.08 Cu Refining (lb/copper) $ $0 $159,194 $159,194 $102,107 $130,424 $147,840 $147,840 $149,160 $165,528 $177,408 $177,408 $177,408 $177,408 $47,520 $1,918,439
Total Concentrate Charges $ $0 -$708,218 -$708,218 -$519,551 -$522,240 -$533,120 -$533,120 -$543,040 -$681,184 -$832,384 -$832,384 -$832,384 -$832,384 -$222,960 -$8,301,187
Profit $ $0 $5,087,886 $5,087,886 $636,357 $2,546,158 $3,750,977 $3,750,977 $3,826,908 $4,753,315 $5,374,773 $5,374,773 $5,374,773 $5,374,773 $1,439,671 $52,379,227
Non Cash CostsDepreciation $ $0 $39,417 $39,417 $39,417 $39,417 $39,417 $39,417 $39,417 $39,417 $39,417 $39,417 $39,417 $39,417 $0 $473,000Amortisation $ $0Total Non Cash Cost $ $0 $39,417 $39,417 $39,417 $39,417 $39,417 $39,417 $39,417 $39,417 $39,417 $39,417 $39,417 $39,417 $0 $473,000
CASHFLOW Operating $ $0 $5,087,886 $5,087,886 $636,357 $2,546,158 $3,750,977 $3,750,977 $3,826,908 $4,753,315 $5,374,773 $5,374,773 $5,374,773 $5,374,773 $1,439,671 $52,379,227
CASHFLOW $ -$473,000 $5,087,886 $5,087,886 $636,357 $2,546,158 $3,750,977 $3,750,977 $3,826,908 $4,753,315 $5,374,773 $5,374,773 $5,374,773 $5,374,773 $1,439,671 $51,906,227
EBITDA $ $0 $5,087,886 $5,087,886 $636,357 $2,546,158 $3,750,977 $3,750,977 $3,826,908 $4,753,315 $5,374,773 $5,374,773 $5,374,773 $5,374,773 $1,439,671 $52,379,227
EBIT $ $0 $5,048,469 $5,048,469 $596,940 $2,506,742 $3,711,561 $3,711,561 $3,787,492 $4,713,898 $5,335,356 $5,335,356 $5,335,356 $5,335,356 $1,439,671 $51,906,227NPV $ $25,246,831
10.0%IRR 1069%

59
10 Project Schedule The project schedule is detailed in Table 10.1 for the 300k tpa scenario. As detailed in section 2.0 the approvals process is quite lengthy and unfortunately on-site construction cannot commence until development approval has been granted. The process plant design stage has been paralleled with the last stage of the approval process to reduce the project construction phase. The length of the production phase of the project will depend on the throughput rate.

60
Table 10.1 Project Schedule
Item Month 1 2 3 4 5 6 7 8 9 10 11 12 13 14 15 16 17 18 19 20 21 22 23 24 Q1 Q2 Q3 Q4 Year 4 Year 5 Year 6 Year 7 Total
Approvals- Mining Lease Application -$15,000 -$15,000- Development Application -$5,000 -$5,000- Environmental Impact Statement -$100,000 -$100,000 -$100,000 -$100,000 -$400,000Sub Total -$15,000 $0 -$100,000 -$100,000 -$100,000 -$100,000 -$5,000 $0 $0 $0 $0 $0 $0 $0 $0 $0 $0 $0 $0 $0 $0 $0 $0 $0 $0 $0 $0 $0 $0 $0 $0 $0 -$420,000
Metallurgical Testwork- Amdel Testwork Program -$26,000 -$27,000 -$53,000Sub Total -$26,000 -$27,000 $0 $0 $0 $0 $0 $0 $0 $0 $0 $0 $0 $0 $0 $0 $0 $0 $0 $0 $0 $0 $0 $0 $0 $0 $0 $0 $0 $0 $0 $0 -$53,000
Design and Construction- Design -$81,000 -$81,000 -$81,000 -$243,000- Procurement Construction Management -$52,500 -$52,500 -$52,500 -$52,500 -$52,500 -$52,500 -$52,500 -$52,500 -$52,500 -$52,500 -$525,000- Equipment Purchase and Refurbish -$200,000 -$800,000 -$500,000 -$500,000 -$400,000 -$400,000 -$198,000 -$2,998,000- Site Establishment, Earth and Civil Works -$196,000 -$196,000 -$196,000 -$588,000- Installation -$325,000 -$325,000 -$325,000 -$327,000 -$1,302,000- Site Infrastructure -$400,000 -$400,000 -$400,000 -$400,000 -$402,000 -$2,002,000- Power Supply -$200,000 -$200,000 -$400,000- Commission -$200,000 -$200,000- Mobile Equipment -$150,000 -$200,000 -$350,000- Sundry -$150,000 -$150,000 -$50,000 -$350,000- Contingency -$200,000 -$300,000 -$396,000 -$896,000- Plant Upgrade for Slag and ROM Ore -$720,000 -$720,000 -$720,000 -$709,000 -$2,869,000Sub Total $0 $0 $0 $0 $0 $0 $0 $0 $0 $0 -$81,000 -$81,000 -$81,000 -$252,500 -$852,500 -$552,500 -$898,500 -$1,048,500 -$1,048,500 -$975,500 -$927,500 -$1,329,500 -$1,129,500 -$596,000 -$720,000 -$720,000 -$720,000 -$709,000 $0 $0 $0 $0 -$12,723,000
Ongoing Capital- TSF wall lifts -$500,000 -$500,000 -$1,000,000Sub Total $0 $0 $0 $0 $0 $0 $0 $0 $0 $0 $0 $0 $0 $0 $0 $0 $0 $0 $0 $0 $0 $0 $0 $0 $0 $0 $0 $0 -$500,000 $0 -$500,000 $0 -$1,000,000
Residual Capital Return- Plant Sale $1,272,000 $1,272,000Sub Total $0 $0 $0 $0 $0 $0 $0 $0 $0 $0 $0 $0 $0 $0 $0 $0 $0 $0 $0 $0 $0 $0 $0 $0 $0 $0 $0 $0 $0 $0 $0 $1,272,000 $1,272,000
Operating Cashflow $0 $0 $0 $0 $0 $0 $0 $0 $0 $0 $0 $0 $0 $0 $0 $0 $0 $0 $0 $0 $0 $0 $0 $0 $5,383,250 $5,383,250 $5,383,250 $5,383,250 $14,952,000 $16,836,000 $18,650,000 $6,217,000 $78,188,000
Total Expenditure -$41,000 -$27,000 -$100,000 -$100,000 -$100,000 -$100,000 -$5,000 $0 $0 $0 -$81,000 -$81,000 -$81,000 -$252,500 -$852,500 -$552,500 -$898,500 -$1,048,500 -$1,048,500 -$975,500 -$927,500 -$1,329,500 -$1,129,500 -$596,000 $4,663,250 $4,663,250 $4,663,250 $4,674,250 $14,452,000 $16,836,000 $18,150,000 $7,489,000 $65,264,000

61
11 Economic Comparison
A cash flow model was developed to conduct an economic analysis of the various project scenarios. Project construction capital cost estimates including pre-production costs, ongoing capital costs and capital depreciation have been included in the projections of Project cash flow. Table 11.1 below shows the results of this analysis. No allowance for inflation has been included.
Item 150k tpa 300k tpa Toll treatment T & S1 Total2 T & S Total T & S Total
Life of Mine (Yrs)
2.0
8.7
1.0
4.4
2.7
11.6
Total Mill Throughput (‘000t) Total Copper Produced (t) Total Silver Produced (oz) Total Gold Produced (oz)
374
2,575 65,679
796
1,374
10,900 293,185
4,275
374
2,575 65,679
796
1,374
10,900 293,185
4,275
374
2,575 65,679
796
1,374
10,900 293,185
4,275
Initial Project Capital Cost ($M) Deferred Capital Cost ($M) Life of Mine Operating Cost ($M)
8.5 1.7 9.0
8.5 3.9
45.1
10.3 1.7 6.7
10.3 3.9
33.3
0.5 0.0
18.0
0.5 0.0
71.8
NPV ($M)
- 0% Discount Rate - 10 % “ “
8.1 6.5
67.9 38.3
8.5 7.1
76.7 53.2
10.4 8.2
51.9 25.2
3 = Tailings and slag reprocessing 4 = Tailings, slag and ore processing
Table 11.1 Financial Summary

62
12 Conclusions and Recommendations The following conclusions and recommendations have been drawn from this study.
1. The study has shown that the economics of reprocessing the tailings are positive for the three scenarios considered.
2. Including 1.0 million tonne of ore @1.0% copper into each scenario considerably enhances the economics of the project.
3. If processing tailings and slag only is considered then toll treating at the nearby Peelwood plant is the best economic option, however the delay in this occurring probably excludes this option.
4. The 300k tpa scenario is the preferred option if all processing is to occur at the Burraga site.
5. The economics are sufficiently favourable to progress the 300k tpa option to feasibility study and the process of generating the necessary information for the study should commence.
6. Additional metallurgical test work is required on samples of tailings, slag and ore to generate information for a more detailed study.
7. Due to the length of the approval process it is recommended that this commences with the feasibility study by undertaking the EIS when the basics of the project has been determined.
13 References 1. Allwood, K., 2011. Independent Geologist’s Report on Exploration Licence 6463
(Burraga), New South Wales; Unpublished Company Report to Burraga Exploration Ltd.
2. Jackson, T. J., 2010. Email;