bureau of transportation statistics special...
TRANSCRIPT
SR-033
March 2012
A Decade of Change in Fuel Prices and U.S. Domestic Passenger Aviation OperationsBy Theresa Firestine and Jenny Guarino
Special ReportRITA Bureau of Transportation Statistics
Over the past decade, significant events have impacted U.S. domestic passenger aviation operations. These events include, but are not limited to the following:
• March to November 2001 and December 2007 to June 2009 economic recessions;
• September 11, 2001 terrorist acts;
• Severe Acute Respiratory Syndrome (SARS) outbreak in 2002;
• Airline mergers, including: American with Trans World (TWA) in 2001, US Airways with America West in 2005, Delta with Northwest in 2008, United with Conti-nental in 2010, and Southwest with AirTran in 2011;
• Adoption of new technologies such as the Required Navigation Performance (RNP) flight guidance tech-nology to fly more direct routes and thereby reduce fuel requirements;
• Streamlining of operations, including but not limited to the replacement of older aircraft with newer, more fuel efficient aircraft; and
• Upward trend in the cost of fuel.
This report looks at changes in U.S. domestic passenger aviation operations that have occurred during the same time frame as the events listed above, with particular focus on those related to fuel price increases. Major findings include:
• Fuel price increases over the past decade coincided with reduced profits and, in many cases, operating losses among carriers. Operating costs include, but are not limited to, flying operations, maintenance, and passenger service.
• Airfares trended downward despite an upward trend in fuel costs. The downward trend in airfares coincided with increased decoupling of airfares with services,
such as baggage check, reservation changes, and food and drink purchases, all of which accounted for a larger portion of total revenue in 2010 than in 2000.
• Carriers reduced capacity on many routes when the cost of fuel was high.
• Carriers improved the number of available seat miles (ASMs)1 flown per gallon of fuel (fuel productivity) and the number of gallons consumed per block hour (fuel efficiency).2 This improvement coincides with airlines using newer and more fuel efficient jets.
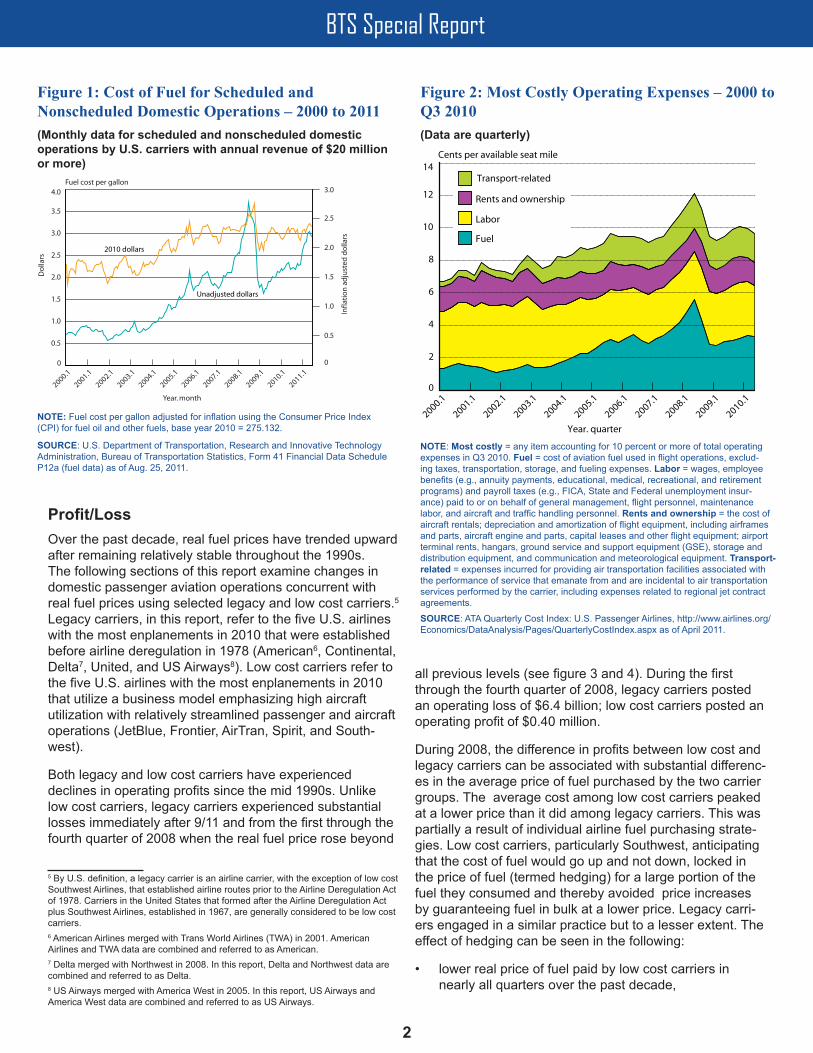
Fuel Cost and Operating ExpensesIn June 2011, U.S. air carriers with an annual revenue of $20 million or more paid on average $2.94 per gallon of fuel for scheduled and nonscheduled domestic service—5 percent more than what they paid in June 2010 and 51 percent more than what they paid in June 2000 after ad-justing for inflation3 (see figure 1).
The rise in the cost of fuel since 2000 has resulted in fuel becoming one of aviation’s largest operating expenses. In 2000, the cost of labor was 2.5 times that of fuel, but in 2010, the cost of labor and fuel were nearly identical with each accounting for about 25 percent of all operating expenses (see figure 2).4
1 Available seat miles (ASMs) are airline specific. As such, the number of ASMs may differ from carrier to carrier even when operating the same aircraft due to carrier specific configurations of seats (e.g., first class options do not exist with all carriers).2 Block hours are defined as the time elapsed from the moment an aircraft pushes back from the departure gate until the moment of engine shutoff at the arrival gate following its landing.3 Fuel cost per gallon adjusted for inflation using the Consumer Price Index (CPI) for fuel oil and other fuels, base year 2010 = 275.132. 4 In 2000, airlines paid $14.1 billion for fuel and $34.5 billion for labor. On average, airlines paid $3.5 billion for fuel and $8.6 billion for labor in a quarter. In the third quarter of 2010, airlines paid $8.4 billion for fuel and $8.2 billion for labor.
BTS Special Report
2
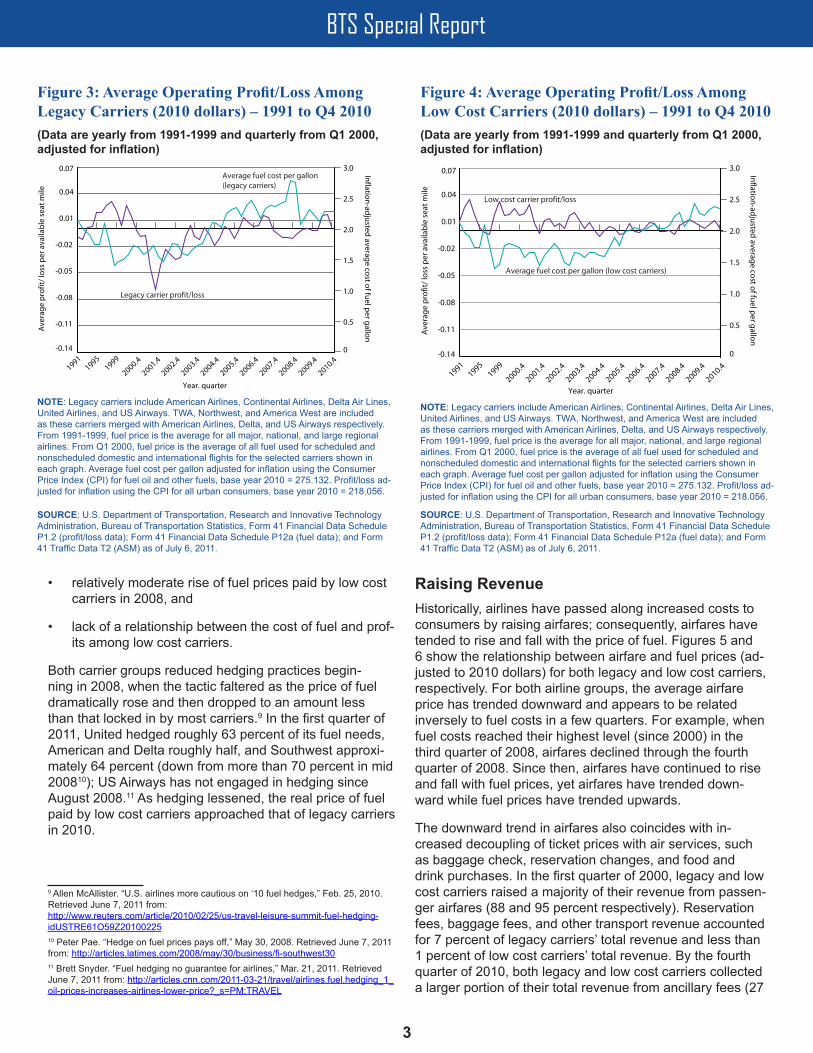
Profit/LossOver the past decade, real fuel prices have trended upward after remaining relatively stable throughout the 1990s. The following sections of this report examine changes in domestic passenger aviation operations concurrent with real fuel prices using selected legacy and low cost carriers.5 Legacy carriers, in this report, refer to the five U.S. airlines with the most enplanements in 2010 that were established before airline deregulation in 1978 (American6, Continental, Delta7, United, and US Airways8). Low cost carriers refer to the five U.S. airlines with the most enplanements in 2010 that utilize a business model emphasizing high aircraft utilization with relatively streamlined passenger and aircraft operations (JetBlue, Frontier, AirTran, Spirit, and South-west).
Both legacy and low cost carriers have experienced declines in operating profits since the mid 1990s. Unlike low cost carriers, legacy carriers experienced substantial losses immediately after 9/11 and from the first through the fourth quarter of 2008 when the real fuel price rose beyond
5 By U.S. definition, a legacy carrier is an airline carrier, with the exception of low cost Southwest Airlines, that established airline routes prior to the Airline Deregulation Act of 1978. Carriers in the United States that formed after the Airline Deregulation Act plus Southwest Airlines, established in 1967, are generally considered to be low cost carriers. 6 American Airlines merged with Trans World Airlines (TWA) in 2001. American Airlines and TWA data are combined and referred to as American.7 Delta merged with Northwest in 2008. In this report, Delta and Northwest data are combined and referred to as Delta.8 US Airways merged with America West in 2005. In this report, US Airways and America West data are combined and referred to as US Airways.
all previous levels (see figure 3 and 4). During the first through the fourth quarter of 2008, legacy carriers posted an operating loss of $6.4 billion; low cost carriers posted an operating profit of $0.40 million.
During 2008, the difference in profits between low cost and legacy carriers can be associated with substantial differenc-es in the average price of fuel purchased by the two carrier groups. The average cost among low cost carriers peaked at a lower price than it did among legacy carriers. This was partially a result of individual airline fuel purchasing strate-gies. Low cost carriers, particularly Southwest, anticipating that the cost of fuel would go up and not down, locked in the price of fuel (termed hedging) for a large portion of the fuel they consumed and thereby avoided price increases by guaranteeing fuel in bulk at a lower price. Legacy carri-ers engaged in a similar practice but to a lesser extent. The effect of hedging can be seen in the following:
• lower real price of fuel paid by low cost carriers in nearly all quarters over the past decade,
Figure 1: Cost of Fuel for Scheduled and Nonscheduled Domestic Operations – 2000 to 2011(Monthly data for scheduled and nonscheduled domestic operations by U.S. carriers with annual revenue of $20 million or more)
2000.1
2001.1
2002.1
2003.1
2004.1
2005.1
2006.1
2007.1
2008.1
2009.1
2010.1
2011.10
0.5
1.0
1.5
2.0
2.5
3.0
3.5
4.0
Unadjusted dollars
Fuel cost per gallon
Infla
tio
n a
dju
sted
do
llars
Do
llars
Year. month
0
0.5
1.0
1.5
2.0
2.5
3.0
2010 dollars
NOTE: Fuel cost per gallon adjusted for inflation using the Consumer Price Index (CPI) for fuel oil and other fuels, base year 2010 = 275.132.
SOURCE: U.S. Department of Transportation, Research and Innovative Technology Administration, Bureau of Transportation Statistics, Form 41 Financial Data Schedule P12a (fuel data) as of Aug. 25, 2011.
Figure 2: Most Costly Operating Expenses – 2000 to Q3 2010(Data are quarterly)
2000.1
2001.1
2002.1
2003.1
2004.1
2005.1
2006.1
2007.1
2008.1
2009.1
2010.10
2
4
6
8
10
12
14
Fuel
Labor
Rents and ownership
Transport-related
Cents per available seat mile
Year. quarter
NOTE: Most costly = any item accounting for 10 percent or more of total operating expenses in Q3 2010. Fuel = cost of aviation fuel used in flight operations, exclud-ing taxes, transportation, storage, and fueling expenses. Labor = wages, employee benefits (e.g., annuity payments, educational, medical, recreational, and retirement programs) and payroll taxes (e.g., FICA, State and Federal unemployment insur-ance) paid to or on behalf of general management, flight personnel, maintenance labor, and aircraft and traffic handling personnel. Rents and ownership = the cost of aircraft rentals; depreciation and amortization of flight equipment, including airframes and parts, aircraft engine and parts, capital leases and other flight equipment; airport terminal rents, hangars, ground service and support equipment (GSE), storage and distribution equipment, and communication and meteorological equipment. Transport-related = expenses incurred for providing air transportation facilities associated with the performance of service that emanate from and are incidental to air transportation services performed by the carrier, including expenses related to regional jet contract agreements.
SOURCE: ATA Quarterly Cost Index: U.S. Passenger Airlines, http://www.airlines.org/Economics/DataAnalysis/Pages/QuarterlyCostIndex.aspx as of April 2011.
BTS Special Report
3
• relatively moderate rise of fuel prices paid by low cost carriers in 2008, and
• lack of a relationship between the cost of fuel and prof-its among low cost carriers.
Both carrier groups reduced hedging practices begin-ning in 2008, when the tactic faltered as the price of fuel dramatically rose and then dropped to an amount less than that locked in by most carriers.9 In the first quarter of 2011, United hedged roughly 63 percent of its fuel needs, American and Delta roughly half, and Southwest approxi-mately 64 percent (down from more than 70 percent in mid 200810); US Airways has not engaged in hedging since August 2008.11 As hedging lessened, the real price of fuel paid by low cost carriers approached that of legacy carriers in 2010.
9 Allen McAllister. “U.S. airlines more cautious on ‘10 fuel hedges,” Feb. 25, 2010. Retrieved June 7, 2011 from:http://www.reuters.com/article/2010/02/25/us-travel-leisure-summit-fuel-hedging-idUSTRE61O59Z20100225 10 Peter Pae. “Hedge on fuel prices pays off,” May 30, 2008. Retrieved June 7, 2011 from: http://articles.latimes.com/2008/may/30/business/fi-southwest3011 Brett Snyder. “Fuel hedging no guarantee for airlines,” Mar. 21, 2011. Retrieved June 7, 2011 from: http://articles.cnn.com/2011-03-21/travel/airlines.fuel.hedging_1_oil-prices-increases-airlines-lower-price?_s=PM:TRAVEL
Raising RevenueHistorically, airlines have passed along increased costs to consumers by raising airfares; consequently, airfares have tended to rise and fall with the price of fuel. Figures 5 and 6 show the relationship between airfare and fuel prices (ad-justed to 2010 dollars) for both legacy and low cost carriers, respectively. For both airline groups, the average airfare price has trended downward and appears to be related inversely to fuel costs in a few quarters. For example, when fuel costs reached their highest level (since 2000) in the third quarter of 2008, airfares declined through the fourth quarter of 2008. Since then, airfares have continued to rise and fall with fuel prices, yet airfares have trended down-ward while fuel prices have trended upwards.
The downward trend in airfares also coincides with in-creased decoupling of ticket prices with air services, such as baggage check, reservation changes, and food and drink purchases. In the first quarter of 2000, legacy and low cost carriers raised a majority of their revenue from passen-ger airfares (88 and 95 percent respectively). Reservation fees, baggage fees, and other transport revenue accounted for 7 percent of legacy carriers’ total revenue and less than 1 percent of low cost carriers’ total revenue. By the fourth quarter of 2010, both legacy and low cost carriers collected a larger portion of their total revenue from ancillary fees (27
Figure 3: Average Operating Profit/Loss Among Legacy Carriers (2010 dollars) – 1991 to Q4 2010(Data are yearly from 1991-1999 and quarterly from Q1 2000, adjusted for inflation)
19911995
1999
2000.4
2001.4
2002.4
2003.4
2004.4
2005.4
2006.4
2007.4
2008.4
2009.4
2010.4
-0.14
-0.11
-0.08
-0.05
-0.02
0.01
0.04
0.07
0
0.5
1.0
1.5
2.0
2.5
3.0
Ave
rag
e p
rofit
/ lo
ss p
er a
vaila
ble
sea
t m
ile
Legacy carrier profit/loss
Inflatio
n-ad
justed
average co
st of fu
el per g
allon
Average fuel cost per gallon (legacy carriers)
Year. quarter
NOTE: Legacy carriers include American Airlines, Continental Airlines, Delta Air Lines, United Airlines, and US Airways. TWA, Northwest, and America West are included as these carriers merged with American Airlines, Delta, and US Airways respectively. From 1991-1999, fuel price is the average for all major, national, and large regional airlines. From Q1 2000, fuel price is the average of all fuel used for scheduled and nonscheduled domestic and international flights for the selected carriers shown in each graph. Average fuel cost per gallon adjusted for inflation using the Consumer Price Index (CPI) for fuel oil and other fuels, base year 2010 = 275.132. Profit/loss ad-justed for inflation using the CPI for all urban consumers, base year 2010 = 218.056.
SOURCE: U.S. Department of Transportation, Research and Innovative Technology Administration, Bureau of Transportation Statistics, Form 41 Financial Data Schedule P1.2 (profit/loss data); Form 41 Financial Data Schedule P12a (fuel data); and Form 41 Traffic Data T2 (ASM) as of July 6, 2011.
Figure 4: Average Operating Profit/Loss Among Low Cost Carriers (2010 dollars) – 1991 to Q4 2010(Data are yearly from 1991-1999 and quarterly from Q1 2000, adjusted for inflation)
19911995
1999
2000.4
2001.4
2002.4
2003.4
2004.4
2005.4
2006.4
2007.4
2008.4
2009.4
2010.4
-0.14
-0.11
-0.08
-0.05
-0.02
0.01
0.04
0.07
Ave
rag
e p
rofit
/ lo
ss p
er a
vaila
ble
sea
t m
ile
Low cost carrier profit/loss
Inflatio
n-ad
justed
average co
st of fu
el per g
allon
Average fuel cost per gallon (low cost carriers)
0
0.5
1.0
1.5
2.0
2.5
3.0
Year. quarter
NOTE: Legacy carriers include American Airlines, Continental Airlines, Delta Air Lines, United Airlines, and US Airways. TWA, Northwest, and America West are included as these carriers merged with American Airlines, Delta, and US Airways respectively. From 1991-1999, fuel price is the average for all major, national, and large regional airlines. From Q1 2000, fuel price is the average of all fuel used for scheduled and nonscheduled domestic and international flights for the selected carriers shown in each graph. Average fuel cost per gallon adjusted for inflation using the Consumer Price Index (CPI) for fuel oil and other fuels, base year 2010 = 275.132. Profit/loss ad-justed for inflation using the CPI for all urban consumers, base year 2010 = 218.056.
SOURCE: U.S. Department of Transportation, Research and Innovative Technology Administration, Bureau of Transportation Statistics, Form 41 Financial Data Schedule P1.2 (profit/loss data); Form 41 Financial Data Schedule P12a (fuel data); and Form 41 Traffic Data T2 (ASM) as of July 6, 2011.

BTS Special Report
4
and 4 percent respectively) and a smaller percent from pas-senger airfares (69 and 90 percent respectively).12
Changes in Airline OperationsRising fuel costs can coincide with changes in airline opera-tions. These changes include reductions in capacity and in the fuel burned by aircraft.
Changes in CapacityThe relationship between the cost of fuel and airline capac-ity, as measured by available seat miles (ASMs), can be seen in figure 7, which shows the cost of fuel per gallon and domestic passenger capacity on routes operated by both legacy and low cost carriers. ASMs are a commonly used measure of airline capacity and are defined as the number of available seats multiplied by miles flown. This metric measures capacity changes resulting from both adjustments in flight schedules and the size of the aircraft used on a flight segment. A reduction in the number of flights and/or the substitution of smaller aircraft reduces capacity as measured in ASMs.
Both legacy and low cost carriers reduced capacity in recent years (see figure 7). Legacy carriers began reducing
12 U.S. Department of Transportation, Research and Innovative Technology Administration, Bureau of Transportation Statistics, Form 41 Financial Data P1.2 as of July 6, 2011.
capacity in the face of post-9/11 challenges and competi-tion from expanding low cost carriers. These capacity re-ductions accelerated after fuel prices began to rise in 2008. Low cost airlines expanded capacity during the early years of the decade. Reductions occurred during the 2008 rise in fuel prices and while expansions have since occurred, capacity has not returned to the pre-2008 level.
Changes in Fuel BurnAirline productivity and efficiency has changed over the past decade. Productivity most commonly is measured by the number of ASMs per gallon of fuel consumed (ASM/g) and fuel efficiency by the number of gallons consumed per block hour.13 The productivity and efficiency of a particular aircraft varies from one flight to another because of differ-ences in distance, payload, weather, cruising speed, alti-tude, and other factors. For example, shorter flights spend a greater percentage of flight time climbing and descend-ing.
As seen in figure 8, productivity improvements achieved by legacy carriers have coincided with rising fuel prices. On average, productivity has risen 14.5 percent from the first quarter of 2000 to the fourth quarter of 2010, from 55.4 to 64.8 ASM/g. Of the legacy carriers examined, Continental
13 Block hours are defined as the elapsed time from the moment an aircraft pushes back from the departure gate until the moment of engine shutoff at the arrival gate following its landing.
Figure 5: Average Cost of Airfare for Domestic Flights Operated by Legacy Carriers (2010 dollars) – Q1 2000 to Q4 2010(Data are quarterly, adjusted for inflation)
2000.1
2001.1
2002.1
2003.1
2004.1
2005.1
2006.1
2007.1
2008.1
2009.1
2010.1400
420
440
460
480
500
520
540
560
580
600
Infla
tio
n-a
dju
sted
ave
rag
e ai
rfar
e
Legacy carrier average airfare
0
0.5
1.0
1.5
2.0
2.5
3.0 Inflatio
n-ad
justed
average p
rice of fu
el per g
allon
Average fuel cost per gallon
Year. quarter
NOTE: Fuel price is the average of all fuel used for scheduled and nonscheduled do-mestic flights for the selected carriers shown in each graph. Average airfare adjusted for inflation using the Consumer Price Index (CPI) for airline fare, base year 2010 = 278.186. Average fuel cost per gallon adjusted for inflation using the CPI for fuel oil and other fuels, base year 2010 = 275.132. Legacy carriers include American Airlines, Continental Airlines, Delta Air Lines, United Airlines, and US Airways. TWA, Northwest, and America West are included as these carriers merged with American Airlines, Delta, and US Airways, respectively.
SOURCE: U.S. Department of Transportation, Research and Innovative Technology Administration, Bureau of Transportation Statistics, OND (U.S. Carriers, average airfare) and Form 41 Financial Data Schedule P12a (fuel data) as of July 6, 2011.
Figure 6: Average Cost of Airfare for Domestic Flights Operated by Low Cost Carriers (2010 dollars) – Q1 2000 to Q4 2010(Data are quarterly, adjusted for inflation)
2000.1
2001.1
2002.1
2003.1
2004.1
2005.1
2006.1
2007.1
2008.1
2009.1
2010.1
260
280
300
320
340
360
Infla
tio
n-a
dju
sted
ave
rag
e ai
rfar
e
0
0.5
1.0
1.5
2.0
2.5
3.0 Inflatio
n-ad
justed
average p
rice of fu
el per g
allon
Low cost carrier average airfare
Average fuel cost per gallon
Year. quarter
NOTE: Fuel price is the average of all fuel used for scheduled and nonscheduled do-mestic flights for the selected carriers shown in each graph. Average airfare adjusted for inflation using the Consumer Price Index (CPI) for airline fare, base year 2010 = 278.186. Average fuel cost per gallon adjusted for inflation using the CPI for fuel oil and other fuels, base year 2010 = 275.132. Low cost carriers include JetBlue Airways, Frontier Airlines, AirTran Airways, Spirit Airlines, and Southwest Airlines.
SOURCE: U.S. Department of Transportation, Research and Innovative Technology Administration, Bureau of Transportation Statistics, OND (U.S. Carriers, average airfare) and Form 41 Financial Data Schedule P12a (fuel data) as of July 6, 2011.

BTS Special Report
5
reported the highest productivity in 2010 and increased its productivity the most, with about a 21 percent increase.14
The overall productivity of the low cost carriers appears to have been equally impacted (see figure 9). On aver-age, low cost carrier ASM/g increased from 57.8 in the first quarter of 2000 to 68.9 in the fourth quarter of 2010, an increase of 11.1 ASM/g (or 16.0 percent).15 JetBlue main-tained its high productivity while AirTran, Southwest, and Spirit reported a large increase that brought their productiv-ity number closer to that of JetBlue.
Average aircraft age also affects carrier efficiency. The marginally greater improvement in ASM/g among legacy carriers follows, in part, from the carriers’ greater need to replace older aircraft. In 2009, the legacy carriers’ fleet was twice as old as those of the low cost carriers (see figure 10). Low cost carriers have newer aircraft than legacy carri-ers as all low cost airlines, with the exception of Southwest, began operation in the mid to the late 1990s. Omitting Southwest, the average age of aircraft flown by the low cost carriers is 5.9 years compared to 13.8 years for legacy carriers.
14 Observations with available seat miles per gallon in the top 1 percent or bottom 1 percent of all values (in Q1 2000 through Q3 2010) are excluded from these statistics as they are suspected outliers. Data from: U.S. Department of Transportation, Research and Innovative Technology Administration, Bureau of Transportation Statistics, Form 41 Traffic Data T2 (U.S. carriers) as of July 11, 2011.15 ASMs per gallon for Frontier Airlines is excluded from the average for both 2000 and 2010 because data reported by Frontier for the fourth quarter of 2010 appears to be misreported as it is notably lower than in all other quarters (see figure 4).
Figure 7: Cost per Gallon of Fuel and Available Seat Miles on Domestic Flight Segments Operated by Both Legacy and Low Cost Carriers – January 1990 to March 2011(Data are monthly)
1990.1
1992.1
1994.1
1996.1
1998.1
2000.1
2002.1
2004.1
2006.1
2008.1
2010.10
20,000
40,000
60,000
80,000
10,000
12,000
Legacy carrier ASM
Low cost carrier ASM
Ava
ilab
le s
eat
mile
s o
n s
har
ed o
rig
in-d
esti
nat
ion
pai
rs
Fuel o
il and
oth
er fuels in
dex (C
PI)(B
ase: 1982–1984 = 100)
0
50
100
150
200
250
300
350
400
450
Fuel price index
Year. month
NOTE: Legacy carriers include American Airlines, Continental Airlines, Delta Air Lines, United Airlines, and US Airways. TWA, Northwest, and America West were included as these carriers merged with American Airlines, Delta, and US Airways respectively. Low cost carriers include JetBlue Airways, Frontier Airlines, AirTran Airways, Spirit Airlines, and Southwest Airlines.
SOURCE: U.S. Department of Transportation, Research and Innovative Technol-ogy Administration, Bureau of Transportation Statistics, Form 41 Traffic Data T100 Domestic Segment (U.S. carriers) as of July 6, 2011; Consumer Price Index, U.S. City Average, Fuel Oil and Other Fuels (Series ID CUUR0000SEHE), not seasonally adjusted (Base period 1982-84=100).
Figure 8: Average Available Seat Miles per Gallon (ASM/g) of Fuel Among Legacy Carriers – Q1 2000 to Q4 2010(Data are quarterly)
2000.1
2001.1
2002.1
2003.1
2004.1
2005.1
2006.1
2007.1
2008.1
2009.1
2010.145
50
55
60
65
70
75
Ave
rag
e av
aila
ble
sea
t m
ile p
er g
allo
n
0
0.5
1.0
1.5
2.0
2.5
3.0 Inflatio
n-ad
justed
average co
st of fu
el per g
allon
Average fuel cost per gallon
Legacy carrier ASM/g
Year. quarter
NOTE: Legacy carriers include American Airlines, Continental Airlines, Delta Air Lines, United Airlines, and US Airways. TWA, Northwest, and America West included as these carriers merged with American Airlines, Delta, and US Airways respectively. US Airways’ data in Q4 of 2000 and Q3 of 2002 excluded because of suspected misreporting (data signficiantly different from that in other quarters and that of other carriers). P5.2 data is used for 4th Quarter 2010 fuel use data.
SOURCE: U.S. Department of Transportation, Research and Innovative Technology Administration, Bureau of Transportation Statistics, Form 41 Traffic Data T2 (U.S. Car-riers) as of July 11, 2011.
Figure 9: Average Available Seat Miles per Gallon (ASM/g) of Fuel Among Low Cost Carriers – Q1 2000 to Q4 2010(Data are quarterly)
2000.1
2001.1
2002.1
2003.1
2004.1
2005.1
2006.1
2007.1
2008.1
2009.1
2010.145
50
55
60
65
70
75
Ave
rag
e av
aila
ble
sea
t m
ile p
er g
allo
n
0
0.5
1.0
1.5
2.0
2.5
3.0
Inflatio
n-ad
justed
average co
st of fu
el per g
allon
Low cost carrier ASM/g
Average fuel cost per gallon
Year. quarter
NOTE: Low cost carriers include JetBlue Airways, Frontier Airlines, AirTran Airways, Spirit Airlines, and Southwest Airlines. Frontier’s data in Q3 2000, Q1 2002, Q2 2010, and Q4 2010 and Spirit’s data in Q3 2010 excluded because of suspected misreport-ing (data signficantly different from that in other quarters and that of other carriers). P5.2 data is used to for 4th Quarter 2010 fuel use data.
SOURCE: U.S. Department of Transportation, Research and Innovative Technology Administration, Bureau of Transportation Statistics, Form 41 Traffic Data T2 (U.S. car-riers) as of July 11, 2011.

BTS Special Report
6
The number of gallons of fuel consumed during aircraft operation (measured in terms of block hours) also can be used to examine changes in fuel burn. Table 2 shows the change in the number of gallons of fuel consumed per block hour from the fourth quarter of 2000 to the fourth quarter 2010 (the most recent data point). In table 2, it can be seen that:
• All low cost carriers, with the exception of Frontier (which reported significantly below average fuel con-sumption in the fourth quarter of 2010), required fewer gallons of fuel per block hour in 2010.
• Spirit demonstrated the greatest improvement, requir-ing 14 percent less fuel per block hour. The improve-ment was due, in part, to Spirit replacing its McDonnell Douglas DC-9 aircraft with more fuel efficient aircraft.16
• With the exception of Delta, improvements in efficiency among legacy carriers were small or nonexistent. In 2010, Delta used 7 percent fewer gallons per block hour than in 2000. Delta’s improvement resulted par-tially from the airline abandoning large passenger jets
16 Spirit first began scheduled domestic operations using the McDonnell Douglas DC-9-30 in 1992. From 1992-1997, 99.9 percent or more of scheduled domestic ASMs were provided on this aircraft. ASMs on the McDonnell Douglas DC-9-30 gradually declined and by 2004, this aircraft was no longer used for scheduled domestic flights. In 2010, 11.7 percent of all scheduled domestic ASMs were offered on the Airbus Industries A320, 78.7 percent on the Airbus Industries A319, and 9.6 percent on the Airbus Industries A321. (SOURCE: U.S. Department of Transportation, Research and Innovative Technology Administration, Bureau of Transportation Statistics, Form 41 Traffic Data T100 Domestic Data as of April 29, 2011)
(three or more engines) in favor of smaller, more fuel efficient aircraft.17
The changes in productivity and efficiency reflect changes in carrier fleets. As noted above, carriers have turned away from using three- to six-engine jets for domestic flights and toward using two-engine passenger jets. The two-engine
17 In 2000, 22 percent of Delta’s ASMs were on aircraft with three or more engines compared to 0.02 percent in 2010 (Source: U.S. Department of Transportation, Research and Innovative Technology Administration, Bureau of Transportation Statistics, Form 41 Traffic Data T100 Domestic Segment (U.S. Carriers) as of July 6, 2011).
Table 1: Available Seat Miles Per Gallon – Q1 2000 and Q4 2010(Data are quarterly)
Carrier Q1 2000 Q4 2010 % changeLegacy 55.4 64.8 14.51 American 55.1 62.4 11.59 Continental 55.6 70.7 21.30 Delta 53.6 65.0 17.49 United Airlines 58.3 62.8 7.26 US Airways 55.9 66.6 16.06Low cost 57.8 68.9 16.03 Jet Blue 73.5 71.2 -3.20 Frontier 64.9 48.7 -33.09 AirTran 43.3 64.8 33.14 Spirit 56.0 75.4 25.77 Southwest 59.4 68.6 13.38NOTE: Data from TWA, Northwest, and America West are included as these carriers merged with American Airlines, Delta, and US Airways respectively. The large change in available seat miles per gallon for Frontier appears to be due to suspected misreporting of data in Q4 2010. P5.2 data is used for Q4 2010 fuel use data.
SOURCE: U.S. Department of Transportation, Research and Innovative Technol-ogy Administration, Bureau of Transportation Statistics, Form 41 Traffic Data T2 (U.S. Carriers) and Form 41 Financial Data Schedule P5.2 as of July 11, 2011.
Figure 10: Average Aircraft Age (in 2009) by Year of First Operations
American
Delta
U.S. Airways
Continental
United
Spirit
AirTranFrontier
JetBlueSouthwest
20
15
10
5
01920 1930 1940 1950 1960 1970 1980 1990 2000 2010
First year of operations
Legacy Low cost
Ave
rag
e ai
rcra
ft a
ge
(in 2
009)
SOURCE: U.S. Department of Transportation, Research and Innovative Technology Administration, Bureau of Transportation Statistics, Form 41 Financial Data Schedule B43 Inventory as of Apr. 29, 2011.
Table 2: Gallons of Fuel per Block Hour by Carrier – Q1 2000 and Q4 2010(Data are quarterly)Carrier Q1 2000 Q4 2010 % changeLegacy 1,140.1 1,132.3 -0.69 American 1,122.4 1,149.2 2.39 Continental 1,081.4 1,057.7 -2.19 Delta 1,240.1 1,149.5 -7.30 United Airlines 1,296.3 1,341.8 3.51 US Airways 829.7 888.8 7.12Low Cost 768.5 734.9 -4.37 Jet Blue 777.2 745.4 -4.08 Frontier 749.6 1,074.1 43.28 AirTran 768.3 683.7 -11.01 Spirit 894.2 766.6 -14.27 Southwest 761.8 709.5 -6.87NOTE: Data from TWA, Northwest, and America West are included as these carriers merged with American Airlines, Delta, and US Airways respectively. The large change in available seat miles per gallon for Frontier appears to be due to suspected misreporting of data in Q4 2010. P5.2 data is used for Q4 2010 fuel use data.
SOURCE: U.S. Department of Transportation, Research and Innovative Technol-ogy Administration, Bureau of Transportation Statistics, Form 41 Traffic Data T2 (U.S. Carriers) and Form 41 Financial Data Schedule P5.2 as of July 11, 2011.

BTS Special Report
7
jets, such as the Airbus Industrie A321, require less fuel than aircraft with more engines, such as the Boeing 747 (four engine) and the McDonnell Douglas MD-11 (three engine) (see figure 11 and table 3). In 2000, 65.2 billion ASMs (10.4 percent of domestic ASMs) were offered on three-engine passenger jets making a scheduled domestic flight; by 2010, ASMs on these same aircraft fell to zero as three-engine jets were phased out from use for domestic flights. ASMs on four- and six-engine passenger jets also declined, dropping from 5.6 billion ASMs (0.89 percent) in 2000 to 505.4 million ASMs (0.09 percent) in 2010.
Data on the operational fuel economy of the above jets are available for all flight segments (scheduled and nonsched-uled) provided by the selected carriers originating or ending at a U.S. location. Scheduled and nonscheduled flights operating with three, four, and six-engine passenger jets achieved lower operational fuel productivity in 2010 than two-engine passenger jets (after achieving nearly the same fuel productivity in 2000) and required significantly more gallons of fuel per block hour (see table 4) in both 2000 and 2010. For an hour flight in 2000, two-engine passenger jets required an average of 1,001 gallons of fuel while three-engine passenger jets required 1,755 gallons and four- and six-engine passenger jets required 3,469 gallons. The
gallons required per block hour by each aircraft improved between 2000 and 2010.
The higher fuel requirements of three, four, and six-engine jets result from the inefficiency of their greater number of engines. Per seat mile, the difference may be less as jets with a larger number of engines typically provide more capacity. Year to year, jets will achieve different levels of efficiency and productivity due to variations in the way carri-ers operate them and in the segments on which they are flown (see table 4).
The above fuel productivity and efficiency averages by number of engines mask significant variation within the engine groups. Table 5 shows this variation for selected two-engine passenger aircraft operated by U.S. carriers in 2010. As shown in the table:
• Low cost carriers achieved the highest level of produc-tivity on the Airbus Industrie A321 at 131.3 ASM/g in 2010. The aircraft was operated only by Spirit. Legacy carriers achieved a lower level of productivity on the same aircraft and a higher level on the Boeing 737-900, which was operated by Continental alone.
• Low cost carriers achieved the best fuel efficiency on the aircraft on which they achieved the best pro-ductivity—the Airbus Industrie A321. Legacy carriers achieved the best fuel efficiency on a different aircraft—the Boeing 737-300 (operated, among legacy carriers, by Continental and US Airways). In 2010, the Airbus Industrie A321 required 635 gallons of fuel per block hour and the Boeing 737-300 required 750 gallons of fuel per block hour—115 more gallons of fuel on a 1 hour flight despite it being a somewhat smaller aircraft than the Boeing jet.
Figure 11: Percent of Available Seat Miles on Domestic Flight Segments for Passenger Aircraft by Jet Type – Legacy and Low Cost Carriers – Q1 2000 to Q1 2011(Data are quarterly)
2000.1
2001.1
2002.1
2003.1
2004.1
2005.1
2006.1
2007.1
2008.1
2009.1
2010.1
2011.180
82
84
86
88
90
92
94
96
98
100Percent
2-Engine
3-Engine
4-/6-Engine
Year. quarter
NOTE: Legacy carriers include American Airlines, Continental Airlines, Delta Air Lines, United Airlines, and US Airways. TWA, Northwest, and America West are included as these carriers merged with American Airlines, Delta, and US Airways respectively. Low cost carriers include JetBlue Airways, Frontier Airlines, AirTran Airways, Spirit Airlines, and Southwest Airlines.
SOURCE: U.S. Department of Transportation, Research and Innovative Technology Administration, Bureau of Transportation Statistics, Form 41 Financial Data Schedule B43 Inventory as of Apr. 29, 2011.
Table 3: Available Seat Miles on Domestic Flight Segments for Passenger Aircraft by Number of Jet Engines – Legacy and Low Cost Carriers
Two- engine
Three-engine
Four-/six-
engine2000 Available seat miles
(millions) 559,045.41 65,199.48 5,628.61Percent 88.76 10.35 0.89
2010 Available seat miles (millions) 532,821.06 0 505.42Percent 99.91 0 0.09
NOTE: Legacy carriers include American Airlines, Continental Airlines, Delta Air Lines, United Airlines, and US Airways. TWA, Northwest, and America West included as these carriers merged with American Airlines, Delta, and US Airways respectively. Low cost carriers include JetBlue Airways, Frontier Airlines, AirTran Airways, Spirit Airlines, and Southwest Airlines. No available seat miles provided on three-engine jets in 2010.
SOURCE: U.S. Department of Transportation, Research and Innovative Technology Administration, Bureau of Transportation Statistics, Form 41 Traffic Data T100 Domes-tic Segment (U.S. Carriers) as of July 6, 2011.

BTS Special Report
8
The operational differences in productivity across two-engine aircraft generally result from physical variation in the aircraft themselves (e.g., capacity and the weight of the aircraft and its components, such as service carts, body modifications to improve aerodynamics, etc.) and from operational variation, including but not limited to carrier adoption of efficiency improving technologies (e.g., naviga-tion systems); carrier maintenance schedules; and average flight segment distance, time, and weather conditions.18
The effect of carrier specific factors on aircraft fuel produc-tivity can be seen in tables 6 and 7. Tables 6 and 7 show that not all major legacy and low cost U.S. carriers operate the aircraft shown in table 5 and not all achieve the same ASM/g. In 2010, 2 of the 10 major carriers (US Airways and Spirit) operated the Airbus A321, a high productivity aircraft. The highest productivity (88 ASM/g) of any of the carri-ers was noted on Delta’s Boeing 757-300, an aircraft that averaged a lower productivity than the Airbus A321 when considering the carriers in each group.
The different fuel productivity of the same aircraft across carriers reflects a variety of operational differences, includ-ing but not limited to stage length, payload factor, weather conditions on the segments flown, fuel saving technologies adopted, and aircraft retrofits. For example, a few carriers,
18 See Mayerowitz, Scott. “Airlines positioned for big gains in efficiency,” Miami Herald, July 4, 2011. Retrieved July 11, 2011 from: http://www.miamiherald.com/2011/07/04/2298876/airlines-positioned-for-big-gains.html
such as Southwest, have begun to use Required Naviga-tion Performance (RNP) flight guidance technology to fly more direct routes and thereby reduce fuel requirements.19 The adoption of such technologies has coincided with re-cent increases in the cost of fuel.
Net ImpactsFuel price increases have coincided with rising ancillary fees and changes in airline operations, including but not limited to reductions in capacity and increases in fuel pro-ductivity and efficiency. Such changes already have been
19 See: “Southwest Airlines’ Pilots Begin Flying Required Navigation Performance Efficient Procedures at 11 Airports,” Jan. 11, 2011. Retrieved July 11, 2011 from: http://www.prnewswire.com/news-releases/southwest-airlines-pilots-begin-flying-required-navigation-performance-efficient-procedures-at-11-airports-113275099.html
Table 4: Fuel Productivity and Efficiency of Passenger Aircraft by Number of Jet Engines - Legacy and Low Cost Carriers
Two- engine
Three-engine
Four-/six-engine
Fuel productivity (available seat miles per gallon*)2000 56.0 43.1 54.12010 65.8 N/A 58.7Fuel efficiency (gallons per block hour*)2000 1,001.2 1,755.2 3,469.32010 982.8 N/A 3,312.5KEY: N/A = No three-engine passenger aircraft used by selected carriers. * Includes all scheduled and nonscheduled flights on passenger aircraft.
NOTE: Data in all quarters of 2000 and 2010 included. Legacy carriers include: American Airlines, Continental Airlines, Delta Air Lines, United Airlines, and US Airways. TWA, Northwest, and America West included as these carriers merged with American Airlines, Delta, and US Airways respectively. Low cost carriers include: JetBlue Airways, Frontier Airlines, AirTran Airways, Spirit Airlines, and Southwest Airlines. P5.2 data is used to for Q4 2010 fuel use data.
SOURCE: U.S. Department of Transportation, Research and Innovative Technol-ogy Administration, Bureau of Transportation Statistics, Form 41 Traffic Data T2 (U.S. Carriers) and Form 41 Financial Data Schedule P5.2 as of July 11, 2011.
Table 5: Fuel Productivity and Efficiency of Selected Passenger Aircraft, 2010 (Q1 through Q4) – Legacy and Low Cost Carriers
Aircraft Code
Aircraft/Carrier type
Seat miles per gallon
Gallons per block hour
LegacyLow cost Legacy
Low cost
612Boeing 737-700/700lr 64.4 72.9 757.2 692.8
614 Boeing 737-800 77.4 N/A 796.7 N/A619 Boeing 737-300 57.2 61.6 750.0 747.5622 Boeing 757-200 69.7 N/A 1,054.0 N/A623 Boeing 757-300 77.3 N/A 1,175.1 N/A
625Boeing 767-200/Er/Em 56.3 N/A 1,439.4 N/A
626Boeing 767-300/300er 63.3 N/A 1,592.4 N/A
634 Boeing 737-900 82.4 N/A 861.4 N/A
655McDonnell Doug-las DC-9 Super* 51.7 N/A 942.5 N/A
694Airbus Industrie A320-100/200 70.7 77.4 793.3 771.3
699Airbus Industrie A321 78.0 131.3 925.2 634.8
KEY: N/A = No three-engine passenger aircraft used by selected carriers. *80/Md81/82/83/88
NOTE: Legacy carriers include American Airlines, Continental Airlines, Delta Air Lines, United Airlines, and US Airways. Low cost carriers include JetBlue Airways, Frontier Airlines, AirTran Airways, Spirit Airlines, and Southwest Airlines. Seat miles per gallon for the Airbus Industries A321 appear to be inflated due to suspected misreporting of data by Frontier in Q2 and Q4 of 2010. P5.2 data is used to for Q4 2010 fuel use data.
SOURCE: U.S. Department of Transportation, Research and Innovative Technology Administration, Bureau of Transportation Statistics, Form 41 Traffic Data T2 (U.S. Carriers) and Form 41 Financial Data Schedule P5.2 as of July 11, 2011.

BTS Special Report
9
noted with the rise of fuel prices in 201120 and are predicted to persist in 2012. Morgan Stanley, prior to American filing for bankruptcy, estimated available seat miles from Alaska, American, Delta, United, and US Airways would decline
20 Industry analysts have estimated that if the cost of fuel rises to and carriers purchase fuel at an average of $3.00 per gallon in 2011, U.S. airlines face an estimated $15 billion increase in their fuel bill (as compared to 2010). See: John Heimlich. “The Price of Jet Fuel and Its Impact on U.S. Airlines,” Mar. 29, 2011. Retrieved Apr. 26, 2011 from: http://www.airlines.org/News/Letters/Pages/Oped_03-09-2011.aspx
by 0.6 percent in 2012. Conversely, Frontier, Jet Blue, and Southwest are predicted to increase capacity, although by less than 1 percent following a 5 percent growth in 2011.21
21 Jay Boehmer. “Analysts Project Lower 2012 U.S. Carrier Capacity,” Business Travel News, Dec. 7, 2011. Retrieved Jan. 5, 2012 from: http://www.businesstravelnews.com/Business-Travel/Analysts-Project-Lower-2012-U-S--Carrier-Capacity/?ida=Airlines&a=mgmt
Table 6: Fuel Productivity (Available Seat Miles per Gallon) on Selected Passenger Aircraft for Legacy Carriers, 2010
American Airlines
Continental Air Lines
Delta Air Lines
United Air Lines
US Airways
Boeing 767-200/Er/Em 48.67 53.99 N/A N/A 60.58McDonnell Douglas DC-9 Super* 54.13 N/A 50.01 N/A N/ABoeing 737-700/700lr N/A 69.42 52.75 N/A N/ABoeing 737-300 N/A 59.88 N/A N/A 60.85Boeing 767-300/300er 64.51 N/A 63.48 59.91 N/ABoeing 757-300 N/A 65.7 83.53 N/A N/ABoeing 757-200 71.78 67.28 69.32 70.75 74.79Airbus Industrie A320-100/200 N/A N/A 71.43 70.49 74.38Boeing 737-800 74.28 78.65 77.91 N/A N/ABoeing 737-900 N/A 74.43 N/A N/A N/AAirbus Industrie A321 N/A N/A N/A N/A 76.29KEY: *80/Md81/82/83/88 N/A = aircraft not used
NOTE: Bolded value corresponds to aircraft, among the selected, that the carrier flew the most seat miles per gallon. For each carrier, avail-able seat miles per gallon shown only for the selected passenger aircraft operated by the carrier. If available seat miles are not shown, then the selected aircraft was not used by the carrier in 2010.
SOURCE: U.S. Department of Transportation, Research and Innovative Technology Administration, Bureau of Transportation Statistics, Form 41 Traffic Data T2 as of July 6, 2011.

BTS Special Report
10
About This Report Data
This special report is based on the following monthly and quarterly data reported to BTS:
• Air Carrier Financial Reports (Form 41 Financial), • AirCarrierStatistics(Form41Traffic),• Air Carrier Summary data, and • Airline Origin and Destination Survey data
For more information on the data used, please visit: http://www.transtats.bts.gov/
This article was prepared by Theresa Firestine, an Economist in the Bureau of Transportation Statistics (BTS), and Jenny Guarino, a Mathematical Statistician in BTS. BTS is a component of the U.S. Department of Transportation’s Research and Innovative Technol-ogy Administration (RITA). Both authors contributed equally.
Special thanks to Richard Leonard, a Transportation Specialist in the Office of Airline Information in BTS, for his rigorous reviews and assistance on this special report. For questions about this, or other BTS special reports, call 1-800-835-1351, email [email protected], or visit www.bts.gov.
Table 7: Fuel Productivity (Available Seat Miles per Gallon) on Selected Passenger Aircraft for Low Cost Carriers, 2010
JetBlue Airways
AirTran Airways
Frontier Airlines
Spirit Airlines
Southwest Airlines
Boeing 767-200/Er/Em N/A N/A N/A N/A N/AMcDonnell Douglas DC-9 Super* N/A N/A N/A N/A N/ABoeing 737-700/700lr N/A 71.31 N/A N/A 72.43Boeing 737-300 N/A N/A N/A N/A 61.64Boeing 767-300/300er N/A N/A N/A N/A N/ABoeing 757-300 N/A N/A N/A N/A N/ABoeing 757-200 N/A N/A N/A N/A N/AAirbus Industrie A320-100/200 78.51 N/A 68.15 75.36 N/ABoeing 737-800 N/A N/A N/A N/A N/ABoeing 737-900 N/A N/A N/A N/A N/AAirbus Industrie A321 N/A N/A N/A 80.95 N/AKEY: *80/Md81/82/83/88 N/A = aircraft not used
NOTE: Bolded value corresponds to aircraft, among the selected, that the carrier flew the most seat miles per gallon. For each carrier, avail-able seat miles per gallon shown only for the selected passenger aircraft operated by the carrier. If available seat miles are not shown, then the selected aircraft was not used by the carrier in 2010.
SOURCE: U.S. Department of Transportation, Research and Innovative Technology Administration, Bureau of Transportation Statistics, Form 41 Traffic Data T2 as of July 6, 2011.