bureau of meteorology, 1974 - australia's official weather
TRANSCRIPT

Bureau of Meteorology, 1974

2 Bureau of Meteorology, 1974
DEPARTMENT OF SCIENCE BUREAU OF METEOROLOGY
REPORT BY DIRECTOR OF METEOROLOGY
BRISBANE FLOODS JANUARY 1974
AUSTRALIAN GOVERNMENT PUBLISHING SERVICE CANBERRA 1974

3 Bureau of Meteorology, 1974
CONTENTS
FOREWORD....................................................................................................... 7
INTRODUCTION ................................................................................................ 8
FLOODS IN THE BRISBANE VALLEY.............................................................. 9
Geographical Description................................................................................................9
Types of Flooding.............................................................................................................9 Flash flooding in creeks .................................................................................................9 River flooding ..............................................................................................................11 Backwater flooding......................................................................................................11 Storm surges and tidal effects ......................................................................................12
The Effect of Dams.........................................................................................................12
Previous Floods ..............................................................................................................13
Flood Studies and Mitigation........................................................................................15
Organizational Arrangements With the Queensland State Authorities...................16
The Flood Forecasting and Warning System ..............................................................17 Brisbane Valley flood forecasting and warning system ..............................................18 Advance warning time in the Brisbane Valley ............................................................21
THE FLOOD OF JANUARY 1974 .................................................................... 22
The Meteorological Situation........................................................................................22
Rainfall............................................................................................................................26
Flooding ..........................................................................................................................32
Flood damage .................................................................................................................35
THE PERFORMANCE OF THE FLOOD WARNING SYSTEM IN JANUARY 1974.................................................................................................................. 40
Observations...................................................................................................................40
Communications ............................................................................................................41
Warning Services ...........................................................................................................41

4 Bureau of Meteorology, 1974
Brisbane River warnings..............................................................................................42 Metropolitan creek warnings .......................................................................................43 Flooding in the Ipswich area........................................................................................44 Public criticism ............................................................................................................44 Flood forecasts for Ipswich..........................................................................................45 The claim of inadequate warning.................................................................................45 Use of the Brisbane Port Office as the main flood forecast reference point................46 Claim of insufficient advance warning time for Port Office predictions.....................46 Frequency of flood warnings .......................................................................................47 Accuracy of rainfall and flood forecasts......................................................................47
CONCLUSIONS ............................................................................................... 49
APPENDIX 1: BRISBANE VALLEY FLOOD WARNING DISTRIBUTION LIST51
APPENDIX 2A: TEXT OF BRISBANE VALLEY FLOOD WARNINGS FROM 10.30 PM 24 JANUARY TO 5.30 AM 31 JANUARY 1974............................... 52
APPENDIX 2B: SPECIAL WARNINGS TO ABC, QRNS, MACQUARIE NEWS, RACQ, BRISBANE COMMERCIAL RADIO STATIONS.................................. 60
APPENDIX 3: TEXT OF BRISBANE METROPOLITAN CREEKS FLOOD WARNINGS FROM 7.45 AM 25 JANUARY TO 9.30 PM 26 JANUARY 1974 61

5 Bureau of Meteorology, 1974
LIST OF FIGURES
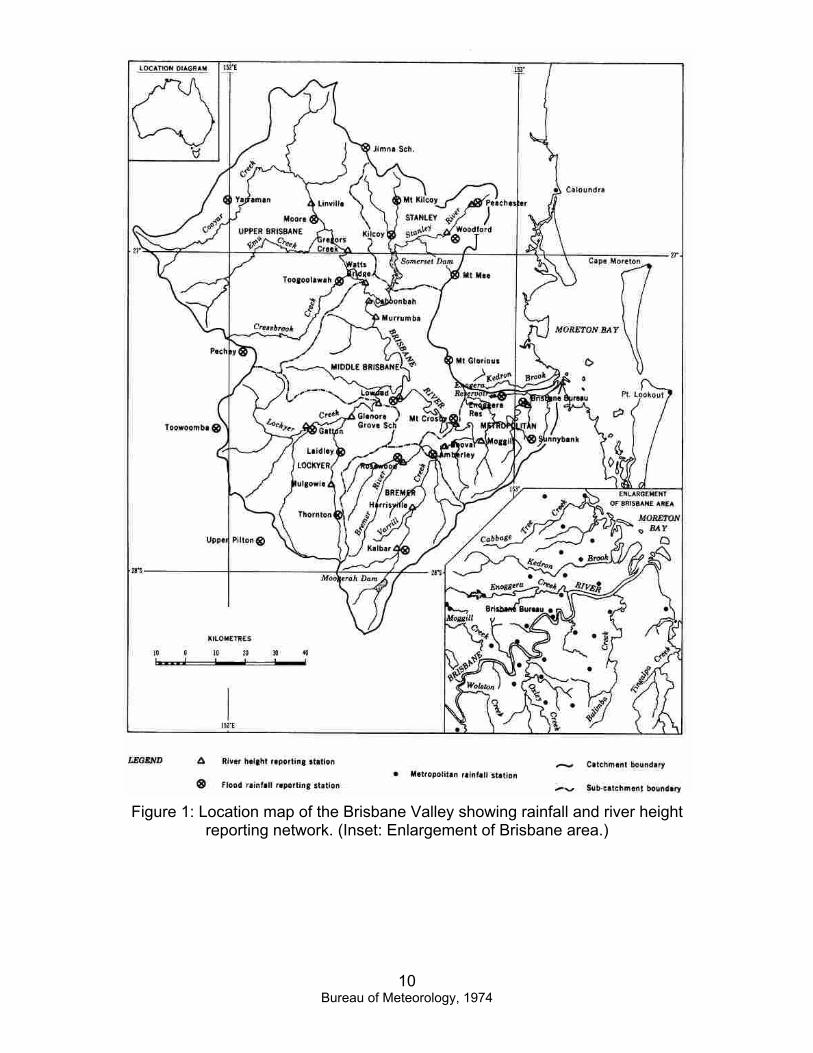
FIGURE 1: LOCATION MAP OF THE BRISBANE VALLEY SHOWING RAINFALL AND RIVER HEIGHT REPORTING NETWORK. (INSET: ENLARGEMENT OF BRISBANE AREA.) ....................................................... 10
FIGURE 2: FLOODS AT THE BRISBANE PORT OFFICE FROM 1841 TO 1974........................................................................................................................... 14
FIGURE 3: THE BRISBANE VALLEY TELEMETRY NETWORK. .................. 20
FIGURE 4:DISTRIBUTION OF DECILE RANGE NUMBERS OF RAINFALL IN JANUARY 1974................................................................................................ 23
FIGURE 5: SCHEMATIC DIAGRAM ILLUSTRATING THE MAIN METEOROLOGICAL INFLUENCES BETWEEN 22 –29 JANUARY 1974. ..... 24
FIGURE 6: MSL PRESSURE ANOMALIES FOR JANUARY 1974. ................ 25
FIGURE 7: RAINFALL ISOHYETS (MM) FOR THE 5 DAY PERIOD ENDED 9 AM TUESDAY 29 JANUARY 1974 .................................................................. 27
FIGURE 8: AVERAGE SUB-CATCHMENT RAINFALL (MM) OVER THE BRISBANE VALLEY FOR THE PERIOD 25 – 28 JANUARY 1974................. 28
FIGURE 9: FLOOD HYDROGRAPH OF THE BREMER RIVER AT IPSWICH 25 – 30 JANUARY 1974........................................................................................ 33
FIGURE 10: FLOOD HYDROGRAPHS OF KEDRON BROOK AT OSBORNE ROAD 24 – 27 JANUARY 1974. ...................................................................... 34
FIGURE 11: FLOOD HYDROGRAPHS OF THE BRISBANE RIVER AT THE PORT OFFICE 24 –31 JANUARY 1974, TOGETHER WITH OBSERVED AND PREDICTED TIDAL VARIATIONS................................................................... 36
FIGURE 12: THE APPROXIMATE EXTENT OF THE JANUARY 1974 FLOOD IN THE BRISBANE METROPOLITAN AREA.................................................. 37
6 Bureau of Meteorology, 1974
LIST OF TABLES
TABLE 1: OCCURRENCE OF FLOODS EXCEEDING 2.74 M AT THE BRISBANE PORT OFFICE BETWEEN 1841 AND 1974................................. 14
TABLE 2: BRISBANE RIVER SUB-CATCHMENT RAINFALLS (IN MM) FOR SOME PREVIOUS FLOODS............................................................................ 29
TABLE 3: BRISBANE RAINFALL STATISTICS JANUARY 1840 TO APRIL 1974.................................................................................................................. 30
TABLE 4: HIGHEST MONTHLY RAINFALL AT BRISBANE, JANUARY 1840 – APRIL 1974 ...................................................................................................... 30
TABLE 5: BRISBANE RAINFALL (MM) FOR VARIOUS DURATIONS AND RETURN PERIODS* ......................................................................................... 31
TABLE 6: HIGHEST 24-HOUR RAINFALL TOTALS (MM) AT BRISBANE JANUARY 1840 – APRIL 1974 ........................................................................ 31

7 Bureau of Meteorology, 1974
FOREWORD This report on the disastrous Brisbane floods of January 1974 records both the meteorological situation and the flooding, and examines the performance of the Brisbane Valley Flood Forecasting and Warning System during the flood situation. The near-record rains which produced the Brisbane floods were part of a pattern of unusually heavy rainfall over much of Australia during the 1973-74 summer. By late January almost every river in Queensland was in flood and in and around Brisbane the worst flooding this century caused damage estimated at around $200 million and resulted in 14 deaths. A flood warning system for the Brisbane Valley has been in operation for many years. The Bureau of Meteorology was aware of the likelihood of a recurrence of rainfalls over the Brisbane catchment as heavy as those which produced the record floods of 1893, and therefore commenced the development of a flood forecast system for the Brisbane Valley shortly after Cabinet, in 1957, charged it with the development of systematic flood forecasting services for Australia. By 1966 a system had been developed to permit the scientific formulation of flood warnings for the Brisbane River system including forecasts of flood height and time of occurrence at three sites on the lower reaches of the river. Further improvements and refinements have been effected since 1966. For the most part the warning system worked very well during the floods of January 1974 and the peak river height at the Brisbane Port Office was accurately forecast 21 hours in advance. Nevertheless, problems of dissemination and interpretation of the warnings, coupled with some reluctance by the community to accept the gravity of the situation, meant that the full value of the flood warning system was not achieved and some adverse criticism was subsequently directed, I believe without justification, at the Bureau. At the same time it is realised that the Bureau's flood prediction system needs further development and improvement. This report has been prepared by Mr A. J. Shields, Regional Director, Queensland and Mr A. B. Neal of the Research and Development Branch of the Bureau's Head Office with the assistance of several other Bureau officers in Brisbane and Melbourne, particularly Mr G. Heatherwick, Senior Hydrologist, Queensland Regional Office.
(W. J. GIBBS)
December 1974 Director of Meteorology

8 Bureau of Meteorology, 1974
INTRODUCTION In and around Brisbane (population approximately 911,000), the worst flooding this century occurred during the Australia Day holiday weekend (25-29 January 1974). At least 6,700 homes were partially or totally flooded in the Brisbane metropolitan area and floodwaters entered the gardens of about 6,000 other houses. Some houses were completely washed away in creek flooding, and others were badly damaged by subsidence and land slippage. In the nearby city of Ipswich (population 65,000), 1,800 residential or commercial premises were partially or totally inundated and 41 houses were washed away. The total damage in the Brisbane-Ipswich area has not yet been assessed, but some estimates place it near $200 million. Twelve people were drowned in the Brisbane and Ipswich area and an additional two died as a direct result of the floods. Several elderly people suffered fatal heart attacks while being evacuated from their flood ravaged homes, and a 2-year old child was swept from his father's arms and drowned in Oxley Creek near the Brisbane suburb of Inala. The flood also had a very heavy sociological impact on the community. In some metropolitan creek-side suburbs, residents returned to their homes early in the weekend and commenced cleaning up only to find themselves flooded out again soon after. Many people also discovered that their devastated homes, even though covered by storm and tempest insurance, did not have full flood indemnity. Some people have been permanently affected, both physically and mentally, by the shock of the flood and its aftermath. Although the community as a whole responded magnificently to the emergency, considerable difficulty was experienced, particularly in the early stages, in convincing people of the seriousness of the situation. This is a problem associated with the occurrence of any rare disastrous event, and emphasises the need for continuous public education on the nature of such events and how to prepare for them. In addition to documenting the flood, this report discusses the various types of flooding that can occur in the Brisbane Valley; the history of rainfall and flooding in Brisbane; the Brisbane Valley Flood Forecasting and Warning System, and a critical analysis of the system's operation in January 1974.
9 Bureau of Meteorology, 1974
FLOODS IN THE BRISBANE VALLEY
Geographical Description The Brisbane River rises in the Brisbane and Cooyar Ranges of the Great Divide, meanders through the Brisbane Valley and drains into Moreton Bay. The city of Brisbane straddles the river near its mouth. The river is fed by numerous tributaries, the principal ones being the Stanley and Bremer Rivers and Lockyer Creek in the middle reaches, and Oxley, Moggill, Bulimba, Enoggera and Breakfast Creeks in the lower reaches, within the metropolitan area. These are shown on the location map (Fig 1). The industrial city of Ipswich is on the lower Bremer River with the important Amberley RAAF base nearby. The rainfall catchment for the Brisbane River comprises about 13,400 sq km but to facilitate the assessment of flood potential this is divided into six sub-catchments: the Stanley, Lockyer, Bremer, Upper Brisbane, Middle Brisbane (between Esk and Mt Crosby) and metropolitan sub-catchments.
Types of Flooding At the commencement of a rain period most of the rainfall is absorbed by the ground. This is referred to as the 'initial loss' and is an important consideration in the assessment of flood potential. However, if the rain continues the ground will become saturated and the precipitation then runs off almost immediately, being carried away in a myriad of rivulets to creeks and streams. When rainfall is excessive these natural drains overflow and a flood results. The time- scale of the flooding and its extent depend on the size of the river or creek, the nature of its catchment and the duration and intensity of rainfall as well as a number of other factors. The following types of flooding occur in the Brisbane Valley, and it is important to distinguish between them.
Flash flooding in creeks Most creeks in the Brisbane metropolitan area and in the vicinity of Ipswich have a very rapid response to excessive rainfall. Flood waters rise and subsequently fall very rapidly and sometimes the whole flood can be over in less than 12 hours. In Brisbane, flash floods usually occur in a since 1967 have been associated with major synoptic weather systems that have produced continuous rain over at least 24 hours interspersed with short but very high intensity rainfall periods.
10 Bureau of Meteorology, 1974
Figure 1: Location map of the Brisbane Valley showing rainfall and river height reporting network. (Inset: Enlargement of Brisbane area.)

11 Bureau of Meteorology, 1974
Sometimes when intense rainfall is very localised, as in thunderstorms, flash floods may be confined to just one creek. This can also occur in normally dry gullies, even in residential areas. The Woden Valley storm* in the Canberra area in 1971 is an example of this type of flash flood. Oxley Creek, which has a much larger and flatter catchment than the other Brisbane creeks, has a much slower response time to intense rainfall. Hence it is less susceptible to flash 'floods, although several small tributary creeks, namely Stable Swamp Creek and Blunder Creek which enter Oxley Creek in the Rocklea area, do have flash floods in high intensity rain situations. These of course are on a smaller scale to major flooding in Oxley Creek as a whole.
River flooding This occurs on a much longer time-scale than creek and flash flooding. The river rises and falls slowly and may remain above flood height for up to a week. For major floods in Brisbane the peak usually occurs within 2 to 3 days of the river first reaching flood level, although it should be emphasised that the river behaves differently in each flood situation. Under non-flood conditions the Brisbane River is tidal almost to Mt Crosby and the tidal effect is also observed on the Bremer River at Ipswich. However, with increasing flood discharge the tidal variation is progressively damped out. This emphasises the importance of reading or listening to the flood forecasts, as well as the actual river heights, because in many areas an observed fall in the river level may be a tidal variation and may not necessarily mean that the flood peak has passed. It is also important to recognise that there is a flood gradient or slope on the floodwaters through the Brisbane metropolitan area, and that the water rises by different amounts in different suburbs. For example a rise of 5.5 m at the Brisbane Port Office could mean a rise of more than 14 m at Jindalee. These gradients have been incorporated in the Flood Map of Brisbane and Suburbs, which is available from the Queensland Survey Office.
Backwater flooding When the Brisbane River is in flood the river surface level in the main trunk stream at the junction of the tributary creeks and rivers causes water to back up into the tributaries. The addition of flood run-off from the tributaries causes higher backwater levels in the lower reaches of these tributaries. This type of flooding is *See “Final Report, Woden Valley Storm 26 January 1971” issued by the Director of Meteorology. January 1972.

12 Bureau of Meteorology, 1974
common in the Bremer River at Ipswich and the effect is also observed near the mouths of the Brisbane metropolitan creeks, Oxley Creek in particular.
Storm surges and tidal effects A storm surge is an increase in water level caused principally by atmospheric pressure reduction, and/or the wind set-up when strong winds pile up water in the general downwind direction. Storm surges are particularly important with tropical cyclones, but must be considered with any persistent strong wind condition, particularly when the water is constrained by a coastline and the depth becomes shallow, for the resulting surge can be considerably amplified. In the Brisbane region the wind set-up factor is usually more important, and persistent strong winds can maintain a surge for a number of days. If the surge coincides with the high tide, particularly if it is a spring tide, some low lying areas around Moreton Bay and in the Brisbane River, especially around Breakfast Creek, will be flooded. Indeed spring tide levels are only about 0.2 m below flood levels in some of these low-lying areas, and so it only requires a very small surge to produce flooding.
The Effect of Dams There are some small, fixed crest dams (e.g. Moogerah Dam and Enoggera Reservoir) in the Brisbane Valley that automatically mitigate floods to a small degree. However, the major mitigation of flooding is achieved by Somerset Dam, which has high capacity sluice and crest gates. A dam for a similar purpose, but with a larger capacity, is proposed at Wivenhoe for completion in about 1981. Somerset Dam is located on the Stanley River some 6 km above its confluence with the Brisbane River. This dam was commissioned for water supply in 1943, for partial flood mitigation in 1950 and full flood mitigation in 1956. Rainfall in the Stanley catchment is a major contributor to most Brisbane River floods and usually up to 25% of the total floodwaters pass Somerset Dam and can be controlled. Under favourable circumstances the dam can be shut down and the whole flow of the Stanley River can be stored whilst the peak of the flood wave from the Upper Brisbane River is passing the Stanley junction. Water is then emptied slowly from the dam over a period of about 2 days in readiness for another flood. Skilful operation is required to prevent the generation of secondary flood peaks which may cause renewed flooding or the prolongation of existing flooding. In situations where the major flood contribution occurs in catchments below Somerset Dam and the proposed Wivenhoe Dam, there are considerable problems in deciding when to empty the flood storage. If floodwaters were retained by the dam for too long not only would there be major and prolonged

13 Bureau of Meteorology, 1974
flooding upstream from the storage but the dam would become virtually useless for flood mitigation downstream in the event of a repetition of excessive rainfall. Meteorologically such a situation has already occurred (in 1893 when there were three floods within a month) and a recurrence appears inevitable.
Previous Floods A chart showing all the floods at the Brisbane Port Office since 1841 is presented in Fig 2. Prior to 1900 flooding occurred quite frequently at 1 to 8 year intervals and in one year (1893) four separate floods were recorded. Since 1900 flood rainfall has been much less frequent and the interval between floods has become much longer. Furthermore, dredging and other changes to the hydraulic character of the channel, together with the effect of Somerset Dam have reduced most floods in Brisbane in recent years and have eliminated the smaller floods. The monthly frequency of floods exceeding 2.74 m (9ft) at the Brisbane Port Office is given in Table 1. This shows that flooding is most common in the usual wet season months of January. February and March, and floods are rare from July to December. The earliest flood recorded was in 1841. Its exact height is uncertain but it was said to be the highest flood known at that time. In 1857 (flood peak 4.42 m) a good deal of land, now the prestige suburb of St Lucia, but then a dense vine scrub, was submerged and in 1864 (peak 4.92 m) flood waters extended from the junction of Oxley Creek and the Brisbane River to the high land at the back of Coopers Plains, a distance of about 11 km. In the 1867 flood the original wooden bridge at the site of the Victoria Bridge was destroyed, and in January 1887 (peak 4.92 m) Bowen Bridge was washed away. Three floods occurred during February 1893. During the first (peak 9.51 m) the ship Elamang and the gunboat Paluma were carried into and left aground in the Brisbane Botanical Gardens, and the ship Natone was stranded on the Eagle Farm flats. The Indooroopilly railway bridge and the north end of the old Victoria Bridge were washed away. Nine days later a second minor flood was experienced which attained a height of only 3.29 m. However, a week after that there was another major flood (peak 9.24 m) which carried the stranded Elamang, Paluma and Natone back into the Brisbane River! Prior to January 1974 no flood this century had exceeded 4.5 m at the Brisbane Port Office. The last river flood of any consequence occurred in 1931 (peak 4.48 m), although in recent years there have been several severe floods in the Brisbane metropolitan creeks (in June 1967 and February and April 1972).

14 Bureau of Meteorology, 1974
Figure 2: Floods at the Brisbane Port Office from 1841 to 1974.
(Heights referenced to Brisbane Port Office datum.)
Table 1: Occurrence of floods exceeding 2.74 m at the Brisbane Port Office between 1841 and 1974*. Month Number Month Number Month Number
Jan 10 May 1 Sep 0 Feb 9 Jun 3 Oct 1 Mar 7 Jul 1 Nov 0 Apr 4 Aug 1 Dec 0
Because of changes in the physical characteristics of the river and its catchment, it is very difficult to calculate return periods for flooding in Brisbane. However, four floods well in excess of the 1974 levels have occurred in the past 133 years

15 Bureau of Meteorology, 1974
and, according to the Professor of Economic Geology at the University of Queensland (Professor Sergent), there is geological evidence of water levels 5.5 m higher than the 1974 flood in the Indooroopilly area of Brisbane. Meteorological studies suggest that rainfalls well in excess of those recorded in the floods of 1893 and 1974 are possible. Therefore it seems certain that unless major flood mitigation schemes, such as the proposed Wivenhoe Dam, are implemented, floods even greater than those of 1974 will again be experienced in Brisbane.
Flood Studies and Mitigation In addition to its own meteorological investigations, the Bureau of Meteorology is actively cooperating with various Queensland State authorities in activities related to flooding problems in the Brisbane Valley. Following the major flash flooding in Brisbane suburban creeks in June 1967, the Bureau, the Brisbane City Council and the Queensland Irrigation and Water Supply Commission cooperated in establishing a hydrological data gathering network. During 1971 the Bureau and the Brisbane City Council jointly established a pluviograph network in suburban creek catchments to collect records of rainfall intensities, and during 1971 and 1972 the Bureau and the Irrigation Commission established a number of automatic stream height recording stations on Brisbane creeks. The pluviograph stations were fully established before the major flash floods of February and April 1972, caused by cyclones 'Daisy' and 'Emily' respectively. Some of the automatic stream height recording stations were also operational during these floods and much valuable rainfall and stream height data were collected. After the major flash floods of February and April 1972 in Brisbane creeks, the Queensland State Government commissioned three consulting engineering firms to study creek flooding and prepare feasibility reports on flood mitigation proposals. To coordinate the activities of the consultants, the State Government established an interdepartmental committee consisting of representatives from various State departments. The Bureau of Meteorology is also represented on this committee and has provided both the committee and consultants with considerable advice, assistance and data during the hydrological phase of the investigations. The feasibility studies have been completed and the creek flood mitigation project has now entered the design stage. As mentioned earlier the proposed Wivenhoe Dam is a multi-purpose water supply-flood mitigation project, and the Bureau has provided extreme precipitation estimates and other data to assist in its design. Since the January 1974 flood the Coordinator-General's Department of the Queensland State Government has established a committee to coordinate the

16 Bureau of Meteorology, 1974
collection of data on the extent of flooding in rivers in this region. The Bureau is also represented on this committee.
Organizational Arrangements With the Queensland State Authorities
The Queensland Government formed a State Disaster Relief (see Fig 3) Organization in 1970. This organization is segmented into complete districts, based on Police Districts, and the District Police Inspector acts as coordinator of the Organization in each District. In the Brisbane area several Police Districts are combined to form the Brisbane District Control Group. The State Disaster Relief Organization also has a Storm Surge Evacuation Committee to prepare plans for evacuation of coastal areas of Queensland subject to storm surge inundation. There is also a State Emergency Service (formerly the Civil Defence Organization) which is responsible to the police during emergency operations. The Bureau of Meteorology is a member of the Brisbane District Control Group of the State Disaster Relief Organization and also of the Storm Surge Evacuation Committee, but not of the State Emergency Service (since it is responsible to the police). Although the Bureau was not represented on the subcommittees that prepared standing orders designed to cope with weather induced disasters such as cyclone, bush fire and flood, it has provided information on the Brisbane Valley flood forecasting and warning system, and details of the effects of flooding in the event of recurrence of major floods in Brisbane. Details have also been provided on likely maximum storm surges in Moreton Bay, and winds associated with severe thunderstorms and cyclones. In addition to State Government departments, the Bureau has cooperated with the Brisbane City Council for many years on matters concerned with flooding in the Brisbane area. Very close ties, with free exchange of data and information for the Brisbane Valley during flood forecasting and warning operations, have developed with the Flood Control Section of the City Council. The Bureau and the Brisbane City Council hydrologists confer before the issue of each flood forecast for the Brisbane Port Office. The Flood Control Section then determines levels of inundation at up-river suburbs. The Works Department provides more detailed interpretation of areas and streets to be flooded and this information is passed on to the police for the raising of alarms and individual advices to residents. The Brisbane City Council also operates a flood advice service during flooding so that the general public may telephone for information related to likely flooding in specific areas. The Bureau and City Council have also had meetings to determine improved methods of disseminating warnings of flash flooding in Brisbane suburban

17 Bureau of Meteorology, 1974
creeks. The special problem here is the short warning time available as well as the need for speedy rainfall and creek height data acquisition and processing. This relationship developed out of a decision by the Queensland State Climatological Consultative Committee. This Committee comprises representatives of State Government departments, universities, and similar organizations having a direct interest in climatology, and meets twice a year under the chairmanship of the Regional Director of the Bureau in Queensland. The Committee discussed flood warning operations in detail in mid-1956, following the flood of March 1955, and agreed that the Bureau should issue public forecasts of flood heights at the Brisbane Port Office and that the Brisbane City Council would be responsible for detailed interpretation of areas to be flooded. The Committee discusses matters associated with flooding and flood warnings from time to time. Close ties have also developed between the Bureau and the Works Department of the Ipswich City Council over the last five years. During flooding, and at other times, staff from both organizations have frequent consultations and free exchange of data. This is a particularly important contact in periods of emergency in Ipswich as consultations include discussions on predicted heights and resultant inundation from these heights being reached.
The Flood Forecasting and Warning System Under the Australian Meteorology Act 1955, the Bureau of Meteorology is given responsibility, inter alia for
‘the issue of warnings of gales, storms and other weather conditions likely to endanger life or property, including weather conditions likely to give rise to floods...’
This definition of responsibility for flood warnings was partially clarified in April 1957 by a Cabinet decision making the Bureau the national authority for the collation, treatment and storage of hydrological data and the development of systematic flood forecasting services. To implement this, separate hydro-meteorological sections were established in the Bureau's major Regional Offices, including the Queensland Regional Office. The Bureau's flood prediction activities are: the daily preparation of bulletins of rainfall amount and river height, and
precipitation forecasts for periods up to 24 hours ahead; the issue of generalised warnings and forecasts of minor, moderate or major
flooding of rivers and streams; and

18 Bureau of Meteorology, 1974
the specific prediction of flood height and time of occurrence at nominated
reference points in selected river valleys. In this context: minor flooding causes inconveniences such as closing of minor roads and
submergence of low level bridges and makes the removal of river pumps necessary. The effect may be felt in the reach of the river in question in the vicinity of the gauge or at some distance upstream or downstream.
moderate flooding causes inundation of low lying areas requiring the removal
of stock and evacuation of houses. Main traffic bridges may be covered. major flooding causes inundation of large areas isolating towns and cities.
Major disruption occurs to road and rail communications and evacuation of many houses is required.
The Bureau does not accept responsibility for: issuing forecasts of river levels at points other than nominated reference
points; the extent of inundation of property resulting from flooding; or
road trafficability reports.
Brisbane Valley flood forecasting and warning system After considerable research, and the development of supporting facilities, a system for the Brisbane Valley was implemented by 1966 which enabled the scientific formulation of generalised flood warnings, in particular for
o the Upper Brisbane River, o the Stanley River, o the middle reaches of the Brisbane River between Esk and Mt
Crosby, o Lockyer Creek, o the Bremer River, and o the lower reaches of the Brisbane River; and
public forecasts of flood height and time of occurrence at
o the Brisbane Port Office, o Darra, and

19 Bureau of Meteorology, 1974
o Ipswich. The system has been further revised and developed in the light of experience gained from the several floods that have occurred in the middle and upper Brisbane Valley since 1966. Networks, communications and organisational arrangements have been substantially improved, and in 1973 a system (Fig 3) was designed to enable the telemetering of vital rainfall and river height information from 20 selected points direct to the Brisbane Bureau. Since these data are also necessary for the flood mitigating operation of Somerset Dam, the Brisbane City Council is contributing financially to the scheme. The total cost of equipment and installation is expected to be $427,000. Installation of this system had not been completed before January 1974. (The existing Brisbane Valley rainfall and river reporting network is shown in Fig 1.) In brief, there are four separate phases in the Bureau's Brisbane Valley Flood Forecasting and Warning System: Routine Assessment Phase A routine daily assessment is made by the
hydrologist of 'the initial loss' in the Brisbane Valley. This is simply the amount of rainfall that will be absorbed and lost before flood run-off will occur. A meteorologist predicts the rain potential over the catchment for the next 48 hours, and alerts the hydrologist if the predicted rainfall approaches or exceeds the initial loss.
Flood Precautionary Phase This is declared by the Bureau if the prevailing
and expected meteorological situation and the current degree of wetness of the Brisbane Valley indicate that flooding is possible in any of the sub-catchments. A statement of the flood potential is issued to the Brisbane City Council Flood Control Section and to the Police Department, and Bureau staff are placed on alert.
This procedure is designed to give the authorities up to 48 hours notice of the possibility of flooding but, to minimise the occurrence of false alarms, the general public are not warned at this stage.
To safeguard against a failure to predict flood rainfall, a network of 'heavy rainfall stations' has been established in the Brisbane Valley. These stations report as soon as their rainfall after the 9 am observation each day exceeds 50 mm, and continue to report at 50 mm intervals until instructed otherwise.

20 Bureau of Meteorology, 1974
Figure 3: The Brisbane Valley Telemetry network.
The 11 river level and 9 rainfall recording stations will transmit readings by radio to a base station at Mt Glorious and then to a control room at the Bureau of Meteorology, thus providing instant monitoring of rainfall and flood levels.

21 Bureau of Meteorology, 1974
Flood Alert Phase This is declared when flooding is highly probable in one or more of the sub-catchments. Preliminary generalised flood warnings are issued publicly for the appropriate sub-catchments and the special rainfall and river height reporting network is activated. If flood level is expected to be reached in Brisbane or Ipswich technical procedures are instigated in preparation for the Flood Forecasting Phase.
Flood Forecasting Phase This is declared if flood rainfall has occurred on
the upper reaches of the catchment, or if the Brisbane River has reached or is expected in the next 6 hours to reach any of the following levels:
2.44 m at the Brisbane Port Office, 3.66 m at Mt Crosby, 7.62 m at Lowood, or 9.14 m at Caboonbah.
Advance warning time in the Brisbane Valley The advance warning time available for the prediction of flood heights at the Brisbane Port Office varies according to the area from which the major run-off occurs. For floods generated in the Stanley and Upper Brisbane sub-catchments, forecasts up to 36 hours in advance can be provided. Predictions for the Port Office are usually made to synchronise with the occurrence of high tide and under normal circumstances a single flood warning will contain predictions of Port Office height for 12, 24 and 36 hours ahead. In floods where the major contribution is from the Bremer River sub-catchment, the maximum advance warning time at present for Port Office forecasts is about 22 hours. This warning time, especially for smaller floods, is substantially reduced in cases where the main contribution comes from the Brisbane metropolitan area and the region downstream from Ipswich and Mt Crosby. The response time between rainfall and run-off is very short in these cases. Because there are only a few hours between the onset of local high intensity rainfall and resultant flash flooding little advance warning time is possible for the Brisbane metropolitan creeks. The exception is Oxley Creek, where the time lapse is about 18 to 24 hours. For Ipswich a maximum of 28 hours advance warning is currently possible for backwater flooding but for a Bremer River catchment flood, only 8 to 12 hours warning can be given.

22 Bureau of Meteorology, 1974
THE FLOOD OF JANUARY 1974
The Meteorological Situation The wet season in tropical Australia is normally not well established until early January and the associated northwest monsoonal airflow is usually confined to the far northern parts of the continent. However, by mid-December 1973 the monsoonal trough was already well established over far northern Australia and continued a steady net southward progression during January 1974. This, combined with the remarkable strength and persistence of the monsoonal flow, resulted in very heavy rains over a large area of Queensland, the Northern Territory and adjacent parts of Western Australia, with many places receiving record January falls, and some stations exceeding their average annual rainfall by the end of January. Indeed, the January rainfall map (Fig 4) shows that above average rains occurred over most of Australia except for the southern part of Western Australia. In Queensland almost every river had been in flood, except the Dumaresq River on the southeast border. A schematic diagram of the controlling weather systems during the flood is shown in Fig 5. The monsoonal trough over Queensland in January 1974 was very well developed and located well south of its normal position. This is reflected in the pressure anomaly chart (Fig 6). The main rain mechanism responsible eventually for the Brisbane Valley floods had its beginning on 21 January as a weak low in the monsoonal trough near Willis Island. This system gradually deepened and moved southeast to be located about 600 km east of Mackay early on 23 January. During that day the low intensified further to become cyclone 'Wanda' and by late on 23 January it had recurved to a southwesterly track and was moving towards the coast. 'Wanda' crossed the coast near Double Island Point between 6 pm and 9 pm on 24 January but its central 'eye' had not developed sufficiently to produce the devastating winds of mature cyclones like the infamous 'Ada' and 'Althea'. However, it did produce mean winds of 70 to 80 km/hr south of the centre with some squalls up to 100 km/hr. After crossing the coast 'Wanda' continued on a southwesterly track towards Dalby, but it weakened rapidly and disappeared as a feature of the surface chart during Friday 25 January. Despite its rapid weakening, 'Wanda' played a major part in the generation of the floods because, in addition to providing the initial rain that saturated the Brisbane River catchment, it forced the monsoonal trough southwards to Brisbane itself. Here the trough persisted for several days and small oscillations in its movement and intensity resulted in several periods of very intense rainfall. The trough finally weakened and retreated northwards during Monday 28 January and a drier, and

23 Bureau of Meteorology, 1974
Figure 4:Distribution of decile range numbers of rainfall in January 1974

24 Bureau of Meteorology, 1974
Figure 5: Schematic diagram illustrating the main meteorological influences between 22 –29 January 1974.
The mean MSL pressure analysis (mb) is shown by the thin lines and the heavy dashed lines represent successive positions of the monsoonal trough. The broad arrow represents the track of cyclone ‘Wanda’. (Inset: Enlargement of south
Queensland coast showing landfall of cyclone ‘Wanda’.)

25 Bureau of Meteorology, 1974
Figure 6: MSL pressure anomalies for January 1974.
The isolines reveal the abnormality of the surface air flow over Australia and the unusual southward penetration of the monsoonal trough is reflected by the belt of below normal pressures across central Australia.

26 Bureau of Meteorology, 1974
cooler, southern maritime air mass moved in over Brisbane ending the protracted rain period. The other important weather system shown in Fig 5 is the large anticyclone in the Tasman Sea. This high remained almost stationary during the period of the floods and effectively stopped the normal eastward progression of weather systems across southern Australia, thereby preventing any dry air mass from moving in over Queensland and clearing the weather. Thus a moist convergent easterly airstream was maintained along the southern Queensland coast between the high and the monsoon trough for several days. The high was also largely responsible for steering cyclone 'Wanda' onto the coast and influenced the movement of the monsoon trough. This trough moved steadily southwards during 25 and 26 January while the high was weakening, but late on 26 January the high regained intensity, effectively halted the southward progression of the monsoon trough and eventually forced it well north again.
Rainfall Total rainfall for the 5 day period from 9 am Thursday 24 January to 9 am Tuesday 29 January is shown as an isohyetal map in Fig 7. Totals in the Brisbane metropolitan area ranged from 500 to 900 mm and exceeded 300 mm over all but the extreme western parts of the Brisbane River catchment area. Among the highest 5 day totals were 1318 mm at Mt Glorious, in the catchment of the middle reaches of the Brisbane River, and 819 mm at New Beith, near the head of Oxley Creek. The Brisbane Bureau, in the heart of the city, recorded 650 mm during this period. In the catchments of the Brisbane metropolitan creeks heavy rains commenced about 2 am on Friday 25 January and continued until about 2 pm. During that 12-hour period falls ranged from 197 mm at the Bureau to 236 mm at Enoggera Reservoir and 280 mm at Mt Nebo. The rain then eased but between 6 pm Friday and 3 am Saturday very intense rainfall was experienced for the second time with 151 mm being recorded at the Bureau, including 82 mm between 9 pm and midnight. In this latter period 202 mm fell at Enoggera Reservoir. Near continuous rain interspersed with particularly heavy falls continued over the Brisbane Valley during Saturday 26 January and Sunday 27 January. At the Bureau the third period of intense rainfall was experienced between 5 pm Saturday and 3 am Sunday, when 132 mm were recorded, and although the rain eased on Sunday, 47 mm were recorded between 9 am Sunday and 9 am Monday 28 January.

27 Bureau of Meteorology, 1974
Figure 7: Rainfall isohyets (mm) for the 5 day period ended 9 am Tuesday 29 January 1974

28 Bureau of Meteorology, 1974
Figure 8: Average sub-catchment rainfall (mm) over the Brisbane Valley for the period 25 – 28 January 1974
The mean rainfalls for the sub-catchments of the Brisbane Valley are plotted in Fig 8 for the standard 6-hour observing periods from 9 am Friday 25 January to 9

29 Bureau of Meteorology, 1974
am Monday 28 January 1974. The sections of the graphs that have the steepest vertical slopes indicate the most intense periods of rainfall. An appreciation of the sub-catchment rainfall experienced in previous flood situations can be gained from Table 2. The unusual extent of the Bremer and Lockyer contributions to the 1974 flood can readily be seen along with the very large metropolitan rainfall. Table 2 also shows the very high rainfalls in the Stanley sub-catchment in the first 1893 flood and it is important to note that in the second 1893 flood rainfall in all sub-catchments was less than in 1974, yet the flood peak was much higher. The difference is accounted for by the flood mitigation effects of Somerset Dam, river improvements, different pre-storm catchment wetness and differences in the temporal distribution of rainfall. In the 24 hours ending 9 am 27 January an estimated 341 mm fell at Ipswich, the highest daily total ever recorded there. Many other places in the Brisbane Valley received record or near record totals during the flood for various durations of rainfall. For example, New Beith recorded 683 mm in the 48 hours ended 9 am 27 January, including a 6-hourly fall of 250 mm. At Mt Glorious 496 mm fell in the 24 hours to 9 am 27 January, and in the same period 341 mm were recorded at Mt Mee in the Stanley River sub-catchment. Some Brisbane rainfall statistics are given in Tables 3 and 4. Table 3 shows the mean and median rainfall, and the mean number of rain days for all months in the period from January 1840 to April 1974. The long term average for January is 166 mm averaged over 13 rain days, but in January 1974 (Table 4) 872 mm were registered on 26 rain days. This is the highest on record, not only for January, but for any month (also shown in Table 4) except that of the last great flood (February 1893), when 1026 mm fell on 25 rain days. Table 2: Brisbane River sub-catchment rainfalls (in mm) for some previous floods
Period Stanley Upper
Brisbane Lockyer Bremer Metro- politan
Middle reaches
1-4 Feb 1893 939 358 237 137 288 446 16-18 Feb 1893 430 252 266 260 406 414 14-15 Mar 1908 225 154 185 225 326 319
4-6 Feb 1931 452 219 192 163 433 337 27-28 Mar 1955 344 199 153 138 208 203 25-27 Jan 1974 410 232 297 446 593 417 25-29 Jan 1974 507 280 350 461 656 481

30 Bureau of Meteorology, 1974
Table 3: Brisbane rainfall statistics January 1840 to April 1974
Table 4: Highest monthly rainfall at Brisbane, January 1840 – April 1974
In January In any month Rank Year Rainfall Number of
rain days Month Rainfall Number of
rain days 1 1974 872 26 Feb 1893 1,026 25 2 1895 704 22 Jan 1974 872 26 3 1887 593 17 Mar 1870 865 26 4 1927 570 20 Jan 1895 704 22 5 1841 506 Unknown Feb 1875 691 24 6 1971 433 18 Jun 1967 647 18 7 1951 421 19 Jan 1887 593 17 8 1968 391 17 Jan 1927 570 20 9 1898 390 22 Feb 1954 548 21
10 1848 335 Unknown Mar 1890 543 26 On the shorter time scale, the highest 24-hour rainfalls at the Brisbane Bureau in January and in any month are given in Table 6. It should be noted that the registration of 314 mm on 26 January 1974 was only the second occasion on which a 24-hour total in January at the Bureau has exceeded the average monthly rainfall. Estimates of the recurrence interval of various durations of rainfall are given in Table 5, but care is needed in its interpretation. It can be seen that the 26 January 1974 24-hour total of 314 mm is roughly a 'once in 100-years rainfall'. This means that over a very long period, rainfall of this magnitude occurs on the average only once every 100 years, the probability of its occurrence in any one year being 1%. It does not mean that Brisbane will not experience such rains again until January 2074. Indeed there is a 5% probability that such rains will occur again before 1979, a 10% chance of recurrence before 1984 and about a 40% chance of recurrence before about 2024.
Month Jan Feb Mar Apr May Jun Jul Mean (mm) 166 162 142 87 70 69 57
Median (mm) 133 118 110 59 42 44 38 Mean number of rain days
13 14 15 11 9 8 7
Month Aug Sep Oct Nov Dec Year
Mean (mm) 48 48 75 94 129 1,147 Median (mm) 30 42 59 82 116 1,105 Mean number of rain days
7 8 10 10 12 124

31 Bureau of Meteorology, 1974
Table 5: Brisbane rainfall (mm) for various durations and return periods*
Table 6: Highest 24-hour rainfall totals (mm) at Brisbane January 1840 – April 1974
January Any Month 21 Jan 1887 465 21 Jan 1887 465 26 Jan 1974 314 26 Jan 1974 314 26 Jan 1895 146 14 Mar 1908 284 23 Jan 1971 117 12 Jun 1967 282 22 Jan 1894 111 6 Feb 1931 269 10 Jan 1898 111 9 Mar 1890 245
12 Feb 1972 235 16 Feb 1893 212
An appreciation of the irregular recurrence interval of rainfall can be gained by comparing the 'once in 20 years' 24-hour rainfall of 223 mm (Table 5) with actual rainfalls listed in Table 6. Whilst long term records show that in the past 123 years in Brisbane this total has only been exceeded 7 times; the once in 20 years' fall has been exceeded 3 times in the past 7 years (June 1967, February 1972 and January 1974). Because of problems of sampling and extrapolation, rainfall estimates for return periods similar to and exceeding the length of record should also be treated with suspicion.
Return period Duration of rainfall (hours) 0.5 1 3 6 12 18 24 36 48 72 96 120 144Once in - 1 year 28 36 51 63 83 86 94 97 110 126 134 144 1442 years 35 45 66 81 104 113 121 137 149 166 173 180 1875 years 43 57 78 96 132 149 163 185 197 223 240 252 24510 years 48 63 87 108 156 171 191 216 230 259 278 288 28820 years 55 72 99 126 168 198 223 254 278 310 326 348 34650 years 65 82 111 144 192 234 264 306 326 374 394 420 418100 years 70 90 123 156 216 261 299 342 370 418 442 468 475 * Derived from the Bureau of Meteorology Bulletin No. 49: “Point Rainfall Intensity-Frequency-Duration Data, Capital Cities” by C. Pierrehumbert.

32 Bureau of Meteorology, 1974
Flooding The floods commenced with heavy rain over the Stanley River catchment late on Thursday 24 January in association with the decaying cyclone 'Wanda'. By 9 am Friday 25 January major flooding was occurring in the Upper Stanley River but although rain had fallen over the other main Brisbane River tributaries (the Upper Brisbane, Lockyer Creek and Bremer River) initial losses had not been satisfied and no significant run-off was occurring except in the lower reaches of the Bremer where local run-off had commenced. However, by 3 pm 25 January rain had saturated all the Bremer catchment and by 9 pm that night significant run-off had commenced in both the Upper Brisbane River and Lockyer Creek. By 9 am Saturday 26 January there was a major flood in the Bremer and Upper Brisbane Rivers and in Lockyer Creek. Record rains in the Ipswich area caused unprecedented local flooding in creeks, and at Ipswich itself the Bremer River began rising at an exceptionally fast rate, 10.5 m during Saturday 26 January to reach a height of 19.35 m by 6 am Sunday 27 January. Subsequently a peak of 19.70 m was recorded at Ipswich at about 3 pm Sunday 27 January, but the recession in the Bremer River flood was counteracted by backwater flooding from the Brisbane River, so that the height at Ipswich remained above 19.20 m for approximately 39 hours. In east Ipswich the Brisbane River backwater peak caused the highest levels but in west Ipswich the initial Bremer River peak caused the highest levels. The flood hydrograph for Ipswich is shown in Fig 9. This was a rare type of flood in terms of the distribution of rainfall and run-off and in fact the total Bremer peak flood discharge was approximately 2½ to 3 times the previous highest recorded discharge of 1,642 cumecs* (58,000 cusecs+) observed in February 1971. It was fortunate that the natural storage area between the junction of the Bremer River and Warrill Creek upstream from Ipswich prevented even higher flood levels through Ipswich itself. On 25 and 26 January the river flood was still being generated in the Brisbane Valley, but in the Brisbane metropolitan area the three periods of intense rainfall, referred to earlier, resulted in three separate floods in the metropolitan creeks. This is illustrated in the hydrograph for Kedron Brook (Fig 10). The first flood occurred during the afternoon of Friday 25 January, when record levels were reached in Moggill Creek, the second that night, i.e., during the night hours of 25 and 26 January, when record levels were attained in Enoggera Creek and Kedron Brook. The third flood occurred overnight on Saturday 26 January but was slightly lower than the first flood. In Oxley Creek, which has a large, very flat catchment and behaves in quite a different manner to the other metropolitan creeks, a single flood occurred which reached record levels. *A cumec is a cubic metre per second. +A cusec is a cubic foot per second.

33 Bureau of Meteorology, 1974
Figure 9: Flood hydrograph of the Bremer River at Ipswich 25 – 30 January 1974

34 Bureau of Meteorology, 1974
Figure 10: Flood hydrographs of Kedron Brook at Osborne Road 24 – 27 January 1974.
The rainfall hyetograph at the top of the diagram shows how rapidly the brook responds to the heavy rainfall.

35 Bureau of Meteorology, 1974
Rainfall over creek catchments on the south side of the Brisbane River east from Oxley Creek was not as heavy as to the north and consequently flooding in these creeks (Norman, Bulimba, Wynnum and Lota Creeks) did not reach record levels. The behaviour of the Brisbane River at the Port Office from Thursday 24 January to Thursday 31 January is shown in Fig 11. In the city reaches of the river the imminence of a major flood, higher than any recorded since 1893 was not apparent during the daylight hours of Saturday 26 January. A minor flood height of 3.56 m occurred at the Port Office gauge on the high tide at about midday 26 January, to which the main contributions were local Brisbane creek run-off and a storm surge caused by the persistent strong winds in Moreton Bay. However, with the enormous flood contribution from the Bremer and the continued periods of intense rainfall in the middle Brisbane and in the metropolitan area, the river continued to rise and the previous highest flood level this century (1931) was exceeded by about 9 am Sunday 27 January when the level at the Port Office reached 4.50 m. It was the heavy rain which fell over most of the Brisbane Valley principally during the period between 3 pm Saturday and 3 pm Sunday which was responsible for converting a minor river flood in Brisbane into one of major proportions. The river rose steadily during Sunday 27 January and attained a peak height of 6.60 m on the high tide at 2.15 am on Tuesday 29 January. After this the floods slowly receded but the Port Office reading did not fall to below 3.0 m until Thursday 31 January. It can be seen from Fig 11 that the tidal effect at the Port Office was still slightly evident at the peak. This effect was more pronounced towards the mouth of the river but was completely damped out at the peak upstream from St Lucia. The approximate extent of the inundation in the Brisbane metropolitan area during the January 1974 flood is shown in Fig 12. A more detailed representation is given on the Queensland Survey Office's Flood Map of Brisbane and Suburbs, which is available for sale to the public.
Flood damage The Queensland Disaster Welfare Committee (QDWC) report of 28 May 1974 indicated that of 6,007 flooded households surveyed in Brisbane and Ipswich, there were 9,980 major needs associated with emotional, health and material needs. Of this number, 7,370 material needs were by far the most pressing. The Small Business Survey carried out by the Committee indicated that small businesses suffered substantial stock and equipment losses. 350 applications for loan assistance were received, of which only 35 were surveyed. Stock damage amounted to $203,508 and equipment damage to $92,190. Insurance companies indicated that the total number of businesses severely affected by the flood would be nearer to one thousand.

36 Bureau of Meteorology, 1974
Figure 11: Flood hydrographs of the Brisbane River at the Port Office 24 –31 January 1974, together with observed and predicted tidal variations.
Forecast heights are indicated together with their time of issue. (Heights referenced to Brisbane Port Office datum.)

37 Bureau of Meteorology, 1974
Figure 12: The approximate extent of the January 1974 flood in the Brisbane
metropolitan area. (Based on “Flood Map of Brisbane and Suburbs” prepared by the Queensland
survey office and reproduced by the kind permission of the Queensland Surveyor-General.)

38 Bureau of Meteorology, 1974
A total of 56 homes in Ipswich and Brisbane were either destroyed or condemned as being uninhabitable after the flood. The QDWC survey of 37 of these indicated a total loss of house and contents of $850,058, the average per house being $22,974. The Jindalee Area Flood Action Committee presented details for its area in a report “Assessment of the Consequences of the 1974 Flood in the Jindalee Area”. In a survey of 280 houses the estimated cost of structural rectification was $781,135 and contents rectification, $617,562. Damage to removable goods such as furniture and personal items therefore amounted to 44% of the total damage. Although standards of living at Jindalee would probably be higher than the average for the suburbs inundated and therefore would not be representative of the whole of the flooded areas, the figures indicate the maximum savings likely to accrue from a complete response to warnings, provided that they were disseminated in a form that householders could easily understand. The above details indicate the degree of personal hardship and distress which flood victims with limited resources have to overcome. Insurance companies have met claims of approximately $70 million for damage caused in the Brisbane and Ipswich areas in January and February. The great majority of this payment was for damage by the Brisbane River and suburban creek flooding. Damage on a large scale has been estimated at about $200 million, but it may be many years before full reinstatement costs are known. An example is an early estimate of road repairs in the Moreton Region amounting to $20 million, but it will be some time before all roads are restored to pre-flood condition. Repair costs for essential services in the Brisbane City Council area for water, sewerage, road and electricity installation, etc, amount to approximately $7 million. The repair costs in the Ipswich City Council area for essential services are estimated at $4.5 million. Damage to large company installations, including equipment and stock, have not been widely publicised. Individual instances of damage caused by the flood in the Brisbane Valley have been well documented in the newspapers and will not be described in detail here. However, an appreciation of the destruction and the levels of inundation, can be obtained from the picture on the cover and the photographs at the end of this report. In one of the more spectacular incidents, the 67,320 tonne oil tanker Robert Miller was torn loose from its moorings in the city reaches of the Brisbane River at the height of the flood. It swung out across the river and its stern came close to the wall of a riverside block of luxury apartments. Two tugs were needed to regain and maintain control. The lightship Cape Moreton was also torn from its mooring in the same area. Further upstream at Jindalee a runaway barge was

39 Bureau of Meteorology, 1974
deliberately sunk after it became jammed under the Centenary Bridge. The bridge was badly damaged.

40 Bureau of Meteorology, 1974
THE PERFORMANCE OF THE FLOOD WARNING SYSTEM IN JANUARY 1974
On the whole the warning system for the Brisbane River worked well. With existing techniques it is not possible to make predictions for periods beyond 24 hours and most predictions were for periods between 6 and 24 hours. Two features of this flood event should be borne in mind. First, its unusual character, arising from the extent of the Bremer River and Lockyer Creek contributions to the run-off; second, the extent of flooding over the whole State at this time. Despite the difficulties, the peak river height at the Brisbane Port Office was very accurately forecast 21 hours in advance, and in addition to providing these specialised and detailed services for Brisbane, the full program of tropical cyclone and flood warning services for the State was maintained, although with difficulty. During January 1974, 262 flood warnings were issued from the Brisbane Bureau and of these 102 were prepared in the period from 24 to 31 January. Local staff were brought to the point of exhaustion, and it was necessary to transfer a specialist hydrologist from Melbourne. The performance of the Brisbane Valley system will now be discussed in detail.
Observations Apart from the routine network of meteorological observations required for general forecasting services, the primary hydrological data of rainfall and river height observations are provided entirely by voluntary (allowance) observers comprising police, postmasters, farmers and private persons. The dedication of many of these observers in providing data over long periods is outstanding. However, in January 1974 some vital observations were missed because of telephone breakdowns, gauges washed away, observers forced to evacuate, or police observers absent on rescue duty. At an important stage of the flood only three out of thirteen flood reporting stations were operating above Mt Crosby. Early in the flood a malfunction occurred in the telemetry equipment which relayed the vital Brisbane Port Office gauge readings to the Bureau. This could not be rectified and Bureau observers were forced to operate from the Port Office itself, relaying river heights by telephone to the Bureau. The Port Office was isolated by floodwaters with its lower floor inundated, and at shift changes the observers had to be transported in and out by boat along Edward Street. To safeguard against complete inundation of the Port Office and a consequent total loss of river height readings in the city, a series of emergency gauges were set up on telephone poles at strategic points in Edward Street. The difficulties arising from equipment malfunction in obtaining river heights from the Port Office gauge show that there can be no certain guarantee against loss of vital information on some future flood occasion. Furthermore, the emergency

41 Bureau of Meteorology, 1974
action taken at the Port Office would be impracticable at the more remote gauges of the Brisbane Valley telemetry network.
Communications No serious delays occurred with outward communications, although the distribution of important forecasts and warnings to other areas of Queensland was affected by the priority given to Brisbane messages. The distribution list for all Brisbane warnings is given in Appendix 1. The mode of distribution was by:
Telex, which provided an accurate copy of the warnings to each addressee. All Brisbane television stations received warnings by telex.
Telegram, for specified police and radio stations not equipped with
telex.
Telephone, via the direct lines linking the Bureau with the ABC and Police Headquarters. This was used to supplement the normal telex links and minimise delays.
A direct link between the Bureau and all Brisbane commercial radio
stations. This facility enables the full text of all warnings to be tape-recorded by the radio stations for immediate or later broadcasting.
The telephone Weather Warning Service (1190). 85,732 calls were
registered by the PMG on this number during January 1974 compared with 10,571 during January 1973. However, many telephones were out of order during the flood and a more realistic idea of the demand for this service can be gained from the March 1974 total of 142,989. In this month cyclone 'Zoe' threatened Brisbane but telephone communications were not disrupted.
There were some inadequacies in the method of distribution, particularly with respect to the direct link with commercial radio stations. This does not provide a verified copy of the warnings, and some transcription errors inevitably occur before the warning is broadcast by the station. Furthermore some radio stations do not always broadcast the warnings in full and vital information may be omitted, or the impact of the warning changed, by the editing process. Clearly this is not a matter over which the Bureau has any control. Frequent telephone consultation on the flood situation occurred with the Brisbane City Council Flood Control Section, the Police, and to a lesser extent with the Southern Electric Authority.
Warning Services

42 Bureau of Meteorology, 1974
Between 24 and 31 January 1974, 23 individual flood warnings were issued for the Brisbane Valley and 10 for the Brisbane metropolitan creeks. These warnings are listed in full in Appendices 2 and 3. In addition, during the same period, no less than 69 detailed flood warnings were issued for many other parts of the State, including the high density population areas of Gympie, Maryborough and the Gold Coast. The warnings provided in respect of the Brisbane River, the metropolitan creeks and the Ipswich area will now be considered separately.
Brisbane River warnings The flood hydrograph for the Brisbane River at the Port Office together with the time of issue and the extent of all warnings is shown in Fig 11. The timeliness and general accuracy of the warnings are apparent. Most predictions were issued at about 6-hourly intervals for advance periods of 12 to 24 hours together with forecasts for shorter periods to synchronise with high tide at the Port Office. There was a tendency to overpredict heights prior to the peak, but the recession of the flood was very accurately predicted. The Flood Precautionary and Flood Alert Phases were declared simultaneously on the evening of Thursday 24 January when cyclone 'Wanda' showed definite signs of crossing the coast rather than continuing a southward movement parallel to the coast. At 10.30 pm Thursday 24 January 1974 the initial warning for the Brisbane Valley was issued (Appendix 2), predicting further heavy rain and increasing flooding in the Upper Stanley River in the following 12 hours. By 9 am next morning (Friday 25th) major flooding was occurring in the Upper Stanley, but rainfall over the other tributaries of the Brisbane River had not been sufficient to cause significant flood run-off. Regular 6-hourly warnings were issued during Friday predicting further rain and the movement of the flood downstream. At 5 am Saturday 26 January the warning predicted moderate to major flooding during the day in the Bremer and Upper Brisbane Rivers and Lockyer Creek. It specifically mentioned the expectation of moderate flooding increasing at Ipswich, and also predicted moderate flooding of low lying parts of the Brisbane metropolitan area on the high tide at about midday in the city. The Flood Forecasting Phase was entered during the early hours of Saturday 26 January. At 7 am Saturday 26 January the first quantitative prediction for the Brisbane Port Office gauge was issued, with a forecast height of 4.27 m on the midday high tide. The warning specifically mentioned that this predicted height was similar to the flood peak of 1931 and that moderate flooding would be experienced. The actual height proved to be 3.56 m, i.e. 0.71 m lower than expected, due

43 Bureau of Meteorology, 1974
principally to an overestimate of the storm tide. The major contribution to the Brisbane metropolitan flood at this time was essentially local creek run-off and storm surge. The imminence of a major flood, higher than any recorded since 1893, was not apparent to the Bureau at this time. Quantitative warnings for the Port Office continued at about six-hourly intervals during Saturday, and in some warnings heights were also forecast for Darra and Ipswich. The forecasts of actual heights for Ipswich were soon abandoned because it became obvious that the prediction system was producing gross underestimates. The reasons for this will be discussed later. A key warning was issued at 5.30 pm on Saturday 26 January (see Appendix 2 Warning No 8). This gave 18 and a half hours warning of a Port Office height of 4.6 m for the midday high tide on Sunday. This prediction was repeated in the 1 am warning on Sunday 27 January and upgraded to 5.2 m on the 5 am warning. The warning issued at 1.30 pm Sunday (Warning No 11) predicted a height of 6.4 m by mid morning Monday 28 January, i.e., 21 hours advance warning. The first prediction of the river peak at the Port Office was made at 5 am Monday 28 January, 21 hours in advance of the predicted peak of 6.7 m, forecast to occur in the early morning of Tuesday 29 January 1974. As the river began to fall very accurate forecasts were issued initially at 6-hourly and later at 12-hourly intervals, giving predictions for times ranging between 3 and 15 hours in advance. The final warning was issued at 5.30 am on Thursday 31 January 1974.
Metropolitan creek warnings Brisbane metropolitan creek flood warnings (Appendix 3) were issued at intervals of 2 to 3 hours during each of the three creek floods experienced over the Australia Day weekend. The warnings were qualitative only, but were considered a useful alert to the authorities and the general public in pinpointing where major flooding was likely as well as when the critical periods were expected. These warnings were not as accurate as the Brisbane River flood warnings, mainly because the erratic variations in local rainfall duration and intensity could not be predicted. Furthermore, only very limited rainfall and creek height data were available operationally in the Brisbane metropolitan area. This particular problem is a very difficult one to resolve. Whenever possible the radar set at Eagle Farm was used to establish regions of heaviest rainfall and short period trends, and the analyses were transmitted by landline facsimile to the Brisbane Bureau. However, the Eagle Farm radar is required for other urgent

44 Bureau of Meteorology, 1974
operational purposes and cannot be continuously utilised for rainfall assessments. Because radar is such a promising tool, planning had been initiated prior to these floods to provide continuous coverage of at least part of the Brisbane River valley by the installation of a special weather watching radar at Mt Kanighan (about 150 km NNW of Brisbane) but an additional radar on Stradbroke Island will be necessary to provide complete coverage of the Valley. Considerable research will still be required to permit quantitative rainfall estimates from radar observations to be made with the accuracy required for this type of problem, but if this can be achieved then an improvement in the flood predictions for metropolitan creeks can be expected. This would apply particularly to Oxley Creek because of the longer time taken by this creek to respond to heavy rainfall.
Flooding in the Ipswich area Although the warnings at 11 am and 5 pm Friday 25 January predicted flooding and traffic disabilities in all tributaries, the first warning of flooding specifically in the Ipswich area was issued at 5 am Saturday 26 January (see Appendix 2 Warning No 5). This warning, which predicted moderate flooding increasing during Saturday, was upgraded on the 11 am issue with a prediction of major flooding overnight. Quantitative predictions of the height of the Bremer River at Ipswich were issued with the next two warnings but these heights were exceeded within a few hours of issue due to unprecedented local run-off from the record flash floods in the Ipswich, area creeks, and increasing run-off from the main Bremer " River and Warrill Creek catchments. Because this type of flood had not been previously experienced and only data from floods of up to one third of this magnitude were available for study, there were insurmountable difficulties in predicting the flood, and no further quantitative forecasts were issued. Qualitative forecasts were continued, however, and in this context were informative and accurate, particularly the prediction of the prolonged duration of record flood levels (see for example Appendix 2 Warning No 14). No specific flood warnings were issued for the several flash floods that occurred in Deebing, Bundamba, Woogaroo, Sandy and Ironpot Creeks, although warnings of major flooding were current for the main river system. Most of these creeks attained record levels and caused considerable damage. No significant flood problems have been experienced in these creeks this century and network development in the area is inadequate to provide even factual data, let alone specific warnings.
Public criticism

45 Bureau of Meteorology, 1974
The Bureau's flood forecasting service during the Brisbane flood of January 1974 has met with some adverse criticism on six main grounds, namely:
the use of the Brisbane Port Office as the main reference point in the flood forecasts;
that the Bureau was unable to predict the Brisbane River peak height
at the Port Office more than 24 hours in advance;
that flood warnings were not issued frequently enough;
that the rainfall and flood forecasts were inaccurate;
that flood forecasts at Ipswich were inaccurate and did not provide adequate warning of the immensity of the flood; and
that a large section of the community claimed not to have been warned
or not to have heard warnings broadcast. Something has already been said about the last two of these, hence these criticisms will be considered first.
Flood forecasts for Ipswich Advance warning of major flooding was given, but the predicted heights were inaccurate because of lack of observational data and also because no previous events of this magnitude had ever been experienced from which a scientific quantitative technique might have been developed. The complicated natural storage conditions upstream from Ipswich and the record contribution of run-off from the local area around Ipswich and Amberley make normal extrapolation techniques unreliable.
The claim of inadequate warning All warnings (see Appendices 1, 2 and 3) were distributed to all Brisbane radio and television stations together with several fringe area stations. In addition to the flood forecasts these warnings conveyed a great amount of information about existing rainfall and flooding. Details of the flood forecasts and information actually broadcast by commercial stations are not available. However, it is known that full coverage was given by most stations, and in particular that the national stations broadcast all information supplied to them at frequent intervals. Hence this criticism is unjustified.

46 Bureau of Meteorology, 1974
Use of the Brisbane Port Office as the main flood forecast reference point Criticism was strongest about this partly because the location of the Port Office was not widely known but mainly because the public was unable to interpret readings there in terms of flood levels in particular suburbs. The Bureau is not in a position to provide detailed forecasts of levels of inundation for particular localities, but predicts river heights at selected points. This has been clearly conveyed to, and accepted by, local authorities. The Bureau would agree that this deficiency demonstrates the need for public education on flooding and flood problems in the Brisbane region, but would point out that detailed flood maps have been available for more than 30 years. These would have been useful for interpreting the Bureau's forecasts, although, because of the infrequency of flooding in Brisbane during that period, they have received little publicity. Forecasts for the Port Office are not only issued to the general public but to both the Brisbane City Council Flood Control Section and to the Police Department. A close and effective liaison has been developed over the years between the Bureau's hydrologists and engineers in the City Council Flood Control Section, and the relationship was strengthened following the severe metropolitan creek flooding in June 1967. On the occasion of the January 1974 floods, as on previous flood occasions, the City Council operated a flood advice service from which the public could obtain specific information, by telephone, on the depths of flooding in their areas. This interpreted information was also passed to the Brisbane District Control Group of the Disaster Relief Organisation at Police Headquarters. City Council officers have stated that the Council's service was unable to cope with the demand from individuals for information, and no machinery operated for the mass distribution of this highly detailed but vital information to the media. It is relevant to point out that a 'paper' flood exercise was conducted in May 1973, for which the Bureau provided a forecast of the flood levels for the Port Office approximating the 1893 levels. At the subsequent debriefing in October 1973 no request for any alteration of the Bureau's contribution arose out of this exercise. Furthermore, an emergency meeting convened by the Commissioner of Police during the flood at 3 pm on Sunday 27 January did not request the Bureau to issue any more information than it was already issuing in its warnings. By that time and date the Bureau had issued seven Port Office forecasts. Hence this criticism of the Bureau is totally rejected.
Claim of insufficient advance warning time for Port Office predictions

47 Bureau of Meteorology, 1974
The second criticism was that the Bureau was unable to predict the peak at the Port Office more than 24 hours in advance. The river peak was accurately predicted 21 hours in advance. Because of the limited river height reporting network and the need to assess flood discharge rates accurately and to correlate them with the observed peak upstream, this was close to the maximum possible advance warning time for this type of flood, i.e., where the main contribution occurred in the lower or southern sub-catchments. In the more normal situation, where floods are generated in the Stanley and Upper Brisbane catchments which are well upstream from Brisbane, up to 36 hours warning is possible.
Frequency of flood warnings The third criticism was that flood warnings were not issued frequently enough. Warnings for the Brisbane River were issued at approximately six-hourly intervals and contained predictions for periods 12 to 21 hours in advance, together with shorter period forecasts to synchronise with high tide. This is adequate because of the relatively long duration of flooding and the river's slow response to major changes in the meteorological situation. This should not be compared with a tropical cyclone threat, where hourly warnings may be necessary to keep the public informed of the sudden changes in movement or intensity that can occur. This slower response time for the river also enables the issue of a flood warning to be delayed slightly, on occasions, to ensure receipt of vital river or rainfall reports, or to allow a recomputation of a critical prediction. An important exception, of course, is warnings for the flash floods. Here the response time is much faster and accordingly warnings must be issued as promptly as possible and more frequently. In January 1974 warnings for the Brisbane metropolitan creeks were issued at 2 to 3 hourly intervals.
Accuracy of rainfall and flood forecasts Finally, the criticism that these forecasts were inaccurate is unwarranted for the Port Office flood forecasts. These gave accurate advance warning of the severity of the Brisbane River flood, which caused most of the inundation of houses and property. However, it is agreed that criticism of the accuracy of the earlier predictions of the metropolitan creek floods is warranted. The reasons for these unavoidable errors have been explained, namely that they were a consequence of the inadequacy of the existing rainfall and river observation network, rainfall assessment techniques, and the inability to predict the erratic occurrence of localised high intensity rainfall on the Friday evening of 25 January.

48 Bureau of Meteorology, 1974
It must be pointed out here that several grossly inaccurate flood forecasts, not issued by the Bureau, were broadcast during the flood. These included a prediction for Brisbane creeks that significantly conflicted with the official warning; a forecast for the Port Office on Tuesday 29 January that was 1.2 m in error; and a forecast that a 0.7 m surge was moving down the river on top of the flood and should be used to increase the officially forecast Port Office height predictions. When it became known that information of this nature was being issued publicly, the Bureau requested the police and the ABC to check the source of unofficial forecasts and as far as practicable discuss their reliability with the Bureau before broadcasting them. It is difficult to see what other action the Bureau could take in circumstances such as these.

49 Bureau of Meteorology, 1974
CONCLUSIONS The 25-31 January 1974 floods in the Brisbane area were the worst since 1893. The heavy rainfalls producing them were associated with the quasi-stationary monsoonal trough. This trough had advanced much further south than usual over Queensland, and its movement to the Brisbane area was associated with the passage of the rather weak cyclone 'Wanda'. The overall performance of the Bureau's Brisbane Valley Flood Warning System was good, but some deficiencies need to be rectified. Vital river height and rainfall observations could not be obtained during an important stage of the flood. An almost intolerable strain was imposed on the staff by the volume and complexity of the data to be analysed, and the number of forecasts and warnings to be formulated and disseminated. The installation of the planned radio telemetry network (see Fig 3), which was commenced prior to January 1974, will be completed. This is the minimum required to operate the system, but even at its maximum capacity it would not offer a certain assurance against failure in the observational network on some future flood occasion. Because of the unavoidable risk of failure associated with any surface observing network, the installation of weather-watching radar is essential for a fully developed flood forecasting system. The installation of a station at Mt Kanighan is in hand, but this will not provide a complete coverage of the Valley and another on Stradbroke Island would be necessary to ensure this. Although the great potential value of a facility of this nature was effectively demonstrated in January 1974 by the assistance obtained from the Eagle Farm meteorological radar, considerable additional applied research and development will be required to permit radar observations to be confidently interpreted in terms of rainfall amount, intensity and areal extent in an operational environment. Development of the weather-watching radar facility with a capability for operational determination of rainfall intensity is considered to be the only way by which the provision of an adequate quantitative flood prediction service for the Brisbane metropolitan creeks is feasible. With the Oxley Creek, additional rainfall and river height stations may be adequate, because this creek has a slower flood response time. Even without radar, some improvement to the Metropolitan Creek Warning System should occur following the installation of a telemetry system by which rainfall from seven selected sites in Brisbane can be monitored in the Bureau. This is expected to be completed by December 1974. It is planned to supplement this later with a network of creek height reporting stations. It is also appropriate to note here that the Bureau is represented on an advisory committee set up by the

50 Bureau of Meteorology, 1974
Queensland State authorities to examine flood mitigation proposals for the metropolitan creeks. It proved impossible to issue quantitative predictions of flood levels for the Bremer River at Ipswich. This was due in part to the loss of some vital observational data early in the flood, and to the unique nature and magnitude of this flood. Despite the loss of some of the data, the remainder collected on this occasion will be of great value in improving the prediction service at Ipswich. It will, of course, take some time to completely analyse and assimilate it into the system. The Bureau of Meteorology's generalised flood warnings and its flood forecasts for specific points on the Brisbane River are vital to the flood protection of Brisbane, Ipswich and indeed the entire Brisbane Valley. Nevertheless, the January 1974 flood has shown that such a flood warning service is of limited value unless the Bureau's forecasts are properly interpreted by responsible authorities, and the public is subsequently advised of the expected level and extent of inundation in their own streets and houses. In the USA, where an effective interpretation system exists, and where evacuation procedures are highly organised, benefit to cost ratios for the provision of a flood warning service have been assessed as at least 15 to 1.

51 Bureau of Meteorology, 1974
APPENDIX 1: BRISBANE VALLEY FLOOD WARNING DISTRIBUTION LIST
By telex (hard copy available to addressee) * ABC (radio and television) * Police Brisbane * Queensland Radio News Service Queensland Railways Macquarie News Service RACQ Brisbane 4IP Ipswich 4QS and 4GR Toowoomba Television stations QTQ 9, BTQ 7 and TVQ 0 * For priority and top priority warnings addressees are telephoned to check
receipt of warnings (Police and ABC by direct line). . By telegram Police: Ipswich, Lowood, Harrisville, Rosewood, Woodford, Goodna and Gatton 4AK Toowoomba By radio automatic tape facility Brisbane radio stations 4BK, 4BC, 4BH, 4KQ and 4IP Bureau of Meteorology Weather Warning Service Telephone 1190

52 Bureau of Meteorology, 1974
APPENDIX 2A: TEXT OF BRISBANE VALLEY FLOOD WARNINGS FROM 10.30 pm 24 JANUARY TO 5.30 am 31
JANUARY 1974 WARNING NO 1 Initial Flood Warning Brisbane Valley issued by the Bureau
of Meteorology, Brisbane at 10.30 pm 24/1/74
Heavy rainfalls in the Upper Stanley River have been recorded in the 12 hours to 9 pm in association with the movement of Cyclone Wanda which at 9 pm was located 25 miles N.E. of Gympie and moving S.W. at 12 m.p.h. Minor flooding currently occurring around Peachester will increase overnight. Further heavy rainfalls are expected during the next 12 hours.
WARNING NO 2 Renewal of Flood Warning Brisbane Valley issued by the Bureau of Meteorology, Brisbane at 5 am Friday 25/1/74
Heavy flood rains have been recorded over the Upper Stanley River catchment overnight. Continued heavy falls are expected this morning as Cyclone Wanda moves S.W. River levels in the upper reaches at Peachester were rising fast late last night and flooding is expected downstream this morning.
WARNING NO 3 Renewal of Flood Warning Brisbane Valley issued by the Bureau of Meteorology, Brisbane at 11.00 am Friday 25/1/74
Heavy rains averaging 230 mm were recorded in the 24 hours to 9 am in the Stanley River. Moderate to major flooding is occurring in the Stanley River. Very heavy to flood rains are expected over all tributaries of the Brisbane River in the next 24 hours. Flooding and Traffic disabilities are expected throughout the Brisbane Valley and tributaries by tomorrow.
WARNING NO 4 Renewal of Flood Warning Brisbane Valley issued by the Bureau of Meteorology, Brisbane at 5.00 pm Friday 25/1/74
Heavy rains have continued in the 6 hours to 3 pm but rains are expected to ease slowly overnight in the Brisbane River and tributaries. Flooding is now easing in the Stanley River, however the Upper Brisbane, Lockyer and Bremer River tributaries are rising and continued rises are expected

53 Bureau of Meteorology, 1974
tonight. Some flooding and traffic disabilities are expected and the Murrumba bridge on the Brisbane Valley Highway is expected to remain closed for the next 24 hours.
WARNING NO 5 Renewal of Flood Warning Brisbane Valley issued by the
Bureau of Meteorology, Brisbane at 5.00 am Saturday 26/1/74
Heavy rainfalls up to 127 mm at Moore in the hours to 3 am have been recorded in the Brisbane Valley and tributaries and further heavy falls are expected in the next 12 hours. River levels are rising in the Bremer River, Lockyer Creek and Upper Brisbane. Moderate to major flooding is expected today in these streams. In the Brisbane River Middle Reaches minor flood levels are expected to increase in the next 12 hours. Moderate flooding is expected to increase at Ipswich today. In the Brisbane Metropolitan area, the effects of Upper Brisbane river runoff, Metropolitan creek runoff and an apparent Moreton Bay Tide height of approx. 1 metre above predicted heights, is expected to cause moderate flooding of low lying areas on the high tide at about midday in the city area.
WARNING NO 6 Renewal of ,Flood Warning Brisbane Valley issued by the Bureau of Meteorology, Brisbane at 7.00 am Saturday 26/1/74
Heavy rainfalls up to 127 mm at Moore were recorded in the 18 hours to 3 am in the Upper Brisbane River, Lockyer creek, and Bremer River. Moderate to major flooding is expected today in these streams and increasing minor flooding is in the Brisbane River Middle Reaches. Moderate flooding is expected to increase at Ipswich today. A height of 14 feet is expected at the Brisbane Port Office gauge on the high tide at 12 Noon today. This is similar to the flood Peak of 1931. Moderate flooding will be experienced.
WARNING NO 7 Renewal of Flood Warning Brisbane Valley issued by the
Bureau of Meteorology, Brisbane at 1.00 am Saturday 26/1/74
Heavy rainfalls averaging 80 mm to 120 mm were recorded over the Brisbane River tributaries in the 24 hours to 9 am. Major flood levels are rising in the Upper Brisbane River, Lockyer Creek and the Bremer River areas with widespread traffic disabilities. Moderate flooding is expected in the next
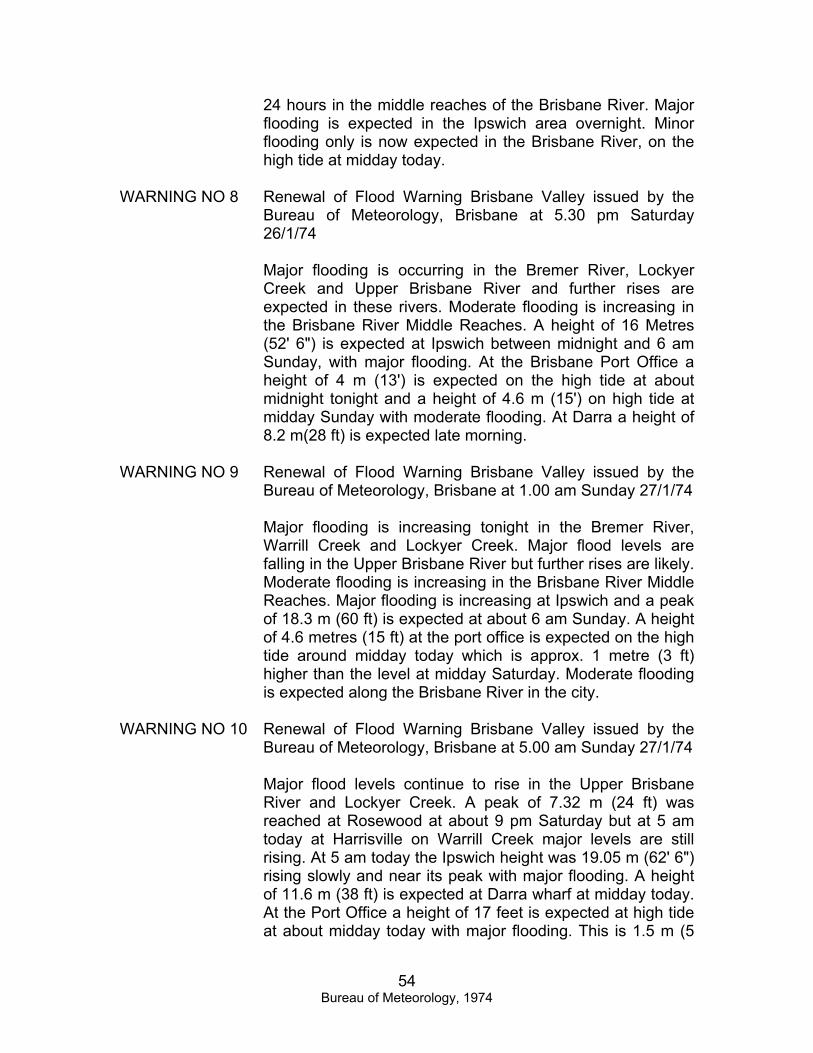
54 Bureau of Meteorology, 1974
24 hours in the middle reaches of the Brisbane River. Major flooding is expected in the Ipswich area overnight. Minor flooding only is now expected in the Brisbane River, on the high tide at midday today.
WARNING NO 8 Renewal of Flood Warning Brisbane Valley issued by the
Bureau of Meteorology, Brisbane at 5.30 pm Saturday 26/1/74
Major flooding is occurring in the Bremer River, Lockyer Creek and Upper Brisbane River and further rises are expected in these rivers. Moderate flooding is increasing in the Brisbane River Middle Reaches. A height of 16 Metres (52' 6") is expected at Ipswich between midnight and 6 am Sunday, with major flooding. At the Brisbane Port Office a height of 4 m (13') is expected on the high tide at about midnight tonight and a height of 4.6 m (15') on high tide at midday Sunday with moderate flooding. At Darra a height of 8.2 m(28 ft) is expected late morning.
WARNING NO 9 Renewal of Flood Warning Brisbane Valley issued by the
Bureau of Meteorology, Brisbane at 1.00 am Sunday 27/1/74
Major flooding is increasing tonight in the Bremer River, Warrill Creek and Lockyer Creek. Major flood levels are falling in the Upper Brisbane River but further rises are likely. Moderate flooding is increasing in the Brisbane River Middle Reaches. Major flooding is increasing at Ipswich and a peak of 18.3 m (60 ft) is expected at about 6 am Sunday. A height of 4.6 metres (15 ft) at the port office is expected on the high tide around midday today which is approx. 1 metre (3 ft) higher than the level at midday Saturday. Moderate flooding is expected along the Brisbane River in the city.
WARNING NO 10 Renewal of Flood Warning Brisbane Valley issued by the
Bureau of Meteorology, Brisbane at 5.00 am Sunday 27/1/74
Major flood levels continue to rise in the Upper Brisbane River and Lockyer Creek. A peak of 7.32 m (24 ft) was reached at Rosewood at about 9 pm Saturday but at 5 am today at Harrisville on Warrill Creek major levels are still rising. At 5 am today the Ipswich height was 19.05 m (62' 6") rising slowly and near its peak with major flooding. A height of 11.6 m (38 ft) is expected at Darra wharf at midday today. At the Port Office a height of 17 feet is expected at high tide at about midday today with major flooding. This is 1.5 m (5

55 Bureau of Meteorology, 1974
ft) higher than the height observed at midday Saturday. At Tennyson Power Station the height at midday today is expected to be 3.35 m (11 ft) higher than at the height at midday Saturday and at Darra Wharf the height at midday is expected to be 4.57 m (15 ft) higher than at midday Saturday.
WARNING NO 11 Renewal of Flood Warning Brisbane Valley issued by the
Bureau of Meteorology, Brisbane at 1.30 pm Sunday 27/1/74
Major flooding continues in the catchments of the Bremer, Lockyer Creek, Upper Brisbane River and Brisbane River Middle Reaches. Brisbane River levels are expected to continue to rise today and a height of 19.5 feet is expected at the Port Office by Midnight tonight, and a height of 21 feet is expected at the Port Office by midmorning tomorrow, Monday with major flooding increasing. Tonight’s height at the Port Office by midnight is expected to be 2 ft 6 inches, above the height at high tide at about midday today. At Ipswich the height at 12 Noon was 19.58 m (64' 3") and rising very slowly. Major flooding is expected to continue in the Ipswich area overnight.
WARNING NO 12 Renewal of Flood Warning Brisbane Valley issued by the Bureau of Meteorology, Brisbane at 6 pm Sunday 27/1/74
Further rains are expected throughout the Brisbane River catchment again tonight although not as heavy as the past 24 hours. Major flood levels continue to rise throughout the Brisbane River and major flooding is widespread. The Brisbane River is expected to continue rising tonight and reach a height of 20 feet at the Port Office by midnight tonight with further rises continuing tomorrow. The height at Ipswich was 19.61 metres and falling slowly and major flooding is expected to continue in the Ipswich area overnight.
WARNING NO 13 Renewal of Flood Warning Brisbane Valley issued by the Bureau of Meteorology, Brisbane at 9 pm Sunday 27/1/74
Further rain is expected throughout the Brisbane River Catchment again tonight although not as heavy as the past 24 hours. Major flooding is occurring throughout the Brisbane Valley and will continue tomorrow although major flood levels are falling slowly at Ipswich. The Brisbane River at Moggil was 20 metres (65' 7") and rising at 8 pm and

56 Bureau of Meteorology, 1974
downstream at the Brisbane Port Office the height is expected to exceed 6.10 m (20' 0") overnight and reach 6.7 m (22' 0") by 12 noon tomorrow being 1.52 m (5' 0) higher than the peak height recorded today at 12.45 pm.
WARNING NO 14 Renewal of Flood Warning Brisbane Valley issued by the
Bureau of Meteorology, Brisbane at 5 am Monday 28/1/74
Little rain has been recorded over the Brisbane River Catchment overnight and only light rain is expected today. The Brisbane River major flood peak is expected at Mt. Crosby this morning and relief from major flooding in Ipswich will not commence until the peak moves into the lower reaches below Moggil this afternoon. A peak of 17.68 m (58 ft) is expected at Goodna by 3 pm this afternoon whilst further downstream at the Brisbane Port Office the height is expected to reach 6.4 m (21 ft) by 12 noon followed by a peak of 6.7 m (22 ft) during the early morning of Tuesday 29th January. Widespread major flooding of low lying areas adjacent to the river is expected to continue.
WARNING NO 15 Renewal of Flood Warning Brisbane Valley issued by the Bureau of Meteorology, Brisbane at 2 pm Monday 28/1/74
Major flood levels are now receding throughout the Bremer River catchment and the Brisbane River above Mt. Crosby. At 10 am today the height at Mt. Crosby was 65' 0" (19.81 m) and stationary. At 12 noon the height at Ipswich was 64' 6" (19.66 m) and falling very slowly. At 12 noon the height at Moggill was 69' 2" (21.08 m) and at its peak. At the Brisbane Port Office a height of 21 feet (6.4 m) was reached at 1.30 pm. A Port Office height not exceeding 22 ft is expected on the high tide between 1 am and 2 am Tuesday 29th January. This is one foot higher than the height observed at 1.30 pm today at the Port Office at the lower end of Edward St., City. River levels will remain fairly stationary between 2 am and 4 pm on Tuesday.
WARNING NO 16 Renewal of Floodwarning Brisbane Valley issued by the
Bureau of Meteorology, Brisbane at 5 am Tuesday 29/1/74
The main peak of 21' 8" occurred at 2.15 am at the Brisbane Port Office and flood levels will recede slowly reaching successively lower peaks on the high tides. All Major flood levels are now falling. At 4.30 am the Brisbane River at Mt. Crosby was 54' 10" (16.71 m). At 5 am the Bremer River at

57 Bureau of Meteorology, 1974
Ipswich was 60' 10" (18.54 m) and at 3 am at Moggill the height was 66' 9" (20.35 m). On the next high tide at 2 pm this afternoon the Brisbane River at the Port Office will be approximately 20' (6.1 m). This will be 1' 0" below the previous peak at 1 pm on yesterdays high tide.
WARNING NO 17 Renewal of Flood Warning Brisbane Valley issued by the Bureau of Meteorology, Brisbane at 11 am 29/1/74
The main peak of 21' 8" passed the Brisbane Port Office at 2.15 am this morning. Major flooding is receding in the valley. At 8.30 am the Brisbane River at Mt. Crosby was 51' 2" (15.6 m), at 9 am the Bremer River at Ipswich was 58.7' (17.9 m) and the Brisbane River at Moggil 64' (19.5 m). At 10 am the Port Office gauge was 20' 8". On the next high tide at 2 pm the Port Office gauge will be approximately 20' 9" (6.3 m). The river will continue to fall slowly with some small rises on high tides and is expected to remain above the flood height of 10' at the Port Office until Friday. No further rain is expected.
WARNING NO 18 Renewal of Flood Warning Brisbane Valley issued by the
Bureau of Meteorology, Brisbane at 2.30 pm Tuesday 29/1/74
At the time of this afternoon’s normal high tide at 2 pm the Brisbane River held steady at 20' 7" at the Brisbane Port Office. By the next high tide time at 2.30 am tomorrow the Port Office height should fall to 17.5' (5.3 m). The river will remain above the flood height of 10' (3 m) until Friday. Flood levels are falling throughout the valley. The latest reports available are Brisbane River at Murrumba at 9 am 43' 6" (13.3 m). at Lowood at midday 56' (17.1 m), at Mt Crosby at 8..30 am 51' 2" (15.6 m) and at Moggill at 2 pm 60' 8" (18.5 m). The Bremer River at Ipswich at 9 am 58.7' (17.9 m). No further significant rainfall is expected in the next 24 hours.
WARNING NO 19 Renewal of Flood Warning Brisbane Valley issued by the
Bureau of Meteorology. Brisbane at 11.15 pm Tuesday 29/1/74
River levels continue to fall throughout the Brisbane Valley. At 6.30 pm Tuesday 29th the height at Mt. Crosby was 45' 4" (13.79 m) and falling. At the Brisbane Port Office the height at 11 pm Tuesday 29th was 17' 10" and falling and is expected to fall to a height of 17.5 ft by 2 am Wednesday

58 Bureau of Meteorology, 1974
30th. A Port Office height of 13 ft is expected with the low tide at 9 am Wednesday followed by a height of 12.5 feet with the high tide at about 2.30 pm.
WARNING NO 20 Renewal of Flood Warning Brisbane Valley issued by the Bureau of Meteorology, Brisbane at 5 am Wednesday 30/1/74
River levels are still falling throughout the Brisbane River and tributaries. At 3 am today the height at Caboonbah below the junction of the Stanley and Upper Brisbane River had fallen to 7.24 m (23' 9") and at Ipswich the 3 am height was 14.10 m (46' 3") and falling fast. At the Brisbane Port Office the height at 5 am was 16' 8" and a height of 14 ft is now expected at 9 am, followed by a height of 12' 6" at high tide at about 2.30 pm today.
WARNING NO 21 Renewal of Flood Warning Brisbane Valley issued by the
Bureau of Meteorology, Brisbane at 11.30 am Wednesday 30/1/74
River levels are falling throughout the Brisbane River and tributaries. At 9 am this morning the Brisbane River at Caboonbah had fallen to 4.8 m (15' 9") and Mt. Crosby was 10.34 m (33' 11") at 8.30 am. The Bremer River at Ipswich was 12.95 m (42' 6") at 7.30 am. At the time of the normal high tide at 2.30 pm this afternoon the Brisbane River at the Port Office gauge will fall to 4.2 m (13' 9") and on the low tide at 9 pm this evening 3.4 m (11'). The Port Office gauge height on the high tide at 3 am tomorrow is expected to be 3.2 m (10' 6").
WARNING NO 22 Renewal of Flood Warning Brisbane Valley issued by the
Bureau of Meteorology, Brisbane at 9.45 pm Wednesday 30/1/74
River levels continue to fall quickly throughout the Brisbane Valley. At 9 pm Wednesday 30/1/74 the Ipswich height had fallen to 8.81 m (28' 11"). At 8.30 pm the height at Mt. Crosby on the Brisbane River had fallen to 7.19 m (23' 7"). At the Brisbane Port Office the height at 9 pm was 9' 8". At 3 am on Thursday 31/1/74 a height of 9 ft is expected at the time of high tide. On the following low tide at 10 am a height of 6 ft is expected. Minor flooding will ease in the city reaches of the Brisbane River during Thursday 31/1/74.

59 Bureau of Meteorology, 1974
WARNING NO 23 Final Flood Warning Brisbane Valley issued by the Bureau of Meteorology, Brisbane at 5.30 am Thursday 31/1/74
River levels have continued to fall overnight in all parts of the Brisbane Valley. At the high tide at 3 am the height at the Port Office had fallen to 9' 8". Minor flooding has eased in the Brisbane City reaches.

60 Bureau of Meteorology, 1974
APPENDIX 2B: SPECIAL WARNINGS TO ABC, QRNS, MACQUARIE NEWS, RACQ, BRISBANE COMMERCIAL
RADIO STATIONS Latest information on Brisbane River from Bureau of Meteorology at 9.45 pm (28/1/74) Major flood levels are continuing to recede throughout the Bremer River Catchment and the Brisbane River above Mt. Crosby. At 8.30 pm the height at Mt. Crosby was 61.8 feet (18.85 m) and falling. At 9 pm the height at Ipswich was 63.06 feet (19.28 m) falling very slowly. At the Brisbane Port Office at 9 pm the height was 20' 10" and a height not exceeding 22 feet is expected on the high tide between 1 am and 2 am Tuesday 29th January. This is one foot higher than the height observed at the Port Office at the lower end of Edward Street City. River levels will remain fairly stationary between 2 am and 4 pm on Tuesday. Latest information on Brisbane River 2.55 am 29/1/74 The peak at the Port Office was 21' 8" at 2.15 am and dropped slightly at 2.30 am. This will not be exceeded on further high tides. Advice as to the peak expected on this afternoons tide will be given with the 6 am bulletin. Passed to A.B.C. 2.55 am. DISTRIBUTION TELEX 40337 (POLICE BNE) PRIORITY TELEX 40101 For QRNS PRIORITY TELEX 41007 RACQ TELEX 40259 MACQUARIE NEWS ABC STUDIO SUPERVISOR 71.2277 4KQ ) 4BK ) TAPE RECORDER 4BC ) 4BH )

61 Bureau of Meteorology, 1974
APPENDIX 3: TEXT OF BRISBANE METROPOLITAN CREEKS FLOOD WARNINGS FROM 7.45 am 25
JANUARY TO 9.30 pm 26 JANUARY 1974 WARNING NO 1 Initial flood warning issued by the Bureau of
Meteorology at 7.45 am on Friday 25/1/74 for Brisbane Metropolitan Creeks.
General heavy rains have been recorded over Brisbane Metropolitan Creek catchments with falls averaging 90 to 100 mm (360 to 400 pts) most of which has been recorded since midnight. Further heavy rains are expected today with falls of approx. 50 mm (2 inches) expected between 8 am and 12 Noon. Flooding is expected in Metropolitan Creeks, particularly Kedron Brook and Enoggera Creek with the danger period being between 11 am and 2 pm.
WARNING NO 2 Renewal of Flood Warning issued by the Bureau of Meteorology at 10.00 am on Friday 25/1/74 for Brisbane Metropolitan Creeks.
Heavy rainfalls averaging 100 to 110 mm (4 to 4½ inches) were recorded in the 24 hours to 9 am in Brisbane Metropolitan Creek Catchments. A further 25 mm (100 points) has been recorded in the one hour to 10 am and similar hourly falls are expected up to 12 Noon. Major flooding is expected in Brisbane Creeks particularly Kedron Brook and Enoggera Creek with the peaks occurring between 12 Noon and 2 pm. Flood levels at this stage are expected to be similar to but slightly less than the floods of February and April 1972.
WARNING NO 3 Renewal of Flood Warning issued by the Bureau of
Meteorology at 12 Noon on Friday 25/1/74 for Brisbane Metropolitan Creeks.
General 50 mm (4") rainfalls have been recorded in the 3 hours between 9 am and 12 Noon and further similar falls are expected in the next 3 to 4 hours. Major flood levels are expected to increase in the next 3 to 4 hours in most suburban creeks particularly Kedron Brook and Enoggera-Breakfast Creek with

62 Bureau of Meteorology, 1974
levels now expected to be slightly higher than the floods of February and April 1972.
WARNING NO 4 Renewal of Flood Warning issued by the Bureau of
Meteorology at 4 pm on Friday 25/1/74 for Brisbane Metropolitan Creeks.
Major flooding in Metropolitan Creeks and particularly Enoggera Creek and Kedron Brook is expected to generally ease after about 5 pm today and creek flood levels will fall rapidly for the following 6 hours. Only light rain is expected overnight.
WARNING NO 5 Renewal of Flood Warning issued by the Bureau of
Meteorology at 9.30 pm on Friday 25/1/74 for Brisbane Metropolitan Creeks.
Continued rains averaging 12 mm per hour have been recorded in the Brisbane area tonight and further similar falls are expected during the next 12 hours. An apparent storm surge in Moreton Bay is causing tide levels to be approximately 1.07 m (3' 6") above predicted heights. Little change is expected in flood levels during the next 12 hours in the lower reaches of Brisbane Metropolitan Creeks.
WARNING NO 6 Renewal of Flood Warning issued by the Bureau of
Meteorology at 11 pm on Friday 25/1/74 for Brisbane Metropolitan Creeks.
Heavy rains have increased again in Brisbane Creek Catchments with hourly rainfalls of approximately 25 mm (1 inch) and similar intensities are expected to continue for the next 6 hours. Serious major flooding is expected in all Brisbane Creeks including Enoggera-Breakfast Creek, Kedron Brook and Moggill Creek. Flood levels early tomorrow (Saturday) will exceed those observed early this afternoon. Further information will be issued through radio stations throughout the night as new data becomes available.
WARNING NO 7 Renewal of Flood Warning issued by the Bureau of
Meteorology at 12.30 am on Saturday 26/1/74 for Brisbane Metropolitan Creeks.

63 Bureau of Meteorology, 1974
Heavy flood rains are expected to continue in Brisbane Metropolitan Creeks with intensities during the next 3 to 6 hours up to 40 mm (160 pts) per hour. Record flooding is now occurring in the Enoggera Creek at Enoggera Reservoir. Serious major flooding is expected to increase to record levels in all creeks and particularly Moggill Creek, Enoggera-Breakfast Creek and Kedron Brook. Further information will be issued through radio stations as more data becomes available.
WARNING NO 8 Renewal of Flood Warning issued by the Bureau of
Meteorology at 3.30 am on Saturday 26/1/74 for Brisbane Metropolitan Creeks.
Heavy rain has eased in the 3 hours between midnight and 3 am and all creeks in Brisbane city area should fall up until 6 am when creek levels will commence to fall more slowly. However very intense rainfalls are being recorded in parts of the Oxley Creek catchment and major flooding is expected through Oxley, Rocklea and Inala later today.
WARNING NO 9 Renewal of Flood Warning issued by the Bureau of
Meteorology at 6 pm on Saturday 26/1/74 for Brisbane Metropolitan Creeks.
Heavy rains have commenced again in the Brisbane Metropolitan Creek Catchments and falls up to 25 mm (1 inch) per hour are expected during the next 6 hours. Major flooding is expected again tonight in Metropolitan Creeks particularly Kedron Brook, Enoggera-Breakfast Creek and Moggill Creek, however at this stage flood levels are expected to be less than those experienced between midnight & 3 am today. The critical period will be between 10 pm and 3 am.
WARNING NO 10 Renewal of Flood Warning issued by the Bureau of
Meteorology at 9.30 pm on Saturday 26/1/74 for Brisbane Metropolitan Creeks.
Heavy rains up to 25 mm/hr (1 inch/hr) are now being recorded throughout the Brisbane area and these intensities are expected to be maintained during the next 6 hours. Major flooding is expected in all

64 Bureau of Meteorology, 1974
Metropolitan Creeks tonight particularly in Kedron Brook, Enoggera-Breakfast Creek and Moggill Creek. Levels are now expected to be similar to those experienced between Midnight and 3 am today with the serious flooding around Midnight. Further flood warnings will be issued through radio stations as new data becomes available.
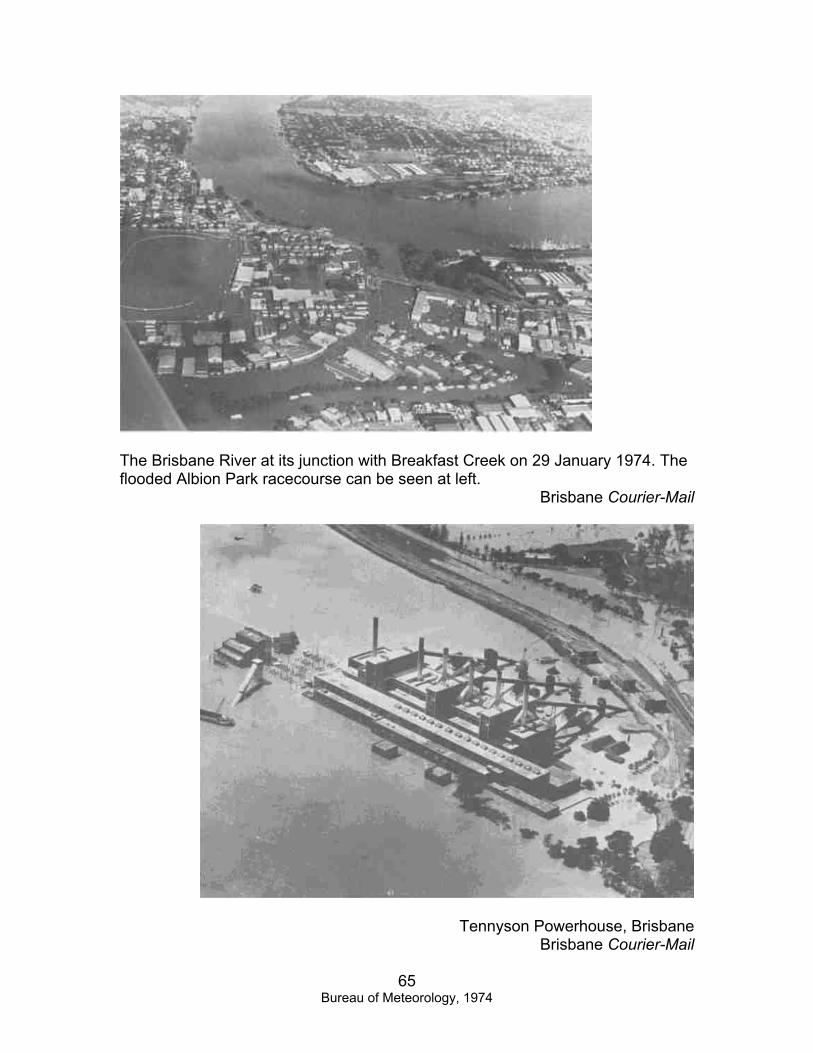
65 Bureau of Meteorology, 1974
The Brisbane River at its junction with Breakfast Creek on 29 January 1974. The flooded Albion Park racecourse can be seen at left.
Brisbane Courier-Mail
Tennyson Powerhouse, Brisbane Brisbane Courier-Mail

66 Bureau of Meteorology, 1974
Centenary Bridge, Jindalee on 27 January 1974. The barge in the foreground became jammed against the bridge and it was subsequently deliberately sunk. The bridge was badly damaged (see page 36 of this report).
Brisbane Courier-Mail
Flooding in Margaret St., Brisbane. The temporary flood gauge (heights in metres), at left, was installed by the Bureau of Meteorology when readings could
no longer be obtained from the Port Office (see page 38 of this report). Brisbane Courier-Mail

67 Bureau of Meteorology, 1974
Flood devastation in the Brisbane suburb of Yeronga on 30 January 1974
Queensland Times Ipswich
Flooding in the Ipswich business area. Queensland Times Ipswich

68 Bureau of Meteorology, 1974
The aftermath of the flood: Severe erosion of the banks of the Brisbane River at Goodna
Brisbane Sunday Sun
A graveyard of house stumps in Ipswich, where 41 houses were washed away. Queensland Times Ipswich