bureau of geology, florida department of natural … resource… · kilometre (km) square kilometre...
TRANSCRIPT


IIBLIOCRAPHIC D A T A HEET
I
"Zones, "Water problems, Sand, Clay, Tampa, Limestone, *Suwannee Limestone, Ocala imestone, Hawthorn Formation, Avon Park Formation, Venice Clay
1. Report No.
Aurlror(s1 B. F. .Joyner and H. Sutcliffc, Jr.
U.S.Geologica1 Survey, Water Resources Division 325 John Knox Road Suite F-240 Tallahassee, Florida 32303 1. Sponsoring Orgrnrracaon Name m d Addiesr
U.S.Geologica1 Survey, Water Resources Division 325 John Knox Road Suite F-240 Tallahassee, Florida 32303
Tirlc and Subczrle WATER RESOURCES OF THE MYAKKA RIVER BASIN
AREA, SOUTHWEST FLORIDA
8. I'erforrnind U-,qnnirdiion Peps.
USGSIWKI 76-58
11. C o r ~ r r a c ~ , ' ~ , : , , ~ , ~ h,,.
13. l y p c or liiparr & 1 ' ~ ~ i u J Covered
Final 14.
5. Reparc Urcr uecember 1976
6.
2.
Pcrformrng U r g a n ~ r r r l o n Name a n d h d d r e s 110. l ' ro~cc: ' 1 , ~ ~ k : Y i ~ ~ ~ l Lr l r No.
'. suppicmen'rry NoreiFrepared in cooperation with Bureau of Geology, Florida Department of atural Resources, Sarasota County, City of Sarasota, and the Florida Department of
Z s ~ r o ~ n d w $ r in the Myakka River basin area is obtained from a water-table aqui an+> 12- -"
er and from five zones in an artesian aquifer. Wells in the waterytable aquifer yield enerally less..than 50 gallmin and dissolved solids concentration is less than 500 mg/l. xcept in,coastal areas and the peninsula southwest of the Myakka River estuary. Wells n the Venice area that tap zone.lusually yield lesq than 30 gallmin. The quality ok he water is good except in the peninsula area. Zone 2 is the most highly developed quifer in the heavily populated coastal areas. Wells yield as much as 200 gallmin. In ost areas, water is of acceptable quality.Wells that tap zone 3 yield as much as 500 alln~in. Fluoride concentration ranges from 1 to 3.5 mgil. Zone 4 yields as much as ,500 gallmin to large diameter wells. Except in the extreme northeastern part of the rea wacer from zone 4 usually contains high concentrations of fluoride and sulfate. one 5 is the most productive aquifer in the area, but dissolved solids concentrations sually are too high for public supply except in the extreme nartheast.Surface water de- ived from natural drainage is of good qua1ityexi:ept cor occasional high color jn summer
7. Key Words and Docurncnr Anrlysas. 170. D e s c r i p r o r ~
*Ground water, *Surface water, *Water quality, "Water supp l .y , Aquifer, ~trteiinn w a L - r ater wells, Water table, Floods, Irrigation
7c. CUSA-11 Flclil/(',rnup
1. Rec ip ientsr A C C ~ S S ~ O ~ X U .
21. No. oi t'agca
87 22. iiricc
0. .iiall.,bklity S t a r r m u n t
No restriction an distribution.
3rnM NT16.35 I R E " . 3 - 1 2 , T l l l S F O R M M A Y n E R l i P R O U U C E O
" I C O U M O C 1 4 9 S 2 . P
19. Secur i ty ( : I r i s ( T h i s R,~pnir)
I ' N < . I , A S S I F I I ~ D '20. Sciurlry ( 1 . 1 ~ ~ C i h i r
Past U N C I . A . ~ S I I ~ ' I T I ~

WATER RESOURCES OF THE MYAKKA RIVER
BASIN AREA, SOUTHWEST FLORIDA
By B. F. Joyner and H. Sutcliffe, Jr.
U.S. GEOLOGICAL SURVEY
Water-Resources Investigations 76-58
Prepared in cooperation with the
BUREAU OF GEOLOGY, FLORIDA DEPARTMENT OF NATURAL RESOURCES, SARASOTA COUNTY, CITY OF SARASOTA, and the FLORIDA DEPARTMENT OF ENVIRONMENTAL REGULATION
ENVIRONMENTAL CONTROL
MAR 1 1978
December 1976

UNITED STATES DEPARTMENT OF THE INTERIOR
Thomas S. Kleppe, Secretary
GEOLOGICAL SURVEY
V . E . McKelvey, Director
For additional information write to:
Q.S. Gmbgtcal Survey 325 J o b bsn &ad Suite F-2.W Tallahassee. Fllor&rh 32303

Page
Abstract . . . . . . . . . . . . . . . . . . . . . . . . . . . . . 1 . . . . . . . . . . . . . . . . . . . . . . . . . . . Introduction 5
Purpose and scope . . . . . . . . . . . . . . . . . . . . . . 5 Acknowledgments . . . . . . . . . . . . . . . . . . . . . . . 6
. . . . . . . . . . . . . . . . . . . Previous investigations 7 . . . . . . . . . . . . . . . . . . . . . Description of the area 8
Location . . . . . . . . . . . . . . . . . . . . . . . . . . 8 . . . . . . . . . . . . . . . . . . . Topography and drainage 8
Hydrology . . . . . . . . . . . . . . . . . . . . . . . . . . . . 12 . . . . . . . . . . . . . . . Rainfall and evapotranspiration 13
. . . . . . . . . . . . . . . . . . . . . . . . Groundwater 17 . . . . . . . . . . . . Geologic and hydrogeologic units 17
. . . . . . . . . . . . . . . . . . Water-table aquifer 20 . . . . . . . . . . . . . . . . . The artesian aquifer system 31
. . . . . . . . . . . . . . . . . . . . Artesian zone-1 32
. . . . . . . . . . . . . . . . . . . . Artesian zone-2 35
. . . . . . . . . . . . . . . . . . . . Artesian zone-3 41 Artesian zone-4 . . . . . . . . . . . . . . . . . . . . 44 Artesian zone-5 . . . . . . . . . . . . . . . . . . . . 49
. . . . . . . . . . . . . . . . . Potentiometric surface 56 Surfacewater . . . . . . . . . . . . . . . . . . . . . . . . 59
Streamflow . . . . . . . . . . . . . . . . . . . . . . . 59 . . . . . . . . . . . . . . . . . . . . . Waterquality 61
Lakes . . . . . . . . . . . . . . . . . . . . . . . . . 64 Springs . . . . . . . . . . . . . . . . . . . . . . . . 65
Water use . . . . . . . . . . . . . . . . . . . . . . . . . . . . 67 Waterproblems . . . . . . . . . . . . . . . . . . . . . . . . . . 72
Floods . . . . . . . . . . . . . . . . . . . . . . . . . . . 73 Drainage . . . . . . . . . . . . . . . . . . . . . . . . . . 74 Supply . . . . . . . . . . . . . . . . . . . . . . . . . . . 75 Contamination . . . . . . . . . . . . . . . . . . . . . . . . 76
Summary . . . . . . . . . . . . . . . . . . . . . . . . . . . . . 79 Selected references . . . . . . . . . . . . . . . . . . . . . . . 83
ILLUSTRATIONS
. . . . Figure l...Map showing location of Myakka River basin area 9 2.--Map of Myakka River basin area showing principal
. . . . . . . . . . topographic and drainage features 10 3.--Graphs showing annual and mean monthly rainfall in
the Myakka River basin area . . . . . . . . . . . . . 14 4.--Generalized sectionsA.A1, B.B', C-C' and D-D'
showing lithologic units of Oligocene age and younger, underlying the Myakka River basin area . . . 21
iii

ILLUSTRATIONS (Continued)
Page
Figure 5.--Generalized sections E-E', F-F', and G-G' show- ing lithologic units of Oligocene age and younger, underlying the Myakka River basin area . . .
6.--Map showing location of wells referred to in this report and lines of sections . . . . . . . . . .
7.--Hydrographs of selected observation wells tapping the water-table, aquifer . . . . . . . . . . . . . . .
8.--Diagrams showing chemical quality of water from wells tapping the water-table aquifer . . . . . . . .
9.--Hydrographs of selected observation wells tapping Zone-2. . . . . . . . . . . . . . . . . . . .
10.--Diagrams showing chemical quality of water from wells tapping Zone 2 . . . . . . . . . . . . . .
11.--Diagrams showing chemical quality of water from wells tapping Zone 3. . . . . . . . . . . . . . . . .
12.--Hydrographs of selected observation wells . . . . . . . . . . . . tapping Zones 2, 3, 4, and 5.
13.--Diagrams showing chemical quality of water from Zone 4 and composite chemical quality of water from Zones 2, 3, and 4. . . . . . . . . . . . . . . .
14.--Diagrams showing composite chemical quality of water from Zones 2, 3, 4, and 5, and Warm Salt Springs . . . . . . . . . . . . . . . . . .
15.--Map showing generalized configuration of com- posite potentiometric surface of Zones 2, 3, 4,and5inJune1966 . . . . . . . . . . . . . . . .
16.--Map showing generalized configuration of com- posite potentiometric surface of Zones 2, 3, 4 , and 5 in November 1966 and area of artesian flow .
17.--Map showing surface-water sampling sites . . . . . . . 18.--Graph of pumpage for the cities of Sarasota
and Venice, 1962-66 . . . . . . . . . . . . . . . . .
TABLES
Table 1.--Geologic units penetrated by water wells in the Myakka River basin area. . . . . . . . . . . . . . . . 18
2.--Zonal subdivisions of the artesian aquifer system underlying the Myakka River basin area . . . . . . . . 19
3.--Analyses of water obtained from two wells that tap Zone 1 in Englewood and Venice area. . . . . . . . 3 4
4.--Analyses of water obtained from a well that taps Zones 2, 3, and 4 . . . . . . . . . . . . . . . . 50

TABLES (Continued)
Page
. . Table 5.--Analyses of water from Warm Salt Spring and well 5. 55 6.--Range in quality of surface water in the Myakka
. . . . . . . . . . . . . . . . . . . River basin area 6 2 7.--Estimated ground-water use in the Myakka River basin
. . . . . . . . . . . . . . . . . . . . . area in 1965 68
For use of those readers who may prefer to use metric units rather than English units, the conversion factors for the terms used in this report are listed below
Multiply English unit a inch (in) 25.4 foot (ft) .3048 mile (mi) 1.609
2 square mile (mi ) 2.590 acre .4047 acre-foot (acre-ft) .001233 gallon (gal) 3.785 gallon per minute (gallmin) .06309 million gallons per day (Mgal/d) .04381
cubic feet per second (ft31s) .02832
To obtain metric unit
millimetre (mm) metre (m) kilometre (km)
2 square kilometre (km ) hectare (ha) cubic hectometre (hm3) litre (1) litres per second (11s) cubic metres per second
(1~31s ) cubic metres per second
(m3/s)

WATER RESOURCES OF THE MYAKKA RIVER BASIN AREA,
SOUTHWEST FLORIDA
BY
B. F. Joyner and H. Sutcliffe, Jr.
ABSTRACT
The Myakka River basin area covers about 1,120 square miles (2,900
square kilometres) and includes all of Sarasota County, and parts of
Manatee, Charlotte, Hardee, and DeSoto Counties. Most of the area
is less than 100 feet (30 metres) above mean sea level. Drainage is
poor in much of the area and there are many swamps along the poorly
defined stream channels.
Ground water in the Myakka River basin area is obtained from a water-
table aquifer and an artesian aquifer system consisting of several
parts, referred to in this report as zones 1 through 5. The water-
table aquifer is composed of layers of sand, shell, marl and phosphate
gravel, intermixed locally with sandy clay. The five zones of the
artesian aquifer are as follows: (1) zone-1, semi-consolidated shell,
clay, and limestone beds usually at depths less than 70 feet (21 metres)
and best defined in the Venice area; (2) zone-2, consolidated clay,
sandstone, and limestone of the upper unit of the Hawthorn Formation
below a clay layer, which is present only in the coastal area, at
depths of about 200 feet (61 metres); (3) zone-3, consolidated clay,
limestone, and sandy limestone of the lower 60 to 80 feet (18 to
24 metres) of the Hawthorn Formation and upper part of the Tampa Lime-
stone at depths ranging from 250 to 450 feet (75 to 140 metres); ( 4 ) zone-4,
the lower part of the Tampa Limestone, Suwannee Limestone and the upper
part of the Ocala Limestone between 500 and 700 feet in depth (r50 to

210 metres); and (5) zone-5, dense dolomitic limestone and dolomite oE
the Avon Park Limestone at depths of 1,000 to 1,500 feet (305 to 460
metres) below land surface.
Wells in the water-table aquifer usually yield less than 50 gallons
per minute (3.2 litres per second). The dissolved solids concentration
of the water is usually less than 500 milligrams per litre, except in
coastal areas and the peninsula west of the Myakka River estuary where the
the water is highly mineralized.
Yields from wells tapping zone-1 are usually no greater than 30
gallons per minute (2 litres per second) in the Venice area. The,quality
of zone-1 water is good except in the peninsula southwest of the Myakka
River estuary where the water also is highly mineralized. Water color
is sometimes high, especially where direct recharge occurs through beds
containing organic materials.
Zone-;! is the most highly developed aquifer in the heavily popula-
ted coastal areas. Yields as great as 200 gallons per minute (13 litres
per second) can be obtained from wells that penetrate all of zone-2. In
most areas, water of acceptable quality can be obtained from zone-2.
However, the fluoride or sulfate concentrations in the water from some
wells often exceeds recommended limits for drinking water in the area.
Chloride concentrations as high as 15,600 milligrams per litre occur in
the peninsula southwest of the Myakka River estuary.

Wellstapping zone-3 yield as much as 500 gallons (1,900 litres)
per minute. The fluoride concentrations are usually high, ranging from
about 1.0 to 3.5 milligrams per litre. Concentrations of sulfate in
water from zone 3 often are high in the southern half of the area.
Zone-4 yields as much as 1,500 gallons (5,700 litres) per minute
to large diameter wells. Except in the extreme northeastern part of
the area the water from zone-4 usually contains high concentrations of
fluoride and sulfate.
Zone-5 is the most productive aquifer in the area, but the water
is usually too highly mineralized for public supply except in the extreme
northeastern part of the area. The mineralization is sufficiently low,
however, that the water can be used for irrigation purposes or condenser
cooling.
Hany non-tidal reaches of streams virtually go dry during the
late spring of most years. Floods occur frequently, especially in
low-lying areas, but most of the water runs off and cannot be
utilized because of a lack of storage.
Surface water derived from natural drainage is of good quality
during normal and high flows, except for the occasional occurrence of
high color and temperatures of about 3Z0c (900F) during the summer.
Low stream flows are often supplemented by waters having a high dissolved-
concentration derived from irrigation wells and domestic wastes.

Use of ground water in 1965 is estimated to have averaged
about 45 million gallons (170,000 cubic metres) per day for
municipal, industrial, domestic and irrigation purposes. Use of
surface water is estimated to have been about 2.5 million gallons
(9,500 cubic metres) per day for public water supply and pasture
irrigation.
Water problems in the Myakka area include flooding, excessive
drainage, inadequate supply of water of suitable quality, pollution
and saltwater intrusion.

INTRODUCTION
Purpose and Scope
The purpose of this report is to describe the occurrence
and quality of surface and ground water in the Myakka River Basin
area, to report the amount of ground water used as of 1965, and to
define current and potential water-resources problems. Although
this report presents information about the distribution and variability
in the quantity and quality of the water resources, the major emphasis
is on the ground-water resources. The report provides background data
needed for use in planning more detailed quantitative studies of specific
problems. The investigation upon which the report is based began in
1963 under a cooperative program between the Florida Bureau of Geology
and the U.S. Geological Survey, later supplemented by the city of Sara-
sota and Sarasota County. Finalization of the report was supported by
the Florida Department of Environmental Regulation.
Stage and discharge records from 54 streamflow stations and records
of about 400 wells were collected during 1963-66. The well data include
records of water levels, discharge, well construction, and driller and
geophysical logs. Twenty-one test wells were drilled as part of the in-
vestigation in cooperation with Sarasota County. Water samples were col-
lected for chemical analysis from streams and lakes and from wells. In-
formation on water used for agricultural, industrial, and public supply
purposes was obtained from an inventory made in 1965.

Acknowledgments
The authors express their appreciation to the many residents of
the area who freely gave information about their wells,and to various
public officials, particularly the Sarasota County Commissioners and
the city of Sarasota. Acknowledgment is made of the cooperation received
from Smalley, Wellford and Kalven, consulting engineers to Sarasota
County. Recognition is also expressed to the Sarasota County Agricultural
Extension Agent and the Health Departments of Sarasota and Manatee
Counties for their enthusiastic interest and cooperation. Information on
irrigation of croplands in Sarasota County was furnished by Mr. Jack
Zilles, U. S. Soil Conservation Service, and for Manatee County by Mr.
Thomas Greenawalt, County Agricultural Extension Agent.
The Sarasota County Board of Public Instruction, General Development
Corporation, ~lo'rida Department of Transportation, Manatee County
Highway Department, and Mr. Albert Blackburn gave permission to drill
and maintain observation wells on their properties. Several well
drillers furnished geologic and hydrologic data, permitted collection of
water samples and rock cuttings, and made measurements of water levels
during drilling operations; grove owners and ranchers furnished data
on water use for irrigation.

Previous Investigations
The water resources of the area are described in numerous publi-
cations. Stringfield (1933) made a brief investigation of the ground-
water resources of Sarasota County in 1931 and 1932. Peek (1958)
investigated the ground-water resources of Manatee County and measured
the water levels in many wells in Sarasota County during his study.
Bishop (1960) reported on the fresh-water resources of Sarasota County.
Smith and Gillespie (1960), consulting engineers, prepared an interim
report on ground water for the city of Sarasota. Smalley, Wellford,
and Nalvern (1961 and 1963) consulting engineers, prepared two reports
for the Sarasota County Commissioners. Flippo and Joyner (1968) described
the low-flow characteristics of streams in the basin. A brief summary
Of their findings is presented in this report.
Other investigators have included parts of the Myakka River basin
area in geologic and hydrologic studies. Stringfield (1966) reported
on artesian water in Tertiary limestone in the southeastern United
States. Collins and Howard (1928), Black and Brown (1951), Wander
and Reitz (1951), and the Florida State Board of Health (1960, 1964)
give information about the chemical quality of water in the area.
The reference list at the end of this report includes other investigations
for the area.

DESCRIPTION OF THE AREA
Location
The Myakka River basin area covers about 1,000 mi2 (2,590 km2)
of land and about 120 mi2 (310 km2) of bays and keys bordering the Gulf
of Mexico in southwestern Florida (fig. 1). The area includes
all of the Myakka River basin, part of the Peace River basin
north of Charlotte Harbor, and about 20 small coastal basins and
keys between Charlotte Harbor and the city of Sarasota. The north and
east boundaries are roughly coincident with the Myakka River basin
drainage divide.
Topography and Drainage
Most of the Myakka River basin area is in the Coastal Lowlands
topographic region of Florida (Cooke, 1945, p. 8) , in the Atlantic
Coastal Plain Province. About 11 mi2 (29 km2) in the extreme head-
waters of the Myakka River basin is in the Central Highlands region.
The topography of the area is characterized by a series of gently
sloping marine terraces which were developed during former stages of
sea level. Maximum altitude is 116 ft (35 m) in the northeast part of
the area where the oldest terraces have been dissected into low rolling
hills. The southwestern half of the area is less than 20 ft (6 m)
above sea level (fig 2) and has little local relief.
The larger streams anc canals that make up the drainage system of
the Myakka River basin area are shown in figure 2. The natural stream
channels form a poorly developed drainage system. Large swampy areas
border many channels.


Altitude o f lond surfocc, i n feet above sea level
Greoter than 100 feet
0 20 MILES & 0 10 20 30 KllDMETRES
F I G U R E 2,--PRINCIPAL TOPOGRAPHIC AND D R A I N A G E FEATURES,

In the broad flatlands most natural drainageways are shallow sloughs
which range in width from a few feet to more than one mile. The Myakka
River channel is the only one that is well defined and naturally entrenched
throughout its course. Some of the coastal areas, including most of
the keys, are just above sea level and have no recognizable stream
channels.
Many sloughs and swampy areas have been drained by ditches and
canals. The agricultural areas in the upper Big Slough, Phillippi
Creek, and Cow Pen Slough basins, and the recently developed residential
areas, such as Port Charlotte, have undergone extensive drainage
changes.
Below an altitude of about 60 ft (18 m), hundreds of shallow
depressions dot the landscape. Few of these depressions are the sites
of perennial ponds or lakes, but all, unless drained by canals, hold
water during wet weather.
The Upper and Lower Myakka Lakes are the largest lakes in the
2 area and have a combined water surface of about 1,380 acres ( 5 5 8 3 a )
at lake levels of 13.6 and 9.9 ft (4.1 and 3.0 m) above msl respectively.
The Tatum Sawgrass, a 4,300-acre (1740 ha2) marsh several miles northeast
of Upper Myakka Lake, is several feet above the normal lake level (15-20 ft
or 5 - 6 m above msl). This marsh is flooded only when rainfall is
exceptionally heavy.

HYDROLOGY
The source of all fresh water in the Myakka River basin area is
rain falling either on the immediate area or on adjacent areas.
Most of the rain that falls on the area evaporates. The rest begins
to move toward the sea either over land or beneath the ground surface.
The water that remains on the surface may be stored temporarily in
lakes, ponds, or sloughs, or may flow in streams toward the sea. The
water that filters into the ground and reaches the zone of saturation
becomes ground water. Rain falling through the atmosphere picks up
small quantities of dust particles, atmospheric gases, exhaust gases,
and wind-blow salts which affect the water quality.
When rain reaches the earth, it begins to dissolve or pick up in
suspension some of the materials contacted. The extent of
solvent action depends largely upon the type of mineral contacted,
its susceptibility to chemical and physical attack, contact time, and
the chemical composition of the water itself. Surface waters in the
Myakka River basin area generally contain only small amounts of
dissolved solids. They are often highly colored from contact with
leaves and other decaying vegetation in swampy areas and stream
channels. Ground water on the other hand, is usually low in color,
but contains an appreciable amount of salts dissolved from earth
materials.

Rainfall and Evapotranspiration
The unweighted average mean annual rainfall for 33 years at
6 stations in and near the Myakka River basin area is 54.3 in (1380 mm)
(fig. 3). Rarely is annual rainfall less than 40 in (1,020 mm) or
more than 70 in (1,790 mm).
Rainfall shows a marked seasonal distribution, about 60 percent
of the annual rainfall occurs in June through September (fig. 3). Most
of the summer rainfall is associated with convective thunderstorms
that are usually localized, of short duration, and produce high-intensity
rainfalls. Tropical depressions and hurricanes may produce heavy rain-
fall lasting several days during the summer and fall. Hurricane records
(U. S. Army, Corps of Engineers, 1961, p. 18) indicate that on the average
there is about a 20 percent chance that a hurricane will pass within
50 mi (80 km) of Sarasota each year.
The dry season is from October to May. Often, in the late spring,
no measurable rainfall will occur for 60 days or more. The dry season
is the irrigation season for truck crops and citrus and also the
period of peak population in this area, Therefore, October to May is
the time of high water use and water consumption.

V) 80 2 0 0 0
70 1800 0 5 60 1500 . k j 50 1300 r;! a
40 I 0 0 0 : $ 30 7 5 0 2 ,J 20 5 0 0
3 l o Z
2 6 0
a 0 *) rO 0 0 In
0 m m * la w (D
E E 0, E' E 0, E Y E A R
MONTH 0.
Rainfall of Myakko River basin area computed from rainfall records (unweighted) collected by the U.S. Weather Bureau at Arcadia, Bradenton, Punta Gorda, Sarasota, Wauchula, and Myakka River State Park.
F IGURE 3,--ANNUAL AND MONTHLY R A I N F A L L I N THE MYAKKA R I V E R B A S I N AREA,
14

A wide range of rainfall conditions occurred during the
investigation. The storm of September 20-21, 1962, which occurred
before most project stream-gaging stations were in operation, produced
a 2-day rainfall of such magnitude as may be expected only once every
20 to 60 years (Miller, 1944). Widespread flooding resulted from this
heavy rainfall. On the other hand, the areal rainfall for December 1964
to May 1965 was 29 percent of the mean, resulting in a mild drought.
The amount of water lost to evaporation and transpiration in
humid areas, such as the Myakka River basin area, is largely a function
of air temperature. Data collected by the National Weather Service
indicate that the mean annual air temperature in the Myakka River basin
area is about 73.Z°F (22.g°C). The annual means at the various
temperature recording stations in the area are all within 1.2'F (0.7C)
of the areal mean. Mean daily temperatures range from 84'F (2g°C)
in summer to 61°F (16'C) in winter. Temperatures as high as 104"(40°C)
and as low as lg°F (-7.2'C) have been reported.
Temperatures below 32'F (O°C) may be expected about 2 to 4 times each
winter; the frequency depends upon the location within the area.
Along the coast, temperatures are slightly higher in the winters and
lower in the summers than they are in the interior.

The moderately high temperatures result in a large amount of
evapotranspiration. Average annual evapotranspiration is estimated
to be 35-40 in (89-102' mm), based on the difference between rain-
fall (about 54 in or 1,370 mm) and runoff (about 14 in or 360 mm)
plus ground-waterrecharge (about 1 in or 25 mm). Average annual
lake evaporation is estimated to be 52 in (1,320 mm) (Kohler and others,
1959, pl. 2 ) , and evapotranspiration losses from the numerous predom-
inately wet-weather vegetation-filled ponds in the area probably exceeds
60 in (2 ,800 nun) a year.

Ground Water
Geologic and Hydrogeologic Units
In the Myakka River basin area, ground water occurs both under artesian
and nonartesian (water-table) conditions. An aquifer is under artesian con-
ditions when the water is confined; that is, when water levels in wells that
tap the aquifer stand above the top of the aquifer. The water in the artes-
ian aquifers is confined above and below by relatively impermeable beds.
Nonartesian, or water-table, conditions occur where the upper surface of
the zone of saturation, the water table, is unconfined, and is at atmos-
pheric pressure. The water levels in wells tapping the water-table aquifer
are, in general, at the same height as the water table.
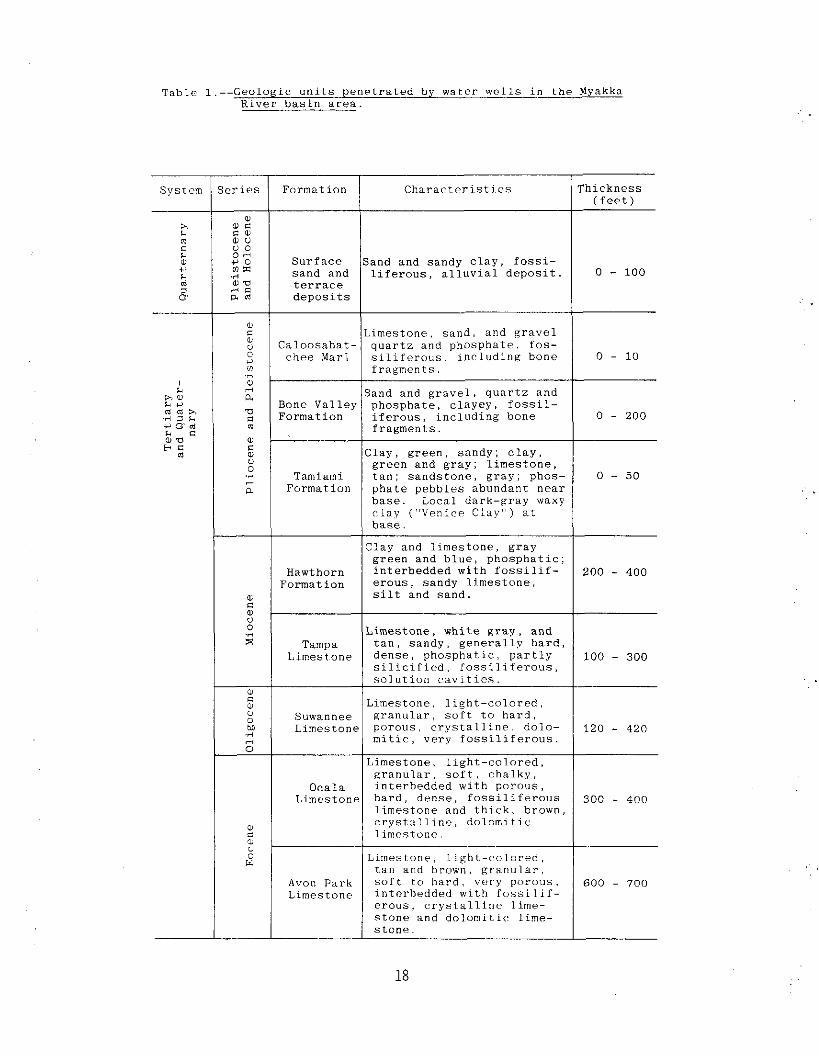
The Myakka River basin area is underlain by deposits of clastic rocks
such as sand, clay, marl, and gravel, of late Tertiary and Quaternary age.
These deposits are, in turn, underlain by limestone and dolomite (Table 1).
Water in the clastic deposits is contained in the spaces between the con-
stituent grains, whereas much of the water in the limestone and dolomite
occurs in fractures and solution cavities. These fractures and solution
cavities in limestone and dolomite are best developed in zones that are at
or near the contacts between the formations. Each of these zones is normally
not more than 40 ft (12 m) thick, and they may overlap a formation boundary
and encompass parts of two geologic units. In all, five such zones are
recognized in the Myakka River basin area. Their relation to the geol-
ogic units is summarized in table 2. The lowermost of these five zones,
numbers 3 through 5, together with their confining beds, constitute the
Floridan aquifer to the extent that it can be identified in this area.
~ a b l c 1.--Geologic units pen~trated by water wells in the Myakka River basin a=.
land and sandy clay, fossi- liferous, alluvial deposit.
Thickness ( f o o t 1
h L rd C &. a Q &. d
2'
System
Bone Valley Formation
Formation Series
u a c s a a ti 0 0 0 - e o Vi 3: .d O W rr n a m
Caloosahat- chpe Marl
Sand and gravel, quartz and phosphate, clayey, fossil- iferous, including bone fragments.
Characteristics
Surf ace sand and terrace deposits
Limestone, sand, and gravel quartz and phosphate. fos- siliferous, including hone fragments.
Tamiami Formation
Hawthorn Formation
Clay, green, sandy; clay, green and gray; limestone, tan; sandstone, gray; phos- phate pebbles abundant near base. Local dark-gray waxy clay ("Venice Clay'') at base.
Clay and limestone, gray green and blue, phosphatic; interbedded with fossilif- erous, sandy limestone, silt and sand.
Tampa Limestone
Limestone, white gray, and tan, sandy, generally hard, dense, phosphatic. partly silicified, fossiliferous, *n1 , ,+ inn r - i T i i + i o <
1 I I~imestnnr. lieht-colored. 1
Suwannee Limestone
Limestone. light-colored, granular, soft to hard, porous. crystalline, dolo- mitic, very fossiliferous.
1 -6 1 / ~imestonr. lieht-colored. I
I Ocala Limestone
~-~~~~~ , - - - ~~ ~ ~~~.
granular, soft, chalky, interbedded with porous, hard, dense, fossiliferous limestone and thick, brown, crystalline. dolomitic
W
300 - 400
Avon Park Limestone
tan and brown, granular: soft to hard, very porous. interhedded with fossilif- erous, crystalline lime- stone and dolomitic lime-
600 - 700

Table 2.--Zonal subd iv i s ion of the a r t e s i a n a q u i f e r system underlying t h e Myakka River bas in a r e a .
1 1 I v e n i c i - ~ n ~ l e w o o d a r e a Tamiami Formation f o r domentic and pub l i c UP to 150 gallmin.
Geologic Unit
supp l i e s ; elsewhere usua l ly cased o f f . I
1 I I Widely used i n t h e I Use Well Yie lds
"Venice Clay"
I Confining l a y e r
I I
Confining l a y e r I
Upper u n i t of the Hawthorn Forma- t i o n
I - - I I Lower u n i t of the I Widely used f o r i rr i- I
I
Hawthorn Forma- ga t ion . t i o n .
Highly developed i n c o a s t a l a r e a f o r domestic, pub l i c supply and home i r r i g a t i o n .
Average, 250 gallmin Up t o 500 gal lmin
Upper p a r t , 25-30 gallmin.
part * up t o 200 gal lmin
1 I / Tampa Limestone 1 1
Ocala Limestone Confining l a y e r
u m t m 0.
h a
z F:
..4
Yields l i t t l e water
Avon Park Limestone Used only where l a r g e y i e l d s needed, mostly 1,500-2,000 f o r i r r i g a t i o n . gallmin
- -
4 Suwannee Limestone
Confining l a y e r
Widely used f o r i r r i g a t i o n . 500-1,500 gal lmin

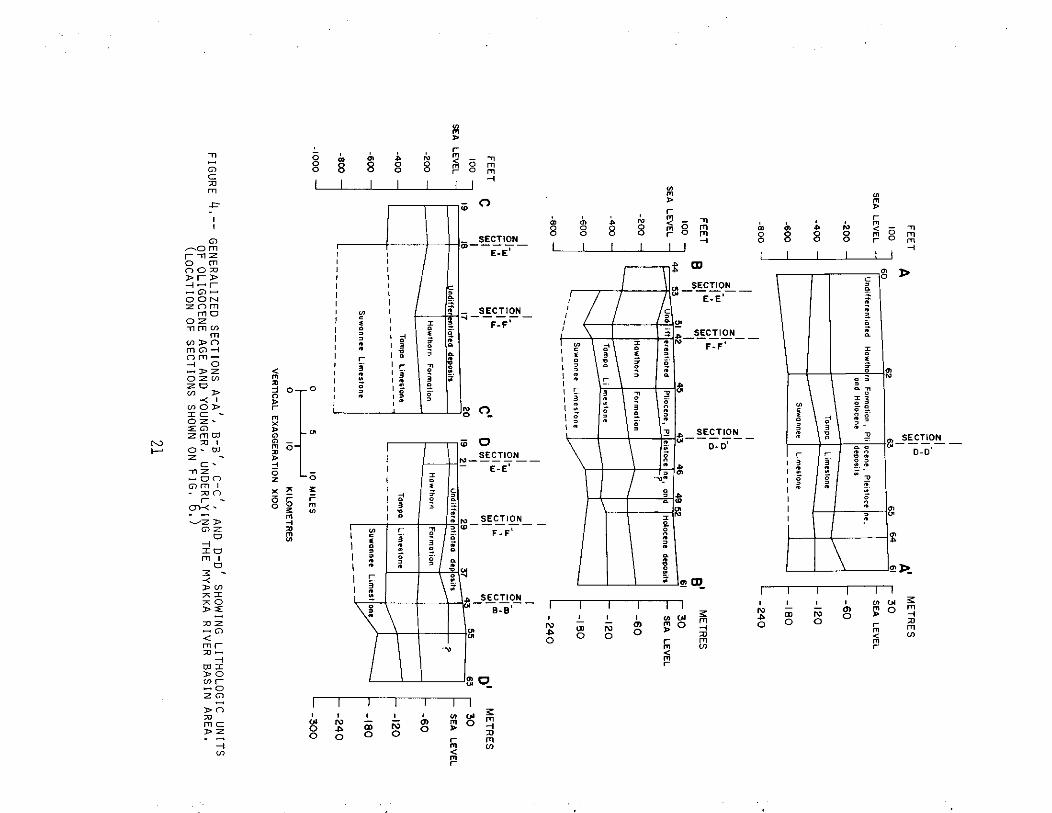
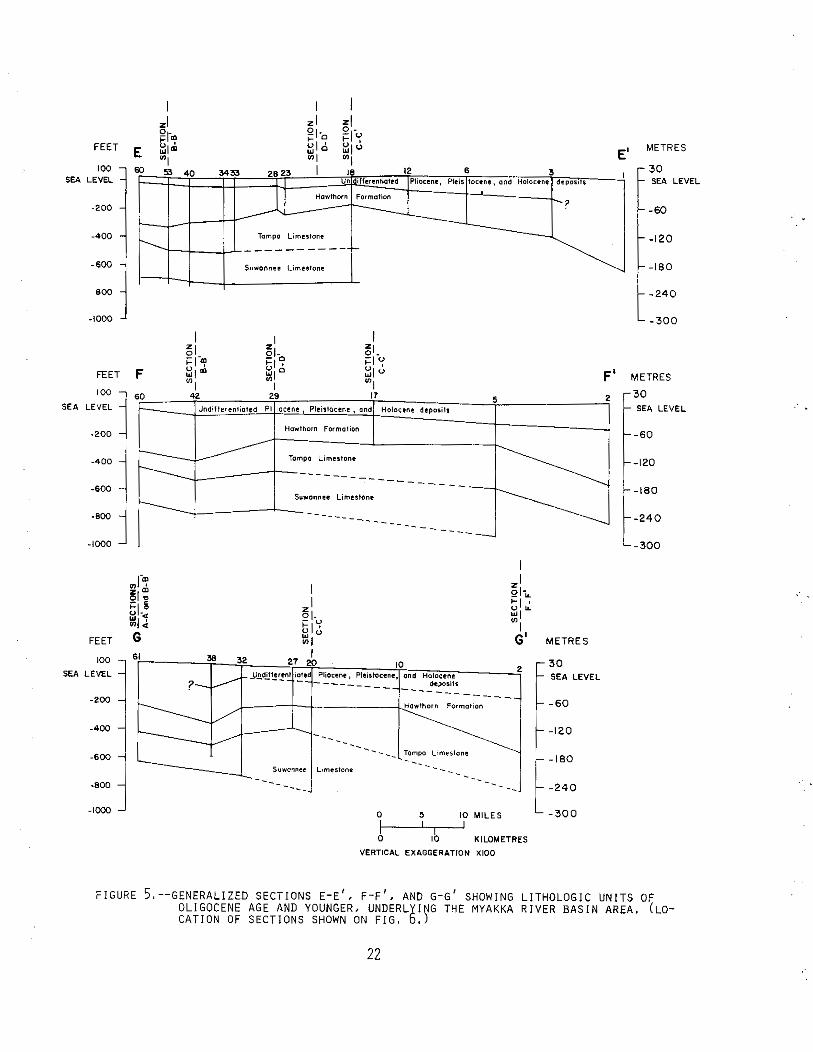
The depth at which any particular rock unit and corresponding water-
bearing zone is encountered varies widely over the area because of varia-
tions in the thickness and dip of the units. These variations are il-lus-
ted on the sections shown on figures 4 and 5. The location of the sec-
tions is shown on figure 6. The wells for which data are included in
this report have been numbered serially. The U.S. Geological Survey
Site Identification Number for each of these wells is listed in a ta-
ble at the end of the report. The formation contacts were determined
from electric and gamma-ray logs of wells and verified by enamination
of cuttings from key wells. The sections show that the formations gen-
erally dip to the southwest; but local variations in dip occur. The
variations may be due in part to faulting, but structural control data
are insufficient to determine the presence or position of actual faults.
The deeper units are not shown on the sections because of insuf-
ficient data. The Avon Park Formation, the upper part of the deepest
water-bearing zone penetrated by wells, ranges from about 1,000 feet
(300 m) below land surface in the north and east to about 1,500 feet
(460 m) below in the south and west.
Water-Table Aquifer
The water-table aquifer consists of Quaternary deposits, the Cal-
oosahatchee Marl, and the Bone Valley Formation of Pleistocene and Plio-
cene age. It underlies the entire basin and consists of layers of sand,
shells, marl, phosphate gravel, and organic material intermixed locally
with sandy clay. The aquifer ranges in thickness from a few feet along
the coast and on the keys to more than 100 ft (30 m) in the eastern part
20
n -0 m r n z o m no a D T P -I - r -0- O O N z n m
m w 0 Z n m m
m v) P n m n 4 o m - 4 0 - P Z O Z V ) Z 0 V) 9
< I "7 0 9 I C - OZ. r 0 z m m
N W l w 0 . m
Z - C
n z - o n n m l - a n - -
SECTION "- -E;E~ -
B i.
' 2 - SECTION <-- - - -
I : ! F-F'
I r
1 % 1 . 3 5 I 2 1: : 8 - ;: 8
FEET
SEA LEVEL
I@, 1 METRES
% L E V E L
FEET
SEA L E V E L 60 42 29 17 5 2
undi~~erenliotea PI a c m e , Pleistocene. and n o ~ o c e n e d e p o l i l l
Hawthorn Formolion
Tampa Limerton.
- - -_-_ - - - -_ - - - -___ Sur.nner L imlr fonl - --.. - - - -___
- - - - - - _ _ _ _
"'I-: $1 - t 6 :la .I a
FEET G I
6' METRES
1 ':A LEVEL
61 32 1 27 20 10
0 - ""'" 0 10 KILOMETRES
VERTICAL EXAGGERATION X I 0 0
-Jn-dzsr:nl ?./
-
METRES
1% L E V E L
F I G U R E 5. --GENERALIZED SECTIONS E - E ' , F-F ' , AND G - G ' SHOWING L l T H O L O G l C U N I T S OF OLIGOCENE AGE AND YOUNGER, UNDERL I G THE MYAKKA R I V E R B A S I N AREA. (LO- C A T I O N OF SECTIONS SHOWN ON F I G . 8 . r
(ofed Pliocene, Plei%focene, ond Holocene 2 de>o,i,r --------_______ ------__
I- \.- surann.. -- - - - -__
-._ -. - > -.- Tempo Limestone --.__ Llmelton. -.__ - -._ .. -.,

E X P L A N A T I O N
.36 Well and number
- . . Line of section
FIGURE 6,--LOCATIONS OF WELLS REFERRED TO I N T H I S REPORT AND L I N E S OF SECTIONS

of the area, and has a wide range of productivity related to the type of
the materials of which it is composed.
The water-table aquifer was virtually undeveloped in 1966 yet has
the greatest potential as a dependable water supply because of the east
with which it can be recharged by precipitation. It also has the great-
est potential for contamination from surface sources. Most of the wells
that tap the water-table aquifer are small-diameter drive-point wells,
particularly in the interior of the basin. Limited use is made of the
water-table aquifer on some of the keys where several wells often are
installed for a single supply. By the use of several widely spaced low-
yield wells instead of one well with a high yield, drawdown in an indi-
vidual well can be reduced; this is an important consideration in the
control of saltwater intrusion into the aquifer. Many small-diameter
drive-point wells are used for watering livestock. A few irrigation
wells, 3 to 4 in (76 to 100 mm) in diameter are

completed with open end. Some of these wells yield as much as
50 gal/min (3 11s). Yields of as much as 100 galfmin (6 11s) could
be obtained from screened or gravel pack wells.
The water-table aquifer is recharged locally under both natural
and artificial conditions. Natural recharge occurs as direct
infiltration of rainfall and as upward leakage from the underlying
artesian aquifers where the altitude of the potentiometric surface
of the artesian aquifer is higher than that of the water-table aquifer.
Recharge also occurs as influent seepage from streams that are at
high stage. Artificial recharge occurs from streams ponded behind
control structures, infiltration of irrigation water, discharge from
septic tanks and the infiltration of water from uncapped flowing
wells.
Discharge from the water-table aquifer occurs under both natural
and man-induced conditions. Katural discharge occurs by evapo-
transpiration; seepage into ponds, canals, and streams; and downward
leakage in the underlying aquifers. Downward leakage can take place
only where the water table is higher than the potentiometric surface
of the underlying artesian aquifers. Man-induced discharge results from
pumping from wells and draining of water into deep ditches constructed
in the agricultural areas to control the depth to the water table.

The depth to the water table in the Myakka River basin area
ranges from less than 1 ft (0.3 m) to more than 15 ft (4 m) below
land surface. In most places the depth to the water table is less
than 8 ft (2.5 m) due to the low topographic relief of the hasin. In
the extreme nortbern and northeastern parts of the basin, adjacent to
well-defined drainage channels, the water table may be more than 15 ft
(4 m) below land surface, particularly during exceptionally dry periods.
The water table lies fairly close to land surface on the keys.
Water levels in the wells that tap the water-table aquifer
generally fluctuate seasonally in response to variations in recharge
and discharge. That is, the water levels decline to a low during the
dry spring months and recover generally during the wet summer months
to a seasonal high. Water-level fluctuations shown on figure 7 are
characteristic of the water-table aquifer.

FEET METRES 1966 1987 1968
METRES
EXPLANATIO
FIGURE 7.--HYDROGRAPHS OF SELECTED OBSERVATION WELLS TAPPING THE WATER-TABLE AQUIFER,
27

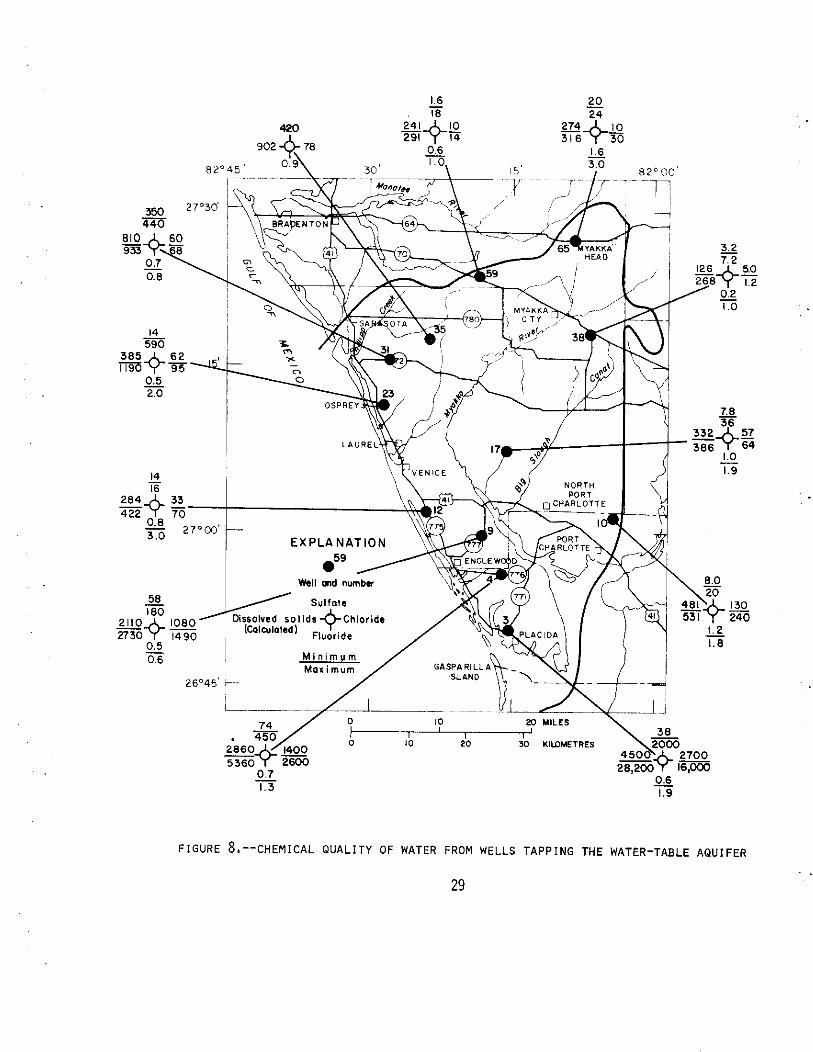
Water obtained from t h e aqu i fe r is genera l ly of accep tab le q u a l i t y
except uhere sa l twa te r i n t r u s i o n has taken p l a c e near t h e coas t and i n
the peninsula south and west of t h e Myakka River e s tua ry ( f i g . 8) . The
water i n t h e i n t e r i o r p a r t of t h e a rea of i n v e s t i g a t i o n gene ra l ly meets
t h e c r i t e r i a of t h e EPA (Environmental P ro tec t ion Agency) f o r publ ic
water supply (National Academy of Sciences and National Academy of
Engineering, 1973). Some c o n s t i t u e n t s i n raw water i n t h e peninsula
and c o a s t a l a r e a s occur i n concent ra t ions t h a t exceed these c r i t e r i a .
The p r inc ipa l problem c o n s t i t u e n t s and t h e EPA c r i t e r i a a r e l i s t e d below:
Water-quality c r i t e r i a f o r se lec ted c o n s t i t u e n t s 1 I Recommended
Const i tuent l i m i t
S u l f a t e 250 Chloride 250 Fluor ide 1.6 I r o n . 3 Color a75
a Platinum-cobalt u n i t s
1.6 - 20 - 18 24
3.2
26045'
L--.-
30 KIWMETRES

Most water i n t h e water- table aqu i fe r underlying t h e peninsula
and along t h e c o a s t i s h ighly mineral ized ( f i g . 8 ) . Chemical charac-
t e r i s t i c s of t h e water from wel l 3 near P lac ida i n d i c a t e i n t r u s i o n of
s a l twa te r . I n we l l 9 , which i s 5 m i (8 km) in land from t h e Gulf ,
ch lo r ide and d isso lved-sol ids concentrat ions of t h e water a r e a l s o above
t h e recommended limits f o r dr inking water . This we l l , however, may be
contaminated by leakage from an a r t e s i a n aqu i fe r . I n many p laces along
the coas t , t h e d isso lved-sol ids concent ra t ion of water from w e l l s
approaches t h a t of seawater . However, a few we l l s i n s h e l l beds on t h e
Keys y i e ld small q u a n t i t i e s (5-10 gal/min o r 0.3-0.6 11s) of potable
water . Some w e l l s t h a t t a p t h e shallow s h e l l and sand beds south of
Sarasota y i e l d water wi th about 2 mg/l of i ron .
Well 7 a t Eriglewood and w e l l 13 ( f i g . 6) near U.S. Highway 41 a t
the Myakka River a r e public-supply we l l s f o r t h e Englewood Water D i s t r i c t
and a p r i v a t e u t i l i t y , r e spec t ive ly . Except f o r a co lo r of 100 u n i t s ,
water from we l l 7 i s of exce l l en t qua l i ty . Water from w e l l 13 conta ins
high concent ra t ions of i r o n (1.42 mgl l ) , d i sso lved s o l i d s , sodium, and
chlor ide . The h igh sodium and ch lo r ide concent ra t ions i n d i c a t e s a l t -
water i n t r u s i o n from t h e Myakka River es tuary o r from t h e stream dra in-
ing Warm Mineral ( S a l t ) Springs. Well 13 i s being pumped a t a r a t e of
66 gallmin (4.2 1 1 s ) .
Artes ian Aquifer System
I n t h e Myakka River bas in a r e a , t h e a r t e s i a n a q u i f e r system i s com-
posed of f i v e s e p a r a t e and d i s t i n c t producing zones. These zones have
been i d e n t i f i e d i n t h e rock sequence between t h e base of t h e water- table
aqu i fe r and t h e base of t h e Avon Park Limestone ( t a b l e 2) . The i d e n t i f i -
c a t i o n of these zones i s based on t h e i r s t r a t i g r a p h i c p o s i t i o n , l i t h o l o g y ,
p roduc t iv i ty , water l e v e l , and t h e chemical q u a l i t y of t h e water produced
from them. T e s t - d r i l l i n g procedures developed f o r t h i s s tudy permit
i d e n t i f i c a t i o n of t h e producing zones ( S u t c l i f f e and Joyner , 1968); t h e
zones were f u r t h e r defined by t e s t d r i l l i n g i n S a r a s o t a ' s we l l f i e l d
near Verna and by t h e use of packer t e s t s a s descr ibed by S u t c l i f f e and
Joyner (1966). Zones 3 through 5 a r e i n t h a t p a r t of t h e limestone-
dolomite sequence t h a t is occupied by t h e F lo r idan a q u i f e r elsewhere i n
t h e S t a t e , except t h a t , i n genera l , t h e base of t h e F lor idan a q u i f e r , a s
defined by Parker and o t h e r s (1955), inc ludes p a r t s o r a l l of t h e Avon
Park and Lake C i t y Limestones. I n t h e Myakka a r e a , no we l l s have pene-
t r a t e d t h e Lake C i t y Limestone. The upper p a r t of t h e Hawthorn Formation
where he re inc ludes zone-2 ( t a b l e 2) genera l ly is not considered a p a r t
of t h e F lor idan a q u i f e r a t o the r l oca t ions i n t h e S t a t e .
The s e p a r a t e zones a r e d i f f i c u l t t o d i s t i n g u i s h us ing water- level ,
p roduct iv i ty and water-qual i ty information from product ion w e l l s , because
most of these we l l s a r e cased only t o t h e f i r s t hard-rock s t ra tum, usual iy
t o depths l e s s than 200 f t (61 m). Thereaf te r , t h e wells a r e usual ly
open ho le through more than one zone, and t h e water pumped from t h e we l l s

comes from all zones penetrated by the open hole. As a result, informa-
tion obtained as the well is being drilled and changes observed as the
well enters each zone better define the characteristics of each zone and
the differences between zones than information obtained after completion
of the well. Every effort was made to collect data from wells as they
were being drilled and these data, along with those from the previously
mentioned testing programs, were used to define the following artesian
zones.
Artesian Zone-1
Zone-1 consists of the semiconsolidated shell, clay, and limestone
beds of the Tamiami Formation which lie between the base of the Bone Val-
ley Formation and the so-called "Venice Clay" of local usage. The "Venice
Clay" is in the lower part of the Tamiami Formation. The zone underlies
the coastal area from Sarasota to Placida and extends inland 10 to 12 mi
(16 to 19 km). This zone is widely used in the Venice area for domestic
and public supplies. Wells 2 to 3 in (50 to 75 mm) in diameter that are
equipped with centrifugal pumps produce as much as 30 gallmin (1.9 11s)
from the zone. The water level of zone-1 is generally less than 10 ft
(3 m) below land surface except on the highest ridges.
Water Quality.--Water of acceptable quality for domestic and public
supply is obtained from wellsathat tap zone-1 except in the peninsula
south and west of the Myakka River estuary. The following table lists
some constituents and their concentrations in water from well 42 near
Phillippi Creek and well 3 at Placida, on the peninsula. The locations
of both wells are shown on figure 6. The table shows the contrast
chemical quality.
32

Constituent Well 42 Well 3 (Concentrations in milligrams per litrej
Dissolved solids 380 a27,000 Sulfate 4 1,900 Chloride 35 15,000 Fluoride .5 .6 Hardness 290 5,000
a estimated
High concentration of several constituents in the water from well 3
makes it unsuitable for most purposes. Water from well 42 is chemically
similar to water from other test wells at Osprey and in the south-central
part of the study area that tap zone-1. Water samples from all the wells
there meet the EPA criteria for public water supplies. In a sample from
well 12 (fig. 6) dissolved solids concentration was 580 mgll. High color
in water from well 12--45 units--is probably caused by the water moving
downward through the overlying shell beds to the recharge zone. These
sheL1 beds are rich in organic material.
Some of the wells supplying Englewood, Venice and two subdivisions
in the Venice area produce water from zone-1. Except for high color, this
water is of good quality. Analyses of water from wells 6 and 14, tapping
zone-1 in the Englewood and Venice areas are listed in table 3.

TABLE 3.--Analyses of water from wells 6 and 14, tapping Zone-1 in the Englewood and Venice area. (Analyses by U.S. Geological Survey; in milligrams per litre except spe- cific conductance, pH, and color.)
Well 6 14
Date of collection January 7, 1965 January 8, 1965
Depth of well (feet) 82.5 64
Silica (Si02)
Iron (Fe)
Calcium (Ca)
Magnesium (Mg)
Sodium (Na)
Potassium (K)
Bicarbonate (HC03)
Sulfate (SO4)
Chloride (Cl)
Fluoride (F)
Nitrate (NO3)
Phosphate (PO4)
Dissolved solids
Calculated
Residue
Hardness
Specific conductance (micromhos/cm at 25OC) 561
Color 40 40

Artesian Zone-2
Zone-2 is the most highly developed artesian zone in the
populous coastal area. It furnishes most of the water used for
domestic, home irrigation, and public water supplies. Zone-2 con-
sists of the permeable beds in the upper unit of the Hawthorn
Formation. These beds underlie the area at depths ranging from
65 to 250 ft (20 to 76 m) below land surface. The zone thickens
toward the southeast. The zone is overlain by the so-called "Venice
Clayt' of the lower part of the Tamiami formation wherever the clay
is present. Elsewhere the zone includes the lower part of the
Tamiami Formation and is overlain by deposits which have low
permeability.
Along the coast, zone-2 is tapped by 22 public water-supply
wells. The city of Sarasota derives about two-thirds of its average
daily pumpage of 3.86 ~gal/d (15,000 m3/d) from the zone. The zone
3 is also the source of 40 percent (0.2 Mgaljd) (800 m Id) of city
of Venice's average daily pumpage. Because other public supply
systems use wells that produce from zones 1 and 2, the quantity of
water being produced from zone 2 alone is difficult to estimate.
Small-diameter wells (2 in or 50 mm), that tap only the upper
Part of the zone may produce 25 to 30 galjmin (1.6 to 1.9 11s).
Higher yields are generally obtained from wells pentrating more of
the zone. Larger wells (up to 6 in or 160 m in diameter) that
fully Penetrate the zone produce as much as 200 gal/min (13 lJs)
with about 20 ft (6 m) of drawdown.

The water l e v e l i n zone-2 f l u c t u a t e s i n response t o withdrawals.
I n a reas where withdrawal i s concentrated, such a s i n t h e housing sub-
d iv i s ions near t h e c o a s t , water l e v e l s may dec l ine 20 f t (6 m) o r more
during extended dry per iods . This dec l ine has caused many domestic
users t o be without water when t h e water l e v e l i n t h e i r w e l l s drop be-
low t h e l if t capaci ty of t h e shallow-well pumps. Even i n r u r a l a r e a s ,
water l e v e l s i n zone-2 may f l u c t u a t e s u b s t a n t i a l l y ( f i g . 9) i n response
t o pumping of i r r i g a t i o n we l l s .
The l e v e l i n we l l 35, near a housing subdiv is ion , dec l ined about 24
f t (7 m) from e a r l y f a l l of 1966 t o spr ing of 1967. The l w e l i n w e l l
24 , i n a r u r a l a r e a , dec l ined about 5 f t (1.5 m) during t h e same period.
Water-Quality--Water-quality d e t e r i o r a t e s wi th inc reas ing depth
wi th in zone-2. The maximum and minimum concent ra t ions of s e l e c t e d chemi-
c a l cons t i t uen t s i n water sampled co l l ec t ed during d r i l l i n g t e s t w e l l s
a r e shown on f i g u r e 10. I n some a r e a s , f l u o r i d e , ch lo r ide , and s u l f a t e
concent ra t ions exceed t h e recommended s tandards f o r pub81ic supply ( t a b l e
2b). So, these c o n s t i t u e n t s a r e usual ly the c o n t r o l l i n g f a c t o r s i n d e
termining t h e p o t a b i l i t y of t h e water i n t h i s zone. Chloride concentra-
t i o n s a r e excess ive only i n t h e peninsula southwest of t h e Myakka River
es tuary .
Fluoride i n concent ra t ions g rea t e r than 1.6 mg/l occur throughout zone-
2 i n the extreme p a r t of t h e s tudy a rea , and i n t h e lower p a r t of t h i s
zone i n t h e southwestern p a r t of t h e a rea . I n water samples c o l l e c t e d
from zone-2 from t e s t w e l l 65, near Myakka Head, f l u o r i d e w a s a t l e a s t
36

F I G U R E 9. - -HYDROGRAPHS O F SELECTED O B S E R V A T I O N WELLS T A P P I N G ZONE-2

o./ 0 20 MILES 'P
6+34 0 10 20 30 KILOMETRES
6 . 5
FIGURE 10.--CHEMICAL QUALITY OF WATER FROM WELLS TAPPING ZONE-2

1.6 mgll. High fluoride concentrations in water from wells in the
southwestern part part of the area can be avoided by tapping only the
shallower parts of the zone. For example, fluoride concentration in
water from zone-2 from 37-125 ft (11-38 m) was less than 1 mg/l in test
well 23 (fig. 6) near Osprey. Below 125 ft (38 m) the fluoride concen-
tration was 2 mg/l, in well 23.

Sulfate concentrations were in excess of 250 mgll in all
water samples collected from test wells 31 and 35 (fig.6) that tapped
zone 2. Wells 3, 4, and 23 (fig.6) also contain water with high concen-
tration of sulfate at some depths. For example, at well 3 the
sulfate concentration of water was 2,000 mg/l at 84-97 ft (26-30 m),
but only 38 mg/l at 186-212 ft (57-65 m). Therefore, in these
areas high sulfate concentrations can usually be avoided in wells
tapping zone-2 by casing out those intervals (84-97 ft for well 3)
that yield water with high shlfate.
Chloride concentrations in the water from zone-2 are less than
250 mg/l in the peninsula southwest of the Myakka River estuary.
Well 3 had the highest concentration recorded for the aquifer,
16,OCO mg/l. This sample was obtained from within the aquifer interval
84 to 97 ft (26-30 m) below land surface. The concentration was
substantially less but still high (2,700 mg/l) in a sample collected
from a deeper interval, 136-184 ft (41-56 m), below land surface.
Although this chloride concentration greatly exceeds that recommended
for public water supplies, it is well with the range for use by most
desalinization processes.
Dissolved-solids concentration exceeded 2,000 mg/l in all
samples taken from zone 2 in the peninsula southwest of the Myakka
River estuary. A sample of water from well 3, collected from zone-2
within the interval 84-97 ft (26-30 m) contained 28,200 mg/l of
dissolved solids. However, at 186 to 212 ft below land surface,
water was found whose dissolved-solids concentration was only 4,500
mg/l which is suitable for desalting. Dissolved solids in water from
the lower part of zone 2 in well 23 exceeded 1,000 mg/l.

Artesian z o e
Zone3 includes the permeable rock in the lower part of the
Hawthorn Formation and the upper part of the Tampa Limestone
(table 2). The zone consists of sand, sandy limestone, clay and hard
limestone streaks that contain dark phosphatic pebbles throughout.
This aquifer underlies the entire Myakka River basin area. The
depth to the top of the aquifer increases from about 250 ft (76 m)
below land surface in the northeast to about 450 ft (140 m) in the
southwest.
Zone-3 is widely used as a source of irrigation water and yields
as much as 500 gallmin (32 11s) to individual wells. Test wells
tapping this unit in the northeastern part of Sarasota County yielded
250 gal/min (16 11s) with 90 ft (27 m) of drawdown. A few wells that
tap both zone-2 and-3 produce 1,500 to 2,000 gallmin (95 to 126 11s)
with 90 ft (27 m) of drawdown.

Water Quality.--The f l u o r i d e concent ra t ion i n water from zone-3 i n
most of t h e a r e a gene ra l ly is high. For example, of t h e e i g h t we l l s
whose loca t ions a r e shown on f i g u r e 11, a l l yielded water whose maximum
f l u o r i d e concent ra t ions , on the b a s i s of r ecu r ren t sampling, were 1 . 7
mg/l o r more. The minimum f l u o r i d e concent ra t ion was 1.0 mg/l or l e s s
f o r four of t h e e i g h t w e l l s . I n genera l , water from zone-3 can be used
f o r dr inking by cons t ruc t ing we l l s t h a t a r e open t o both zones 2 and 3,
thereby d i l u t i n g zone-3 water wi th zone-2 water which i s s l i g h t l y l e s s
i n f l u o r i d e concent ra t ion . The c i t y of Sarasota uses water from.zones
2 and 3 near Verna f o r t h e i r publ ic supply. F luor ide concent ra t ion of
mixed water i s 1 .5 mg/l; t h a t obtained from zone-3 a t Verna i s 3.7 mg/l.
I n genera l , where t h e f l u o r i d e , s u l f a t e , and c h l o r i d e concentra-
t i o n s i n water from zone-3 meet dr inking water s tandards , i t i s usable
fo r publ ic supply. Resul t s of t e s t d r i l l i n g i n d i c a t e t h a t , i n genera l ,
these s tandards a r e more r e a d i l y met by water i n the upper p a r t of t h e
zone than water from t h e lower p a r t , p a r t i c u l a r l y i n t h e c e n t r a l segment
of the Myakka River bas in a rea .


Artesian zone-4
Zone-4 underlies all of the Myakka River basin area and consists
of the lower part of the Tampa Limestone, all of the Suwannee
Limestone and the upper part of the Ocala Limestone. The depth
to this zone ranges from about 500 ft (150 m) in the northeast to
about 700 ft (210 m) in the south and probably to greater depths
in the southwest. The zone consists of two segments, an upper and
lower, separated by a less permeable layer of limestone and white
clay. Caliper logs of wells that penetrate this zone indicate that
the upper segment is generally about 50 to 60 ft (15 to 18 m) thick
and lies within 20 to 40 ft (6 to 12 m) of the top of the Suwannee
Formation and that the lower segment is 30 to 50 ft (9 to
15 m) thick. The logs show that the less permeable layer is 30 ft
(9 m) thick. Geophysical logs of wells indicate that in some parts
of the area the two segments may be sufficiently interconnected
vertically to form a single hydrologic unit.
Zone-4 is one of the most productive of the artesian zones,
and most large diameter irrigation wells that tap it yield 500
to 1,500 galfmin (30 to 95 11s). In the mid-1920ts, many small
diameter wells were drilled into the zone to provide water for
truck farms. In the Sarasota area, these wells originally flowed
as much as 450 galfmin (30 11s). However, water levels in all
wells that now tap the zone are below land surface, and wells
require turbine pumps in order to obtain large yields.

Water levels in this zone fluctuate markedly in response to large
seasonal withdrawals for crop irrigation. For example, the marked decline
in 1967 (fig. 12) is the result of an unusually dry winter and spring dur-
ing which time almost constant pumping was required for irrigation. With
a return of wet weather inmid-Maypumping ceased, and water levels recover-
ed rapidly. During the next growing season, pumping again lowered levels
substantially.
The hydrograph for observation well Sarasota 9 (well 41, fig. 12), a
long-term observation well open to zones 2, 3, and 4, shows a net decline
in water level during high water-level periods of about 2.5 ft (0.8 m) dur-
ing 1960-67. The other wells shown on fig. 12 are open to zones indicated.
Water Quality.--In water from zone-4 in the central and coastal areas
sulfate and fluoride concentrations generally are in excess of 250 and 1.5
mg/l, respectively. In the southwestern part of the area, well 5, 1,031 ft
(314 m) deep and which is open to the depth interval 80 to 1,031 ft (73 to
314 m) yields water containing as much as 3,600 mg/l of chloride.
As with zones 1, 2, and 3, zone-4 yields water of better quality in the
northeastern part of the area than elsewhere in the area. Of all the wells
plotted, numbers 32, 38, 54, 55, and 65 tap zone-4 only. The others tap
zones 2, 3, and 4.
Water in zone-& in the extreme northeastern part of the area (well 65,
fig. 13) meets EPA quality criteria for public supplies. Elsewhere in the
northeastern part, sulfate and fluoride concentrations usually can be main-
tained below 250 mg/l and 1 mg/l, respectively, if wells are constructed
so that water from zone-4 is diluted with water from zones 2 and 3.


3 8 0 - 52
EXPLANATION
Well and numter
M i n i m u m Maximum
26'45' c-
0 20 MILES 'P 0 10 20 30 KIWMETRES
F I G U R E 13.--CHEMICAL Q U A L I T Y O F WATER FROM ZONE-4 (WELLS 32. 38, 54. 55, AND 65) AND COMPOSITE CHEMICAL QUALITY OF WATER FROM ZONES 2, 3, AND 4 (WELLS 5, 26, 48, AND 50).
47

Water levels in this zone fluctuate markedly in response to
large seasonal withdrawals for crop irrigation. For example, the
marked decline in 1967 (fig. 12)is the result of an unusually dry
winter and spring during which almost constant pumping was required
for irrigation. With a return of wet weather in mid-May pumping ceased,
and water levels recovered rapidly. During the next growing season,
pumping again lowered levels substantially.
The hydrograph for observation well Sarasota 9 (well 41, fig. 12),
a long-term observation well open to zones 2, 3, and 4, show a net
decline in water level during high water-level periods of about2.5 ft
(0.8 m) during 1960-67. The other wells shown on fig.12 are open to
zones indicated.
Water Qua1itv.--In water from zone-4 in the central and coastal areas
sulfate and fluoride concentrations generally are in excess of 250 and
1.5 mg/l, respectively. In the southwestern part of the area, well
5, 1,031 ft (314 m) deep and which is open to the depth interval 80
to 1,031 ft (73 to 314 m) yields water containing as much as 3,600 mg/l
of chloride.
As with zones-1-3, zone-4 (fig. 13) yields water of better quality
in the northeastern part of the area than elsewhere in the area. Of all
the wells plotted, numbers 32, 38, 54, 55, and 65 tap zone-& only.
The others tap zones 2, 3, and 4.
Water in zone-4 in the extreme northeastern part of the area (well 65,
fig. 10) meets EPA criteria for public supplies. Elsewhere in the north-
eastern part, sulfate and fluoride concentrations usually can be maintain-
ed below 250 mg/l and 1 mg/l, respectively, if wells are constructed so
that water from zone-4 is diluted with water from zones 2 and 3.
48

On the basis of water-quality data from wells 5, 26, and 48 in the
southwestern one-third of the area, the water from zone-4 is unsuitable
for any purpose except perhaps limited irrigation, cooling, or sanitary
use. In the peninsula, no wells produce from this zone because of the 4
poor water quality.
Most of the older supply wells of the city of Sarasota tap zones 2,
3, and 4. The analysis of water from well 48 (fig. 13 and table 4 ) , is
typical of the old supply wells and exceeds EPA criteria in dissolved sol-
ids, fluoride, sulfate, and chloride for public water supply.
Zone-5
Zone-5 consists of the permeable rock in the Avon Park Lhestone--
"the big water," as many drillers call it. None of the U.S. Geological
Survey test wells drilled in the Myakka River basin penetrate this zone.
It is the major water-producing unit of the artesian Floridan aquifer
throughout southwestern Florida. Zone-5 underlies the entire Myakka Ri-
ver basin area at depths ranging from about 1,000 ft (305 m) below land
surface in the north and east to more than 1,500 ft (460 m) below land
surface in the south and southwest. This zone is separated from the over
lying zones by the lower part of the Ocala Limestone, which is 300 to 400
ft (100 to 120 m) thick and which forms a confining layer of low vertical
permeability. Because of the depth to this zone, it is tapped only when
large amounts of water are required.
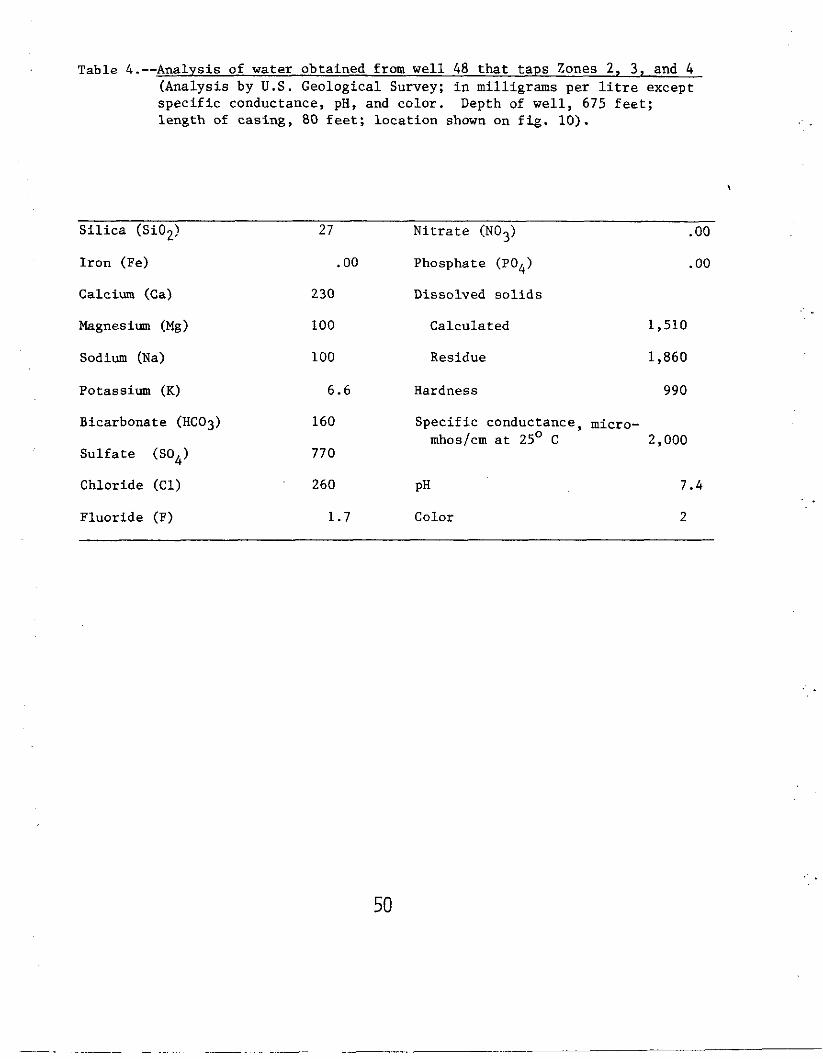
Table 4.--Analysis of water obtained from we l l 48 t h a t t a p s Zones 2, 3 , and 4 (Analysis by U.S. Geological Survey; i n mil l igrams per l i t r e except s p e c i f i c conductance, pH, and co lo r . Depth of w e l l , 675 f e e t ; l ength of cas ing , 80 f e e t ; l o c a t i o n shown on f i g . 10).
S i l i c a (Si02) 2 7 N i t r a t e (NOg) . 00
I r o n (Fe) .OO Phosphate (PO4) . 00
Calcium (Ca) 230 Dissolved s o l i d s
Magnesium ( ~ g ) 100 Calculated 1,510
Sodium (Na) 100 Residue 1,860
Potassium (K) 6.6 Hardness 990
Bicarbonate (HC03) 160 Spec i f i c conductance, micro- mhos/cm a t 25' C 2,000
S u l f a t e (SO4) 770
Chloride (Cl)
Fluoride (F)
260 PH
1.7 Color

Zone-5 i s developed i n combination with o t h e r zones a s a
source of water f o r i r r i g a t i o n we l l s t h a t y i e l d a s much a s 1,500 t o
2,000 gallmin (95 t o 125 11s) each. Use of water from t h e zone
follows a p a t t e r n t h a t i s repeated each year and r e s u l t s i n heavy
pumping during t h e s p r i n g tomato and melon gzowing season, which
runs from mid-February through mid-May followed by very l i t t l e
pumping from June t o September. The amount pumped from zone 5 inc reases
each year . Most of t h e i r r i g a t i o n withdrawal i s confined t o t h e
nor theas tern p a r t of t h e bas in . Each yea r , growers c l e a r p a r t of the
range t o grow melons. A s payment f o r land use , t h e grower d i t c h e s
and grades t h e land , and d r i l l s an i r r i g a t i o n w e l l , which i s usual ly
12 i n (305 mm) i n diameter and has a pumping capaci ty of 2,000 gal/min
(125 1 1 s ) . During t h e growing season (about 3 months) t h e we l l is pumped
continuously. A s soon a s t h e crop i s harvested, t h e land and the
wel l r eve r t t o t h e ca t t le - ranch owner, who then i n s t a l l s a per-
manent pump t h a t i s used t o i r r i g a t e grass on t h e abandoned melon
f ields ' .
For economic reasons, we l l s a r e usual ly cased only t o the f i r s t
hard-rock u n i t , u sua l ly l e s s than 200 f e e t (60 m) and t h e r e s t of t h e
hole i s open t o s e v e r a l a q u i f e r zones. Af t e r i n i t i a l use f o r melon
i r r i g a t i o n t h e we l l s may stand i d l e f o r months o r even yea r s before
being pumped again. During t h i s time, uncontrol led mixing of water
of d i f f e r e n t q u a l i t y occurs i n t h e we l l s . Water moves i n t h e we l l s
from zones with h igher head i n t o zones with lower head. For example,
water may move from zone-5, up t h e wel l bore, i n t o zone-4, which
has a lower head. Such mixing can cause t h e q u a l i t y of water i n
the upper zone t o d e t e r i o r a t e .
51

Water quality--Water i n zone 5 i s more h ighly mineral ized than
t h a t i n zones 1-4. Except f o r the extreme nor theas t e rn p a r t of t h e
a rea , t h e s u l f a t e and gene ra l ly t h e f l u o r i d e concent ra t ions exceed
t h e water-qual i ty c r i t e r i a of EPA f o r pub l i c supply ( f i g . 14 and
page 28). I n t h e southern p a r t of t h e Myakka River b a s i n a rea t h e
ch lor ide concent ra t ion i n water from zone 5 a l s o exceeds t h e l i m i t .
(See wel l 5 , f i g . 14.) Several a t tempts were made t o use water
from zone 5 along t h e nor thern p a r t of t h e s tudy a r e a f o r municipal
water supply, but i t s mineral concent ra t ion was too high f o r such
use.
Water wi th less than 300 mg/l of d isso lved s o l i d s i s a v a i l a b l e
i n zone 5 i n the extreme nor theas tern p a r t of t h e Myakka River bas in
a rea . Well 67 y i e l d s water of exce l l en t q u a l i t y a s shown i n f i g u r e 14 .
Between t h i s we l l and Myakka Ci ty , water from zone 5 i s of acceptable
q u a l i t y f o r pub l i c supp l i e s except f o r the f l u o r i d e concent ra t ion ,
which i n p laces i s a s much a s 2.0 mg/l. I n water from zone 5
i n the eas t - cen t r a l p a r t of t h e a rea s u l f a t e and f l u o r i d e concen-
t r a t i o n s a r e a s much a s 390 and 1 . 8 mg/l.
In 1957 t h e c i t y of Sarasota attempted t o develop zone 5 t o
fu rn i sh water f o r a swimming pool , but found t h a t a t a depth of
1,240 f e e t (378 m) t h e water was too s a l i n e f o r use . I n 1962, t h e
c i t y of Sarasota aga in attempted t o develop a water supply from t h i s
zone by d r i l l i n g t o 1,232 f e e t (376 m). However, a t t h a t depth t h e
wel l yielded water whose dissolved s o l i d s concent ra t ion was more
than 3,100 m g / l . When plugged backv to about 1,000 f t (305 m),
t h i s wel l yielded water of acceptable q u a l i t y :ram zone-&,for use
a s an i r r i g a t i o l l w e l l on a golf course.

F I G U R E 14,--COMPOSITE C H E M I C A L Q U A L I T Y OF WATER FROM ZONES 2, 3, 4, AND 5, AND WARM S A L T S P R I N G S ,
53
Well 54, city of Sarasota test well W E 1, at a depth of 1,462
ft (446 m) yielded water from zone-5 with a minimum chloride
concentration of only 19 mg/l. Its sulfate concentration, however,
was over 450 mgll. When the well was deepened to 1,493 ft (455 m)
and was open to the interval 1,462-1,493 ft (446-455 m) it yielded
water containing only 21 mgll of chloride but sulfate concentration
increased nearly three-fold, to 1,200 mgll.
Water from Warm Salt Springs probably originates in part from
zone-5; the water temperature (30" C ) and the quality characteristics
of the watkr (fig. 14) are similar to water from well 5. Table 5
shows analyses of water from the springs and well 5, which is near
the mouth of the Myakka River. Similarities of the major constituents
in water from both sources indicate that the water is originating
from either zone-5 or from zones 2-5.

TABLE 5.--Analyses of water from Warm Salt Springs and well 5. (Analyses by U.S. Geological Survey; in milligrams per litre except specific conductance, pH, and color.)
Cattle Dock Warm Salt Springs Point, well 5
Silica (Si02) 17 7.9
Iron (Fe) . 00 .OO
Calcium (Ca)
Magnesiiuo (Mg)
Sodium (Na)
Potassium (K)
Bicarbonate (HC03)
Sulfate (SO4)
Chloride (Cl)
Fluoride (F)
Nitrate (NO3)
Dissolved Solids (calc.)
Hardness (as Ca C03)
Specific conductance micro- mhoslcm at 25OC 26,600
pH 7.3
Color (pt-Co units) 5

Potentiometric surface
The configuration of the potentiometric surface of the
artesian zones 2-5 at the end of a dry and a wet period is shown
on figures 15 and 16, respectively. Most of the wells used in
preparing these maps were open to zones 2-4, and a few to zones
2-5. The water level in each well represents the composite head
in the zones penetrated by the well. The maps show that the
regional gradient and principal direction of flow is from east to
west. The potentiometric surface was higher in November 1966 than
in June 1966: recharge from heavy summer rains and cessation of
pumping for irrigation during the rainy season cause water levels to
rise. Where heavy pumping markedly lowered the potentiornetric surface
(fig. 15) troughs in the surface were created.
In much of the area water levels in wells that tap zones 3-5
rise above land surface and at the end of the rainy season wells
will flow. This is the area of artesian flow of figure 16. Many
flowing wells were observed during the investigation.

0 20 MILES - 0 10 20 30 KILOMETRES

I . 1 J1. . . LA i 0 20 MILES - 0 10 20 30 KIWMETRES
FIGURE 16, --GENERALIZED CONFIGURATION OF COMPOSITE POTENTIO- METRIC SURFACE OF ZONES 2 , 3, 4, AND 5 IN NOVEMBER 1966 AND AREA OF ARTESIAN FLOW,

Surface Water
S treamf low
Most of t h e s treams i n t h e Myakka River b a s i n a r e a have small
drainage bas ins , a r e of s h o r t channel length , and do not y i e l d high
volumes of flow. The y i e l d s of many, however, a r e s u f f i c i e n t t h a t they
r ep resen t a p o t e n t i a l source of f r e s h water t o supplement t h e water-
supply needs of t h e urbanizing c o a s t a l zone. The s c a r c i t y of s i t e s
s u i t a b l e f o r impoundments along most streams w i l l s eve re ly l i m i t t h e
development of streamflow a s an adjunct t o t h e ground-water supply--to .
s a t i s f y water demand during droughts.
Flippo and Joyner (1968) d i scuss low-flow c h a r a c t e r i s t i c s of streams
i n t h e Myakka River b a s i n a rea such a s frequency and magnitude flow du-
r a t i o n , and water q u a l i t y , and they analyze t h e d ra f t - s to rage r e l a t i o n s
of Upper and Lower Myakka Lakes. The t e x t t h a t fo l lows, inc luding t h e
s e c t i o n on water q u a l i t y , i s a summary of t h e i r f i nd ings .
Streamflow d a t a , c o l l e c t e d s ince 1936 i n the a rea , i n d i c a t e t h a t
a l l non-tidal reaches of streams ceased n a t u r a l flows dur ing a t l e a s t
f i v e droughts s i n c e 1938. Many of these non-t idal reaches go v i r t u a l l y
dry l a t e i n t h e sp r ing during most years . Upper and Lower Myakka Lakes,
through which t h e Myakka River flows, occupy two of t h e l a r g e s t n a t u r a l
depressions i n t h e a r e a and t h e i r aggregate s to rage capaci ty a t 16 f t
(5 m) and 14 f t (4 m) above sea l e v e l is approximately 8,100 ac re - f t
(3300 ha2). The average discharge a t a stream gaging s t a t i o n loca ted
between t h e two l a k e s is 266 f t 3 / s (7.5 m3/s) o r about 193,000 ac re - f t
59
(78,000 ha2) . Draf t - s torage s t u d i e s i n d i c a t e t h a t t h e Upper and Lower
Myakka Lakes--if maintained a t 14 and 10 f t (4 and 3 m) above m s l ,
respectively--could provide a continuous d r a f t of 6.5 Mgal/d (0.28 m3/s)
over a 30-year drought and 10 Mgal/d (144 m3/s) over a 20-year drought.
A f e a s i b i l i t y s tudy of t h e lower Myakka River would a l low explor ing
t h e p o s s i b i l i t y of impounding t h i s stream a s a supply f o r t h e south-
eas t e rn p a r t of t h e a r e a . Large q u a n t i t i e s of water a r e s to red i n t h e
channel of t h e lower Myakka River . A low-head dam would keep s a l t w a t e r
out of t h e stream and r e t a i n the f reshwater f o r use during droughts .

Water Qual i ty
During t h e d ry season, streamflow i s maintained by ground-water d i s -
charge, and, a s a r e s u l t , ch lo r ide , s u l f a t e , and d isso lved s o l i d s concen-
t r a t i o n s and the hardness of t h e water a r e above dr inking water s tandards
f o r some streams. During t h e wet season, streamflow is mainly from over-
land runoff , and t h e concent ra t ions of these c o n s t i t u e n t s and t h e hard-
ness of t h e water a r e minimum. The range i n concent ra t ions of cons t i t u -
e n t s or i n c h a r a c t e r i s t i c s i s shown i n t a b l e 6 f o r water from 23 surface-
water sampling s i t e s . The loca t ion of these s i t e s i s shown on f i g u r e 17 .
During the wet season, water from swamps and marshes flows i n t o t h e
streams, and t h e co lo r of t h e water i s then maximum. Flow from swamps
and marshes diminished o r ceases during t h e d ry season, a t which time
the color of t h e stream i s l e a s t .
During the dry season most of the streams con ta in water whose hard-
ness i s more than 180 mg/l; during the r e s t of t h e year t h e hardness is
l e s s than 180 mg/l f o r most of t h e streams. The hardness of water i n
streams i n the c o a s t a l a r e a s genera l ly i s g r e a t e r than i n those inland.
The upper reaches of t h e Myakka River conta in t h e s o f t e s t water i n t h e
a rea .
The c h l o r i d e , s u l f a t e , and d isso lved-sol ids concent ra t ions of water
from most of t h e s treams sampled during t h e s tudy gene ra l ly a r e l e s s than
250, 250, and 500 mg/l. I n t h e c o a s t a l a r ea t h e c h l o r i d e concent ra t ion
of a l l t i da l - a f f ec t ed s treams genera l ly i s more than 250 mg/l. B a r r i e r s
i n P h i l l i p i Creek and Big Slough prevent upstream movement of s a l twa te r .
6 1

TP-BLE 6.--Ran e in " a l i f y of surface varei in Hyak*8 River basin a r ~ a . (Results i n mil l igrams per litre except specific "","I,",, color an* iaperarurel.
-~ Name
Niagara water at Port Charlotte
Foidhaln Water ar Port Chalorie
,,orningst.r water ar Port Charloffe
~ y a k k a ~ i ~ e r near ~ y a k k a City
Wingate Creek near Myakka City
~ y a h x v e r at ~ y a k b c i t y
Hyekka River near Sarasofa
Myark River Rocky Ford near Venice
Wyakka River near venice
Deer Prerie Creek near Yenice
Bi$ Slough Cam1 near Hyakh City
B i g Slovgh near ""rdock
East Branch Coral Creek near Placida
Oyster creek near ~ n g l e v o a d
All igaror Creek near venice
Cm* Pen Slough near Bee R i d g e
Cow Pen Slough near Laurel
South Creek near Osprey
? h i l l t p i creek near Saraeara
Main B Canal a t Sarasota
Phil lrp, Creek a t sarastoa
Walker Creek a t 5arasota
xanaree 8iver near Bradenran
a D S - D ~ ~ I ~ station. D ~ ~ I ~ specific condurcance and tenpernrure. iipproxinately 3 composites ~ e r month for analyses.
b Peak during period October 1965 ro September 1966 was 7,500.

Lakes
The principal two lakes in the Myakka River basin area are the
Upper and Lower Myakka Lakes. Both occupy shallow depressions; the shal-
lowest parts contain a heavy growth of aquatic vegetation. On lake bot-
toms in the deeper parts of the lakes are soft layers of decaying organic
material. The lake bottoms around the edges and at the inlets are firmly
packed sand.
The two lakes have been considered from time to time for use as a
public water supply. Bt maintaining a level of 14 ft (4 m) above mean
sea level at the upper lake and 10 ft (3 m) at the lower lake, about 4,600
2 acre-ft (1,860 ha ) of water could be stored. The area also contains hun-
dreds of small lakes and ponds that have a surface area less than 200
acres (80 ha) each. Most of these are in the western half of the area.
They ark shallow and may go dry during moderate droughts. Levels of some,
of the larger lakes in urbanized areas are maintained by pumped ground
water during extended dry periods.

Springs
Few springs are in the Myakka River basin area. Nearly all
issue from solution cavities that are open to zones of artesian flow.
Warm Mineral Springs (Warm Salt Springs) is in Sarasota County,
5 mi (8 km) northwest of North Port Charlotte (fig. 14). The spring
head is a pool about 250 ft (75 m) in diamecer and 167 ft (57 m)
deep (Ferguson and others, 1947, p. 148). The spring discharges to
Salt Creek, a tributary of the Myakka River, at a rate of about
3 3 10 ft /s (0.3 m 1s). The water temperature varies little from
86°F (30°C) and the chloride concentration is about 9,300 mg/l. The
spring is used for mineral baths.
Little Salt Spring is 2.0 mi (3.2 km) northeast of Warm Mineral
Springs. The spring flows into a circular pool about 250 ft (75 m)
in diameter. Spring discharge measured between April 1946 and June
3 3 1962, ranged from 0.89 to 1.53 ft is (0.03 to 0.04 m is). The flow
3 3 has been reported as low as 0.17 ft 1s (0.005 m 1s) (Ferguson and
oth'ers, 1947, p. 146). Temperature of the water has ranged from
71.6" to 91.4'F (22 ' to 33°C). The chloride concentration of the
spring water is about 1,300 mg/l, and the dissolved-solids concentration
is about 3,000 mg/l.

Pinehurst Spring is on the bank of a small bayou on Little
3 Sarasota Bay about 7.0 mi south of Sarasota. A flow of 0.006 ft /s
3 (0.0003 m 1s) was measured on April 30, 1946, and a flow of as much
3 3 as 0.11 ft /s (0.003 m 1s) has been reported (Ferguson and others,
1947, p. 147). In recent years, discharge has decreased as water
levels in the artesian aquifers tapped by the spring have declined.
The quality of water from the spring has gradually deteriorated with
the lowering of water levels. The chloride and sulfate concentrations
of the spring water were reported to be 34 and 9.4 mg/l in 1943.
On June 15, 1962, the chloride and sulfate concentrations of the
water were 106 and 39 mg/l.
A seepage zone or spring line occurs along the Myakka River
valley about 2.0 mi (3.2 km) southwest of Myakka City. The seeps
issue from the top of a hardpan in the water-table aquifer that crops
out in the valley wall. At least one of these seeps may be
\
perennial. The flow of each individual seep is probablyless than 0.004
ft3/s (0.0001 m3/s)
A deep hole, nearly circular, occurs in the bed of the Myakka
River about 150 ft (46 m) to the right from midstream near the
outlet to Lower Myakka Lake. On July 15, 1965, the hole was about
300 ft (90 m) in diameter at the top and 124 ft (38 m) deep. The
nearly vertical walls of this opening angle slightly northward from
top to bottom and the hole is 40 to 50 ft (12 to 15 m) in diameter
for most of its depth. The flow issuing from the hole probably ceases
when the stage of the Myakka River is exceptionally high and during
extended low-flow periods. At times the flow may beas much as 1.5
3 3 ft /S (0.04 m 1s).
66

WATER USE
About 1 6 . 5 b i l l i o n g a l l o n s (62.5 m i l l i o n c u b i c m e t r e s ) of ground
w a t e r were withdrawn i n t h e Myakka River b a s i n a r e a i n 1965. T h i s
wi thdrawal i s e q u i v a l e n t t o a n average pumpage of a b o u t 45 Mgalld
(2 m3/s). Because of t h e s e a s o n a l p a t t e r n of w a t e r u s e , p robab ly
40 pe rcen t of t h e a n n u a l t o t a l u s e o c c u r s d u r i n g t h e d r y s p r i n g .
More wa te r i s used f o r i r r i g a t i o n t h a n f o r a l l o t h e r u s e s combined.
Of t h e i r r i g a t i o n u s e , t h e l a r g e s t s i n g l e use i s f o r p a s t u r e
i r r i g a t i o n . P u b l i c s u p p l y i s abou t 35 p e r c e n t of t o t a l u s e and indus-
t r ia l commercial u s e i s l e s s t h a n 1 p e r c e n t ( t a b l e 7 ) .
I n 1965, 23 major pub l i c - supp ly sys tems used ground w a t e r a s
a s o u r c e i n t h e Myakka R i v e r b a s i n a r e a ; a l l of t h e s e were i n Sara-
s o t a County. The a r e a a l s o h a s many s m a l l sys tems which s e r v e l e s s
than 100 u n i t s , such a s t r a i l e r p a r k s and m o t e l s . The q u a n t i t i e s of
wa te r used by t h e s e sys tems a r e i n c l u d e d i n t h e e s t i m a t e o f u s e f o r
p u b l i c supp ly . S a r a s o t a and Venice , t h e two p r i n c i p a l pub l i c - supp ly
sys tems , withdrew abou t 1 . 4 and 0.2 b i l l i o n g a l l o n s ( 5 . 3 and 1.1
m i l l i o n c u b i c m e t r e s ) , r e s p e c t i v e l y d u r i n g 1965 ( f i g . 15) . Of t h e
120,000 p e r s o n s l i v i n g i n t h e a r e a i n 1965 abou t 75,000 were s e r v e d
by p r i v a t e w e l l s . On t h e b a s i s of a n e s t i m a t e d p e r c a p i t a u s e of 120
g a l l o n s (450 l i t r e s ) p e r day, t h e d a i l y r u r a l domes t i c u s e was 9 Mgalld

Table 7.--Estimated ground-water pumpage i n t h e Myakka River bas in a rea i n 1965.
Public-water supply
Durat ion of
Pumping
(days)
Pumping r a t e Amount pumped
(mi l l i on ( b i l l i o n ga l lons per day) g a l l o n s per year)
I
(Spring and f a l l ) M
H
1 Golf courses (8 i n a rea ) 300
365
50
90
90
Rural Domestic
C i t r u s
I Lawns
$ .i! a Fr.
Tota l
Vine crops
Spring
F a l l
Weighted average d a i l y pumpage
a / P r i n c i p a l l y used f o r cool ing a i r -condi t ioner condensers. -
68

FIGURE 18,--PUMPAGE FOR THE C I T I E S OF SARASOTA AND VENICE, 1962-66,

The amount of ground water used f o r i r r i g a t i o n was grouped i n t o
5 ca tegor ies : c i t r u s , t ruck farming, improved pas tu re , golf courses,
and lawn watering. I n 1965, about 4,000 a c r e s ($600 ha) of c i t r u s were
i r r i g a t e d . O f t h i s amount, ha l f was i n Sarasota County and ha l f i n Man-
a t e e County. The r a t e of a p p l i c a t i o n f o r c i t r u s was est imated t o be
5,000 gallmin (315 11s) per 8-hr day f o r 500 ac res (200 ha) during t h e
i r r i g a t i o n season.
Truck farmers i n t h e a r e a p l an t a spr ing and f a l l v i n e crop. The
1965 spr ing v i n e crop was about 3,500 ac res (1400 ha) of tomatoes, melons, I
squash, and cucumbers. These crops were i r r i g a t e d continuously 24 hours ,
a day f o r approximately 90 days a t t h e r a t e of about 2,000 gal/min
(126 11s) o r 2.9 Mgalld per 500 a c r e s (200 ha) . The 1965 f a l l v i n e crop
cons is ted of about 500 a c r e s (200 ha) of tomatoes i r r i g a t e d a t t h e same
r a t e f o r t h e same dura t ion . Row crops a r e p lanted on muckland i n Sep-
tember, and f i n a l ha rves t ing is i n mid-May. These crops a r e i r r i g a t e d
only occas ional ly dur ing t h e d r i e r p a r t of the season.
The same amount of water is used f o r i r r i g a t i o n of improved pas tu re
a s f o r vine-crop i r r i g a t i o n : 2,000 gallmin (126 11s) o r 2.9 Mgalfd
per 500 a c r e s (200 ha) . The pas tu re i r r i g a t i o n season l a s t s about 40
days each yea r . Within t h e s tudy a rea i n 1965, about 12,500 a c r e s
(5100 ha) of improved pas tu re i n Manatee County and 4,000 a c r e s (1,600 ha) )
i n Sarasota County were i r r i g a t e d

Golf courses use l a r g e amounts of water f o r i r r i g a t i o n of
fairways and greens. Within t h e study a rea , Sarasota County has
seven courses and Char lo t t e County one. An i r r i g a t e d 18-hole golf
course r e q u i r e s about 400 gal/min (25 11s) or 0.6 Mgal/d f o r 300 days
each year , t h e d a i l y golf-course use i n t h e a rea f o r t hose 300 days
3 i s 5 ~ ~ a l / d (0.2 m 1 s ) .
Many home owners have ind iv idua l we l l s t o supply water f o r lawn
i r r i g a t i o n and automatic s p r i n k l e r systems. The fol lowing d a t a were
used t o e s t ima te t h e water use f o r t h i s purpose:
Tota l populat ion 120,000
3 persons per dwelling 40,000 dwell ings
115 a c r e per dwelling l o t 8,000 ac res (3200 ha) occupied
50 percent of acreage cons i s t of lawn 4,000 a c r e s (1600 ha) of lawn
60 percent of homeowners i r r i g a t e 2,400 a c r e s (970 ha) i r r i g a t e d
On the average, lawns i n t h e a r e a r equ i re i r r i g a t i o n about 120 days
per year. The a p p l i c a t i o n r a t e i s about 50 gallmin (3.2 11s) pe r
ac re applied 2 hours per day, o r about 0.006 Mgalld per a c r e .
3 I n 1965 only about 2.5 ~ ~ a l / d (0.1 m / s ) of su r face water was used
f o r publ ic water supply and pas tu re i r r i g a t i o n .

WATER PROBLOlS
The water problems i n the Myakka River bas in a rea a r e v a r i e d ,
complex, and o f t e n i n t e r r e l a t e d . They include f looding , inadequate
or excessive dra inage , inadequate supply of water of s u i t a b l e q u a l i t y ,
and d e t e r i o r a t i o n of t h e supply by po l lu t ion and sa l twa te r encroach-
ment. Some problems a r e t h e r e s u l t of man's a l t e r a t i o n and s t r e s s i n g
of the environment and h i s need f o r l a r g e q u a n t i t i e s of water of
good qua l i ty . Where s e r i o u s c o n f l i c t s i n consumptive use of a l imi t ed
supply a r e a n t i c i p a t e d , p r i o r i t i e s of use should eventua l ly be e s t ab l i shed .
This would involve l e g a l , economic, and soc io log ica l a s w e l l a s hydro-
l o g i c cons idera t ions .

Floods
Much of the Myakka River basin area is subject to flooding when
rainfall is exceptionally heavy. Ditching has accelerated drainage
from many parts of the area that would experience temporary flooding
during periods of normal rainfall. The urbanizing coastal area also
is subject to flooding when tides are abnormally high. The problems
associated with flooding and the delineation of flood-prone areas
are beyond the scope of this study. Estimates of the magnitude and
relative occurrence of flood discharges can be obtained from a
regional flood study by Barnes and Golden (1966).
When rainfall is heavy, the capacity of some natural channels and
canals is inadequate for rapid conveyance of flood waters, thereby
resulting in widespread flooding of lowlands. These flood-prone
areas may be inundated for as long as 1 month. About one-third of
the land below an altitude of 40 ft (12 m) is subject to this type
of flooding. The coastal areas below 10 ft (3 m) are also vulner-
able to flooding caused by exceptionally high tides generally above
5 feet. Tidal studies made by the U. S . Army Corps of Engineers
(1961) indicate that a tide of 10 to 12 ft (3 to 3.7 m) may be
expected on the average about once every 100 years.
Urban development along these low-lying coastal areas has
expanded rapidly since 1950. At the present stage (1965) of urban
development and flood protection, storms of the magnitude of those
in 1960 and 1962 are likely to cause major flood damage.

With the expansion of agriculture into low-lying areas, annual
flood damages have steadily increased. Although drainage of
agricultural lands has reduced the incidence of minor flooding, it
has also encouraged greater expansion of agriculture onto the flood
plains. As a result, by 1960 the estimated average annual flood
damage to agriculture in the Phillippi Creek and Cow Pen Slough basins
had increased to more than $100,000 (U. S. Soil Conservation Service,
1961).
Drainage
Closely allied to flood problems are those resulting from drainage
of the land. Lowlands have been drained to make them available for
farming. Also water levels in the water-table aquifer have been
lowered to make lowlands habitable, and drainage divides have been
crossed by ditches in efforts to improve drainage. As a result,
water moves more readily from land to the sea; consequently recharge
to the aquifers is reduced.

One of the most pressing problems in the Myakka River basin area
is the need for additional public-water supply of suitable quality to
meet the requirements of a growing population. In addition, irrigation
requirements are also increasing. Suitable sites are generally not
available for the development of surface-water supplies, and ground
water of suitable quality is restricted to specific aquifer zones in
certain areas. Thus, the competition for water that meets drinking-water
standards is keen. To some extent this problem can be alleviated in
topographically suitable areas where some creeks can be impounded to
maintain water levels in shallow aquifers developed for public supplies.
For example, the impoundment on Coral Creek (fig. 17) about 1 mile from
a well field, maintains high water levels in the well field and curtails
saltwater intrusion in the immediate area. Oyster Creek and Gottfried
Creek near Englewood may be suitable for similar types of water-supply
development and control. Sampling site 14 (fin. 17) is on Ovster Creek:
Gottfried Creek is about 1 mile north.

Contamination
Freshwater supplies in the Myakka River basin area are subject
to contamination as a result of intrusion of saltwater mixing of
ground water of poorer quality with that of better quality by inter-
aquifer flow, and pollution of streams and aquifers by man-made wastes.
No widespread intrusion of saltwater due to overpumping of the
freshwater aquifer is known'in the coastal area. Nonetheless, the
potential exists for intrusion as a result of increased use of the
freshwater resources, particularly in the coastal areas where use
of wells for lawn irrigation is increasing. In addition, construction
of saltwater canals inland where none previously existed has resulted
in intrusion of saltwater' into the aquifers in the Venice area.
The hydraulic placement on upland areas of material removed during
construction of saltwater canals has resulted in saltwater contamina-
tion of aquifers. Leachate and drainage from these spoil piles has
infiltrated into the water table and artesian aquifers and locally
replaced the freshwater contained in them.
Washover of saline water from the Gulf during storms or high tides
has,on occasion,contaminated potable supplies in the water-table aquifer
in some of the southern keys. Considerable time likely will be required
for natural flushing action to return the ground water to usable quality.

In some areas saltwater does occur in the aquifer zones that
elsewhere contain freshwater. The quality characteristics of Warm
Mineral Springs and Little Salt Springs suggest that this water
results from upward migration of highly mineralized water from deep
aquifer zones, perhaps along fracture systems in the rocks. This
water may contaminate shallow aquifers near these springs.
The possibility of direct saltwater intrusion from the Gulf
into the freshwater aquifers exists on the Keys where wells no longer
used have not been plugged. Erosion has removed the previously
habitable land and the wells are exposed to salt water. If the
artesian head in the aquifers is reduced sufficiently to allow water
from the Gulf to move down these wells, direct contamination will
result.

Intermixing of water of differing qualities between aquifer
zones also occurs in wells when the casing is driven only to the upper-
most hard-rock stratum. When the well is not in use, water from a
permeable zone with a higher head can migrate into a permeable zone
with lower head (Joyner and Sutcliffe, 1967). Thus a well bore can
serve as a conduit allowing water of poor quality to intrude a zone
containing water of good quality. The enactment of the Sarasota
and Manatee County well-drilling codes in 1963 has changed the procedure
for drilling wells. Casing installation procedures now require the isola-
tion of zones which contain water of undesirable chemical quality. New
procedures have been developed for the drilling of wells in areas
where saltwater overlies the freshwater zones (Joyner and Sutcliffe,
1967); this situation is found commonly on the Keys and where salt
and other undesirable contaminants are present in the overlying
strata. Plugging of unused wells is now required when a replacement
well is to be drilled.
Pollution from a variety of sources has deteriorated water
quality in some streams and aquifers in the area. For example, effluent
from waste-treatment plants is discharged into canals and eventually
reaches coastal bays and estuaries. As a result, large offshore
areas have been closed to shellfish harvesting. Pollution can be
anticipated in the runoff from farmed areas where agricultural chemicals
are heavily applied. The residues from these chemicals may be carried
by sediment transported in the streams. If new phosphate mines are
opened in the eastern part of the area, wastes from mining operations
could enter the headwaters of streams now used for public-water supplies,
unless specific measures are taken to prevent this (Kaufman, 1969).
78

In the Myakka River basin area, ground water is obtained both
from a water-table aquifer and the artesian aquifer system. Often
when adequate quantities of water are available from these aquifers,
the quality of the water may not be suitable for many uses. Excessive
concentrations of dissolved solids, sulfate, fluoride, or chloride are
usually the factors affecting the utilization of ground-water supplies
in the area. However, by careful well construction, water of suitable
quality for most purposes can be obtained from most of the study area.
Large quantities of ground water of excellent quality can be
obtained from all aquifers in the northeastern part of the Myakka
River basin area. Small quantities of water (usually less than
50 gal/min, 1.9 11s) of suitable quality for domestic use can be
obtained from wells developed in the water-table aquifer except
where saltwater intrusion has taken place near the coast and in
the peninsula south and west of the Myakka River estuary.
Wells tapping artesian zones-1 at depths less than 70 ft (21 m) and
-2 at depths of about 200 ft (61 m) yield water of suitable quality
for domestic use in most areas except in the peninsula west of the
Myakka River estuary. In some areas water from zone-2 contains flu-
oride and sulfate in concentrations greater than 1.6 and 250 mg/l,
respectively.

The water from zone-3 a t depths 250 t o 450 f t (76 t o 137 km) i s
usable f o r most purposes everywhere except i n t h e peninsula southwest
of the Myakka River e s tua ry where the water conta ins r e l a t i v e l y high
f l u o r i d e , chloride,and s u l f a t e concent ra t ions , i n excess of 250 m g / l .
Zones-4 a t depths 500 t o 700 f t (150 t o 210 m) and -5 a t depths of 1,000 t o
1,500 f t (305 t o 457 m) y i e l d l a r g e q u a n t i t i e s of water b u t except f o r t h e
extreme nor theas t e rn p a r t of t h e a r e a , t h e s u l f a t e and f l u o r i d e concentra-
t i o n s a r e g r e a t e r than 250 and 1.5 mg/l.
Most s t reams i n t h e Myakka River bas in a rea have small drainage
bas ins , sho r t channel l eng ths , and do not y i e l d high volumes of flow.
Many streams, however, y i e l d s u f f i c i e n t flow t o r ep resen t a p o t e n t i a l
supply t o supplement t h e needs of t h e r ap id ly urbanizing c o a s t a l
a reas . The main l i m i t i n g f a c t o r is the l a c k of s u i t a b l e impoundment
s i t e s f o r s t o r i n g water during t h e annual dry season. Upper and
lower Myakka l a k e s would provide a continuous supply of 10 Mgal/d
(38 m l / d ) over a 20-year drought and 6.5 Mgal/d (25 m l / d ) over a
30-year drought i f l a k e s t a g e s a r e maintained a t 1 4 and 1 0 f t
(4.3 and 3.0 rd) above m s l , r espec t ive ly .
In genera l , t h e q u a l i t y of su r face water i n t h e a rea dur ing
normal and high flows i s exce l l en t except f o r high co lo r and temperatures
of about 90°F (3Z°C) during t h e summer. The concent ra t ions of s u l f a t e ,
ch lo r ide , and f l u o r i d e i n water of most streams sampled dur ing t h e
study genera l ly met t h e EPA c r i t e r i a f o r dr inking water a t normal
and high flows. During t h e spr ing dry season, most of t h e flow of
streams i s maintained by ground water which inc reases t h e dissolved-
s o l i d s , s u l f a t e , ch lo r ide , and f l u o r i d e concent ra t ions and hardness
of the stream water . Near t h e coas t , t h e ch lo r ide concent ra t ion of
water i n t i de -a f f ec t ed s treams is high.
8 0
About 16.5 billion gallons (70,000 million cubic metres) of ground
water was used in the Myakka River basin area in 1965. This use averages
about 45 Mgal/d (2 m3/s). However, because of seasonal patterns of
water use, about 40 percent of the annual total use occurs during the
dry spring. Sixty-four percent of total ground water use is for
irrigation and 35 percent is for public and domestic water supplies.
Less than 1 percent of ground water used is for industrial-commercial
purposes. The use of surface water was low in 1965, averaging only
about 2.5 ~gal/d (0.1 m3/s) for public water supply and pasture
irrigation.
The water problems in the Myakka River basin area include
flooding, inadequate or excessive draimge, inadequate supply of water
of suitable quality, and deterioration of the supply by pollution
and salt-water intrusion.
About one-third of the land below an altitude of 40 ft (12 m)
is subject to flooding.
One of the most pressing problems in the area is the need for
additional supplies of water of suitable quality to meet the
requirements of a growing population. This problem could be alleviated
in some areas by supplementing the ground-water supply with surface
water where the topography is suitable for impoundments.

The potential exists for saltwater intrusion into freshwater
aquifers in coastal areas as ground-water withdrawals increase.
The construction of saltwater canals inland has caused some local-
ized saltwater intrusion. The intermixing of water of different
quality between aquifers occurs in wells with casing driven only to
the first hard-rock stratum. The well bore serves as a conduit which
allows water of poor quality from one zone to intrude another zone
containing water of better quality. This problem has been corrected for
newly constructed and future wells as casing installation procedures
stipulated by Sarasota County now require the isolation of zones con-
taining water of poor quality.
Man-made pollution from a variety of sources has deteriorated
water quality in streams and aquifers in the area. For example,
effluent from public waste-treatment plants is discharged into
canals and eventually reaches coastal bays and estuaries. As a
result, large offshore areas have been closed to the harvest of
shellfish. Runoff from agricultural lands and wastes from phosphate-
mining operations are potential sources of pollution.

SELECTED REFERENCES
Applin, P. L. , and Applin, E. R . , 1944, Regional subsurface s t r a t i g r a p h y
of F lo r ida and Southern Georgia: Am. Assoc. Petroleum Geologists
Bu l l . , v . 12, p. 1680-1686.
Barnes, H. H . , and Golden, H. G . , 1966, Magnitude and frequency of f loods
i n the United S t a t e s , p a r t 2-B, South a t l a n t i c s l o p e and e a s t e r n
Gulf of Mexico bas ins , Ogeechee River t o P e a r l River: U.S. Geol.
Survey Water-Supply Paper 1674, 409 p.
Bishop, E. W . , 1960, Fresh water resources of Sarasota County, F lo r ida :
Board of Sarasota County Commission Research Rept.
Black, A. P. , and Brown, Eugene, 1951, Chemical cha rac te r of F l o r i d a ' s
waters: F lo r ida S t a t e Board of Conserv., Div. Water Survey,
Research Paper 6 , 119 p.
Clark, W. E . , 1964, P o s s i b i l i t y of sal t -water leakage from proposed
i n t r a c o a s t a l waterway near Venice, F lo r ida we l l f i e l d : F lo r ida
Geol. Survey Rep. Inv. 38, 33 p.
Co l l in s , W. O . , and Howard, C . S . , 1928, Chemical cha rac te r of waters
of F lor ida : U.S. Geol. Survey Water-Supply Paper 596-G, 56 p.
Cooke, C . W . , 1945, Geology of F lor ida : F lo r ida Geol. Survey Bul l .
29, 339 p.
Dalymple, T . , 1960, Flood-frequency analyses: U.S. Geol. Survey Water
Supply Paper 1543-A.
Eppert, H. C . , 1966, S t r a t ig raphy of t h e Upper Miocene d e p o s i t s i n
Sarasota County, F lo r ida : Tulane Studies i n Geology, v . 4 ,
no. 2 , p. 49-61.

Ferguson, G. E . , and Lingham, C. W . , Love, S. K . , and Vernon, R. O . ,
1947, Springs of F lo r ida : F lor ida Geol. Survey Bul l . 31, 196 p.
Fl ippo, H. N . , J r . , and Joyner , B . F., 1968, Low streamflow i n t h e
Myakka River bas in a r e a i n F lo r ida : F lo r ida S t a t e Board of
Conserv., Div. of Geology, Rept. Inv. 53, 34 p .
F lor ida S t a t e Board of Heal th, 1960, Some phys ica l and chemical
c h a r a c t e r i s t i c s of s e l ec t ed F lo r ida waters , J acksonv i l l e ,
F lo r ida S t a t e Board of Health, 108 p.
F lor ida S t a t e Board of Heal th, 1964, Some phys ica l and chemical
c h a r a c t e r i s t i c s of s e l ec t ed F lo r ida waters (a supplement):
J acksonv i l l e , F lo r ida S t a t e Board of Heal th, 54 p.
Joyner, B . F . , and S u t c l i f f e , H. , Jr., 1967, Salt-water contamination
i n we l l s i n t h e Sara-Sands a rea i n S i e s t a Key, Sarasota County,
F lor ida : Am. Water Works Assoc. Jour . , v . 59, no. 12,
p. 1504-1512.
Kaufman, Matthew I., 1969, Generalized d i s t r i b u t i o n and concent ra t ion
of orthophosphate i n F lo r ida streams: F lo r ida Bureau of Geol.
Map S e r i e s No. 33.
Kohler, M. A . , Nordenson, T . J . , and Baker, D . R . , 1959, Evaporation
maps of t h e United S t a t e s : U.S. Weather Bureau Tech. Paper 37.
L i c h t l e r , W . F., Anderson, W. , and Joyner, B . F., 1964, In ter im repor t
of t h e water resources of Orange County, F lo r ida : F lo r ida Geol
Survey I n £ . C i rc . 41, 50 p.
MacNeil, F. S., 1949, P le is tocene shore l i n e s i n F lo r ida and Georgia:
U.S. Geol. Survey Prof . Paper 221-F, 106 p .

Mil le r , J. F . , 1944, Two t o ten-day p r e c i p i t a t i o n f o r r e t u r n periods
of 2 t o 100 yea r s i n t h e contiguous United S t a t e s : U.S. Weather
Bur. Tech. Paper 49.
National Academy of Sciences and National Academy of Engineering, 1973,
Water q u a l i t y c r i t e r i a 1972 (U.S.) Environmental P ro tec t ion
Agency r e p t . EPA R3 73 033, 594 p.
Parker , G. G . , and Cooke, C . W . , 1944, Late Cenozoic geology of
southern F lo r ida , w i th a d iscuss ion of t h e ground water: F lo r ida
Geol. Survey Bul l . 27, 119 p.
Parker , G. G . , Ferguson, G. F . , Love, S. K . , and o t h e r s , 1955, Water
resources of sou theas t e rn Flor ida : U.S. Geol. Survey Water-
Supply Paper 1255, 965 p.
Peek, H . M . , 1958, Ground-water resources of Manatee County. F lor ida :
F lor ida Geol. Survey Rept. Inv. 18, 99 p.
Peek, H . M . , 1958a, Records of we l l s i n Manatee County, F lo r ida :
F lor ida Geol. Survey I n f . Circ . 19, 199 p.
Pr ide , R . W . , 1973, Estimated use of water i n F lo r ida , 1965, F lo r ida
Geol. Survey Map S e r i e s 36.
Smally, Wellford and Nalvin, 1961, Sarasota County c o a s t a l bas ins
f lood-control s tudy: Board of Sarasota County Comiss ione r s ,
98 p .
Smally, Wellford and Nalvin, 1963, Water supp l i e s of Sarasota County:
Board of Sarasota County Commissioners, 122 p.

Smith and G i l l e s p i e , 1960, In ter im r e p o r t on ground-water s t u d i e s
f o r Sa raso ta , F lor ida : CCty of Sarasota , 20 p.
Stewart , H . G , , 1966, Ground-water resources of Polk County, F lor ida :
F lo r ida Beol. Survey Rept. Inv. 4 4 , 170 p.
S t r i n g f i e l d , V. T . , 1933, Ground-water i n v e s t i g a t i o n s i n F lo r ida :
F lo r ida Geol. Survey Bull . 11, p. 1-33.
S t r i n g f i e l d , V . T . , 1936, Ar tes ian water i n t h e F lo r ida peninsula:
U.S. Geol. Survey Water-Supply Paper 773-C, p . 115-195.
S t r i n g f i e l d , V . T . , 1966, Ar tes ian water i n T e r t i a r y Limestone i n
t h e southeas tern s t a t e s , U.S. Geol. Survey P ro f . Paper 517,
226 p.
S u t c l i f f e , H . , Jr . , and Joyner, B . F., 1966, Packer t e s t i n g i n water
we l l s i n Sarasota County, F lor ida : Ground water , v . 4 , no. 2
p. 23-27.
S u t c l i f f e , H . , Jr . , and Joyner, B . F., 1968, Test we l l explora t ion
i n t h e Myakka River bas in a rea , F lo r ida : F lo r ida S t a t e Board
of Conserv. Div. of Geology I n f . C i rc . 56, 61 p.
U. S. Army Corps of Engineers, 1961, Analysis of hurr icane problems
i n c o a s t a l a r e a s of F lor ida : U.S. Army Corps of Engineers,
J acksonv i l l e .
U. S. S o i l Conservation Service, 1961, Work p lan f o r Sarasota West
Coast Watershed: U.S. Dept. Agr icul ture .
U . S . S o i l Conservation Serv ice , 1965, Work p l a n f o r Big Slough
watershed: U.S. Dept. Agr icul ture .
Wander, I. W . , and Re i t z , H . J . , 1951, The chemical composition of
i r r i g a t i o n water used i n F lor ida s i t r u s groves: F lo r ida Univ.
Agr. Exp. S ta . Bull . 480, 7 p .

In this report, wells are referred to by a local number, serially from 1 through 67. The U.S. Geological Survey Site Identification N m - ber is a 15-digit number based on the latitude and longitude coordinates of the well site. The table below shows the Site Identification number for each well mentioned in this report.
WELL AND SITE IDENTIFICATION NUMBERS

UNITED STATES DEPARTMENT OF THE INTERIOR GEOLOGICAL S U R V N 3 2 5 John Knox R d - - S u i t e F 2 4 0 Tallahassee, Florida 3 2 3 0 3
FIRST CLASS
POSTAGE AND FEES PAID U . S . DEPARTMENT OF THE INTERIOR INT. 4 1 3