burden of diabetes in indiana - state of indiana
TRANSCRIPT

2011
BURDEN OF DIABETES IN INDIANA

BURDEN OF DIABETES IN INDIANA
INDIANA STATE DEPARTMENT OF HEALTH
Gregory N. Larkin, MD, FAAFP State Health Commissioner
Dawn Adams, JD Assistant Commissioner
Health and Human Services Commission
Project Team
Pramod Dwivedi, DrPH (c)
Director, Chronic Disease Epidemiology
Champ Thomaskutty, MPH
Epidemiologist, Cardiovascular Health and Diabetes Section
Meenakshi Garg, MD, MPH Director, Chronic Disease
Prevention and Control
Pramod Dwivedi, DrPH (c) Director, Chronic Disease
Epidemiology

ACKNOWLEDGMENTS
EPIDEMIOLOGY RESOURCE CENTER
Pam Pontones, MA, State Epidemiologist
Joe Haddix, MPH, Maternal and Child Health
Epidemiologist
Jon Lewis, PhD, Director, Data Analysis Team
Linda Stemnock, Data Analyst
DIVISION OF CHRONIC DISEASE AND
PREVENTION
Meenakshi Garg, MD, MPH, Division Director
Laura Heinrich, RD, CD, Section Director
Manisha Singhal, MPH, Policy Analyst
Gail Wright, BS, Health Education Specialist

For more information contact:
Laura Heinrich, RD, CD, Cardiovascular Health
and Diabetes Section Director,
Indiana State Department of Health
This report is posted on the Indiana State
Department of Health’s website. The address is:
www.chronicdisease.isdh.in.gov
Suggested Citation: Thomaskutty, C and Dwivedi, PK (2011).
Burden of Diabetes in Indiana.
Indiana State Department of Health,
Indianapolis, Indiana
Report Funding: Funding for this report was provided by the
Centers for Disease Control and Prevention
(Award Number: 5U58DP001966).

TABLE OF CONTENTS
Introduction ……………………………………………………………….….…………………
Year 2020 Goals ………………………………………………………………..………..……...
Trends-Prevalence …………………………………………………………...…….……………
Trends-Hospitalization ………………………………………………………...………………
Trends-Mortality …………………………………………………………………..……………
Trends-Geographic Distribution …………………………………………………..……………
Disparities-Age …………………………………………………………..……….…………….
Disparities-Gender …………………………………………………………….…….…………..
Disparities-Race and Ethnicity ………………….………….…………………………………..
Disparities-Education and Income ………………….…………………..…………..…………..
Risk and Protective Factors …………………………………………………………………...
Intervention …………….…………………………………………………………..……………
Indiana State Department of Health
Diabetes Prevention and Control Program ………………………..………….
References …………………………………………………………………...….………………
Appendices ……………………………………………………………………..………………
1
3
4
5
6
7
8
9
10
12
14
15
19
21
23

FIGURES, TABLES, & APPENDICES
FIGURES
Figure 1: Prevalence of diabetes, (2000-2009) …………………………………………….…...
Figure 2: Diabetes associated hospitalization (2004-2009) …………….………………………
Figure 3: Diabetes mortality rates, Indiana (2002-2007) ………………………………………..
Figure 4: Diabetes prevalence by age (2009) …………………….…………………………….…
Figure 5: Diabetes prevalence in adults by gender ………………………….…………………..
Figure 6: Diabetes mortality rates by gender, Indiana (2002-2007) ……………..…………….
Figure 7: Diabetes prevalence by race/ethnicity, Indiana and U.S. (2009) …………………………
Figure 8: Diabetes mortality rates by race, age-adjusted, Indiana (2002-2007) ……….…………..
Figure 9: Diabetes mortality rates by race and gender, Indiana (2002-2007) ………..………...
Figure 10: Diabetes prevalence by education, Indiana (2009) ………..……………..…………..
Figure 11: Diabetes prevalence by income, Indiana (2009) ……………..…………..…………..
TABLES
Table 1: Indiana county-level prevalence estimates for adult diabetes………………..…………..
APPENDICES
Appendix A ……………………………………………………………………..…………….…
4
5
6
8
9
9
10
11
11
12
13
7
23

1
Diabetes is a serious, costly and growing public health problem in the United States and Indiana. Diabetes mellitus is a group of diseases characterized by high levels of glucose (sugar) in the blood, resulting from defects in insulin production, insulin action, or both. Insulin is necessary for the body’s regulation of blood glucose levels. It is a hormone produced in the pancreas and contributes to the metabolism of sugars, starches, and other foods into energy. Without a properly functioning insulin signaling system, blood glucose levels become elevated and other metabolic abnormalities occur, leading to the development of medical complications. These complications may lead to diminished quality of life, disability, or even death.
The World Health Organization estimates that the number of adults in the United States with diabetes will double by the year 2030.
1 Nationally, the prevalence of diabetes has reached epidemic
levels and has been increasing by almost 5% each year since 2000.2
In Indiana, the prevalence of diabetes has also grown, increasing by over 50% from 2000 to 2009.
3
Types of Diabetes
Type 1 diabetes, formerly known as juvenile-onset diabetes or insulin-dependent diabetes mellitus, most often appears during childhood or adolescence and accounts for 5-10% of all diagnosed cases of diabetes. In type 1 diabetes, the body’s immune system destroys the cells that produce insulin. Since the body produces little or no insulin, individuals with type 1 diabetes must take insulin daily to survive. Type 1 diabetes is usually diagnosed within a short time of onset because the symptoms are severe and occur rapidly.
4
Type 2 diabetes, formerly called adult-onset diabetes or non-insulin-dependent diabetes, usually begins as insulin resistance, a disorder in which cells do not use insulin properly. Over time, the resulting inefficiency contributes to a loss of insulin production capacity by the pancreas. Type 2 accounts for 90–95% of individuals diagnosed with diabetes. Some individuals control their blood glucose by exercising regularly and maintaining a healthy diet, but many require medical intervention to achieve recommended blood glucose levels. Type 2 diabetes most often appears in individuals older than 40 years of age, but is increasingly being diagnosed in children and teens and is no longer considered a disease exclusive to adults.
4
Gestational diabetes is a form of glucose intolerance diagnosed in 2-10% of women during pregnancy. This type of diabetes will increase a woman’s risk of developing type 2 diabetes in the future, and place the child at greater risk of being overweight and developing diabetes later in life. Gestational diabetes requires treatment during pregnancy to normalize maternal blood glucose levels to avoid medical complications in the infant.
4
Other types of diabetes may result from specific genetic conditions, immune or endocrine dysfunction, surgery, drugs, infections, or malnutrition. Such forms of diabetes only account for 1-5% of all diagnosed cases.
4
Pre-diabetes is a term used to describe individuals who are at increased risk of developing type 2 diabetes. Individuals with pre-diabetes have higher blood sugar levels than normal, though not high enough to be diagnosed with diabetes. Pre-diabetes is characterized by impaired fasting glucose (IFG) or impaired glucose tolerance (IGT) and in some cases both. IFG is a condition in which the fasting blood sugar level is 100 to 125 milligrams per deciliter (mg/dl) after an overnight fast, and IGT is a condition where the blood sugar level is 140 to 199 mg/dl after a two-hour oral glucose tolerance test. Those with pre-diabetes are likely to develop type 2 diabetes within 10 years, unless active steps are taken to prevent or delay diabetes.
4
INTRODUCTION

2
Economic Impact
A major consequence of diabetes is the utilization of healthcare resources. Diabetes is an expensive
chronic disease to manage. The average annual health care cost for a person with diabetes in the
United States is $11,744, compared with $2,935 for a person without diabetes. Costs include regular
health care visits, medications, supplies, treatment and hospitalizations for complications, and
educational programs. In 2007, the total annual economic cost of diabetes in the United States was
estimated at $218 billion, including $174.4 billion for diagnosed diabetes. This figure is composed
of $116 billion in excess medical expenditures and $58 billion in reduced national productivity. The
remaining cost resulted from $18 billion spent on undiagnosed diabetes, $25 billion for pre-
diabetes, and $636 million for gestational diabetes.5
Of the $116 billion spent on medical expenditures, $27 billion was for diabetes-specific direct care,
$58 billion was spent on complications due to diabetes, and $31 billion was associated with excess
general medical care. The largest components of this spending were for inpatient hospital care
(50%), medication and supplies (12%), retail medications to treat complications (11%), and
physician office visits (9%). One out of every five health care dollars spent in the United States is
spent on caring for an individual with diabetes while one in every ten dollars is attributed to
diabetes. This cost data does not include social costs such as pain and suffering or care provided by
nonpaid caregivers. The total estimated cost incurred by the state of Indiana approaches $4 billion.
5
Both ambulatory and in-patient care contribute to the significant cost associated with diabetes care.
Diabetes is the seventh leading reason for ambulatory care visits, which includes visits to health care
provider offices, out-patient care and emergency services.6 Furthermore, poorly controlled or
progressive diabetes may lead to lengthy in-patient care. Nationally, the average hospital stay is 4.8 days
for all diagnoses. In Indiana, the average hospital length of stay associated with diabetes is 4.9 days.7
Diabetes is a public health concern not only because of its significant complications and cost, but
also because many cases are preventable. The Cardiovascular Health and Diabetes Section (CHDS)
at the Indiana State Department of Health (ISDH) includes the Diabetes Prevention and Control
Program (DPCP) which compiles and analyzes diabetes data based on the most recent mortality and
morbidity data available, as well as Behavior Risk Factor Surveillance System (BRFSS)
information. The majority of data available on diabetes relates to adults, and unless specified
otherwise, combines type 1 and type 2 when discussing issues of prevalence.
INTRODUCTION

3
Indiana incorporates Healthy People goals into its public health strategies and activities. Broadly
speaking, the DPCP strives to reduce the incidence of diagnosed diabetes, lessen the complications
associated with diabetes, and lower the mortality due to diabetes. Strategies for achieving these
goals include primary prevention efforts geared toward preventing or delaying the onset of type 2
diabetes and secondary prevention activities to properly manage type 1 and type 2 diabetes, while
preventing complications, comorbidities, and mortality.
Several strategies are incorporated into care guidelines to achieve these goals. Improved glycemic
control among individuals with diagnosed diabetes, which includes reducing the proportion of this
population with hemoglobin A1C (A1C) values greater than 9% and increasing the proportion with
an A1C lower than 7%. As part of this effort, the proportion of adults with diabetes who have an
A1C measurement at least twice a year must increase. The A1C measures average blood glucose
levels over a two to three month period, and is an important measure for assessing the effectiveness
of a diabetes treatment plan. A second strategy is to increase the proportion of individuals with
diabetes who monitor their own blood glucose-levels at least once a day. A final diabetes- specific
strategy is to increase the proportion of individuals with diagnosed diabetes who receive formal
diabetes education.
Additional management activities are associated with related health issues and common
complications of diabetes. Because of associated cardiovascular risk factors, improved blood lipid
and blood pressure control are desired. Due to the high risk of poor wound healing, it is important
that there is an increase in the proportion of individuals with diabetes who annually have a foot
examination. Also, since oral, renal and vision problems are common in individuals with diabetes,
increases in rates of annual dental exams, annual urinary micro-albumin measurement, and annual
dilated optical exams are desired. Detailed Healthy People goals and objectives can be found at
www.healthypeople.gov. Specific disease-management recommendations are published by the
American Diabetes Association and can be found at Living with Diabetes.
YEAR 2020 GOALS

4
Prevalence
In 2009, an estimated 9.3% of the adult population in Indiana, over 447,000 individuals, reported
that they had been diagnosed with diabetes. This rate exceeds the diabetes prevalence of the United
States, 8.3%. This current rate is reflective of a long term trend of state and national increases in
diabetes prevalence. Indiana’s age-adjusted diabetes prevalence increased by over 50% during the
period from 2000 to 2009 (Figure 1).3,8
Based on national findings, it is estimated that over 3% of Indiana’s adult population has
undiagnosed diabetes. A further issue of concern stems from the growing number of individuals
with IGT or IFG, which places them at risk for developing type 2 diabetes. Research estimates that
35% of U.S. adults, 20 years or older, fall into this classification, which is referred to as pre-
diabetes. In addition to the diabetes risk, there is higher risk of heart disease and stroke.2,4,9
As
people develop diabetes, medical and lifestyle interventions are typically necessary to optimize
health outcomes. Lack of interventions or unsuccessful interventions often results in poorly
controlled diabetes, which frequently leads to serious complications and higher health care costs.
National information provides insight into patterns of complications due to diabetes. Hypertension
can be found in 66.7% of adults with diabetes. This, along with other factors, contributes to adults
with diabetes experiencing rates of heart disease mortality and stroke incidence that are two to four
times higher than in adults without diabetes. Diabetes is the leading cause of kidney failure,
accounting for 44% of all new cases in 2008. Diabetes is also the leading cause of new cases of
blindness among adults. Another consequence of diabetes is the potential for nervous system
damage. Mild to severe neuropathy is found in 60-70% of individuals with diabetes. This may result in
impaired sensation or pain in the feet or hands, slowed digestion of food, carpal tunnel syndrome,
erectile dysfunction, and other nerve problems. Severe forms of nerve disease can lead to
amputations, with more than 60% of non-traumatic lower extremity amputations occurring in
individuals with diabetes.2
TRENDS
2000 2001 2002 2003 2004 2005 2006 2007 2008 2009
IN 6.0 6.5 7.4 7.8 7.7 8.3 8.1 8.5 9.6 9.3
US 6.0 6.3 6.5 6.7 7.0 7.3 7.5 8.0 8.3 8.3
0.0
2.0
4.0
6.0
8.0
10.0
12.0
Percen
t
Prevalence of diabetes (2000-2009)
Data Source: Behavioral Risk Factor Surveillance System, Indiana State Department of Health
Figure 1.

5
Hospitalization
In those individuals with poorly controlled diabetes, complications which require hospitalization
may arise. Examples of such complications include biochemical imbalances, renal failure, and
amputations. Biochemical problems such as ketoacidosis and nonketotic hyperosmolar coma are
very serious and may result in death. Renal failure typically requires dialysis or kidney transplant
before waste products can be effectively filtered from circulating blood. Despite the increase in the
prevalence of diagnosed diabetes from 2004 to 2009, the percentage of hospitalizations with
diabetes as the primary diagnosis remained relatively flat during that same time period (Figure 2).2,10
However, since diabetes is often associated with multiple co-morbidities and complicates many
health outcomes, it may be part of an individual’s overall hospital diagnostic profile, although not
their primary diagnosis. For example, in 2009, 16% of individuals with diabetes reported having
had a heart attack, and 8.7% reported having had a stroke.3 Hospitalizations with diabetes diagnoses
of any type have increased in recent years (Figure 2). In 2009, such hospitalizations accounted for
22.3% of all inpatient discharges.10
Common complications of diabetes
Heart disease Stroke
Hypertension Vision problems
Kidney disease Nervous system disease
Amputations Dental disease
Pregnancy complications Depression
Biochemical imbalance Susceptibility to infection
TRENDS
2004 2005 2006 2007 2008 2009
primary diagnosis 1.3 1.3 1.4 1.4 1.4 1.4
any diagnoses 18.6 19.5 20.3 21.1 21.7 22.3
0
5
10
15
20
25
Percen
t o
f H
osp
ita
liza
tio
n
Diabetes associated hospitalization (2004-2009)
Figure 2.
Data Source: Hospital Discharge Data, Indiana Hospital Association

6
Mortality
While most diabetes complications impact quality of life, several can lead to pre-mature mortality.
Diabetes can also lead to death even in those who have not developed complications. In 2007,
diabetes was the seventh leading cause of death in the United States. This ranking was based on the
73,507 death certificates that identified diabetes as the underlying cause of death. According to
death certificate reports, diabetes contributed to 233,619 deaths in the United States. However, this
number is likely to be underreported, because studies have found that only 35-40% of decedents
with diabetes had it listed anywhere on the certificate, and only 10-15% had it listed as the
underlying cause of death. Cardiovascular complications are the leading cause of mortality and
long-term morbidity for individuals with diabetes. 3,11
The overall age-adjusted diabetes mortality rate in Indiana for 2007 was 23.4 per 100,000 adults.
Indiana mortality rates from diabetes as an underlying cause of death have gradually decreased in
recent years (Figure 3). 11
Mortality data in this report came from death certificates that listed diabetes as the underlying cause
of death, meaning that diabetes was the disease which initiated the chain of morbid events leading
directly to death. This is a small portion of the number of deaths where diabetes played a role.
Overall, the risk of death among individuals with diabetes is almost twice that of individuals of
similar age, but who do not have diabetes. 2,11
TRENDS
27.3 28.3
23.4
0
10
20
30
40
2002 2003 2004 2005 2006 2007
Diabetes mortality rates*, Indiana (2002-2007)
Year
Ra
te p
er 1
00
,00
0
Figure 3.
Data Source: Indiana Vital Records, Indiana State Department of Health
*Age-adjusted rate per 100,000 population

7
Geographic Distribution
Current diabetes data in Indiana does not offer county level prevalence. However, county level
estimates have been developed using BRFSS data and population statistics by the Centers for
Disease Control and Prevention (CDC) (Table 1). Currently, every county in Indiana has an
estimated diabetes prevalence higher than the national rate of 8.3%. Since these values are model-
based estimates, the rates are not used to rank the counties.3,12
Table 1. Indiana county-level prevalence estimates for adult diabetes
TRENDS
County
Diagnosed
Diabetes (%)
County
Diagnosed
Diabetes (%)
County
Diagnosed
Diabetes (%)
Adams 8.7
Hendricks 8.8
Pike 9.1
Allen 9.5
Henry 9.0
Porter 9.2
Bartholomew 9.1
Howard 9.8
Posey 9.1
Benton 9.1
Huntington 9.6
Pulaski 9.0
Blackford 9.6
Jackson 9.0
Putnam 9.0
Boone 9.4
Jasper 8.8
Randolph 9.4
Brown 9.0
Jay 8.9
Ripley 8.9
Carroll 9.5
Jefferson 8.8
Rush 8.8
Cass 9.0
Jennings 8.8
Scott 9.4
Clark 9.2
Johnson 8.7
Shelby 9.4
Clay 8.4
Knox 8.6
Spencer 9.0
Clinton 10.7
Kosciusko 9.3
St. Joseph 8.9
Crawford 9.4
LaGrange 9.2
Starke 9.6
Daviess 9.1
Lake 10.3
Steuben 9.6
Dearborn 8.8
LaPorte 10.0
Sullivan 9.0
Decatur 8.9
Lawrence 9.6
Switzerland 9.3
DeKalb 8.9
Madison 9.8
Tippecanoe 9.0
Delaware 9.8
Marion 9.8
Tipton 9.1
Dubois 8.5
Marshall 8.6
Union 8.9
Elkhart 9.5
Martin 9.1
Vanderburgh 8.7
Fayette 9.0
Miami 9.3
Vermillion 9.3
Floyd 9.2
Monroe 8.9
Vigo 9.2
Fountain 8.6
Montgomery 9.0
Wabash 9.1
Franklin 9.5
Morgan 9.1
Warren 9.5
Fulton 9.2
Newton 9.1
Warrick 8.7
Gibson 8.7
Noble 8.8
Washington 9.2
Grant 9.2
Ohio 9.2
Wayne 8.5
Greene 9.3
Orange 9.7
Wells 8.8
Hamilton 8.5
Owen 9.0
White 9.1
Hancock 8.9
Parke 9.2
Whitley 8.5
Harrison 9.5
Perry 8.7
Data Source: Centers for Disease Control and Prevention, BRFSS

8
Despite advances in diabetes care, some populations experience the disease at higher rates or at
greater severity than the general population. While disparities in health are often associated with
race and ethnicity, they can also be associated with numerous factors, including age, gender and
socioeconomic status. It is important to comprehensively understand all social determinants of
health in order to plan public health interventions and inform public health decisions such as
planning and resource allocation.
Age
In Indiana, individuals 65 years and older currently have the highest diabetes prevalence, 22.3%, of
all age groups (Figure 4). The majority of adults with diabetes reported that they were first
diagnosed between 46 and 60 years of age, which has remained consistent since 2006.3
However,
recent trends indicate that prevalence in younger populations is increasing. This is primarily due to
the increased incidence of type 2 diabetes. Diabetes is the fourth leading cause of death among
Indiana residents aged 55-64 years and the fifth leading cause of death for those 65 years and older.11
DISPARITIES
1.3
1.1
3.3
9.7
17.9
22.3
1.1
2.0
4.1
8.3
14.3
19.0
0 5 10 15 20 25
18-24
25-34
35-44
45-54
55-64
65+
Percent
Ag
e
Diabetes prevalence by age (2009)
US
IN
Figure 4.
Data Source: Behavioral Risk Factor Surveillance System, Indiana State Department of Health

9
Gender
In 2009, the estimated prevalence of diabetes in adult females in Indiana was 8.8%, while that of
adult males was 9.9%. Both genders maintain rates higher than U.S. estimates. These values
represent an overall increase in diabetes prevalence between 2004 and 2009 (Figure 5).3,8
Males have
a higher age-adjusted mortality rate (25.9 per 100,000) than females (21.3 per 100,000) (Figure 6).11
DISPARITIES
2004 2005 2006 2007 2008 2009
IN-Males 8.0 9.0 7.8 8.8 9.0 9.9
IN-Females 7.5 7.8 8.4 8.1 10.1 8.8
US-Males 7.2 7.7 7.9 8.1 8.4 8.8
US-Females 6.4 7.1 7.1 7.9 7.9 8.2
0.0
2.0
4.0
6.0
8.0
10.0
12.0
Percen
t
Diabetes prevalence in adults by gender
Figure 5.
Data Source: Behavioral Risk Factor Surveillance System, Indiana State Department of Health
31.9
25.9
23.9
21.3
0
10
20
30
40
2002 2003 2004 2005 2006 2007
Ra
te p
er 1
00
,00
0
Year
Diabetes mortality rates* by gender, Indiana (2002-2007)
Male
Female
Figure 6.
Data Source: Indiana State Department of Health, Vital Records *Age-adjusted rates, per 100,000 population
10
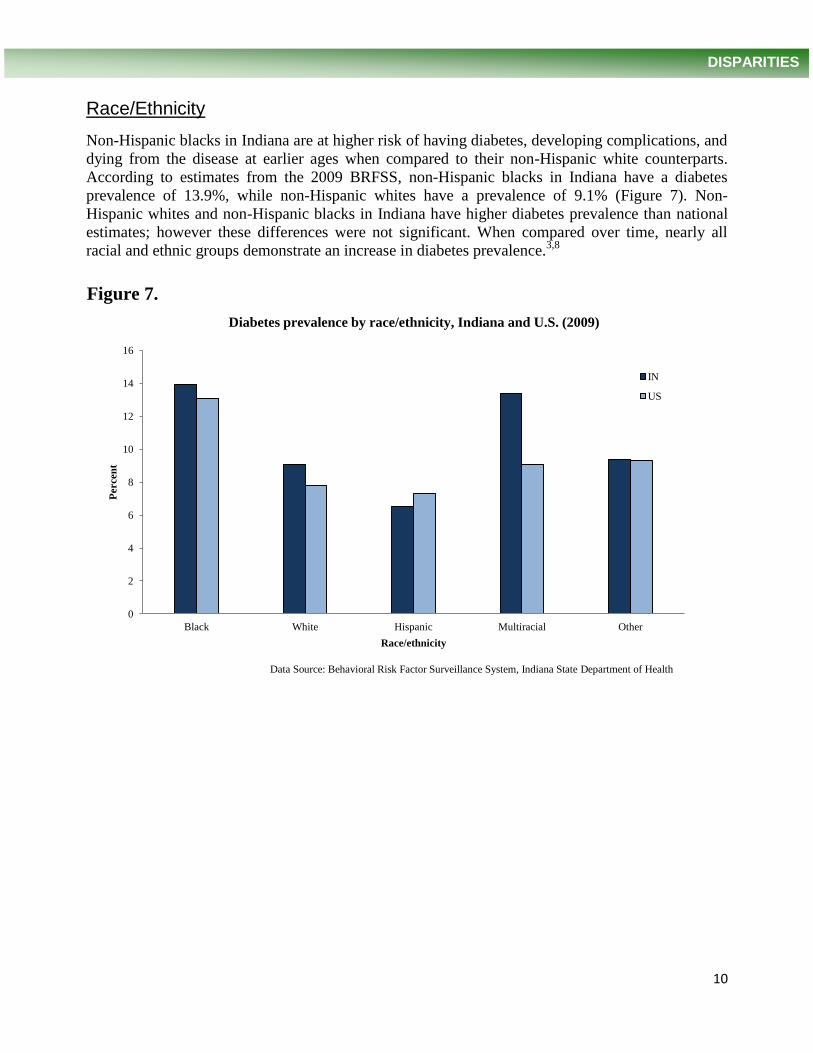
Race/Ethnicity
Non-Hispanic blacks in Indiana are at higher risk of having diabetes, developing complications, and
dying from the disease at earlier ages when compared to their non-Hispanic white counterparts.
According to estimates from the 2009 BRFSS, non-Hispanic blacks in Indiana have a diabetes
prevalence of 13.9%, while non-Hispanic whites have a prevalence of 9.1% (Figure 7). Non-
Hispanic whites and non-Hispanic blacks in Indiana have higher diabetes prevalence than national
estimates; however these differences were not significant. When compared over time, nearly all
racial and ethnic groups demonstrate an increase in diabetes prevalence.3,8
DISPARITIES
0
2
4
6
8
10
12
14
16
Black White Hispanic Multiracial Other
Percen
t
Race/ethnicity
Diabetes prevalence by race/ethnicity, Indiana and U.S. (2009)
IN
US
Figure 7.
Data Source: Behavioral Risk Factor Surveillance System, Indiana State Department of Health

11
In 2007, diabetes was the fourth leading cause of death for non-Hispanic blacks, third for Asian/Pacific Islanders, seventh for non-Hispanic whites, and eighth for Hispanics in Indiana. The number of deaths in the non-Hispanic white population is higher than in the non-Hispanic black population. However, when comparing diabetes mortality rates, the non-Hispanic black rate was almost twice as high as the non-Hispanic white rate (Figure 8). Although the age-adjusted death rate for Hispanics in 2006 was 25.7 per 100,000, a small response rate in 2007 renders the data insufficient for comparative analysis. When comparing rates from 2002 through 2007, non-Hispanic black males and females have the highest mortality rates (Figure 9). Non-Hispanic whites of both genders have displayed relatively stable mortality rates over this time period despite the growing prevalence of diabetes.
11
DISPARITIES
49.2 49.0
26.0 22.0
0.0
10.0
20.0
30.0
40.0
50.0
60.0
70.0
2002 2003 2004 2005 2006 2007
Ag
e a
dju
sted
mo
rta
lity
ra
te
Year
Diabetes mortality rates by race*, age-adjusted, Indiana (2002-2007)
Black
White
Figure 8.
Data Source: Indiana State Department of Health, Vital Records *Age-adjusted rates, per 100,000 population
2002 2003 2004 2005 2006 2007
Females-Black 43.3 54.8 49.8 49.2 41.0 46.0
Females-White 22.7 22.9 21.5 21.9 21.7 19.8
Males-Black 55.6 69.3 48.4 64.5 63.5 54.4
Males-White 30.4 29.1 29.9 28.8 28.0 24.7
0.0
10.0
20.0
30.0
40.0
50.0
60.0
70.0
80.0
Mo
rta
lity
ra
te p
er 1
00
,00
0
Diabetes mortality rates by race and gender*, Indiana (2002-2007)
Figure 9.
Data Source: Indiana State Department of Health, Vital Records *Age-adjusted rates, per 100,000 population

12
Education and Income
The prevalence of diabetes is associated with education and income level. In 2009, the prevalence
of diabetes was greatest among adults with less than a high school diploma, 13.7%, and the
prevalence was the lowest, 6.4%, among those with a college degree (Figure 10). The differences
between educational attainment and diabetes prevalence are significant, and this trend in Indiana
has been consistent over time and consistent with national trends.3
DISPARITIES
0 2 4 6 8 10 12 14 16
<H.S.
H.S. or GED
Some post H.S.
College Graduate
Percent
Ed
uca
tio
n
Diabetes prevalence by education, Indiana (2009)
US
IN
Figure 10.
Data Source: Behavioral Risk Factor Surveillance System, Indiana State Department of Health

13
Individuals with lower income exhibit a higher prevalence of diabetes. In addition to individual
income, household income is a predictive factor.13
Individuals in lower income households are more
likely to have diabetes compared to their higher income peers, which is consistent with national
data. In 2009, the prevalence for those with an annual household income (from all sources) of less
than $15,000 was 15.3% compared to only 6.8% prevalence in those that had a yearly income of
$50,000 or higher (Figure 11).3
DISPARITIES
0 2 4 6 8 10 12 14 16 18
<$15,000
$15,000-24,999
$25,000-34,999
$35,000-49,999
$50,000+
Percent
Inco
me
Diabetes prevalence by income, Indiana (2009)
US
IN
Figure 11.
Data Source: Behavioral Risk Factor Surveillance System, Indiana State Department of Health

14
The exact mechanisms for developing either type 1 or type 2 diabetes are unclear, although it appears to differ for each form of the disease. Risk factors for type 1 include autoimmune, genetic, and environmental factors. Possible explanations for the onset of type 1 diabetes are environmental triggers which stimulate an immune response against the insulin-producing pancreas. Risk factors for type 2 diabetes include both genetic and lifestyle factors that are classified as either non-modifiable or modifiable. Non-modifiable risk factors for type 2 diabetes include gender, age, and genetic factors such as race/ethnicity. Additionally, family history is highly predictive for type 2 diabetes. Modifiable risk factors include obesity, physical inactivity, tobacco use and dietary habits. Although less clear, education and income levels play a role in type 2 diabetes, as those with lower education and income tend to have a higher prevalence of diabetes.
4,13,14
Although these factors are considered distinct classifications, interactions can occur between the two. For example, genes can predispose an individual to developing diabetes but may require environmental and behavioral factors for activation. Consequently, the development of type 2 diabetes is not inevitable, and may be prevented or delayed with effective intervention.
15,16,17
Obesity and overweight are significant risk factors for the development of type 2 diabetes. Additionally, women who give birth to large-for-gestational-age
* babies are at increased risk of
developing type 2 diabetes later in life. Other factors worth noting include low birth weight, exposure to a diabetic environment in utero, and inflammatory response, but additional research is needed in these areas to clarify the mechanisms that lead to disease onset.
15,16
Women who experience gestational diabetes are an additional high-risk population. Research has shown that the risk of developing type 2 diabetes increases with time, and is almost ten times greater for women who had gestational diabetes than those who did not. The cumulative risk of developing type 2 diabetes for those women is 25.8% at 15 years post-diagnosis.
18 Information from
vital records offers a broader assessment of gestational diabetes in Indiana than the BRFSS, as it includes all female residents who gave birth during the calendar year. In 2007, there were 3,989 births where the mother was diagnosed with gestational diabetes, which accounted for 4.45% of births in Indiana.
19
Clinical research has shown that type 2 diabetes can be delayed, or even prevented, in high-risk populations by lifestyle modification which includes dietary alteration, exercise and moderate weight loss.
17,20,21 Further investigation is needed to determine how such interventions may
influence diabetes complications and co-morbidities.22
A significant contributing factor to the success of lifestyle intervention is the early identification of those with pre-diabetes, or those who are generally at high-risk for the development of type 2 diabetes.
23
RISK & PROTECTIVE FACTORS
*Birth weight at or above 90th percentile for given gestational age
Common risk factors for diabetes
Pre-diabetes Age over 45 years
Family history of diabetes Overweight or obese
Physical inactivity High blood pressure
Low HDL and high triglycerides Certain racial and ethnic groups
Pregnancy complications Women who have had gestational
Biochemical imbalance diabetes

15
Diabetes can affect many parts of the body and can lead to serious complications if not managed well. A team-based health care approach for the care and treatment of individuals with diabetes is best. The individual should also take an active role in self-management. It is important for individuals with diabetes to learn about their condition, treatment goals, and preventive measures. Self-management courses, active engagement with a physician, and diabetes educators are resources which can assist those affected by diabetes and those at high risk of developing the disease. Due to common comorbidities, many individuals with diabetes need to take medication to control high blood pressure and cholesterol in addition to medication to control blood glucose levels.
Controlling
blood glucose, blood pressure, and blood lipids may reduce the likelihood of developing complications.
14,15,16
Prevention
The onset of type 2 diabetes is not an inevitability of age. A key component of improving the outcomes associated with type 2 diabetes is preventing or delaying the onset of the disease. Intervention with at-risk individuals or those who have been diagnosed with pre-diabetes is an important key to modifying diabetes morbidity and mortality. Currently, 35% of the adult population in the United States is estimated to have pre-diabetes.
2 However, pre-diabetes research
indicates that as few as 7.3% of adults reported being informed that they had pre-diabetes.,24
This disparity in awareness may make targeting interventions difficult. Strategies for preventing type 2 diabetes include maintaining a healthy weight, eating a healthy diet, and exercising at least 150 minutes a week. Lifestyle changes coupled with weight loss of 5-7% has been shown to reduce the risk of onset of type 2 diabetes by 58%.
17,18
The concept of prevention is not limited to the prevention of disease onset. Initiation of lifestyle and medical interventions is important to achieve optimal health outcomes. As mentioned earlier, approximately 25% of individuals with diabetes are undiagnosed.
2 To optimize the impact of care,
it is crucial to identify these individuals and bring them into a care setting and initiate intervention. Once identified, the care for individuals with diabetes focuses largely on mechanisms that will prevent the development of complications such as cardiovascular disease, blindness, neuropathy and renal disease. In addition to lifestyle changes, medical intervention to maintain blood glucose, blood lipids and blood pressure at optimal levels is often initiated. Also, specialized monitoring and treatment protocols are recommended for the prevention of specific negative outcomes, including wound care, vision assessment, and kidney monitoring.
14 Further details on targets and protocols for
treatment and monitoring can be found in subsequent sections.
Treatment Goals
Individuals with diabetes should receive medical care from a physician-coordinated team of health care professionals. There are specific steps that should be taken during an individual’s lifetime in order to maintain health and avoid diabetic complications. Appendix A outlines recommended treatment strategies that are used to guide health care professionals when working with individuals who have diabetes.
Comprehensive diabetes management focuses on the “ABCs”: A1C, blood
pressure, cholesterol, and smoking cessation. Each of these items is important for managing diabetes and improving long-term health outcomes. Specific recommendations for clinical management of all forms of diabetes are published annually by the Professional Practice Committee of the American Diabetes Association as the Standards of Medical Care in Diabetes.
14
INTERVENTION

16
Glucose Control
Studies have shown that improved glucose control benefits individuals with type 1 and type 2 diabetes. For every percentage point drop in A1C blood test results, the risk of micro-vascular complications, such as eye, kidney, or nerve disease, is reduced by 40%.
4 Individual treatment
goals include achieving A1C results as close to normal (<6% in individuals without diabetes) as possible without significant hypoglycemia. Less stringent goals are set for those with severe or frequent hypoglycemia, advanced microvascular or macrovascular complications, limited life expectancy, or other significant comorbidities. Daily glucose checks and A1C testing (twice a year at least three months apart if meeting treatment goals and quarterly if not meeting goals) helps those with diabetes monitor their glucose levels so they know if, and when, adjustments are necessary.
14
According to the 2009 BRFSS, 67% of Indiana adults with diabetes reported checking their glucose level at least once a day. However, 24.1% failed to check their glucose levels daily, and 9% never checked their levels.
3 Over 84% of adults with diabetes reported having received the A1C test in the
previous year. Almost 16% of those surveyed did not know when they last had the test or have never heard of the test.
3
A key component of treatment for most people with diabetes is medical management through pharmacologic therapy. The recommended therapy for most individuals with type 1 diabetes is multiple daily doses of insulin. Treatment for type 2 diabetes includes a healthy diet, regular exercise, and oral medications. Those with type 2 diabetes may take insulin as well, alone or in combination with oral medications.
As with primary prevention, attaining and maintaining a
healthy weight is beneficial for successful treatment of diabetes.14
Among Indiana adults with diabetes, oral medications were the most common form of treatment (72.6%). Insulin was used by 29.4%. A combination of therapies was used by 57.3% of individuals. However, 21.0% did not use either insulin or oral medications. The type of treatment used by adults in Indiana with diabetes has remained consistent over time.
3
Blood Pressure and Lipid Control
Hypertension and dyslipidemia commonly occur with type 2 diabetes and contribute to negative health outcomes. Controlling blood pressure among individuals with diabetes helps to reduce macrovascular complications of diabetes, including reducing the risk of heart disease and stroke by 33-50%. It also reduces the risk of microvascular complications (eye, kidney, and nerve diseases) by about 33%. For every 10 mmHg reduction in systolic blood pressure, the risk of complications is reduced by 12%.
4,14 Of Indiana adults with diabetes, 71.8% of adults with diabetes have high
blood pressure.3
Improving cholesterol or blood lipids can reduce cardiovascular complications by 20-50%.
2,4,14 Of Indiana adults with diabetes, 68.3% reported that they had high cholesterol.
3
Kidney Disease Management
Diabetic nephropathy is a common long-term complication of diabetes. Damage to the kidneys results in the inability of the body to properly filter waste from the blood. When the kidneys fail, dialysis is necessary to filter the blood. Diabetes is the primary cause of kidney failure. Good glycemic control and early detection and treatment of diabetic kidney disease by lowering blood pressure can reduce the decline in kidney function by 30-70%.
4 Annual tests to monitor kidney
damage (urine albumin-to-creatinine ratio) and kidney function (glomerular filtration rate) are recommended.
14
INTERVENTION

17
Regular Visits to Health Care Providers
Diabetes is a complex disease which requires a comprehensive treatment protocol. It is important
for individuals with diabetes to see a health care professional regularly to monitor their disease and
to detect and prevent complications. According to the 2009 BRFSS, an estimated 86.9% of Indiana
adults with diabetes saw a health care professional for their diabetes at least once in the previous
year. However, 13.4% reported not seeing any health care professional in the previous year.3
Self-Management
Because of its complexity, individuals with diabetes who are actively engaged with a management
plan and a coordinated care team improve their chances for positive outcomes. Diabetes self-
management education is a means to facilitate such engagement. Diabetes self-management classes
are essential for helping those with diabetes understand their condition and how to care for
themselves. These courses are offered at local health departments, clinics, hospitals and in
community settings. Topics include understanding diabetes and its effects on the body; monitoring
blood glucose; nutrition; understanding the role of medications; exercise and the importance of
maintaining a healthy weight; preventing complications by detecting problems early; proper foot,
skin, and dental care; and working with health care providers. The current best practice involves a
skill-based approach that focuses on assisting those with diabetes to make informed self-
management decisions.14
In 2009, 60.5% of Indiana adults with diabetes reported that they had ever
taken a course or class to help them manage their diabetes at some time since their diagnosis.3
Eye Exams
Individuals with diabetes are at increased risk of vision problems, including blindness. Diabetes is
the leading cause of blindness among adults aged 20-74.2 Most individuals with diabetes
eventually develop some form of retinopathy. Early detection and treatment of diabetic eye disease
can reduce the development of severe vision loss by 50-60%.14,25,26
A key component to achieving
this result is regular eye exams. Recommendations suggest that individuals with diabetes see an
eye care professional each year for a dilated eye exam. In 2009, 70.1% of Indiana adults with
diabetes reported having a dilated eye exam in the previous year. Only 4.1% had never had a
dilated eye exam. However, 15.5% of respondents stated that it had been more than two years since
their last exam.3
Foot Exams
Regular comprehensive foot exams can reduce amputation rates by 45-85%.2 In 2009, 73.6% of
Indiana adults with diabetes reported that they had at least one foot exam performed by a health care
professional in the previous year. In addition to seeing a doctor for a yearly foot exam,
recommendations suggest that adults with diabetes check their feet daily for sores or irritations to
reduce the risk of infection and amputation. In 2009, 83.2% of Indiana adults with diabetes checked
their feet daily or weekly. However, 10.2% never check their feet.3
INTERVENTION

18
Dental Exams
Regular dental exams are important to detect and prevent periodontal disease.2 Poor glycemic
control may complicate oral health, and conversely periodontal disease may hinder diabetes
management.27
Although individuals with diabetes are at a higher risk of having dental disease, they
are less likely to receive regular dental care. In 2008, only 53.8% of Indiana adults with diabetes
reported that they had a dental exam in the previous year, compared to 67.9% in those without
diabetes.3
Other Preventive Measures
Overall, individuals with poorly controlled diabetes are more susceptible to illness, and once they
become sick, they often have a worse prognosis. For example, those with diabetes are more likely
to be hospitalized or die because of pneumonia or influenza than individuals without diabetes.2
Individuals with diabetes have worse outcomes when they become ill with influenza and/or
pneumonia compared to the general population. Consequently, yearly influenza vaccinations and a
pneumonia vaccination are recommended to help to prevent illness. Smoking cessation, regular
exercise, a healthy diet, and maintaining a healthy weight are also important for reducing
complications. Additionally, there are several other components to comprehensive diabetes care:
aspirin therapy to reduce cardiovascular risk, depression management, and neuropathy
management.14, 27
INTERVENTION

19
Diabetes represents a tremendous challenge for Indiana and the United States. The World Health
Organization estimates that the number of adults in the United States with diabetes will double by
the year 2030.1 The rates of obesity and diabetes are on the rise in Indiana, as well as, the rate of
individuals developing complications due to diabetes. Diabetes-related mortality and morbidity,
amputations, blindness, and kidney disease cause needless suffering and unnecessary financial
burden on individuals and Indiana's economy. The DPCP works to remove barriers associated with
preventing, detecting and managing diabetes, and supports initiatives to improve the health
outcomes and quality of life of those with diabetes and those at-risk for developing diabetes.
The DPCP’s mission is to reduce the burden of diabetes in Indiana through data surveillance, health
systems development, health communications, and the development and implementation of
community interventions and programs. To achieve its mission, the DPCP works closely with the
Indiana Diabetes Advisory Council (DAC), a group composed of clinicians, state agencies, health
insurers, not-for-profit organizations, commercial enterprises, resource providers, advocacy groups
and concerned citizens. The focus of the DAC is to increase public awareness of the impact of
diabetes, to improve the quality of life for those who are affected by diabetes, to improve the quality
of care for patients with diabetes, and to reduce the burden imposed by diabetes in Indiana.
Currently the DAC is developing a strategic plan to guide Indiana’s diabetes efforts.
A primary function of the DPCP is to provide technical assistance to entities interested in
addressing diabetes. This is achieved through assisting in program development, evaluation and
outcome analysis, as well as support in applying for grants. Additionally, the DPCP serves as a
resource for organizations, local coalitions and media outlets, in an effort to provide accurate
diabetes information to the public. The DPCP also supports the implementation of several
interventions throughout the state that attempt to address areas of health inequity:
Living a Healthy Life with Chronic Conditions is a chronic disease self management
program developed by the Stanford University’s Patient Education Research Center. The program is
a six session evidence-based workshop delivered in community settings. People with chronic health
problems, including diabetes, attend together. Workshops are facilitated by non-health professionals
who have received specific training to deliver this program. The subjects covered include: coping
techniques, appropriate exercise for maintaining and improving strength, flexibility, and endurance,
appropriate use of medications, communication skills, nutrition, and how to evaluate new
treatments.28
Enhanced Fitness is an evidence-based exercise program designed to help older adults at all
levels of fitness become more active, energized, and empowered to sustain independent lives. These
activities support the concept of physical activity as a means of improving diabetes outcomes. The
program focuses on stretching, flexibility, balance, low impact aerobics, and strength training
exercises, tools that health professionals say that people need to maintain health and function as
they grow older.
Indiana State Department of Health Diabetes Prevention & Control Program

20
The Diabetes Prevention Program (DPP) was a major multicenter clinical research study
aimed at discovering whether modest weight loss through dietary changes and increased physical
activity could prevent or delay the onset of type 2 diabetes in individuals who are diagnosed with pre-
diabetes. As mentioned previously, lifestyle intervention was proven to be an effective strategy for
primary diabetes prevention in at-risk individuals. The intervention developed during the DPP study
is now delivered in community settings, such as the YMCA. The program is lead by certified DPP
instructors and meets for 16 weeks in a group setting where lifestyle goals are set for each
individual. The two major goals of the DPP lifestyle intervention are to reduce and maintain
individual weight loss by 5-7% through basic nutrition education, and to increase physical activity
to 150 minutes per week. 17
The Diabetes Empowerment Education Program (DEEP) was developed and evaluated by
the University of Illinois at Chicago to provide community residents with the tools to better manage
their diabetes in order to reduce complications and lead healthier, longer lives. Based on principles
of empowerment and adult education, DEEP has two components. The Training of Trainers
Program is a 20 hour workshop to train community health workers (lay health educators, lay health
promoters) on providing diabetes education to members of their community. The training stresses
the development of skills and knowledge related to diabetes by using interactive group activities
and adult education methods. Once they complete the training, health workers are prepared to
deliver diabetes education and self-management classes in their communities.
The second DEEP component, The Diabetes Patient Education Program is designed as an 8-10
week curriculum for diabetes self-management education. The curriculum is divided into eight
modules covering topics that include diabetes risk factors, complications, nutrition, physical
activity, use of the glucose meter and medications, building partnerships with a diabetes health care
team, psychosocial effects of illness, problem-solving strategies, and how to access community
diabetes resources. The curriculum is based on national medical care and diabetes self-education
guidelines and recommendations, and is revised to reflect the most current knowledge and care
information.
To better address additional strategies of diabetic management, Indiana has worked with the
University of Illinois at Chicago to add a tobacco cessation component to the DEEP curriculum
(DEEP TC). Racial and ethnic minority advocacy groups were primary participants in the revised
DEEP TC curriculum.
***
For further information on diabetes in Indiana or community intervention programs, please contact
the ISDH Diabetes Prevention and Control Program at [email protected]. For free education
materials please contact the National Diabetes Education Program at ndep.nih.gov. Additional
information on diabetes can be found at the Centers for Disease Prevention and Control at
cdc.gov/diabetes and the American Diabetes Association at diabetes.org.
Indiana State Department of Health Diabetes Prevention & Control Program
21
1. Wild, S., Roglic, G., Green, A., Sicree, R. & King, H. (2007). Global Prevalence of Diabetes.
Diabetes Care, 27(5), 1047-1053.
2. Centers for Disease Control and Prevention. (2011). National diabetes fact sheet. Retrieved from
http://www.cdc.gov/diabetes/pubs/pdf/ndfs_2011.pdf.
3. Indiana State Department of Health. (2010). Behavioral Risk Factor Surveillance System, 1995-
2009 Data.
4. Geiss, L. & Albright, A. (Eds.). (2007). Proceedings from 67th Annual Scientific Sessions.
Chicago: American Diabetes Association.
5. Dall, T., Zhang, Y., Chen, Y., Quick, W., Yang, W. & Fogli, J. (2010). The economic burden of
diabetes. Health Affairs, 29(2), 297-303.
6. Schappert, S. & Rechtsteiner, E. (2011). Ambulatory medical care utilization estimates for 2007.
National Center for Health Statistics. Vital Health Statistics, 13(169).
7. Hall, M., DeFrances, C., Williams, S., Golosinskiy, A. & Schwartzman, A. (2010). National
Hospital Discharge Survey: 2007 summary. National Health Statistics Reports: 29.
Hyattsville, MD: National Center for Health Statistics.
8. Centers for Disease Control and Prevention. Behavior Risk Factor Surveillance System, 1995-
2009 Data.
9. Cowie, C., Rust, K., Byrd-Holt, D., Eberhardt, M., Flegal, K., Engelgau, M., et al. (2006).
Prevalence of diabetes and impaired fasting glucose in adults in the United States
population. Diabetes Care, 29, 1263-1268, 2006.
10. Indiana Hospital Association. (2010). Indiana Hospital Discharge Data 2004-2009.
11. Indiana State Department of Health. (2010). Vital records: Mortality data, 2002-2007.
12. Centers for Disease Control and Prevention. (2010). County level estimates of diagnosed
diabetes. Retrieved from http://apps.nccd.cdc.gov/DDT_STRS2/CountyPrevalence
Data.aspx?stateId=18&Mode=DBT.
13. LaVeist, T., Thorpe, R., Galarraga, J., Bower, K. & Gary-Webb, T. (2009). Environmental and
socio-economic factors as contributors to racial disparities in diabetes prevalence. Journal of
General Internal Medicine, 24(10), 1144-1148.
14. American Diabetes Association. (2011). Standards of medical care in diabetes-2011. Diabetes
Care, 34(S1), S11-S61.
15. Leahy, J. (2008). Type 2 diabetes mellitus: An evidence-based approach to practical
management. In M. Feinglos & M. Bethel (Eds.), Contemporary Endocrinology. New
York: Humana Press.
16. Alberti, KG, Zimmet, P, and Shaw, J. (2007). International Diabetes Federation: A consensus on
type 2 diabetes prevention. Diabetic Medicine, 24, 451-463.
REFERENCES

22
17. Knowler, W., Barrett-Connor, E. & Fowler, S. (2002). Diabetes Prevention Program Research
Group: Reduction in the incidence of type 2 diabetes with lifestyle intervention or
metformin. New England Journal of Medicine, 346(6), 393-403.
18. Lee, A., Hiscock, R., Wein, P., Walker, S. & Permezel. (2007). Gestational diabetes mellitus:
Clinical predictors and long-term risk of developing type 2 diabetes. Diabetes Care, 30(4),
878-883.
19. Indiana State Department of Health. Vital Records, 1995-2007 Birth Data.
20. Pan, X., Li, G., Hu, Y., Wang, J., Yang, W., An, Z., et al. (1997). Effects of diet and exercise in
preventing NIDDM in people with impaired glucose tolerance: The Da Qing IGT and
diabetes study. Diabetes Care, 20(4), 537-544.
21. Tuomilehto, J., Lindstrom, J., Eriksson, J., Valle, T., Hamalainen, H., Ilanne-Parikka, P., et al.
(2001). Prevention of type 2 diabetes mellitus by changes in lifestyle among subjects with
impaired glucose tolerance. New England Journal of Medicine, 344(18), 1343-1350.
22. Orozco, L., Buchleitner, A., Gimenez-Perez, G., Roque I Fiquls, M. & Mauricio, D. (2008).
Exercise or exercise and diet for preventing type 2 diabetes mellitus. Cochrane Database of
Systematic Reviews, 3(CD003054).
23. Ackermann, R., Finch, E., Brizendine, E., Zhou, H. & Marrero, D. (2008). Translating the
Diabetes Prevention Program into the community: The DEPLOY pilot study. American
Journal of Preventive Medicine, 35(4), 357-363.
24. Geiss, L., James, C., Gregg, E., Albright, A., Williamson, D. & Cowie, C. (2010). Diabetes risk
reduction behaviors among U.S. adults with prediabetes. American Journal of Preventive
Medicine, 38(4), 403-409.
25. Chew, E., Ambrosius, W., Davis, M., Danis, R., Gangaputra, S., Greven, C., et al. (2010).
Effects of medical therapies on retinopathy progression in type 2 diabetes. New England
Journal of Medicine, 363(3), 233-244.
26. United Kingdom Prospective Diabetes Study Group. (1998). Tight blood pressure control and
risk of macrovascular and microvascular complications in type 2 diabetes. British Medical
Journal, 317, 703-713.
27. National Diabetes Education Program. (2009). Guiding principles for diabetes care: For
healthcare professionals. Bethesda, MD: National Institutes of Health, 09-4343.
28. Lorig, K., Ritter, P., Stewart, A., Sobel, D., Brown, B., Bandura, A., et al. (2001). Chronic
Disease Self-Management Program: 2-year health status and health care utilitzation out-
comes. Medical Care, 39(11), 1217-1223.
REFERENCES

23
APPENDICES
Appendix A.
Data Source: American Diabetes Association
Treatment Measures Frequency
Measure weight and blood pressure Every regular physician visit
Inspect feet Every regular physician visit
Review self-monitoring glucose record Every regular physician visit
Review/adjust medications to control glucose, lipids, and blood
pressure
Every regular physician visit
Review self-management skills, dietary needs, and physical activity Every regular physician visit
Assess for depression or other mood disorders Every regular physician visit
Counsel on smoking cessation and alcohol use Every regular physician visit
Refer to Medical Nutrition Therapy with a registered dietitian,
preferably a Certified Diabetes Educator (CDE); at diagnosis, then
every 6-12 months, or as needed
Every regular physician visit
Refer to Self-Management Education with a diabetes educator,
preferably a CDE; at diagnosis, then every 6 to 12 months, or as
needed
Every regular physician visit
Assess for aspirin therapy (unless otherwise contraindicated) Every regular physician visit
Obtain A1C in patients whose therapy has changed or who are not
meeting glycemic goals (if meeting goals, twice a year at least 3 months
apart)
Quarterly
Obtain fasting lipid profile (every two years if at goal) Annually
Obtain serum creatinine and estimate glomerular filtration rate Annually
Perform urine test for albumin-to-creatinine ratio in patients with
Type 1 diabetes >5 years and in all patients with Type 2 diabetes
Annually
Refer for dilated eye exam (if normal, an eye care specialist may
advise an exam every 2-3 years)
Annually
Perform a comprehensive foot exam Annually
Refer for dental/oral exam at least once a year Annually
Administer influenza vaccination Annually
Review need for other preventative care or treatment Annually
Administer pneumococcal vaccination (repeat if over 64 years of age or
immunocompromised and last vaccination was more than 5 years ago
Lifetime