bura.brunel.ac.uk · web viewthe equations were solved by the pressure-implicit with splitting of...
TRANSCRIPT

Title:
Effect of Piston Shapes and Fuel Injection Strategies on Stoichiometric Stratified Flame
Ignition (SFI) Hybrid Combustion in a PFI/DI Gasoline Engine by Numerical Simulations
Author names and affiliations:
Xinyan Wang a, Hua Zhao a, b, Hui Xie a
a State Key Laboratory of Engines, Tianjin University, China.
b Centre for Advanced Powertrain and Fuels, Brunel University London, UK
Corresponding author:
Hui Xie, State Key Laboratory of Engines, Tianjin University, P.R. China, Weijin Road 92,
Nankai District, Tianjin, China, 300072. Tel: +86-22-27406842-8009, Mobil: +86-
13001344531, Fax: +86-22+27406842-8009. Email: [email protected].
1
1
2
3
4
5
6
7
8
9
10
11
12
12

Abstract:
In this research, the stratified flame ignition (SFI) hybrid combustion process was proposed
to enhance the control of SI-CAI hybrid combustion and moderate the maximum pressure
rise rate (PRRmax) by the combination of port fuel injection (PFI) and direct injection (DI).
The effect of the stratified flame formed by different piston shapes, start of direct injection
(SOI) timings and direct injection ratios (rDI) on the stoichiometric SFI hybrid combustion
and heat release process was studied using the three-dimensional computational fluid
dynamics (3-D CFD) simulations. The spark ignited flame propagation near the spark plug
and the auto-ignition heat release process of the diluted mixture were modelled in the
framework of 3-Zones Extended Coherent Flame Model (ECFM3Z) by the extended coherent
flame model and tabulated auto-ignition chemistry of a 4-component gasoline surrogate,
respectively. The operating load of indicated mean effective pressure (IMEP) 3.6 bar was
selected to represent a typical part-load operation. The sweep of the spark timing (ST) was
performed for different pistons, SOI timings and direct injection ratios. The SFI hybrid
combustion process with the same combustion phasing was investigated in details. The
optimal stratified mixture pattern, characterized with the central rich mixture around spark
plug and stratified lean mixture at the peripheral region, formed by the newly designed Piston
A and B effectively lowers the PRRmax with a slight deterioration of IMEP. The later SOI
timing advances the crank angle of 50% total heat release (CA50) and significantly reduces
the PRRmax with a little deterioration of IMEP. As the direct injection ratio is increased, both
the PRRmax and IMEP decrease. During the SFI hybrid heat release process, spark timing is
effective to control CA50, IMEP and PRRmax regardless the piston shapes, SOI timings and
direct injection ratios. However, the sensitivity of SFI hybrid combustion to the stratified
mixture varies with the spark timing. The reduction of the PRRmax caused by the stratified
flame enables the advance of spark timing to achieve maximum IMEP.
2
13
14
15
16
17
18
19
20
21
22
23
24
25
26
27
28
29
30
31
32
33
34
35
36
37
34

Keywords: computational fluid dynamics, hybrid combustion, stratified mixture, controlled
auto-ignition, gasoline engine
1. Introduction
Controlled auto-ignition (CAI) combustion has been subject to extensive studies in the past
decade because of its significant advantage to reduce the NOx emissions and increase fuel
efficiency [1, 2]. The CAI combustion is characterized with multi-site auto-ignition at the top
dead center (TDC), as shown in Fig. 1 (a). However, the CAI combustion process is difficult
to control and the operation range of pure CAI combustion is relatively narrow, which
inhibits the practical application of this efficient combustion mode [3]. In order to enhance
the control of CAI combustion, the flame propagation induced by spark ignition (SI) has been
used to control the subsequent auto-ignition [4, 5], as shown in Fig. 1 (b). Compared to the
traditional SI combustion, the SI-CAI hybrid combustion, also known as spark assisted
compression ignition (SACI), shows a higher thermal efficiency and lower NOx emission,
while it obtains a lower maximum rate of pressure rise and higher load operation range
compared to the pure CAI combustion [6]. In addition, this hybrid combustion concept can be
used to bridge pure SI mode and CAI mode [3, 7-10].
Fig.1. Schematic diagram of (a) CAI combustion and (b) SI-CAI hybrid combustion.
3
38
39
40
41
42
43
44
45
46
47
48
49
50
51
52
53
54
55
56
57
56

In order to control the SI-CAI hybrid combustion, different control strategies, including spark
timing [11], intake temperature [11-13], wall temperature [13], in-cylinder flow [14] and
dilution composition [11, 15], have been studied to understand their effect on hybrid
combustion process. However, it was found that the optimal high load operation is limited by
the severe knock or unacceptable pressure rise rate (PPR) for the stoichiometric hybrid
combustion with the homogeneous charge [9, 15-17]. In order to moderate the maximum
pressure rise rate of hybrid combustion, Szybist el al. [16] used a combination of intake valve
closing (IVC) control and spark timing control to achieve IMEP up to 7.5 bar. In this
strategy, the spark timing allows the start of combustion to be controlled, while retarding the
intake valve closing angle reduces the effective compression ratio. Li et al. [15] proposed an
optimized positive valve overlapping (PVO) strategy in which the PVO was formed mainly
by advancing intake valve timing and by retarding exhaust valve timing to achieve the stable
SACI combustion in the range of 5–9 bar IMEP, with significant improvements in fuel
economy, pumping loss and NOx emission.
The fuel stratification accompanied with the enrichment of the central region would form the
diluted mixture in the peripheral region, which provides a natural resistance to severe auto-
ignitions leading to unacceptable PRR. The fuel stratification has been widely studied to
overcome the overly rapid combustion at high-load conditions in homogenous charge
compression ignition (HCCI) engines [18-23]. In terms of the SI-CAI hybrid combustion, the
fuel stratification was also proposed to evaluate its potential to extend the high load limit.
Yoshizawa et al. [24] developed a two-step combustion concept to expand the high load
operation in a gasoline compression ignition engine. In this two-step combustion concept, the
spark plug would be used only for igniting a small quantity of a fuel rich mixture at the bore
center and the remaining fuel would be ignited by auto-ignition. The core of this concept is to
create the separate heat release periods to reduce the PRR. Yun et al. [17] obtained the
4
58
59
60
61
62
63
64
65
66
67
68
69
70
71
72
73
74
75
76
77
78
79
80
81
82
78

identical combustion phasing at high load spark-assisted stoichiometric HCCI operation with
the lower ringing by retarding injection timing, advancing spark timing and employing higher
exhaust gas recirculation (EGR) in a direct injection gasoline engine. They also found the
double injection strategy could be used to reduce ringing and the split ratio has a significant
effect on the trade-off between ringing and combustion stability. It was reported by Li et al.
[25] that the stable stoichiometric assisted spark stratified compression ignition (ASSCI)
combustion was achieved at medium-high load from 3.5 bar to 6.5 bar IMEP using the fuel
direct injection before spark timing. Persson et al. [26] investigated the effect of fuel
stratification on SACI with overall diluted ethanol/air mixture using high speed fuel planar
laser-induced fluorescence (PLIF). They found an increased stratification would augment the
combustion duration although the combustion phasing remained constant. Meanwhile, the
optical results indicated that ignition occurred in the mixing zone between the rich and the
leaner regions instead of the most fuel-rich regions. In addition to the above research at high
load operation, the spark ignition with the stratified charge was used to control the
combustion phasing of HCCI combustion and successfully expand the operational range
towards lower loads, from 2.7 bar IMEP to 1.5 bar [27]. However, these previous works had
been carried out without considering the conditions to promote the formation of a stable
flame and its interactions with the subsequent auto-ignition reactions of the diluted mixture.
The dual-injection strategy utilizes both the port fuel injection (PFI) and direct injection (DI)
and has been successfully applied to different combustion concept to enhance the control and
fuel efficiency of the combustion [21, 22, 26, 28]. In this study, the stratified flame ignition
(SFI) hybrid combustion was proposed to generate a stable flame kernel and hence control
the heat release process of SI-CAI hybrid combustion by dual-injection strategy at stratified
charge operations. The stratified flame kernel is formed around the spark plug by fuel
stratification in the same way as a stratified charge DI gasoline engine through the
5
83
84
85
86
87
88
89
90
91
92
93
94
95
96
97
98
99
100
101
102
103
104
105
106
107
910

appropriate direct injection strategy in combination with a suitable bowl piston [29-33]. The
piston shape should be well designed to induce the direct injected fuel to the vicinity of spark
plug. In addition to the piston shapes, both the start of injection timing [20, 34-36] and the
direct injection ratio [20, 26, 31] play important roles on controlling in-cylinder fuel
stratification patterns and combustion process. Our previous study revealed the effect of
piston shapes, start of injection (SOI) timings and direct injection ratios on the in-cylinder
conditions, including in-cylinder flow conditions, fuel stratification patterns and thermal
conditions [37].
In the proposed SFI hybrid combustion concept, the central rich mixture offered by direct
injection can be used to stabilize the early flame propagation process, while the peripheral
diluted lean mixture controlled by the PFI can be consumed by the auto-ignition combustion
mode with a relatively lower heat release rate compared to the stoichiometric auto-ignition to
moderate the pressure rise rate. In addition, the gradually stratified mixture from the central
rich region to the peripheral lean region could be used to manage the whole combustion
process. The direct injection can provide fast response on controlling the patterns and degree
of the in-cylinder fuel stratification, which has the potential to enable the real-time control on
the SFI hybrid combustion. In this study, the effect of the fuel stratification formed by
different piston shapes, SOI timings and direct injection ratios on the SFI hybrid combustion
was investigated in detail to understand the fundamental performance of SFI hybrid
combustion. The stoichiometric fuel/air mixture was applied to enable the emission reduction
with the conventional three-way catalysts. The current study would present the fundamental
knowledge on the SFI hybrid combustion characteristics with different patterns and degrees
of fuel stratification. The results would provide effective guidance on selecting the optimal
bowl piston shape and fuel injection strategy to control the SI-CAI hybrid combustion in the
future experimental investigations.
6
108
109
110
111
112
113
114
115
116
117
118
119
120
121
122
123
124
125
126
127
128
129
130
131
132
1112

2. Methodology
2.1 SFI hybrid Combustion Modelling
The modelling and simulation of SFI hybrid combustion was implemented in the STAR-CD
TM software. Reynolds-averaged Navier Stokes (RANS) simulations were applied in this
study. RNG k-ε model was adopted as the turbulence model. The enthalpy conservation
equation for the fluid mixture was used to calculate the heat transfer [38]. The simulation of
wall heat transfer was implemented by Angelberger wall function [39]. The equations were
solved by the Pressure-implicit with splitting of operators (PISO) algorithm. A set of models
depicting spray and hybrid combustion process are adopted to simulate the stratified flame
ignition (SFI) hybrid combustion process.
2.1.1 Spray modeling
A multi-hole injector was selected in this study because of its superior performance and low
cost [40]. In order to calculate the velocity of the liquid fuel as it exits the nozzle and enters
the combustion chamber, the MPI2 nozzle model [41] was employed in this study. Reitz-
Diwakar model [42] was adopted to simulate the atomization and break-up of the liquid
droplets. O’ Rourke model [43] was used to predict the collisions between fuel droplets. In
order to consider the wall impingement, Bai model [44] was applied. Fig. 2 shows the
schematic diagram of the above spray modelling. The model parameters were well tuned and
the simulation results of the spray process showed good agreement with the corresponding
optical visualizations. The detailed validation results can be found in Ref. [37].
7
133
134
135
136
137
138
139
140
141
142
143
144
145
146
147
148
149
150
151
152
1314

Fig.2. Schematic diagram of spray modelling.
2.1.2 Combustion modeling
In order to cover both the turbulent mixing effects and chemical kinetics in the stratified
flame ignition (SFI) hybrid combustion, models for the premixed flame propagation and
auto-ignition combustion were constructed to model the hybrid combustion process. The
ECFM3Z combustion model [45] was adopted as the framework of the SFI hybrid
combustion model in this study. ECFM3Z uses a flame surface density equation to describe
the flame propagation process, and the gas state in ECFM3Z model is represented by a pure
fuel zone, a pure air plus possible residual gas zone and a mixed zone. The auto-ignition of
the unburned gas was predicted by the tabulated chemistry approach [46]. In order to
construct the tabulated database used for the tabulated chemistry approach, a reduced
gasoline surrogate mechanism [47] with 312 species was adopted for the chemical kinetics
calculations under various thermodynamic and dilution conditions.
With these models, the reaction regime of each cell is determined by two parameters: the
flame surface density and the auto-ignition tendency. The available fuel in the cell will be
consumed by the flame according to the ECFM3Z model when the flame surface density of a
certain cell is greater than 0. By contrast, the available fuel in the cell will be consumed by
8
153
154
155
156
157
158
159
160
161
162
163
164
165
166
167
168
169
170
1516

auto-ignition combustion according to the tabulated chemistry approach if the auto-ignition
tendency of a certain cell achieves 1. Therefore, this hybrid combustion model is capable to
predict the stratified flame ignition (SFI) hybrid combustion. The detailed modelling process
can be found in Ref. [48].
2.2 Experimental engine
In order to validate the CFD modelling, the engine experiments were carried out on a single
cylinder gasoline engine. Table 1 shows the basic engine specifications. The engine was
developed basing on a Ricardo Hydra single cylinder block. A specially designed cylinder
head equipped with a 4-variable valve actuation system (4VVAS) was mounted on both
intake and exhaust camshafts to enable the continuous adjustment of intake/exhaust valve lift
and the valve timing. The engine was coupled to an electric dynamometer to maintain the
constant engine speed. In order to realize the precise control of the air/fuel ratio, a linear
oxygen sensor with the ±1.5% accuracy was mounted in the exhaust pipe. The Kistler 6125B
piezoelectric transducer coupled with 5011B charge amplifier was used to monitor the in-
cylinder pressure. A laminar flow meter with the accuracy of ±1% was used to measure the
amount of airflow. The coolant and lubricant oil temperatures were controlled at 80 ± 1 ºC
and 55 ± 1 ºC respectively.
An operating load of IMEP 3.6 bar was selected as a typical part-load operation. Table 2
shows the detail operation conditions. The negative valve overlapping (NVO) strategy was
adopted in this study to realize the internal exhaust gas recirculation (iEGR). The external
exhaust gas recirculation (eEGR) was also used to achieve the stable SFI hybrid combustion.
The other experimental details could be found in Ref. [3] and [9].
9
171
172
173
174
175
176
177
178
179
180
181
182
183
184
185
186
187
188
189
190
191
192
1718

Table 1 Engine specifications.
Bore 86 mm
Stroke 86 mm
Displacement 0.5 L
Compression ratio 10.66
Combustion chamber Pent roof / 4 valves
Fuel injection PFI/DI
Fuel Gasoline 93 RON
Intake pressure Naturally aspirated
Throttle WOT
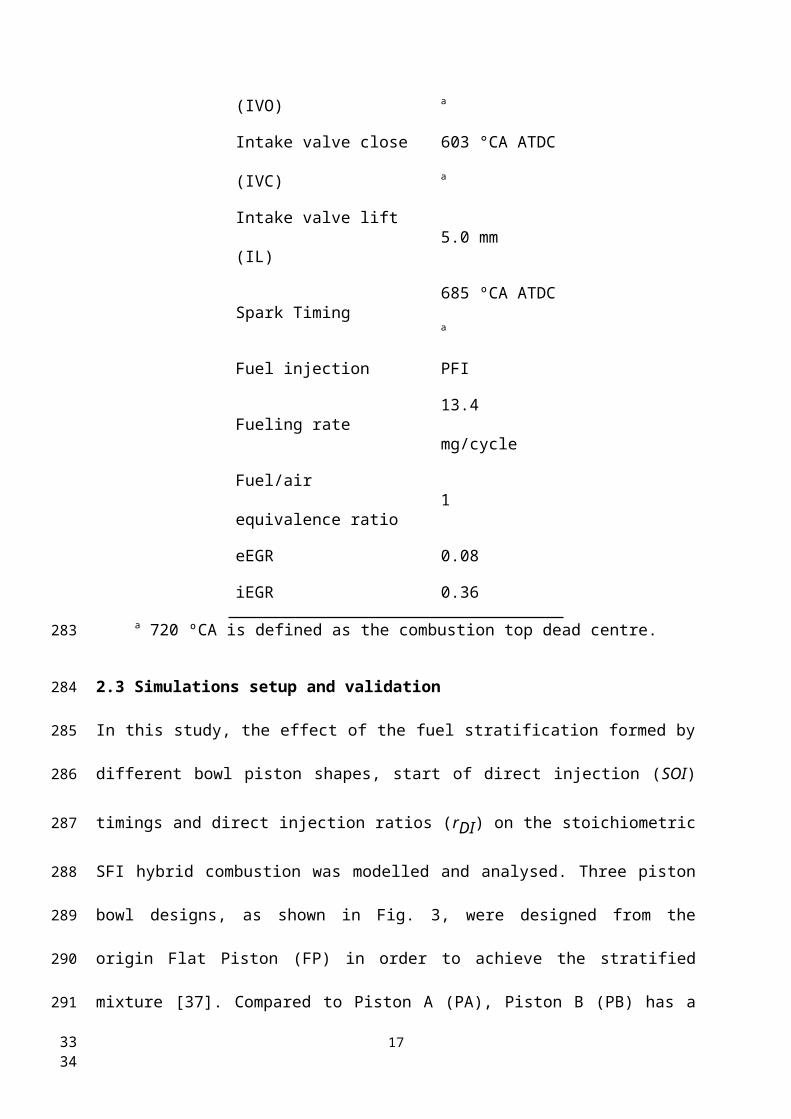
Table 2 Operation conditions.
IMEP 3.6 bar
Engine speed 1500 r/min
Piston shape Flat piston
Exhaust valve open (EVO) 177 °CA ATDC a
Exhaust valve close (EVC) 254 °CA ATDC a
Exhaust valve lift (EL) 1.9 mm
Intake valve open (IVO) 494 °CA ATDC a
Intake valve close (IVC) 603 °CA ATDC a
Intake valve lift (IL) 5.0 mm
Spark Timing 685 ºCA ATDC a
Fuel injection PFI
Fueling rate 13.4 mg/cycle
Fuel/air equivalence ratio 1
eEGR 0.08
iEGR 0.36a 720 ºCA is defined as the combustion top dead centre.
2.3 Simulations setup and validation
In this study, the effect of the fuel stratification formed by different bowl piston shapes, start
of direct injection (SOI) timings and direct injection ratios (rDI) on the stoichiometric SFI
hybrid combustion was modelled and analysed. Three piston bowl designs, as shown in Fig.
10
193
194
195
196
197
198
199
1920

3, were designed from the origin Flat Piston (FP) in order to achieve the stratified mixture
[37]. Compared to Piston A (PA), Piston B (PB) has a larger bowl diameter. Piston A and B
have been manufactured and ready for engine tests. Based on designs of Piston A and Piston
B, a deeper piston bowl was designed in Piston C (PC). The moving meshes for Flat Piston,
Pistons A, B and C were generated in ES-ICE TM using the mapping method. The engine
mesh with Piston A is shown in Fig. 4 as an example. All the four meshes have similar grid
size (around 0.8 mm).
Piston A Piston B Piston C
Fig. 3. Newly designed bowl pistons.
Fig. 4. Engine mesh with Piston A.
The detailed computational conditions of the simulations in this study are shown in Table 3.
The sweep of the spark timing (ST) was performed for all pistons, SOI timings and direct
injection ratios. The simulations were carried out from IVO to the end of combustion. In all
simulations, the inlet temperature and pressure were fixed at 355 K and 0.99 bar. The initial
in-cylinder temperature and pressure were 571 K and 0.49 bar, respectively. These conditions
were based on the one-dimensional engine simulations using GT-power. The GT-Power
engine model was built according to the real engine parameters and well validated [49]. The
11
200
201
202
203
204
205
206
207
208209
210
211
212
213
214
215
216
2122

wall temperature for cylinder head, piston head and cylinder liner were 400K, 442K and
371K respectively. The intake mixture prepared by the port fuel injection was set as a
homogeneous fuel/air mixture. The overall in-cylinder equivalence ratio after direct injection
for all cases was kept stoichiometric. The compression ratio was kept at 10.66 and the total
in-cylinder mass after the direct injection was kept constant for all the cases studied.
Table 3 Computational conditions.
Piston type SOI [ºCA] rDI [%] ST [ºCA]
Baseline case Flat Piston - 0 685
Group 1:
Effect of
Piston
Flat Piston
Piston A
Piston B
Piston C
660 28 670-700
Group 2:
Effect of SOI
Piston B 600
640
660
28 670-700
Group 3:
Effect of rDI
Piston B 660 16
20
28
35
50
670-700
In order to illustrate the applicability of the CFD simulation models, the predicted and
measured in-cylinder pressure and heat release rate profiles of the baseline case are plotted in
Fig. 5. The experimental pressure profile was calculated from the averaged pressure data of
over 200 successive cycles, and the apparent net heat release rate is calculated from the
12
217
218
219
220
221
222
223
224
225
226
227
2324

averaged pressure profile using the first law of thermodynamics. As it can be seen that the
adopted simulation models could reproduce the hybrid combustion process and shows good
agreement with the experimental data.
Fig. 5. The in-cylinder pressure and heat release rate of the baseline case from experiment
and simulation.
3. Results and discussions
3.1 Effect of piston shapes
Fig. 6 shows the effect of spark timings (ST) and piston shapes on the CA50, IMEP and
PRRmax. It should be noted that the IMEP of the simulation is calculated from 660 ºCA to 780
ºCA. As expected, the combustion phasing CA50 is significantly advanced with the earlier
spark timing. Accordingly, the IMEP increases at first and then shows a slight decrease.
Similarly, PRRmax gradually increases with the earlier spark timing.
Overall, the Flat Piston has the most advanced CA50 and highest IMEP. However, the
stratified mixture formed by the Flat Piston cannot effectively control the heat release process
and suppress the pressure rise rate, manifested by the highest PRRmax at each spark timing.
Although delaying the spark timing could achieve lower PRRmax for the Flat Piston, the IMEP
decreased more significantly. In addition, the delaying of the combustion phasing could lead
13
228
229
230
231
232
233
234
235
236
237
238
239
240
241
242
243
244
245
2526
to unstable combustion [17, 24]. Piston C shows the latest CA50 and lowest IMEP among all
pistons though its PRRmax is not the lowest. By contrast, Piston A and Piston B can achieve
relatively earlier CA50, higher IMEP and lower PRRmax at any spark timing. In addition, the
differences in CA50, IMEP and PRRmax between the three pistons gradually increase with the
retarded spark timing.
Fig. 6. Effect of spark timings and piston shapes on CA50, IMEP and PRRmax.
In order to analyse the effect of piston shapes in detail, the combustion processes with the
constant combustion phasing are compared. The spark timings are adjusted to achieve the
constant CA50 around 727.5 ºCA for all cases. Fig. 7 compares the pressure traces of the
combustion process with different piston shapes. The baseline case with the Flat Piston (FP)
and pure PFI is also included in Fig. 7. It can be seen that the early flame propagation
processes before 710 ºCA are similar and they gradually deviate from each other with the
proceeding of the combustion process. Significant differences appear during the later auto-
14
246
247
248
249
250
251
252
253
254
255
256
257
258
259
260
2728

ignition combustion process after 720 ºCA between the pure PFI and the mixed PFI and DI
cases. The introduction of direct fuel injection slows down the auto-ignition combustion
reactions in the second half of the heat release process and dramatically reduces PRRmax with
slightly lower IMEP as shown in Fig. 8. In particular, Piston A produces the lowest PRRmax of
1.79, which is nearly the half of that of the Flat Piston.
Fig. 7. In-cylinder pressure traces for different pistons with the fixed CA50 (727.5 ºCA).
Fig. 8. Comparison of the IMEP and PRRmax for different pistons with the fixed CA50 (727.5
ºCA).
15
261
262
263
264
265
266
267
268
269270
271
2930

In addition, it is noted from Fig. 7 that the spark timings for the non-flat pistons have been
advanced from the origin spark timing (ST) of 685 ºCA to maintain the combustion phasing
around 727.5 ºCA. The main reason could be attributed to the combined effect of fuel
enrichment and charge cooling effect caused by the fuel direct injection.
Fig. 9 compares the section views of equivalence ratio ( ) and temperature (T) distributions
for Flat Piston and Piston B at 680 ºCA just before the spark ignition. Compared to the Flat
Piston, Piston B could effectively direct the fuel to the spark plug and lead to obvious
enrichment of the mixture around spark plug. However, it can be found that most of the fuel
still concentrates near the piston top just before the spark ignition timing, leading to the over-
rich mixture with >1.1 in the central region. This over-rich mixture actually would
deteriorate the flame propagation speed [50]. In addition, the charge cooling effect of direct
injection would also decrease the temperature around the spark plug, as shown in Fig. 9,
which could also slow down the flame propagation speed and delay the combustion phasing.
Fig. 9. Section views of the equivalence ratio and temperature distributions at 680 ºCA for
Flat Piston and Piston B with the fixed CA50 (727.5 ºCA).
In order to reveal the spatially resolved in-cylinder conditions, the cylinder volume is divided
into seven cylindrical zones, as shown in Fig. 10. In addition, a Spark Zone is defined as a
spherical volume of 20 mm in diameter around the spark plug gap. Fig. 11 shows the average
16
272
273
274
275
276
277
278
279
280
281
282
283
284
285
286
287
288
289
290
291
3132
equivalence ratio and temperature of the mixture in the whole combustion chamber, Zone 1
and Spark Zone at 680 ºCA just before the spark discharge. Although the bowl pistons enrich
the mixture in Spark Zone with average equivalence ratio between 1.0 and 1.2, they lead to
the over-rich mixture with the average equivalence ratio over 1.5 in Zone1. Meanwhile, the
mixture temperature in Spark Zone and Zone 1 of bowl pistons drops by 7-10 K compared to
that of Flat Piston. Thus, to maintain the CA50, the advanced spark timing is required to
compensate for the slower flame speed due to the over-rich fuel mixture and charge cooling
effect of direct injection. However, as part of the fuel is consumed by the flame propagation
in the stratified charge region and remaining fuel by the fast auto-ignition combustion, the
maximum heat release rate is tamed in the SFI hybrid combustion process with bowl pistons.
Fig. 10. Schematic of the zones defined to reveal the spatially resolved in-cylinder conditions.
17
292
293
294
295
296
297
298
299
300
301
302
303
304
3334

Fig. 11. The average equivalence ratio and temperature of the mixture in the whole chamber,
Zone 1 and Spark Zone at 680 ºCA for different pistons with the fixed CA50 (727.5 ºCA).
The equivalence ratio and fuel mass fraction consumed by flame propagation (rSI) of a certain
cell just before the auto-ignition of this cell can be extracted to examine its dilution condition
before auto-ignition. Fig. 12 plots the locations of the auto-ignited cells (10% of total cell
numbers) with the lowest and highest equivalence ratio respectively from the simulations
with Flat Piston and Piston B. Compared to the Flat Piston, the auto-ignited cells with highest
equivalence ratio from the simulation with Piston B are distributed in a more compact region
close to the spark plug because of the effective guidance of the fuel by the piston bowl, while
the majority of auto-ignited cells with the lowest equivalence ratio are distributed at the rim
of the combustion chamber. This stratified mixture pattern would enable the fuel rich region
mainly consumed by the slow flame propagation while the lean mixture consumed by auto-
ignition, which facilitate the reduction of the PRRmax.
Fig. 12. The location of the auto-ignited cells with the lowest and highest equivalence ratio
for Flat Piston and Piston B with the fixed CA50 (727.5 ºCA).
18
305
306
307
308
309
310
311
312
313
314
315
316
317
318
319
320
321
322
323
3536

Fig. 13 shows the distribution characteristics of the fuel mass fraction consumed by flame
propagation (rSI) for the auto-ignited cells shown in Fig. 12. The comparison between Flat
Piston and Piston B confirms that more cells with highest equivalence ratio in Fig. 13 (a) are
mainly consumed by the flame propagation (rSI > 0.5) for Piston B, while more cells with
lowest equivalence ratio in Fig. 13 (b) would be mainly consumed by the auto-ignition (rSI <
0.2) for Piston B. The above results demonstrate that the optimal stratified mixture pattern
with rich mixture around spark plug while diluted mixture at the peripheral region formed by
the designed piston bowl enables the slowdown of the heat release rate and reduces the
maximum pressure rise rate as shown in Fig. 8.
Fig. 13. The distribution of rSI of the cells with (a) highest and (b) lowest equivalence ratio
for Flat Piston and Piston B with the fixed CA50 (727.5 ºCA).
3.2 Effect of SOI timings
Fig. 14 shows the effect of spark timing (ST) and injection timings (SOI) on CA50, IMEP
and maximum pressure rise rate (PRRmax). As the SOI timing is delayed, PRRmax is reduced
significantly. In addition, CA50 occurs earlier and IMEP values experience slight decrease.
This is mainly caused by the optimal stratified mixture pattern and increased stratification
19
324
325
326
327
328
329
330
331
332
333
334
335
336
337
338
339
340
341
3738

formed by the delayed SOI timing. Overall, the differences between CA50, IMEP and PRRmax
gradually reduce with more retarded spark timing. This can be attributed to the increased
mixing time of the direct injected fuel and in-cylinder air with the delayed spark timing. This
in turn reduces the difference of the in-cylinder stratified mixture condition and subsequent
combustion process with different injection timings.
Fig. 14. Effect of spark timings and SOI timings on CA50, IMEP and PRRmax.
Fig. 15 compares the pressure traces of the combustion process for different SOI timings with
CA50 at 727.5 ºCA. It can be seen that the late SOI timing of 660 ºCA leads to early
occurrence of the auto-ignition. However, the subsequent auto-ignition combustion process is
moderate compared to that with early SOI timings. This leads to significant reduction of
PPRmax with tiny deterioration of IMEP, as shown in Fig. 16.
In order to explain the underlying process for the reduction of PRRmax with the later injection
timing, the detailed analysis of the in-cylinder conditions and combustion process is
20
342
343
344
345
346
347
348
349
350
351
352
353
354
355
356
3940

performed. Fig. 17 shows the section views of the equivalence ratio at 676 ºCA for different
SOI timings with the fixed combustion phasing. It can be seen that a large amount of the rich
mixture distributes at the exhaust side with the early SOI timing of 600 ºCA. This also
enriches the spark plug region, as shown in the figure. The delayed SOI timing concentrates
the rich mixture at the central region with slight enrichment of the spark plug region while
leave the remaining peripheral region with diluted mixture.
Fig. 15. The in-cylinder pressure traces for different SOI timings with the fixed CA50 (727.5
ºCA).
21
357
358
359
360
361
362
363
364
365
366
367
4142

Fig. 16. Comparison of the IMEP and PRRmax for different SOI timings with the fixed CA50
(727.5 ºCA).
Fig. 17. Section views of the equivalence ratio at 676 ºCA for different SOI timings with the
fixed CA50 (727.5 ºCA).
Fig. 18 compares the average equivalence ratio and temperature of the mixture in the whole
chamber and Spark Zone at 676 ºCA for different SOI timings. With the SOI timing delaying
from 600 to 660 ºCA, the equivalence ratio of the mixture in Spark Zone gradually decreases
from 1.13 to 0.99, while the corresponding temperature increases from 684.2 K to 693.6 K.
The slight decrease of the equivalence ratio of the mixture in the whole chamber indicates
that the evaporation of the direct injected fuel is a little slower for the later SOI timing.
22
368
369
370
371
372
373
374
375
376
377
378
379
380
381
4344

Fig. 18. The average equivalence ratio and temperature of the mixture in the whole chamber
and Spark Zone at 676 ºCA for different SOI timings with the fixed CA50 (727.5 ºCA).
Fig. 19 shows the average turbulence kinetic energy (TKE) and the flow velocity magnitudes
(Vm) in the whole chamber and Spark Zone at 676 ºCA for different SOI timings. It can be
seen that the delayed SOI timing enhances the in-cylinder flow and elevates the in-cylinder
turbulence level. This benefits the mixing between the injected fuel and in-cylinder air, which
enhances the early flame propagation process. Therefore, the combustion phasing of the later
SOI timing would be advanced with the fixed spark timing, as shown in Fig. 14. This
explains why the spark timing should be delayed to achieve the same CA50 with the later SOI
timing in Fig. 15.
23
382
383
384
385
386
387
388
389
390
391
392
4546

Fig. 19. The average TKE and Vm in the whole chamber and Spark Zone at 676 ºCA for
different SOI timings with the fixed CA50 (727.5 ºCA).
In this study, the crank angle corresponding to the mode transition (CAT) from flame
propagation to auto-ignition combustion is defined as the crank angle when the auto-ignited
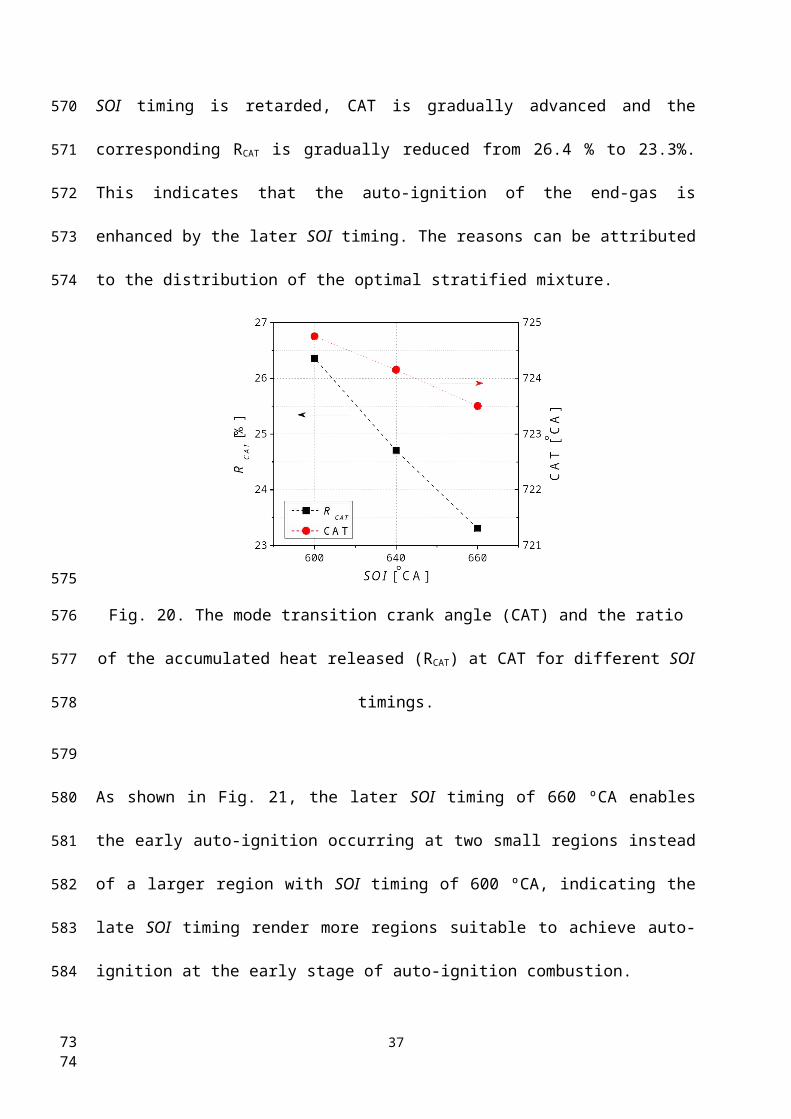
cells exceed 2% of the total cells in the cylinder. Fig. 20 shows CAT and the ratio of the
accumulated heat released (RCAT) at CAT for different SOI timings. It can be seen that as the
SOI timing is retarded, CAT is gradually advanced and the corresponding RCAT is gradually
reduced from 26.4 % to 23.3%. This indicates that the auto-ignition of the end-gas is
enhanced by the later SOI timing. The reasons can be attributed to the distribution of the
optimal stratified mixture.
24
393
394
395
396
397
398
399
400
401
402
403
404
4748

Fig. 20. The mode transition crank angle (CAT) and the ratio of the accumulated heat
released (RCAT) at CAT for different SOI timings.
As shown in Fig. 21, the later SOI timing of 660 ºCA enables the early auto-ignition
occurring at two small regions instead of a larger region with SOI timing of 600 ºCA,
indicating the late SOI timing render more regions suitable to achieve auto-ignition at the
early stage of auto-ignition combustion.
Fig. 21. The location of 2% of the firstly auto-ignited cells with SOI timing of 600 ºCA and
660 ºCA.
Fig. 22 plots the distribution of the equivalence ratio and temperature of 2% of the firstly
auto-ignited cells at 676 ºCA and the crank angle just before CAT with SOI timing of 600
25
405
406
407
408
409
410
411
412
413
414
415
416
417
418
4950

ºCA and 660 ºCA. For the early SOI timing of 600 ºCA, the first auto-ignited cells have a
wider range of equivalence ratios at 676 ºCA just before the spark discharge. The higher
equivalence ratio leads to relatively lower temperature because of the stronger latent heat of
vaporization. The higher equivalence ratio and lower temperature finally lead to the longer
auto-ignition delay time of these cells. With the proceeding of the flame propagation and
mixing process, the equivalence ratio of these first auto-ignited cells gradually decreases,
while the corresponding temperature significantly increases because of the heat from the
flame propagation. For the SOI timing of 660 ºCA, the initial equivalence ratio of the first
auto-ignited cells is around 0.72, indicating that the direct injected fuel has not reached these
regions. Thus the corresponding temperature is a little higher than that from the SOI timing of
600 ºCA. The subsequent mixing process with the central injected fuel gradually increases
the equivalence ratio, which further decreases the auto-ignition delay time. Finally, it can be
found that the temperature before the CAT for SOI timing of 660 ºCA is significantly lower
than that from SOI timing of 600 ºCA, indicating the less requirement of the heat from flame
propagation. Essentially, the fuel stratification pattern formed by the later SOI timing of 660
ºCA enables earlier auto-ignition of the peripheral lean mixture with relatively higher
temperature compared to that from the SOI timing of 600 ºCA. The above detailed analyses
of the first auto-ignited cells have explained the reason for the early mode transition crank
angle CAT and the reduced RCAT for the SOI timing of 660 ºCA.
26
419
420
421
422
423
424
425
426
427
428
429
430
431
432
433
434
435
436
437
5152

Fig. 22. The distribution of the equivalence ratio and temperature of 2% of the firstly auto-
ignited cells at 676 ºCA and the crank angle just before CAT with SOI timing of 600 ºCA and
660 ºCA.
Fig. 23 shows the flame propagation dominated combustion duration D1 (CA10-CAT), the
auto-ignition dominated combustion duration D2 (CAT-CA90) and the overall combustion
duration D0 (CA10-CA90) for different SOI timings. As speculated from the previous
analysis, the early flame propagation dominated combustion duration (D1) significantly
reduces with the delayed SOI timing. However, it is found that the auto-ignition dominated
combustion duration (D2) increases more dramatically, leading to a moderate increase of the
overall combustion duration (D0). This can be attributed to the increased inhomogeneity in
the equivalence ratio and temperature distributions with the later SOI timings, as shown in
Fig. 24.
27
438
439
440
441
442
443
444
445
446
447
448
449
450
451
5354

Fig. 23. The flame propagation dominated combustion duration D1, the auto-ignition
dominated combustion duration D2 and the overall combustion duration D0 for different SOI
timings.
Fig. 24. The inhomogeneity of equivalence ratio and temperature at 676 ºCA for different
SOI timings.
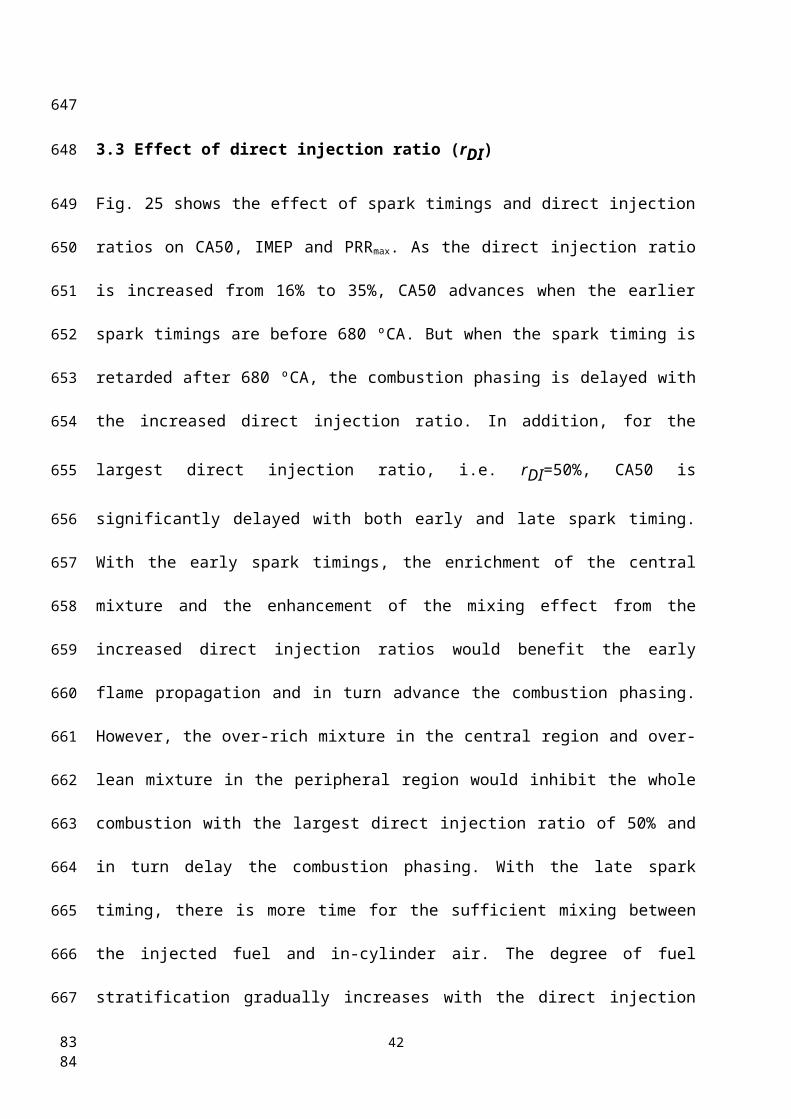
3.3 Effect of direct injection ratio (rDI)
Fig. 25 shows the effect of spark timings and direct injection ratios on CA50, IMEP and
PRRmax. As the direct injection ratio is increased from 16% to 35%, CA50 advances when the
28
452
453
454
455
456
457
458
459
460
461
462
5556

earlier spark timings are before 680 ºCA. But when the spark timing is retarded after 680
ºCA, the combustion phasing is delayed with the increased direct injection ratio. In addition,
for the largest direct injection ratio, i.e. rDI=50%, CA50 is significantly delayed with both
early and late spark timing. With the early spark timings, the enrichment of the central
mixture and the enhancement of the mixing effect from the increased direct injection ratios
would benefit the early flame propagation and in turn advance the combustion phasing.
However, the over-rich mixture in the central region and over-lean mixture in the peripheral
region would inhibit the whole combustion with the largest direct injection ratio of 50% and
in turn delay the combustion phasing. With the late spark timing, there is more time for the
sufficient mixing between the injected fuel and in-cylinder air. The degree of fuel
stratification gradually increases with the direct injection ratio increasing, leading to the
slower combustion process and later combustion phasing. The IMEP gradually decreases
with the increasing direct injection ratio, which is caused by the slower combustion process
and increased incomplete combustion of the over-lean peripheral mixture with the direct
injection ratio increasing. Meanwhile, PRRmax gradually decreases as more fuel is injected
directly into the cylinder and the presence of mixture stratification.
Fig. 26 compares the pressure traces of the combustion process for different direct injection
ratios with CA50 at 727.5ºCA. In order to keep the combustion phasing constant, more
advanced spark ignition is needed when the direct injection ratio is increased. As a result, the
flame propagation in the early part of combustion process is enhanced whilst auto-ignition
combustion contribution is reduced, although the combustion mode transition is advanced.
As the direct injection ratio is increased from 16% to 50%, the IMEP is reduced by 15% from
2.9 to 2.45 bar, whilst the PRRmax is significantly reduced by 52.7% from 2.62 to 1.24 bar/
ºCA, as shown in Fig. 27.
29
463
464
465
466
467
468
469
470
471
472
473
474
475
476
477
478
479
480
481
482
483
484
485
486
5758

Fig. 25. Effect of spark timings and direct injection ratios on CA50, IMEP and PRRmax.
Fig. 26. The in-cylinder pressure traces for different direct injection ratios with the fixed
CA50 (727.5 ºCA).
30
487
488
489
490
491
492
5960

Fig. 27. Comparison of the IMEP and PRRmax for different direct injection ratios with the
fixed CA50 (727.5 ºCA).
Fig. 28 shows the section views of the equivalence ratio distribution at 680 ºCA for different
direct injection ratios. The results show that the equivalence ratio of the outer region is
gradually reduced with the increase of the direct injection ratio. Meanwhile, the central rich
mixture becomes more concentrated around the spark plug with increasing direct injection
ratio. Fig. 29 provides the quantitative data of the in-cylinder equivalence ratio distribution
patterns with different direct injection ratios. Overall, the equivalence ratio of the mixture in
the whole chamber shows a slightly decreasing trend with the increasing of direct injection
ratio because of the weaker evaporation of the over-rich region caused by the larger direct
injection ratio. In the Spark Zone, as expected, the equivalence ratio shows a clear increasing
trend with the increase in the direct injection ratio. The interaction between the direct
injection at 660 ºCA and the piston bowl of Piston B produces a significant stratification from
the richest mixture in Zone 1 to the leanest mixture in Zone 7, as indicated in both Figs. 28
and 29. Although the stratification pattern is similar for all direct injection ratios, the degree
of the stratification is significantly increased with the direct injection ratio. Specifically, the
31
493
494
495
496
497
498
499
500
501
502
503
504
505
506
507
508
509
510
6162

larger direction injection ratio leads to richer central mixture while leaner mixture at outer
region, which is responsible for the decreased PRRmax.
Fig. 28. The section views of the equivalence ratio distribution at 680 ºCA for different direct
injection ratios.
Fig. 29. The zone-to-zone equivalence ratio distribution at 680 ºCA for different direct
injection ratios.
Fig. 30 shows the flame propagation dominated combustion duration D1, the auto-ignition
dominated combustion duration D2 and the ratio of the accumulated heat released RCAT at
CAT for different direct injection ratios. The early flame propagation dominated combustion
32
511
512
513
514
515
516
517
518
519
520
521
522
523
6364

duration D1 is gradually prolonged with the direct injection ratio, which is caused by the
over-rich mixture in the central region formed by the larger direct injection ratio. However,
the auto-ignition dominated combustion duration (D2) is nearly constant before the
substantial increase with rDI =50%. When the direct injection ratio is less than 35%, the
increased RCAT with the larger direct injection ratio benefits the maintenance of auto-ignition
dominated combustion duration because of the increased heat released from early flame
propagation. However, it is also observed that RCAT remains nearly constant after rDI=35%,
due to the over-rich mixture. This in turn triggers the earlier auto-ignition of the mixture with
appropriate equivalence ratio close to the central region instead of the lean mixture at the
peripheral region. In addition, the auto-ignition of inhomogeneous mixture leads to longer
auto-ignition dominated combustion duration D2. The above analysis explains the early
combustion mode transition and longer auto-ignition dominated combustion duration D2 with
larger direct injection ratio observed in Fig. 26.
Fig. 30. The flame propagation dominated combustion duration (D1), the auto-ignition
dominated combustion duration (D2) and the ratio of the accumulated heat released (RCAT) at
CAT for different direct injection ratios.
33
524
525
526
527
528
529
530
531
532
533
534
535
536
537
538
539
540
541
6566

Fig. 31 shows the average temperature profiles of the mixture in the whole chamber, Spark
Zone and Zone 7 for different direct injection ratios. The average temperature of the mixture
in the whole chamber is a little higher at the early combustion stage for the larger direct
injection ratio because of the advanced spark ignition timing, while it increases slowly at the
later stage. Specially, the temperature of the mixture in Spark Zone is significantly higher
with the larger direct injection ratios. The average temperature of the mixture in Zone 7 for
different direct injection ratios is similar at the early combustion stage because of the absence
of both flame propagation and the auto-ignition. At the later stage, the temperature rise in
Zone 7 is significantly slowed down with the larger direct injection ratio.
Fig. 31. The average temperature profiles of the mixture in the whole chamber, Spark Zone
and Zone 7 for different direct injection ratios.
As indicated by the temperature profile of the mixture in the whole chamber, the larger direct
injection ratio leads to lower temperature at the end of combustion, resulting from the larger
charge cooling effect and the incomplete combustion of the over-lean mixture at the outer
region. This deteriorates the IMEP, as shown in Fig. 27. With the direct injection ratio
increasing from 16% to 50%, the unburned fuel fraction at the end of simulation increases
34
542
543
544
545
546
547
548
549
550
551
552
553
554
555
556
557
558
559
6768

from 8.4 % to 11.8 %. Fig. 32 shows the distribution of the temperature and equivalence ratio
of all cells and the incompletely burned cells with xb<0.8 at 680 ºCA for rDI=16% and 50%.
The parameter xb indicates the burned fuel mass fraction at 740 ºCA in a certain cell. It can be
seen that the distribution of the equivalence ratio and temperature of all cells at 680 ºCA is
mainly divided into two groups: the central stratified mixture along the diagonal and the
peripheral lean mixture along the bottom. The peripheral lean mixture with rDI=50% become
the main part of the incompletely burned region because of the leaner mixture and the less
heat from the central flame propagation. Fig. 33 shows the locations of the incompletely
burned cells with xb<0.8 at 740 ºCA with rDI=16% and 50%. As expected, the area of the
incompletely burned region is larger and extends into the central region for rDI=50%. The
above analysis indicates that the very high direct injection ratio actually deteriorates the
performance of the stoichiometric SFI hybrid combustion because of incomplete combustion
of the over-lean peripheral mixture, although it can be used to suppress the PPRmax.
Fig. 32. The distribution of the equivalence ratio and temperature of all cells and
incompletely burned cells with xb<0.8 at 680 ºCA with rDI=16% and 50%.
35
560
561
562
563
564
565
566
567
568
569
570
571
572
573
574
575
576
6970

Fig. 33. The locations of the incompletely burned cells with xb<0.8 at 740 ºCA with rDI=16%
and 50%.
4. Summary and Conclusions
The stratified flame ignition (SFI) hybrid combustion process achieved by the combination of
port fuel injection (PFI) and direct injection (DI) was proposed in this study to enhance the
control of SI-CAI hybrid combustion and moderate the high maximum pressure rise rate
(PRRmax) at the high load operation. The newly developed 3-D CFD hybrid combustion
models were applied to the in-cylinder flow, mixture formation and combustion analysis. The
effect of the stratified mixture formed by different piston shapes, start of direct injection
(SOI) timings and direct injection ratios (rDI) on the stoichiometric SFI hybrid combustion
operation was studied using the 3-D CFD simulations. A sweep of the spark timing (ST) was
performed for all pistons, SOI timings and direct injection ratios. The SFI hybrid combustion
process with the same combustion phasing was investigated in details. The main findings can
be summarized as follows:
1. The shallow pistons (Piston A and Piston B) can significantly enhance the formation
of a stable stratified flame in the stratified mixture around the spark plug. The
stratified flame formed by the direct injection and piston design allows the start of
combustion and combustion phasing to be controlled. In addition, by altering the
36
577
578
579
580
581
582
583
584
585
586
587
588
589
590
591
592
593
594
595
596
597
7172
relatively amount of heat released by relatively slower flame propagation in the
stratified charge mixture and faster auto-ignition of diluted mixtures, the peak
pressure rise rate (PRRmax) can be significantly reduced.
2. When the SOI timing of direct fuel injection takes place later in the compression
stroke, the combustion phasing (CA50) is brought forward and PRRmax can be reduced
significantly with a little deterioration of IMEP. With the later SOI timings, the
formation and propagation of a stable flame in the stratified mixture accelerated the
occurrence of auto-ignition reactions of the peripheral lean mixture, leading to the
early mode transition. Although the flame propagation dominated combustion
duration D1 is reduced, the auto-ignition dominated combustion duration D2
significant is increased because of the increased inhomogeneity of equivalence ratio
and temperature, leading to the reduction of PRRmax. Overall, the later SOI timing
increases the whole combustion duration slightly.
3. When the amount of the direct injection fuel is increased, PRRmax is reduced
noticeably while the IMEP is also deteriorated because of the slower combustion
process and incomplete combustion of the over-lean peripheral mixture. The early
flame propagation dominated combustion duration D1 is gradually prolonged with the
increasing of direct injection ratio, while the auto-ignition dominated combustion
duration D2 is nearly constant when less than half of the fuel is injected directly into
the cylinder.
4. Spark timing is an effective tool to control the combustion phasing, IMEP and PRRmax
of the stoichiometric SFI hybrid combustion regardless of SOI timings and direct
injection ratios. However, the sensitivity of SFI hybrid combustion to the stratified
mixture is different for different spark timings. The differences in CA50, IMEP and
PRRmax between different pistons become more noticeable at the retarded spark
37
598
599
600
601
602
603
604
605
606
607
608
609
610
611
612
613
614
615
616
617
618
619
620
621
622
7374

timings. With the same stratified mixture pattern formed by Piston B, the differences
in CA50, IMEP and PRRmax between different SOI timings become less with the
retarded spark timings. With the direct injection ratio increasing from 16% to 35%,
the CA50 gradually advances with the earlier spark timings before 680 ºCA but delays
with the later spark timings after 680 ºCA. For the largest direct injection ratio of
50%, the CA50 is significantly delayed with both early and late spark timings.
5. It can be inferred from this study that both the early flame propagation and auto-
ignition process in SFI hybrid combustion can be controlled by the fuel stratification.
The reduction of the PRRmax caused by the stratified mixture enables the advance of
spark timing to achieve maximum IMEP. However, the performance of the
stoichiometric SFI hybrid combustion is critical to the degree of the fuel stratification
because the over-rich mixture in the central region and over-lean mixture at the
peripheral region would deteriorate the flame propagation and auto-ignition
respectively.
Funding
The study is a part of the State Key Project of Fundamental Research Plan (Grant
2013CB228403) supported by the Ministry of Science and Technology of China.
Nomenclature
SFI stratified flame ignition
PRRmax maximum pressure rise rate
PFI port fuel injection
DI direct injection
SOI start of direct injection
rDI direct injection ratios
CFD computational fluid dynamics
38
623
624
625
626
627
628
629
630
631
632
633
634
635
636
637
638
639
640
641
642
643
644
645
646
647
7576
IMEP indicated mean effective pressure
ST spark timing
CA50 crank angle of 50% total heat release
CAI controlled auto-ignition
SI spark ignition
SACI spark assisted compression ignition
CCV cycle-to-cycle variation
PVO positive valve overlapping
HCCI homogenous charge compression ignition
ASSCI assisted spark stratified compression ignition
PLIF planar laser-induced fluorescence
RANS reynolds-averaged Navier Stokes
PISO pressure-implicit with splitting of operators
4VVAS 4-variable valve actuation system
eEGR external exhaust gas recirculation
iEGR internal exhaust gas recirculation
NVO negative valve overlapping
fuel/air equivalence ratio
rSI fuel mass fraction consumed by flame propagation in a certain cell
TKE turbulence kinetic energy
Vm flow velocity magnitudes
CAT crank angle corresponding to the mode transition
RCAT ratio of the accumulated heat released at CAT
D1 flame propagation dominated combustion duration (CA10-CAT)
D2 auto-ignition dominated combustion duration (CAT-CA90)
39
648
649
650
651
652
653
654
655
656
657
658
659
660
661
662
663
664
665
666
667
668
669
670
671
672
7778

D0 overall combustion duration (CA10-CA90)
xb burned fuel mass fraction at 740 ºCA in a certain cell
Reference
[1] Zhao H, HCCI and CAI engines for the automotive industry. Woodhead Publishing: 2007.
[2] Alkidas A C, Combustion advancements in gasoline engines. Energy Conversion and
Management 2007; 48: 2751–2761.
[3] Zhang Y, Xie H, Zhao H. Investigation of SI-HCCI Hybrid Combustion and Control
Strategies for Combustion Mode Switching in a Four-Stroke Gasoline Engine. Combust. Sci.
and Tech 2009; 181: 782–799.
[4] Xie H, Yang L, Qin J, Gao R, Zhu H, He B, Zhao H. The Effect of Spark Ignition on the
CAI Combustion Operation. SAE Technical Paper 2005-01-3738.
[5] Wang Z, Wang J, Shuai S, Ma Q. Effects of Spark Ignition and Stratified Charge on
Gasoline HCCI Combustion With Direct Injection. SAE Technical Paper 2005-01-0137.
[6] Wang Z, He X, Wang J, Shuai S, Xu F, Yang D. Combustion visualization and
experimental study on spark induced compression ignition (SICI) in gasoline HCCI engines.
Energy Conversion and Management 2010; 51: 908-917.
[7] Milovanovic N, Blundell D, Gedge S, Turner J. SI-HCCI-SI Mode Transition at Different
Engine Operating Conditions. SAE Technical Paper 2005-01-0156.
[8] Santoso H, Matthews J, Cheng W K. Managing SI/HCCI Dual-Mode Engine Operation.
SAE Technical Paper 2005-01-0162.
[9] Chen T, Xie H, Le Li, Yu W, Li Z, Zhao H. Continuous Load Adjustment Strategy of a
Gasoline HCCI-SI Engine Fully Controlled by Exhaust Gas. SAE Technical Paper 2011-01-
1408.
[10] Manofsky L, Vavra J, Assanis D, Babajimopoulos A. Bridging the Gap between HCCI
and SI: Spark- Assisted Compression Ignition. SAE Technical Paper 2011-01-1179.
40
673
674
675
676
677
678
679
680
681
682
683
684
685
686
687
688
689
690
691
692
693
694
695
696
697
7980

[11] Olesky L M, Martz J B, Lavoie G A, Vavra J, Assanis D N, Babajimopoulos A. The
effects of spark timing, unburned gas temperature, and negative valve overlap on the rates of
stoichiometric spark assisted compression ignition combustion. Applied Energy 2013;
105(0): 407-417.
[12] Urushihara T, Yamaguchi K, Yoshizawa K, Itoh T. A Study of a Gasoline-fueled
Compression Ignition Engine ~ Expansion of HCCI Operation Range Using SI Combustion
as a Trigger of Compression Ignition. SAE Technical Paper 2005-01-0180.
[13] Wang X, Xie H, Li L, Xie L, Chen T, Zhao H. Effect of the Thermal Stratification on SI-
CAI Hybrid Combustion in a Gasoline Engine. Applied Thermal Engineering 2013; 61(2):
451–460.
[14] Wang X, Xie H, Zhao H. Computational Study of the Influence of In-cylinder Flow on
SI-CAI Hybrid Combustion in a Gasoline Engine. International Journal of Engine Research
2014; Accepted.
[15] Xie H, Le Li, Chen T, Yu W, Wang X, Zhao H. Study on spark assisted compression
ignition (SACI) combustion with positive valve overlap at medium–high load. Applied
Energy 2013; 101: 622–633.
[16] Szybist J P, Nafziger E, Weall A. Load Expansion of Stoichiometric HCCI Using Spark
Assist and Hydraulic Valve Actuation. SAE Technical Paper 2010-01-2172.
[17] Yun H, Wermuth N, Najt P. Extending the High Load Operating Limit of a Naturally-
Aspirated Gasoline HCCI Combustion Engine. SAE Technical Paper 2010-01-0847.
[18] Aroonsrisopon T, Werner P, Waldman J O, Sohm V, Foster D E, Morikawa T, Iida M.
Expanding the HCCI Operation With the Charge Stratification. SAE Technical Paper 2004-
01-1756.
41
698
699
700
701
702
703
704
705
706
707
708
709
710
711
712
713
714
715
716
717
718
719
720
8182
[19] Choi S, Lim J, Ki M, Min K, Choi H. Analysis of Cyclic Variation and the Effect of Fuel
Stratification on Combustion Stabilityin a Port Fuel Injection (PFI) CAI Engine. SAE
Technical Paper 2009-01-0670.
[20] Dahl D, Andersson M, Berntsson A, Denbratt I, Koopmans L. Reducing Pressure
Fluctuations at High Loads by Means of Charge Stratification in HCCI Combustion with
Negative Valve Overlap. SAE Technical Paper 2009-01-1785.
[21] Dec J E, Yang Y, Dronniou N. Boosted HCCI - Controlling Pressure-Rise Rates for
Performance Improvements using Partial Fuel Stratification with Conventional Gasoline.
SAE Technical Paper 2011-01-0897.
[22] Yang D, Wang Z, Wang J, Shuai S. Experimental study of fuel stratification for HCCI
high load extension. Applied Energy 2011; 88(9): 2949 - 2954.
[23] Yang Y, Dec J E, Dronniou N, Berg M S. Tailoring HCCI heat-release rates with partial
fuel stratification: Comparison of two-stage and single-stage-ignition fuels. Proceedings of
the Combustion Institute 2011; 33(2): 3047–3055.
[24] Yoshizawa K, Teraji A, Miyakubo H, Yamaguchi K, Urushihara T. Study of High Load
Operation Limit Expansion for Gasoline Compression Ignition Engines. Journal of
Engineering for Gas Turbines and Power 2006; 128(2): 377-387.
[25] Li D, Wang Z, Liu H, Wang J. Combustion Mode Switch by Integrating Stoichiometric
ASSCI Mode in a Four-cylinder Gasoline SI/HCCI Engine. SAE Technical Paper 2014-01-
1288.
[26] Persson H, Sjöholm J, Kristensson E, Johansson B, Richter M, Aldén M. Study of Fuel
Stratification on Spark Assisted Compression Ignition (SACI) Combustion with Ethanol
Using High Speed Fuel PLIF. SAE Technical Paper 2008-01-2401.
[27] Berntsson A W, Denbratt I. Optical study of HCCI Combustion using NVO and an SI
Stratified Charge. SAE Technical Paper 2007-24-0012.
42
721
722
723
724
725
726
727
728
729
730
731
732
733
734
735
736
737
738
739
740
741
742
743
744
745
8384
[28] Wu X, Daniel R, Tian G, Xu H, Huang Z, Richardson D. Dual-injection: The flexible,
bi-fuel concept for spark-ignition engines fuelled with various gasoline and biofuel blends.
Applied Energy 2011; 88(7): 2305 - 2314.
[29] Joh M, Huh K Y, Noh S H, Choi K H. Numerical Prediction of Stratified Charge
Distribution in a Gasoline Direct-Injection Engine - Parametric Studies. SAE Technical Paper
1999-01-0178.
[30] Lippert A M, Tahry S H E, Huebler M S, Parrish S E, Inoue H, Noyori T, Nakama K,
Abe T. Development and Optimization of a Small-Displacement Spark-Ignition Direct-
Injection Engine – Stratified Operation. SAE Technical Paper 2004-01-0033.
[31] Ikoma T, Abe S, Sonoda Y, Suzuki H, Suzuki Y, Basaki M. Development of V-6 3.5-
liter Engine Adopting New Direct Injection System. SAE Technical Paper 2006-01-1259.
[32] Xu Z, Yi J, Curtis E, Wooldridge S. Applications of CFD Modeling in GDI Engine
Piston Optimization. SAE Technical Paper 2009-01-1936.
[33] Yi J, Wooldridge S, Coulson G, Hilditch J, Iyer C O, Moilanen P, Papaioannou G,
Reiche D, Shelby M, VanDerWege B, Weaver C, Xu Z, Davis G, Hinds B, Schamel A.
Development and Optimization of the Ford 3.5L V6 EcoBoost Combustion System. SAE
Technical Paper 2009-01-1494.
[34] Iyer C O, Han Z, Yi J. CFD Modeling of a Vortex Induced Stratification Combustion
(VISC) System. SAE Technical Paper 2004-01-0550.
[35] Oh H, Bae C. Effects of the injection timing on spray and combustion characteristics in a
spray-guided DISI engine under lean-stratified operation. Fuel 2013; 107(0): 225 - 235.
[36] Costa M, Sorge U, Allocca L. Increasing energy efficiency of a gasoline direct injection
engine through optimal synchronization of single or double injection strategies. Energy
Conversion and Management 2012; 60(0): 77 - 86.
43
746
747
748
749
750
751
752
753
754
755
756
757
758
759
760
761
762
763
764
765
766
767
768
769
8586

[37] Wang X, Zhao H, Xie H, He B. Numerical Study of the Effect of Piston Shapes and Fuel
Injection Strategies on In-cylinder Conditions in a PFI/GDI Gasoline Engine. SAE Int. J.
Engines 2014; 7(4).
[38] Jones W P, Prediction methods for turbulent flames. In Prediction Methods for
Turbulent Flow, Kollmann W, Ed Hemisphere: Washington, D.C., 1980; 1-45.
[39] Angelberger C, Poinsot T, Delhay B. Improving Near-Wall Combustion and Wall Heat
Transfer Modeling in SI Engine Computations. SAE Technical Paper 972881.
[40] Stach T, Schlerfer J, Vorbach M. New Generation Multi-hole Fuel Injector for Direct-
Injection SI Engines - Optimization of Spray Characteristics by Means of Adapted Injector
Layout and Multiple Injection. SAE Technical Paper 2007-01-1404.
[41] Gosman A D, Marooney C J. Development and validation of a computer code for Diesel
combustion. IDEA Project, Subprogram E1, October, 1991.
[42] Reitz R D, Diwakar R. Effect of Drop Breakup on Fuel Sprays. SAE Technical Paper
860469.
[43] Cd-adapco. Methodology, STAR-CD VERSION 4.14.
[44] Bai C, Gosman A D. Development of Methodology for Spray Impingement Simulation.
SAE Technical Paper 950283.
[45] Colin O, Benkenida A. The 3-Zones Extended Coherent Flame Model (ECFM3Z) for
Computing Premixed/Diffusion Combustion. Oil & Gas Science and Technology 2004;
59(6): 593-609.
[46] CRUZ A P D. Three-dimensional modeling of self-ignition in HCCI and conventional
diesel engines. Combustion Science and Technology 2004; 176(5-6): 867-887.
[47] Mehl M, Chen J Y, Pitz W J, Sarathy S M, Westbrook C K. An approach for formulating
surrogates for gasoline with application towards a reduced surrogate mechanism for CFD
engine modeling. Energy & Fuels 2011; 25(11): 5215-5223.
44
770
771
772
773
774
775
776
777
778
779
780
781
782
783
784
785
786
787
788
789
790
791
792
793
794
8788

[48] Wang X, Xie H, Xie L, Zhang L, Le Li, Chen T, Zhao H. Numerical simulation and
validation of SI-CAI hybrid combustion in a CAI/HCCI gasoline engine. Combustion Theory
and Modelling 2013; 17(1): 142-166.
[49] Xie H, Hou S, Qin J, Zhang Y, Li N, Zhao H. Control Strategies for Steady and
Transient Operation of a 4-Stroke Gasoline Engine with CAI Combustion Using a 4-Variable
Valve Actuating System (4VVAS). SAE Technical Paper 2006-01-1083.
[50] Bradley D, Hicks R A, Lawes M, Sheppard C G W, Woolley R. The Measurement of
Laminar Burning Velocities and Markstein Numbers for Iso-octane–Air and Iso-octane–n-
Heptane–Air Mixtures at Elevated Temperatures and Pressures in an Explosion Bomb.
Combustion and Flame 1998; 115(1–2): 126 - 144.
45
795
796
797
798
799
800
801
802
803
804
8990

Table captions:
Table 1 Engine specifications.
Table 2 Operation conditions.
Table 3 Computational conditions.
Figure captions:
Fig. 1. Schematic diagram of (a) CAI combustion and (b) SI-CAI hybrid combustion.
Fig. 2. Schematic diagram of spray modelling.
Fig. 3. Newly designed bowl pistons.
Fig. 4. Engine mesh with Piston A.
Fig. 5. The in-cylinder pressure and heat release rate of the baseline case from experiment
and simulation.
Fig. 6. Effect of spark timings and piston shapes on CA50, IMEP and PRRmax.
Fig. 7. In-cylinder pressure traces for different pistons with the fixed CA50 (727.5 ºCA).
Fig. 8. Comparison of the IMEP and PRRmax for different pistons with the fixed CA50 (727.5
ºCA).
Fig. 9. Section views of the equivalence ratio and temperature distributions at 680 ºCA for
Flat Piston and Piston B with the fixed CA50 (727.5 ºCA).
Fig. 10. Schematic of the zones defined to reveal the spatially resolved in-cylinder conditions.
Fig. 11. The average equivalence ratio and temperature of the mixture in the whole chamber,
Zone 1 and Spark Zone at 680 ºCA for different pistons with the fixed CA50 (727.5 ºCA).
Fig. 12. The location of the auto-ignited cells with the lowest and highest equivalence ratio
for Flat Piston and Piston B with the fixed CA50 (727.5 ºCA).
Fig. 13. The distribution of rSI of the cells with (a) highest and (b) lowest equivalence ratio
for Flat Piston and Piston B with the fixed CA50 (727.5 ºCA).
46
805
806
807
808
809
810
811
812
813
814
815
816
817
818
819
820
821
822
823
824
825
826
827
828
829
9192
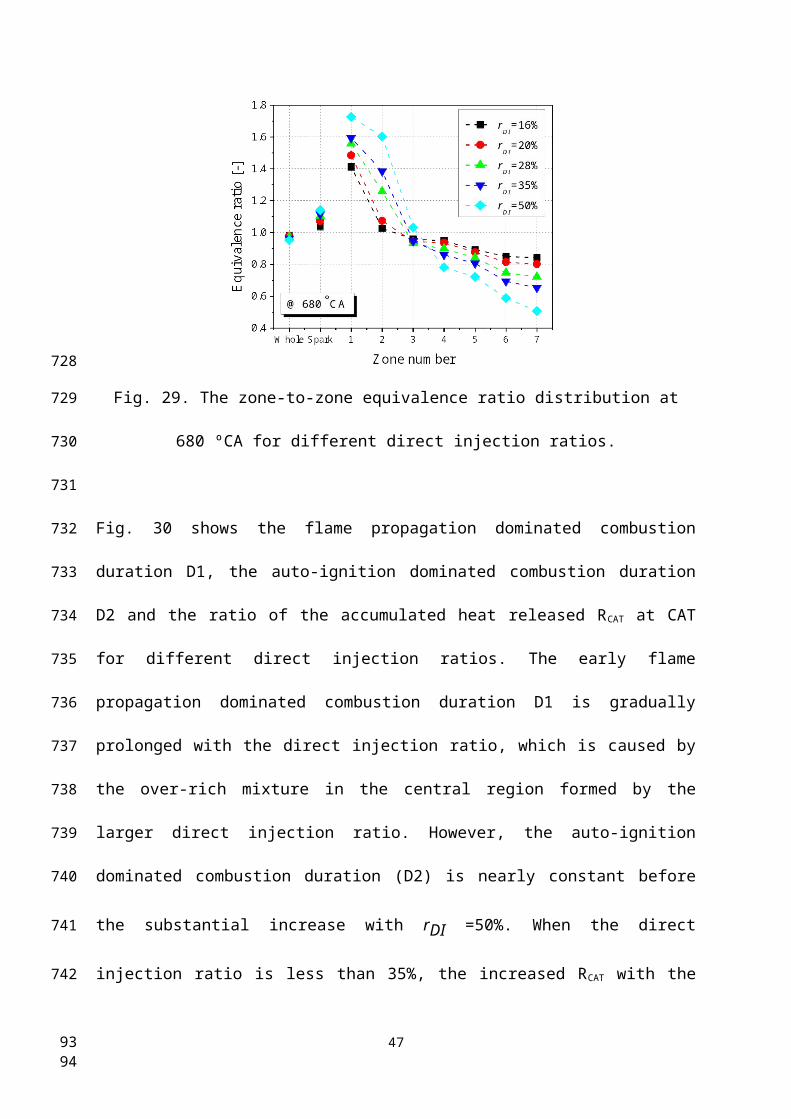
Fig. 14. Effect of spark timings and SOI timings on CA50, IMEP and PRRmax.
Fig. 15. The in-cylinder pressure traces for different SOI timings with the fixed CA50 (727.5
ºCA).
Fig. 16. Comparison of the IMEP and PRRmax for different SOI timings with the fixed CA50
(727.5 ºCA).
Fig. 17. Section views of the equivalence ratio at 676 ºCA for different SOI timings with the
fixed CA50 (727.5 ºCA).
Fig. 18. The average equivalence ratio and temperature of the mixture in the whole chamber
and Spark Zone at 676 ºCA for different SOI timings with the fixed CA50 (727.5 ºCA).
Fig. 19. The average TKE and Vm in the whole chamber and Spark Zone at 676 ºCA for
different SOI timings with the fixed CA50 (727.5 ºCA).
Fig. 20. The mode transition crank angle (CAT) and the ratio of the accumulated heat
released (RCAT) at CAT for different SOI timings.
Fig. 21. The location of 2% of the firstly auto-ignited cells with SOI timing of 600 ºCA and
660 ºCA.
Fig. 22. The distribution of the equivalence ratio and temperature of 2% of the firstly auto-
ignited cells at 676 ºCA and the crank angle just before CAT with SOI timing of 600 ºCA and
660 ºCA.
Fig. 23. The flame propagation dominated combustion duration D1, the auto-ignition
dominated combustion duration D2 and the overall combustion duration D0 for different SOI
timings.
Fig. 24. The inhomogeneity of equivalence ratio and temperature at 676 ºCA for different
SOI timings.
Fig. 25. Effect of spark timings and direct injection ratios on CA50, IMEP and PRRmax.
47
830
831
832
833
834
835
836
837
838
839
840
841
842
843
844
845
846
847
848
849
850
851
852
853
9394

Fig. 26. The in-cylinder pressure traces for different direct injection ratios with the fixed
CA50 (727.5 ºCA).
Fig. 27. Comparison of the IMEP and PRRmax for different direct injection ratios with the
fixed CA50 (727.5 ºCA).
Fig. 28. The section views of the equivalence ratio distribution at 680 ºCA for different direct
injection ratios.
Fig. 29. The zone-to-zone equivalence ratio distribution at 680 ºCA for different direct
injection ratios.
Fig. 30. The flame propagation dominated combustion duration (D1), the auto-ignition
dominated combustion duration (D2) and the ratio of the accumulated heat released (RCAT) at
CAT for different direct injection ratios.
Fig. 31. The average temperature profiles of the mixture in the whole chamber, Spark Zone
and Zone 7 for different direct injection ratios.
Fig. 32. The distribution of the equivalence ratio and temperature of all cells and
incompletely burned cells with xb<0.8 at 680 ºCA with rDI=16% and 50%.
Fig. 33. The locations of the incompletely burned cells with xb<0.8 at 740 ºCA with rDI=16%
and 50%.
48
854
855
856
857
858
859
860
861
862
863
864
865
866
867
868
869
870
9596