bunge reports first quarter 2018 results · 3 butter prices. in north america, improved results...
TRANSCRIPT

Bunge Reports First Quarter 2018 Results
White Plains, NY - May 2, 2018 - Bunge Limited (NYSE:BG)
• Q1 GAAP EPS of $(0.20); $(0.06) on an adjusted basis that includes $120 million of negative mark-to-market on forward oilseed crushing contracts
• Higher Food & Ingredients results driven by lower costs and stronger demand
• Loders Croklaan integration progressing as expected
• Global Competitiveness Program on track to generate $100 million of savings in 2018
• Increasing midpoint of total 2018 full-year EBIT outlook by $295 million
Financial Highlights
Quarter Ended
March 31,
US$ in millions, except per share data 2018 2017
Net income (loss) attributable to Bunge $ (21 ) $ 47
Net income (loss) per common share from continuing operations-diluted $ (0.20 ) $ 0.31
Net income (loss) per common share from continuing operations-diluted, adjusted (a) $ (0.06 ) $ 0.35
Total Segment EBIT (a) $ 61 $ 133
Certain gains & (charges) (b) (24 ) (6 )
Total Segment EBIT, adjusted (a) $ 85 $ 139
Agribusiness (c) $ 52 $ 109
Oilseeds $ (34 ) $ 92
Grains $ 86 $ 17
Food & Ingredients (d) $ 54 $ 45
Sugar & Bioenergy $ (20 ) $ (11 )
Fertilizer $ (1 ) $ (4 )
(a) Total Segment earnings before interest and tax ("Total Segment EBIT"); Total Segment EBIT, adjusted; net income (loss) per common share
from continuing operations-diluted, adjusted; adjusted funds from operations and ROIC are non-GAAP financial measures. Reconciliations to
the most directly comparable U.S. GAAP measures are included in the tables attached to this press release and the accompanying slide
presentation posted on Bunge's website.
(b) Certain gains & (charges) included in Total Segment EBIT. See Additional Financial Information for detail.
(c) See footnote 10 of Additional Financial Information for a description of the Oilseeds and Grains businesses in Bunge's Agribusiness
segment.
(d) Includes Edible Oil Products and Milling Products segments.

2
Overview
Soren Schroder, Bunge's Chief Executive Officer, commented, "During the first quarter, we saw a
dramatic change in the global soy crush market environment as margins expanded significantly from
2017 levels. Our teams managed the rapidly changing environment well and positioned the company for
a strong performance for the balance of the year. In times like these, when trade flows and capacities
shift among regions, the value of our global footprint and capabilities are demonstrated. In Food &
Ingredients, results were better than expected with improvement in most regions. Looking ahead, we
expect significant growth in Company earnings and returns in 2018.
Schroder continued, “We closed on Loders Croklaan during the quarter, which now positions us as a
global leader in B2B oils, and when fully integrated will nearly double the size of our Edible Oils business.
We also strengthened our milling footprint in the U.S. with the acquisition of two corn masa mills. These
investments increase results from value added activities closer towards our targeted level of 35 percent.
In addition, we continue to progress towards the separation of our Brazilian sugarcane milling business.
We have recently secured debt financing for the business and are now in a position where the business
could operate on a stand-alone basis.
“We also made solid progress on our cost objectives. Our Global Competitiveness Program is on track
towards our target of $100 million this year. And, over the course of the year, we expect an additional $80
million of savings from industrial and supply chain initiatives."
First Quarter Results
Agribusiness
The agribusiness environment improved dramatically from conditions seen last year with reduced
soybean supplies in Argentina and tightening global grain supplies, leading to increased volatility and
improved margins, especially in soy crushing.
In Grains, higher results were driven by global trading & distribution, which benefitted from increased
margins and effective risk management. Origination results were comparable to last year as improved
performance in Brazil, which benefitted from increased farmer commercialization as local soy prices rose,
offset lower results in North America and Argentina.
In Oilseeds, global soy crush margins significantly improved over the course of the quarter driven by the
combination of strong underlying soymeal demand and crushing capacity constraints caused by reduced
soybean production in Argentina. The increase in forward margins resulted in negative mark-to-market of
$120 million related to forward oilseed crushing contracts. As we execute on these contracts during the
balance of the year, we expect this impact will be offset by higher margins, which is embedded in our
revised outlook.
Edible Oil Products
Results were higher in all regions with the exception of South America. In Europe, improved performance
was driven by higher volumes and margins, reflecting increased value-added sales from recent
acquisitions, as well as increased demand for margarine which benefitted from the rise in European
3
butter prices. In North America, improved results reflected higher margins and lower costs, where the
business is seeing the positive effects of cost improvement and restructuring initiatives. In Asia, results
were higher in both India and China. In Brazil, however, lower costs were more than offset by lower
margins as abundant oil supplies from the strong soy crushing environment pressured retail prices.
Milling Products
Higher results in North America were the primary driver of improved performance in the quarter. In
Mexico, results benefitted from double digit volume growth, which was supported by a new sales force
structure, and lower costs. Improved results in the U.S. were due to higher margins. Results in Brazil
were slightly higher than last year, as higher volume and lower costs more than offset lower margins. We
are starting to see signs of improvement as the Brazilian market transitions to a significantly smaller
wheat crop this year.
Sugar & Bioenergy
The first quarter is the inter-harvest period in Brazil when sugarcane mills in the Center-South region
typically do not operate for most of the quarter and are selling sugar and ethanol inventories from the
previous sugarcane harvest.
Results were lower than last year as higher average ethanol prices were more than offset by lower sugar
prices and volumes. Volumes were negatively impacted by carrying over a low inventory balance from
2017 into the intercrop period. Trading & distribution results in the quarter were higher than last year.
In addition to progressing towards the separation of our sugarcane milling business, we recently signed a
share purchase agreement to sell our interest in our renewable oils joint venture to our partner, and are in
the process of exiting our global sugar trading operation.
Fertilizer
Improved results in the quarter were primarily driven by higher margins and lower costs, reflecting in part
the restructuring of our Argentine nitrogen fertilizer plant.
Global Competitiveness Program
The Global Competitiveness Program announced in July 2017 is expected to rationalize Bunge’s cost
structure and reengineer the way we operate, reducing our 2017 addressable baseline SG&A of $1.35
billion to $1.1 billion by 2020.
We reduced SG&A by $40 million in 2017 and expect to reduce it by an additional $60 million this year,
totaling a $100 million reduction in 2018 as compared to the 2017 baseline. We have incurred a total of
$69 million of program-related costs since inception, including $14 million this quarter.
Cash Flow
Cash used by operations in the quarter ended March 31, 2018 was approximately $1.5 billion compared
to cash used of $603 million in the same period last year. The year-over-year variance is primarily due to

4
changes in inventory, reflecting the improved agribusiness environment. Trailing four-quarter adjusted
funds from operations was $811 million as of the quarter ended March 31, 2018.
Income Taxes
Income taxes for the quarter ended March 31, 2018 were $19 million.
Outlook
We expect 2018 to be a year of strong earnings growth, particularly in Agribusiness.
In Agribusiness, we are increasing our full-year EBIT outlook range to $800 million to $1.0 billion,
primarily based on improved soy crush margins.
In Food & Ingredients, we are increasing our full-year EBIT outlook range to $290 to $310 million to
account for the addition of our 70 percent ownership stake in Loders Croklaan, which we acquired in
early March. Segment results are expected to improve sequentially.
In Sugar & Bioenergy, based on current sugar prices, we are reducing our full-year EBIT outlook range to
$40 to $60 million. Results are expected to be seasonally weak until the second half of the year.
In Fertilizer, we continue to expect EBIT of approximately $25 million.
Savings from the Global Competitiveness Program and industrial and supply chain initiatives are
reflected in our segment EBIT ranges.
Additionally, we expect the following for 2018, which incorporates Loders Croklaan: a tax rate range of
18% to 22%; net interest expense in the range of $255 to $275 million; capital expenditures of
approximately $700 million, of which approximately $150 million is related to sugarcane milling; and
depreciation, depletion and amortization of approximately $690 million.
Conference Call and Webcast Details
Bunge Limited’s management will host a conference call at 8:00 a.m. EDT on Wednesday, May 2, 2018 to
discuss the company’s results.
Additionally, a slide presentation to accompany the discussion of results will be posted on www.bunge.com.
To listen to the call, please dial (877) 883-0383. If you are located outside the United States or Canada,
dial (412) 902-6506. Please dial in five to 10 minutes before the scheduled start time and ask to join the
Bunge Limited call. The call will also be webcast live at www.bunge.com.
To access the webcast, go to “Webcasts and presentations” in the “Investors” section of the company’s
website. Select “Q1 2018 Bunge Limited Conference Call” and follow the prompts. Please go to the
website at least 15 minutes prior to the call to register and download any necessary audio software.
A replay of the call will be available later in the day on May 2, 2018, continuing through June 2, 2018. To
listen to it, please dial (877) 344-7529 in the United States, (855) 669-9658 in Canada, or (412) 317-0088

5
in other locations. When prompted, enter confirmation code 10119049. A replay will also be available in
“Past events” at “Webcasts and presentations” in the “Investors” section of the company’s website.
Website Information
We routinely post important information for investors on our website, www.bunge.com, in the "Investors"
section. We may use this website as a means of disclosing material, non-public information and for
complying with our disclosure obligations under Regulation FD. Accordingly, investors should monitor the
Investors section of our website, in addition to following our press releases, SEC filings, public
conference calls, presentations and webcasts. The information contained on, or that may be accessed
through, our website is not incorporated by reference into, and is not a part of, this document.
About Bunge Limited
Bunge Limited (www.bunge.com, NYSE: BG) is a leading global agribusiness and food company
operating in over 40 countries with approximately 32,000 employees. Bunge buys, sells, stores and
transports oilseeds and grains to serve customers worldwide; processes oilseeds to make protein meal
for animal feed; produces edible oil products for consumers and commercial customers in the food
processing, industrial and artisanal bakery, confectionery, human nutrition and food service categories;
produces sugar and ethanol from sugarcane; mills wheat, corn and rice to make ingredients used by food
companies; and sells fertilizer in South America. Founded in 1818, the company is headquartered in
White Plains, New York.

6
Cautionary Statement Concerning Forward-Looking Statements
This press release contains both historical and forward-looking statements. All statements, other than
statements of historical fact are, or may be deemed to be, forward-looking statements within the meaning
of Section 27A of the Securities Act of 1933, as amended, and Section 21E of the Securities Exchange Act
of 1934, as amended. These statements include our expectations regarding industry trends and our future
financial performance, the completion and timing of acquisitions and dispositions, our assumptions and
expectations for the Global Competitiveness Program and other efficiency initiatives and similar statements
that are not historical facts. These forward-looking statements reflect our current expectations and
projections about our future results, performance, prospects and opportunities. We have tried to identify
these forward-looking statements by using words including "may," "will," "should," "could," "expect,"
"anticipate," "believe," "plan," "intend," "estimate," "continue" and similar expressions. These forward-
looking statements are subject to a number of risks, uncertainties and other factors that could cause our
actual results, performance, prospects or opportunities to differ materially from those expressed in, or
implied by, these forward-looking statements. The following important factors, among others, could affect
our business and financial performance: industry conditions, including fluctuations in supply, demand and
prices for agricultural commodities and other raw materials and products used in our business; fluctuations
in energy and freight costs and competitive developments in our industries; the effects of weather
conditions and the outbreak of crop and animal disease on our business; global and regional agricultural,
economic, financial and commodities market, political, social and health conditions; the outcome of pending
regulatory and legal proceedings; our ability to complete, integrate and benefit from acquisitions,
dispositions, joint ventures and strategic alliances; our ability to achieve the efficiencies, savings and other
benefits anticipated from our cost reduction, margin improvement and other business optimization
initiatives; changes in government policies, laws and regulations affecting our business, including
agricultural and trade policies, tax regulations and biofuels legislation; and other factors affecting our
business generally. The forward-looking statements included in this release are made only as of the date
of this release, and except as otherwise required by federal securities law, we do not have any obligation
to publicly update or revise any forward-looking statements to reflect subsequent events or circumstances.
Investor Contact: Mark Haden
Bunge Limited 914-684-3398
Media Contact: Susan Burns
Bunge Limited 914-684-3246

7
Additional Financial Information
The following table provides a summary of certain gains and charges that may be of interest to investors, including a
description of these items and their effect on net income (loss) attributable to Bunge, earnings per share diluted and
total segment EBIT for the quarters ended March 31, 2018 and 2017.
(US$ in millions, except per share data)
Net Income (Loss) Attributable to
Bunge
Earnings Per Share
Diluted Total Segment
EBIT (6)
Quarter Ended March 31, 2018 2017 2018 2017 2018 2017
Agribusiness: (1) $ (8 ) $ — $ (0.05 ) $ — $ (10 ) $ —
Severance, employee benefit, and other costs (9 ) — (0.06 ) — (11 ) —
Gain on disposition of subsidiaries 1 — 0.01 — 1 —
Edible Oil Products: (2) $ (5 ) $ — $ (0.04 ) $ — $ (7 ) $ —
Severance, employee benefit, and other costs (2 ) — (0.01 ) — (2 ) —
Acquisition and integration costs (3 ) — (0.03 ) — (5 ) —
Milling Products: (3) $ (1 ) $ — $ (0.01 ) $ — $ (2 ) $ —
Severance, employee benefit, and other costs (1 ) — (0.01 ) — (2 ) —
Sugar & Bioenergy: (4) $ (4 ) $ (6 ) $ (0.03 ) $ (0.04 ) $ (4 ) $ (6 )
Severance, employee benefit, and other costs (1 ) — (0.01 ) — (1 ) —
Sugar restructuring charges (3 ) (6 ) (0.02 ) (0.04 ) (3 ) (6 )
Fertilizer: (5) $ (1 ) $ — $ (0.01 ) $ — $ (1 ) $ —
Severance, employee benefit, and other costs (1 ) — (0.01 ) — (1 ) —
Total $ (19 ) $ (6 ) $ (0.14 ) $ (0.04 ) $ (24 ) $ (6 )
8
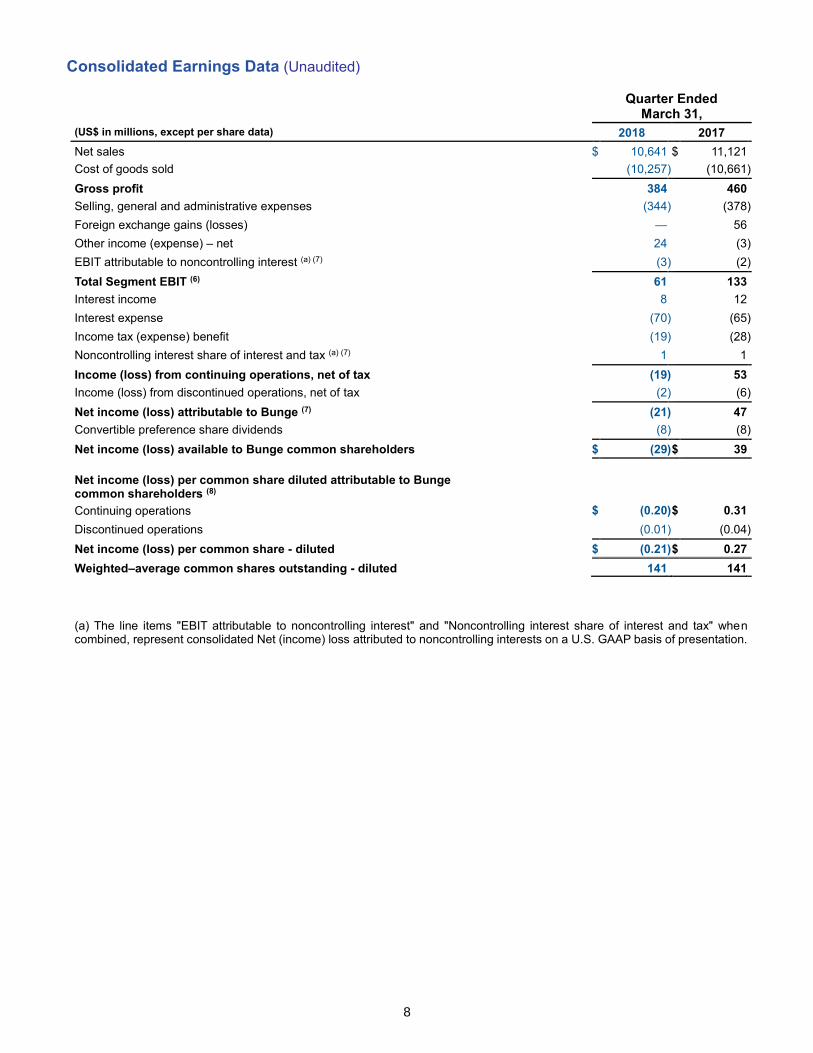
Consolidated Earnings Data (Unaudited)
Quarter Ended
March 31,
(US$ in millions, except per share data) 2018 2017
Net sales $ 10,641 $ 11,121
Cost of goods sold (10,257 ) (10,661 )
Gross profit 384 460
Selling, general and administrative expenses (344 ) (378 )
Foreign exchange gains (losses) — 56
Other income (expense) – net 24 (3 )
EBIT attributable to noncontrolling interest (a) (7) (3 ) (2 )
Total Segment EBIT (6) 61 133
Interest income 8 12
Interest expense (70 ) (65 )
Income tax (expense) benefit (19 ) (28 )
Noncontrolling interest share of interest and tax (a) (7) 1 1
Income (loss) from continuing operations, net of tax (19 ) 53
Income (loss) from discontinued operations, net of tax (2 ) (6 )
Net income (loss) attributable to Bunge (7) (21 ) 47
Convertible preference share dividends (8 ) (8 )
Net income (loss) available to Bunge common shareholders $ (29 ) $ 39
Net income (loss) per common share diluted attributable to Bunge common shareholders (8)
Continuing operations $ (0.20 ) $ 0.31
Discontinued operations (0.01 ) (0.04 )
Net income (loss) per common share - diluted $ (0.21 ) $ 0.27
Weighted–average common shares outstanding - diluted 141 141
(a) The line items "EBIT attributable to noncontrolling interest" and "Noncontrolling interest share of interest and tax" when combined, represent consolidated Net (income) loss attributed to noncontrolling interests on a U.S. GAAP basis of presentation.

9
Consolidated Segment Information (Unaudited)
Set forth below is a summary of certain earnings data and volumes by reportable segment.
Quarter Ended March 31,
(US$ in millions, except volumes) 2018 2017
Volumes (in thousands of metric tons):
Agribusiness 35,805 35,023
Edible Oil Products 2,008 1,789
Milling Products 1,135 1,074
Sugar & Bioenergy 1,447 1,847
Fertilizer 172 162
Net sales:
Agribusiness $ 7,462 $ 7,819
Edible Oil Products 2,149 1,880
Milling Products 409 382
Sugar & Bioenergy 563 988
Fertilizer 58 52
Total $ 10,641 $ 11,121
Gross profit:
Agribusiness $ 203 $ 278
Edible Oil Products 126 123
Milling Products 54 48
Sugar & Bioenergy (4 ) 9
Fertilizer 5 2
Total $ 384 $ 460
Selling, general and administrative expenses:
Agribusiness $ (185 ) $ (221 )
Edible Oil Products (91 ) (86 )
Milling Products (39 ) (37 )
Sugar & Bioenergy (24 ) (29 )
Fertilizer (5 ) (5 )
Total $ (344 ) $ (378 )
Foreign exchange gains (losses):
Agribusiness $ — $ 49
Edible Oil Products (1 ) 3
Milling Products 2 —
Sugar & Bioenergy 1 5
Fertilizer (2 ) (1 )
Total $ — $ 56
Segment EBIT:
Agribusiness $ 42 $ 109
Edible Oil Products 28 36
Milling Products 17 9
Sugar & Bioenergy (24 ) (17 )
Fertilizer (2 ) (4 )
Total Segment EBIT (6) $ 61 $ 133

10
Condensed Consolidated Balance Sheets (Unaudited)
March 31, December 31,
(US$ in millions) 2018 2017
Assets
Cash and cash equivalents $ 287 $ 601
Trade accounts receivable, net 1,686 1,501
Inventories (9) 6,952 5,074
Other current assets 4,451 3,227
Total current assets 13,376 10,403
Property, plant and equipment, net 5,735 5,310
Goodwill and other intangible assets, net 1,601 838
Investments in affiliates 462 461
Time deposits under trade structured finance program 318 315
Other non-current assets 1,592 1,544
Total assets $ 23,084 $ 18,871
Liabilities and Equity
Short-term debt $ 1,293 $ 304
Current portion of long-term debt 14 15
Letter of credit obligations under trade structured finance program 318 315
Trade accounts payable 3,909 3,395
Other current liabilities 3,016 2,186
Total current liabilities 8,550 6,215
Long-term debt 5,446 4,160
Other non-current liabilities 1,341 1,139
Total liabilities 15,337 11,514
Redeemable noncontrolling interest 470 —
Total equity 7,277 7,357
Total liabilities, redeemable noncontrolling interest and equity $ 23,084 $ 18,871

11
Condensed Consolidated Statements of Cash Flows (Unaudited)
Quarter Ended March 31,
(US$ in millions) 2018 2017
Operating Activities
Net income (7) $ (19 ) $ 48
Adjustments to reconcile net income (loss) to cash provided by (used for) operating activities:
Foreign exchange (gain) loss on net debt 33 14
Depreciation, depletion and amortization 142 130
Deferred income tax (benefit) (15 ) (12 )
Other, net 21 36
Changes in operating assets and liabilities, excluding the effects of acquisitions:
Trade accounts receivable 47 27
Inventories (1,466 ) (252 )
Secured advances to suppliers (110 ) 10
Trade accounts payable and accrued liabilities 268 421
Advances on sales (93 ) (57 )
Net unrealized gain (loss) on derivative contracts 435 (259 )
Margin deposits (187 ) (83 )
Marketable securities (153 ) (47 )
Beneficial interest in securitized trade receivables (11) (432 ) (564 )
Other, net (13 ) (15 )
Cash provided by (used for) operating activities (1,542 ) (603 )
Investing Activities
Payments made for capital expenditures (105 ) (182 )
Acquisitions of businesses (net of cash acquired) (968 ) (367 )
Proceeds from investments 336 59
Payments for investments (620 ) (65 )
Proceeds from beneficial interest in securitized trade receivables (11) 431 556
Settlement of net investment hedges 10 —
Payments for investments in affiliates (16 ) (45 )
Other, net (6 ) (7 )
Cash provided by (used for) investing activities (938 ) (51 )
Financing Activities
Net borrowings (repayments) of short-term debt 984 228
Net proceeds (repayments) of long-term debt 1,264 174
Proceeds from the exercise of options for common shares 4 46
Dividends paid (73 ) (67 )
Other, net (5 ) (5 )
Cash provided by (used for) financing activities 2,174 376
Effect of exchange rate changes on cash and cash equivalents, and restricted cash (7 ) 20
Net increase (decrease) in cash and cash equivalents, and restricted cash (313 ) (258 )
Cash and cash equivalents, and restricted cash - beginning of period 605 938
Cash and cash equivalents, and restricted cash - end of period $ 292 $ 680
12
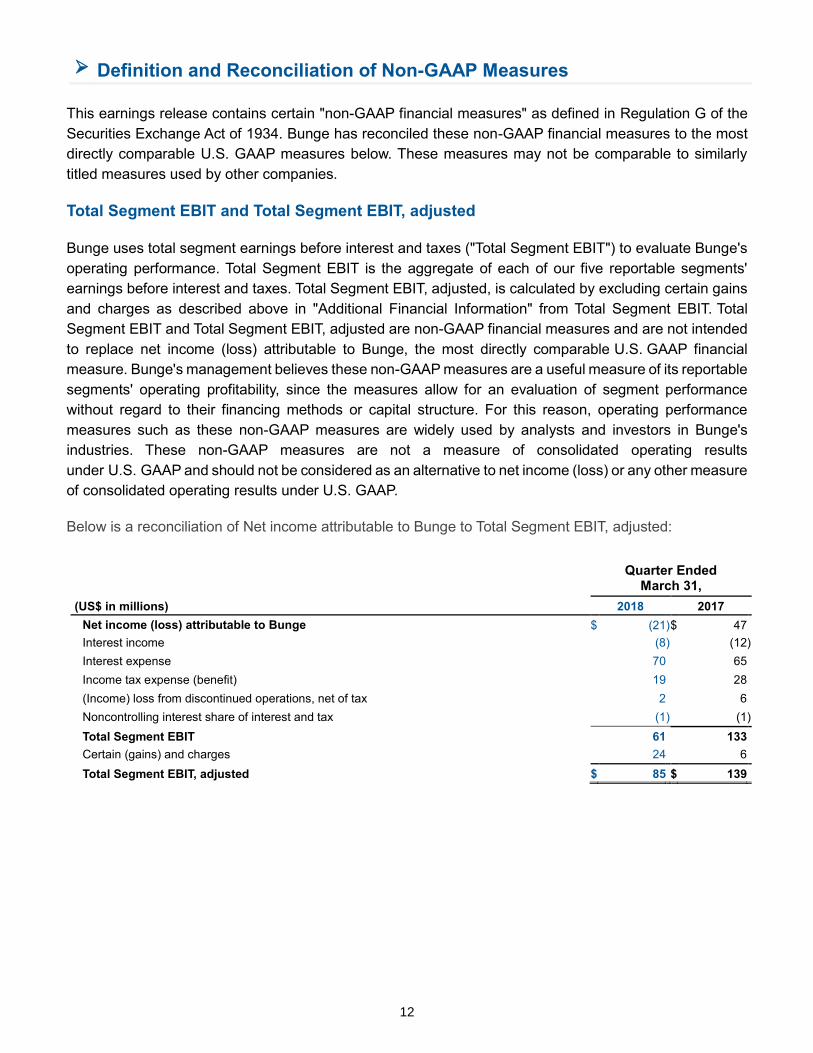
Definition and Reconciliation of Non-GAAP Measures
This earnings release contains certain "non-GAAP financial measures" as defined in Regulation G of the
Securities Exchange Act of 1934. Bunge has reconciled these non-GAAP financial measures to the most
directly comparable U.S. GAAP measures below. These measures may not be comparable to similarly
titled measures used by other companies.
Total Segment EBIT and Total Segment EBIT, adjusted
Bunge uses total segment earnings before interest and taxes ("Total Segment EBIT") to evaluate Bunge's
operating performance. Total Segment EBIT is the aggregate of each of our five reportable segments'
earnings before interest and taxes. Total Segment EBIT, adjusted, is calculated by excluding certain gains
and charges as described above in "Additional Financial Information" from Total Segment EBIT. Total
Segment EBIT and Total Segment EBIT, adjusted are non-GAAP financial measures and are not intended
to replace net income (loss) attributable to Bunge, the most directly comparable U.S. GAAP financial
measure. Bunge's management believes these non-GAAP measures are a useful measure of its reportable
segments' operating profitability, since the measures allow for an evaluation of segment performance
without regard to their financing methods or capital structure. For this reason, operating performance
measures such as these non-GAAP measures are widely used by analysts and investors in Bunge's
industries. These non-GAAP measures are not a measure of consolidated operating results
under U.S. GAAP and should not be considered as an alternative to net income (loss) or any other measure
of consolidated operating results under U.S. GAAP.
Below is a reconciliation of Net income attributable to Bunge to Total Segment EBIT, adjusted:
Quarter Ended
March 31,
(US$ in millions) 2018 2017
Net income (loss) attributable to Bunge $ (21 ) $ 47
Interest income (8 ) (12 )
Interest expense 70 65
Income tax expense (benefit) 19 28
(Income) loss from discontinued operations, net of tax 2 6
Noncontrolling interest share of interest and tax (1 ) (1 )
Total Segment EBIT 61 133
Certain (gains) and charges 24 6
Total Segment EBIT, adjusted $ 85 $ 139

13
Net Income (loss) per common share from continuing operations–diluted, adjusted
Net income (loss) per common share from continuing operations-diluted, adjusted, excludes certain gains
and charges and discontinued operations and is a non-GAAP financial measure. This measure is not a
measure of earnings per common share-diluted, the most directly comparable U.S. GAAP financial
measure. It should not be considered as an alternative to earnings per share-diluted or any other measure
of consolidated operating results under U.S. GAAP. Net income (loss) per common share from continuing
operations-diluted, adjusted is a useful measure of the Company's profitability.
Below is a reconciliation of Net income attributable to Bunge to Net income (loss) - adjusted (excluding
certain gains & charges and discontinued operations).
Quarter Ended March 31,
(US$ in millions, except per share data) 2018 2017
Net Income (loss) attributable to Bunge $ (21 ) $ 47
Adjusted for certain gains and charges:
Severance, employee benefit, and other costs 14 —
Sugar restructuring charges 3 6
Acquisition costs 3 —
Gain on disposition of equity interests/subsidiaries (1 ) —
Adjusted Net Income attributable to Bunge (2 ) 53
Discontinued Operations 2 6
Convertible Preference shares dividends (8 ) (8 )
Net income (loss) - adjusted (excluding certain gains & charges and discontinued operations) $ (8 ) $ 51
Weighted-average common shares outstanding - diluted 141 141
Net income (loss) per common share - diluted, adjusted (excluding certain gains & charges and discontinued operations) $ (0.06 ) $ 0.35
Below is a reconciliation of Net income (loss) per common share from continuing operations - diluted,
adjusted (excluding certain gains & charges and discontinued operations) to Net income (loss) per common
share–diluted:
Quarter Ended March 31,
2018 2017
Continuing operations:
Net income (loss) per common share - diluted adjusted (excluding certain gains & charges and discontinued operations) $ (0.06 ) $ 0.35
Certain gains & charges (see Additional Financial Information section) (0.14 ) (0.04 )
Net income (loss) per common share - continuing operations (0.20 ) 0.31
Discontinued operations: (0.01 ) (0.04 )
Net income (loss) per common share - diluted $ (0.21 ) $ 0.27

14
Severance, Employee Benefit and Other Costs
The following table summarizes the costs incurred as part of the Global Competitiveness Program and
other associated cost reduction and strategic initiatives.
Quarter Ended March 31, 2018
Severance and
Employee Benefit Costs Other Costs Total Costs
Global Competitiveness Program:
Agribusiness $ 4 $ 6 $ 10
Edible Oil Products 1 1 2
Milling Products — 1 1
Sugar & Bioenergy — 1 1
Fertilizer — — —
Costs included in Selling, general and administrative expenses 5 9 14
Other associated cost reduction and strategic initiatives:
Costs included in Cost of goods sold 2 — 2
Total GCP and Other costs $ 7 $ 9 $ 16
2017 baseline total SG&A was $1.45 billion. There was $100 million of SG&A determined not to be
addressable through the GCP, leaving 2017 addressable baseline SG&A of $1.35 billion (“Addressable
Baseline”). The items that are not addressable by the GCP relate to costs other than direct spending and
personnel costs, such as amortization, bad debt charges and recoveries and financing fees and taxes.
GCP savings are determined by comparing Adjusted Actual Addressable SG&A to the Addressable
Baseline. Adjusted Actual Addressable SG&A is equal to the total reported SG&A minus the items not
addressable by the GCP, plus or minus items such as:
• GCP program costs which include severance and related employee costs, consulting and
professional costs and other costs specifically designated to the program,
• Changes in inflation and foreign exchange rates as compared to Addressable Baseline
assumptions,
• Perimeter changes relating to acquisitions and divestitures and corporate transactions,
• Changes in variable compensation relating to business performance as compared to the
Addressable Baseline assumptions, and
• Identified investments in new or enhanced capabilities.
We expect to reduce Actual Addressable SG&A from the Addressable Baseline level of $1.35 billion to
$1.1 billion by 2020, achieving $250 million in run-rate savings by the end of 2019.
As previously announced, the Company has developed a high-level estimate of $200 - $300 million for
the total pre-tax costs expected to be incurred in connection with the Global Competitiveness Program.

15
Notes
(1) Agribusiness:
2018 first quarter EBIT includes charges related to the Company's Global Competitiveness Program of $(10) million
[$(4) million for severance and other employee benefit costs and $(6) million for other program costs], all of which was
included in Selling, general and administrative expenses. 2018 first quarter EBIT also includes $(1) million for
severance and other employee benefits related to other industrial initiatives recorded in Cost of goods sold and a $1
million gain on the sale of a subsidiary.
(2) Edible Oil Products:
2018 first quarter EBIT includes charges related to the Company's Global Competitiveness Program of $(2) million [$(1)
million for severance and other employee benefit costs and $(1) million for other program costs], all of which was
included in Selling, general and administrative expenses. Additionally, $(5) million of acquisition and integration costs
related to the acquisition of IOI Loders Croklaan were incurred, all of which were included within Selling, general and
administrative expenses.
(3) Milling Products:
2018 first quarter EBIT includes charges related to the Company's Global Competitiveness Program of $(1) million for
other program costs, all of which was included in Selling, general and administrative expenses. 2018 first quarter EBIT
also includes $(1) million for severance and other employee benefits related to other industrial initiatives recorded in
Cost of goods sold.
(4) Sugar & Bioenergy:
2018 first quarter EBIT includes charges related to the Company's Global Competitiveness Program of $(1) million for
other program costs, all of which was included in Selling, general and administrative expenses. 2018 first quarter EBIT
also includes Sugar restructuring charges of $(3) million recorded in Cost of goods sold.
2017 first quarter EBIT also includes Sugar restructuring charges of $(6) million recorded in Cost of goods sold.
(5) Fertilizer:
2018 first quarter EBIT includes $(1) million for severance and other employee benefits related to other industrial
initiatives recorded in Cost of goods sold.
Notes to Financial Tables:
(6) See Definition and Reconciliation of Non-GAAP Measures.
(7) A reconciliation of Net income (loss) attributable to Bunge to Net income (loss) is as follows:
Quarter Ended March 31,
2018 2017
Net income (loss) attributable to Bunge $ (21 ) $ 47
EBIT attributable to noncontrolling interest 3 2
Noncontrolling interest share of interest and tax (1 ) (1 )
Net income (loss) $ (19 ) $ 48
(8) Approximately 7 million and 2 million outstanding stock options and contingently issuable restricted stock units were not
dilutive and not included in the weighted-average number of common shares outstanding for the quarters ended
March 31, 2018 and 2017, respectively. Additionally, approximately 8 million weighted-average common shares that
are issuable upon conversion of the convertible preference shares were not dilutive and not included in the weighted-
average number of shares outstanding for the quarters ended March 31, 2018 and 2017.

16
(9) Includes readily marketable inventories of $5,410 million and $4,056 million at March 31, 2018 and December 31, 2017,
respectively. Of these amounts, $4,095 million and $2,767 million, respectively, can be attributable to merchandising
activities.
(10) The Oilseed business included in our Agribusiness segment consists of our global activities related to the crushing of
oilseeds (including soybeans, canola, rapeseed and sunflower seed) into protein meals and vegetable oils; the trading
and distribution of oilseeds and oilseed products; and biodiesel production, which is primarily conducted through joint
ventures.
The Grains business included in our Agribusiness segment consists primarily of our global grain origination activities,
which principally conduct the purchasing, cleaning, drying, storing and handling of corn, wheat, barley, rice and oilseeds
at our network of grain elevators; the logistical services for distribution of these commodities to our customer markets
through our port terminals and transportation assets (including trucks, railcars, barges and ocean vessels); and
financial services and activities for customers from whom we purchase commodities and other third parties.
(11) In accordance with new cash flow presentation requirements under U.S. Generally Accepted Accounting Principles,
cash receipts from payments on beneficial interests in securitized trade receivables should be classified as cash inflows
from investing activities. As such, we have made necessary changes to our cash flow presentation in current and prior
periods presented, which resulted in an increase in cash inflows from investing activities and a corresponding decrease
to cash from operating activities.