bundling and the qip - national kidney foundation of ... · bundling and the qip jay b. wish, md...
TRANSCRIPT

Bundling and the QIP
Jay B. Wish, MD
NKF of Illinois
15th Annual Interdisciplinary Nephrology Conference
October 24, 2014

Who Pays for Chronic Dialysis?
• Short answer – you (the taxpayer) do
• Legislative basis: Public law 92-603, Social Security Act of 1972, Medicare eligibility for patients with ESRD after 3 month waiting period, provided they have paid into social security system for 20 quarters or are a dependent of someone who has. Medicare pays 80%, patient needs co-insurance to pay other 20%.
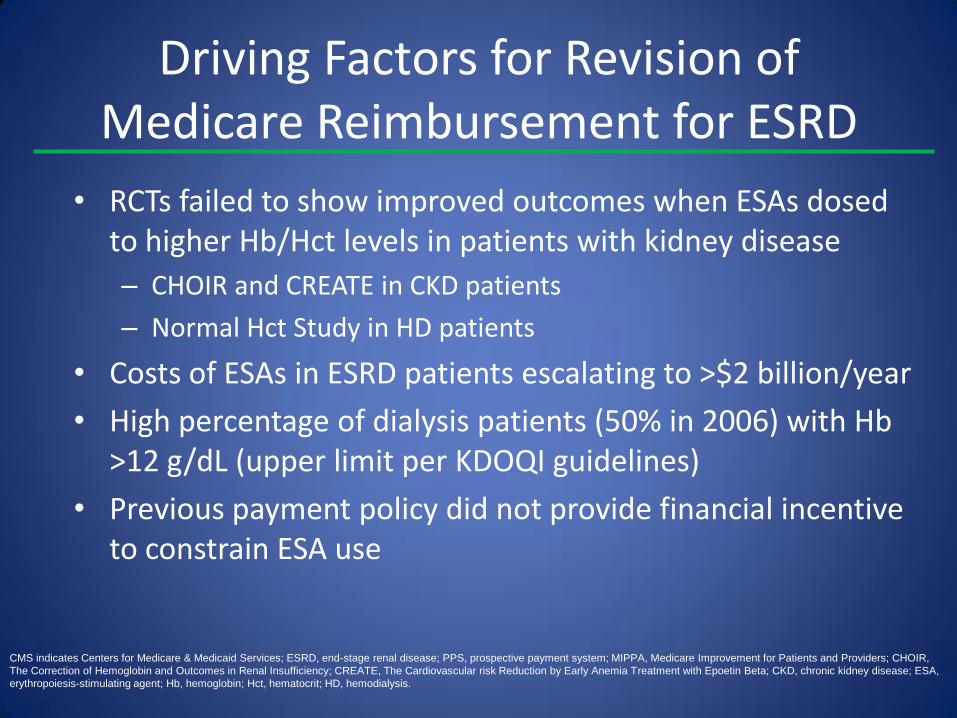
Driving Factors for Revision of Medicare Reimbursement for ESRD
• RCTs failed to show improved outcomes when ESAs dosed to higher Hb/Hct levels in patients with kidney disease
– CHOIR and CREATE in CKD patients
– Normal Hct Study in HD patients
• Costs of ESAs in ESRD patients escalating to >$2 billion/year
• High percentage of dialysis patients (50% in 2006) with Hb >12 g/dL (upper limit per KDOQI guidelines)
• Previous payment policy did not provide financial incentive to constrain ESA use
CMS indicates Centers for Medicare & Medicaid Services; ESRD, end-stage renal disease; PPS, prospective payment system; MIPPA, Medicare Improvement for Patients and Providers; CHOIR,
The Correction of Hemoglobin and Outcomes in Renal Insufficiency; CREATE, The Cardiovascular risk Reduction by Early Anemia Treatment with Epoetin Beta; CKD, chronic kidney disease; ESA,
erythropoiesis-stimulating agent; Hb, hemoglobin; Hct, hematocrit; HD, hemodialysis.
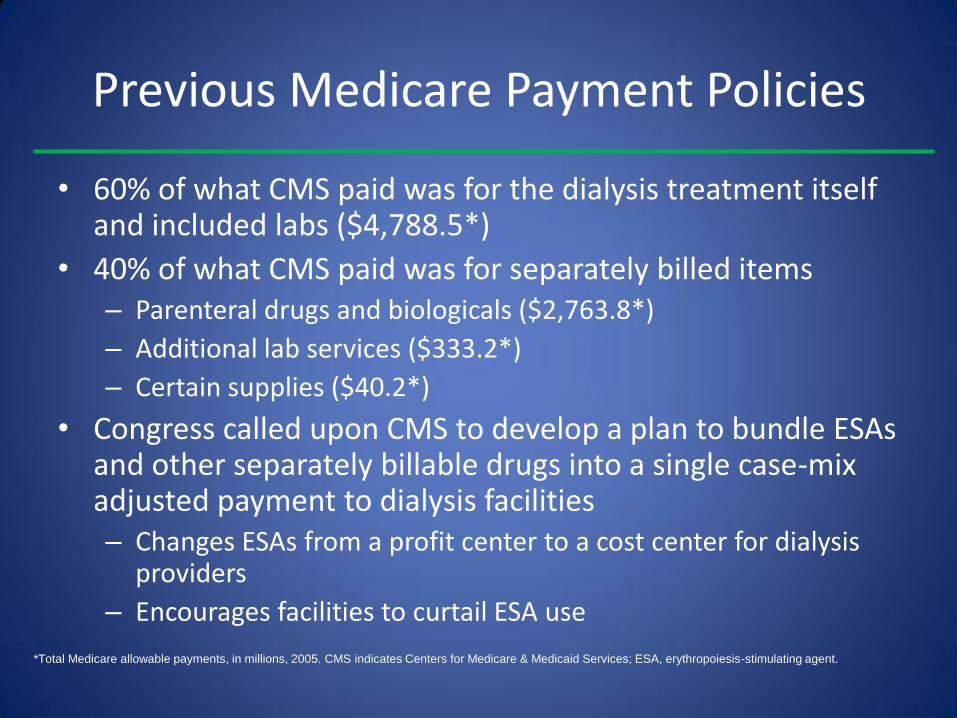
Previous Medicare Payment Policies
• 60% of what CMS paid was for the dialysis treatment itself and included labs ($4,788.5*)
• 40% of what CMS paid was for separately billed items – Parenteral drugs and biologicals ($2,763.8*)
– Additional lab services ($333.2*)
– Certain supplies ($40.2*)
• Congress called upon CMS to develop a plan to bundle ESAs and other separately billable drugs into a single case-mix adjusted payment to dialysis facilities – Changes ESAs from a profit center to a cost center for dialysis
providers
– Encourages facilities to curtail ESA use
*Total Medicare allowable payments, in millions, 2005. CMS indicates Centers for Medicare & Medicaid Services; ESA, erythropoiesis-stimulating agent.

Major Provisions of Final Rule
• Base payment rate of $229.63 – Excludes adjustments (all positive except for wage
index)
– Average adjustment 5.94% higher
• Per treatment unit of payment – Up to 3 treatments per week (unless medically
justified)
– May discourage more frequent home HD modalities
• Beneficiary/coinsurance amount is 20% of the total ESRD PPS payment after all adjustments
HD indicates hemodialysis; ESRD, end-stage renal disease; PPS, prospective payment system.
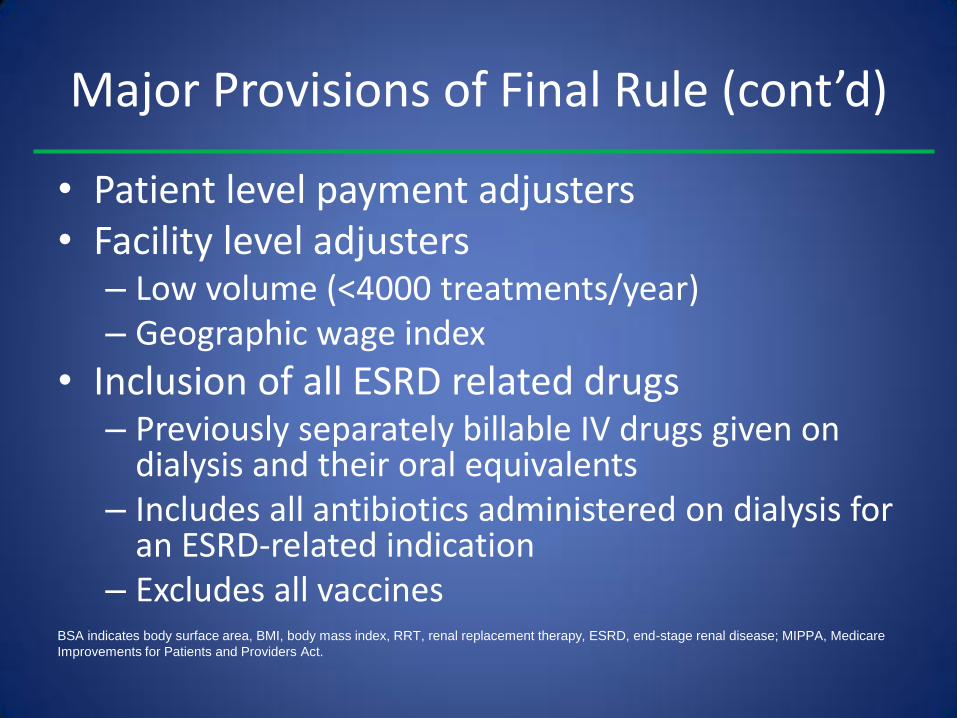
Major Provisions of Final Rule (cont’d)
• Patient level payment adjusters • Facility level adjusters
– Low volume (<4000 treatments/year) – Geographic wage index
• Inclusion of all ESRD related drugs – Previously separately billable IV drugs given on
dialysis and their oral equivalents – Includes all antibiotics administered on dialysis for
an ESRD-related indication – Excludes all vaccines
BSA indicates body surface area, BMI, body mass index, RRT, renal replacement therapy, ESRD, end-stage renal disease; MIPPA, Medicare
Improvements for Patients and Providers Act.
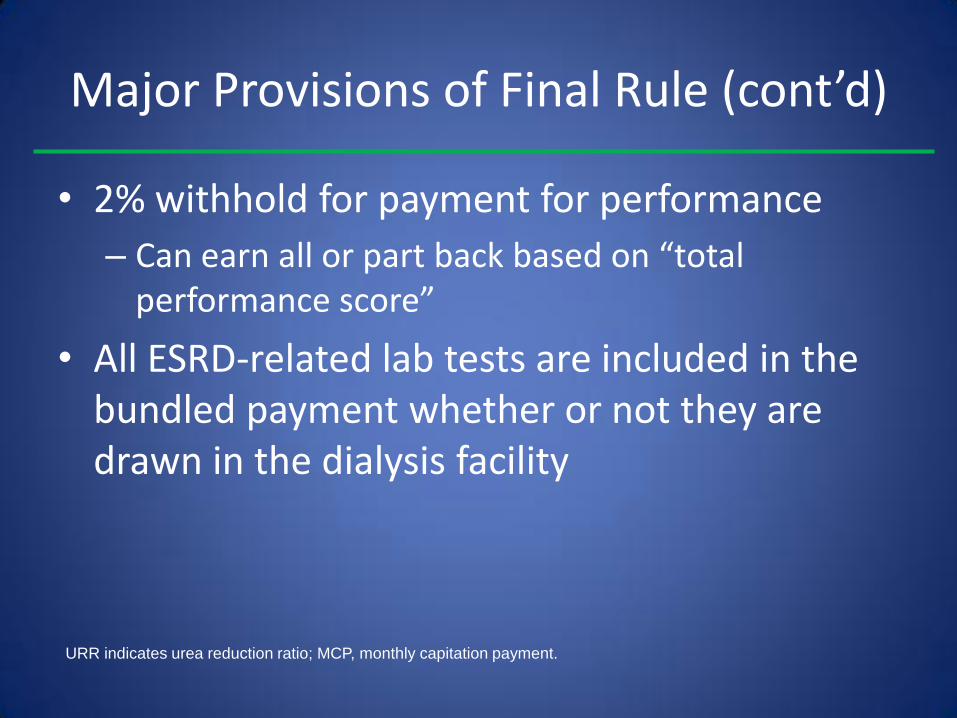
Major Provisions of Final Rule (cont’d)
• 2% withhold for payment for performance
– Can earn all or part back based on “total performance score”
• All ESRD-related lab tests are included in the bundled payment whether or not they are drawn in the dialysis facility
URR indicates urea reduction ratio; MCP, monthly capitation payment.

Case Mix Adjusters
Characteristic Adjuster
Age 18-44 1.171
45-59 1.013
60-69 1.000
70-79 1.011
80+ 1.016
BSA per 0.1 m2 over 1.87 1.020
BMI <18.5 1.025
Characteristic Adjuster
Pericarditis in <3 months 1.195
Bact. pneumonia in <3 mo. 1.307
GI bleed in <3 months 1.183
Hereditary anemia 1.072
Myelodysplastic syndrome 1.099
Monoclonal gammopathy 1.024
Onset of dialysis <4 months 1.510
Facility <4000 treatments/yr 1.189
A facility can adjust for the age and patient size characteristics and for EITHER
one of the comorbidity characteristics OR the new onset of dialysis, but not BOTH

Facility Level Adjustments
• Wage index applies to the labor share of the bundle (41.7%)
• Decreases wage index floor from 90% to 60%
• Low volume adjustment 1.202
– <4000 treatments x 3 years
– No change in ownership
– Only applies to claims for patients >18 years old
MIPPA indicates Medicare Improvements for Patients and Providers Act.
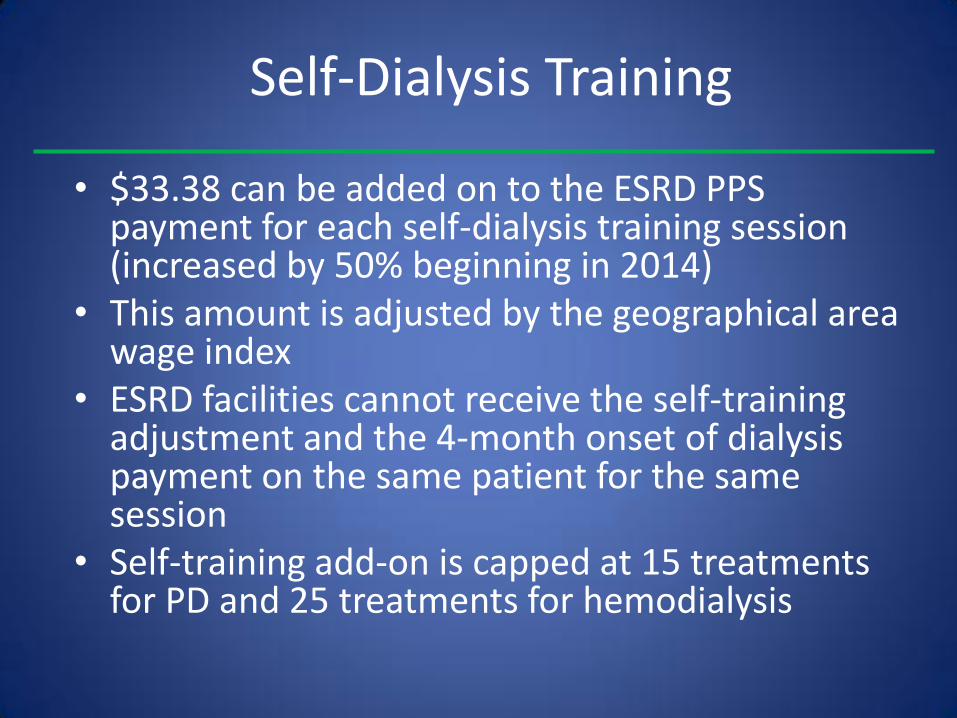
Self-Dialysis Training
• $33.38 can be added on to the ESRD PPS payment for each self-dialysis training session (increased by 50% beginning in 2014)
• This amount is adjusted by the geographical area wage index
• ESRD facilities cannot receive the self-training adjustment and the 4-month onset of dialysis payment on the same patient for the same session
• Self-training add-on is capped at 15 treatments for PD and 25 treatments for hemodialysis
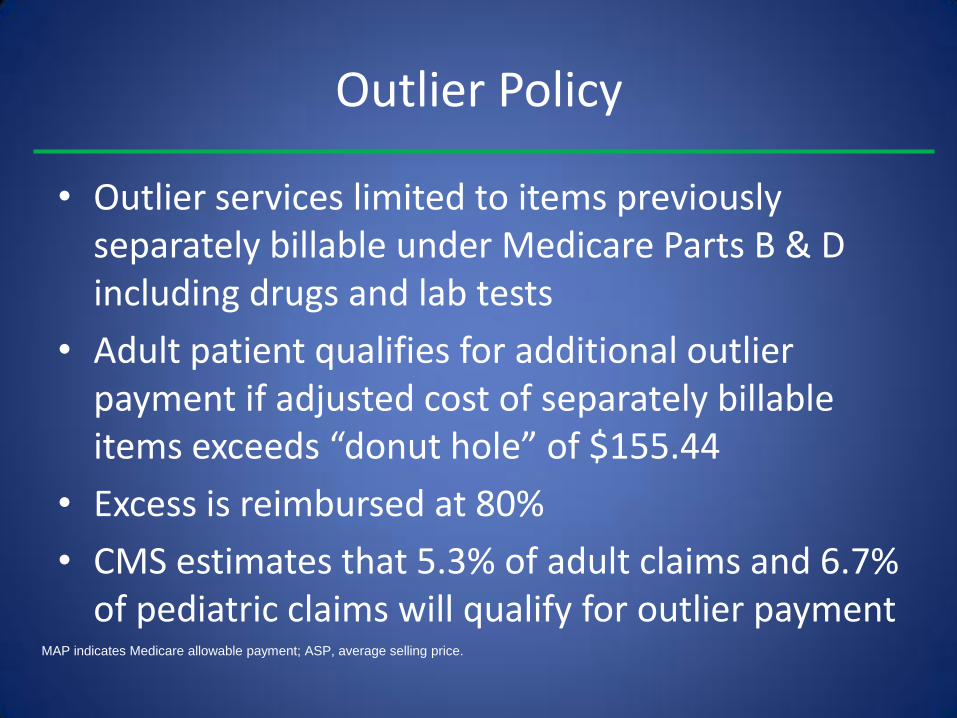
Outlier Policy
• Outlier services limited to items previously separately billable under Medicare Parts B & D including drugs and lab tests
• Adult patient qualifies for additional outlier payment if adjusted cost of separately billable items exceeds “donut hole” of $155.44
• Excess is reimbursed at 80%
• CMS estimates that 5.3% of adult claims and 6.7% of pediatric claims will qualify for outlier payment
MAP indicates Medicare allowable payment; ASP, average selling price.

ESRD QIP Value-Based Purchasing (VBP)
• Transition : Quantity of services provided to beneficiaries to Quality of those services delivered
• Advancing the National Quality Strategy and 3 part aim
• 6 domains (National Priorities of the NQS)
• Safety, Patient (Caregiver) centered care, Clinical care, Care coordination, Population health, Cost reduction
• “Paying for quality healthcare is no longer the payment system of the future; it’s the payment system of today.”
• “The ESRD QIP is the leading edge of payment reform and can serve as an example to the healthcare system.”
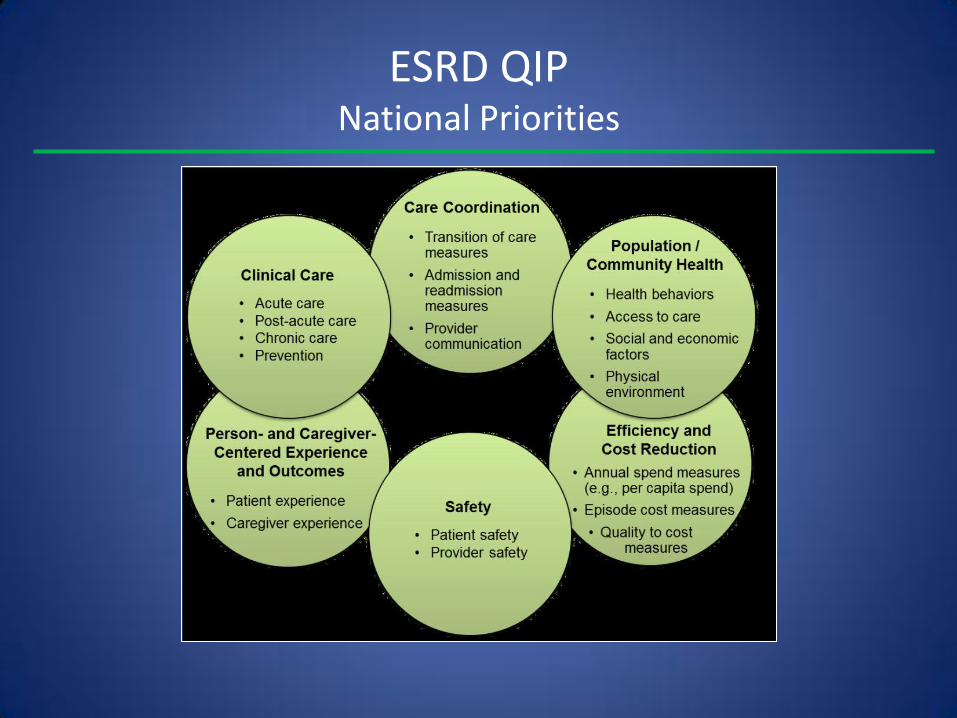
ESRD QIP National Priorities

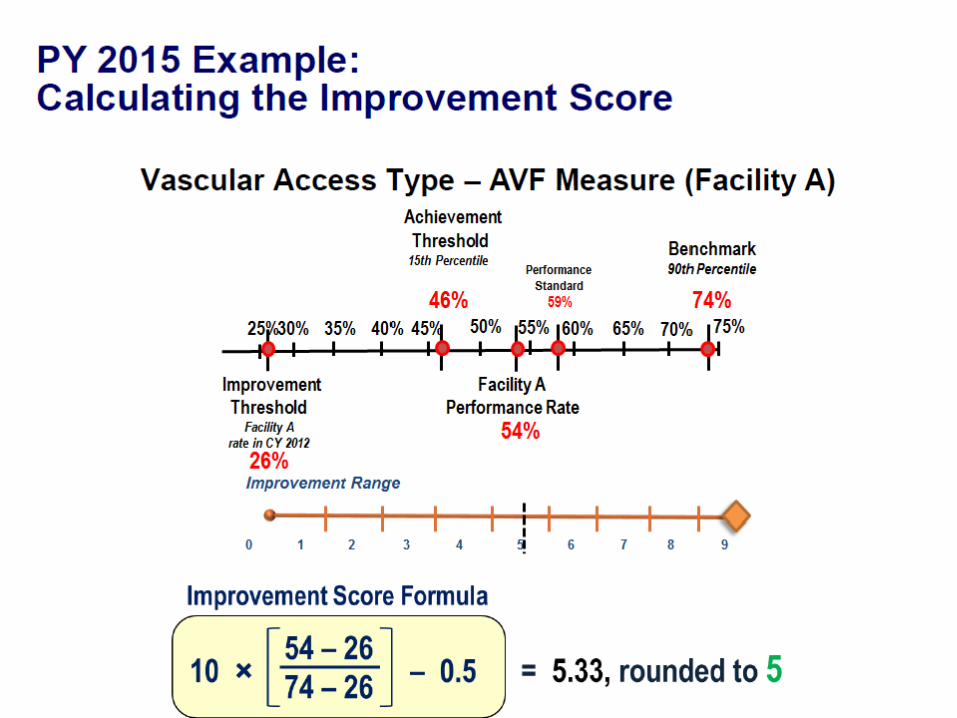
ESRD QIP Performance Year vs. Payment Year
Performance Year Payment Year
2010 2012
2011 2013
2012 2014
2013 2015*
2014 2016
*first time that performance standards, achievement thresholds and benchmarks have all been published PRIOR
to the beginning of the Performance Year

QIP Measures PY 2012-15
Measure 2012 2013 2014 2015
Hgb <10 Yes
Hgb >12 Yes Yes Yes Yes
URR >65% Yes Yes Yes
Kt/V >1.2 Yes
High AVF Yes Yes
Low CVC >90d Yes Yes
Pediatric HD adequacy Yes
PD adequacy Yes
ICH-CAHPS administration Yes
NHSN reporting of infections Yes
Anemia reporting Yes
Mineral metabolism reporting Yes
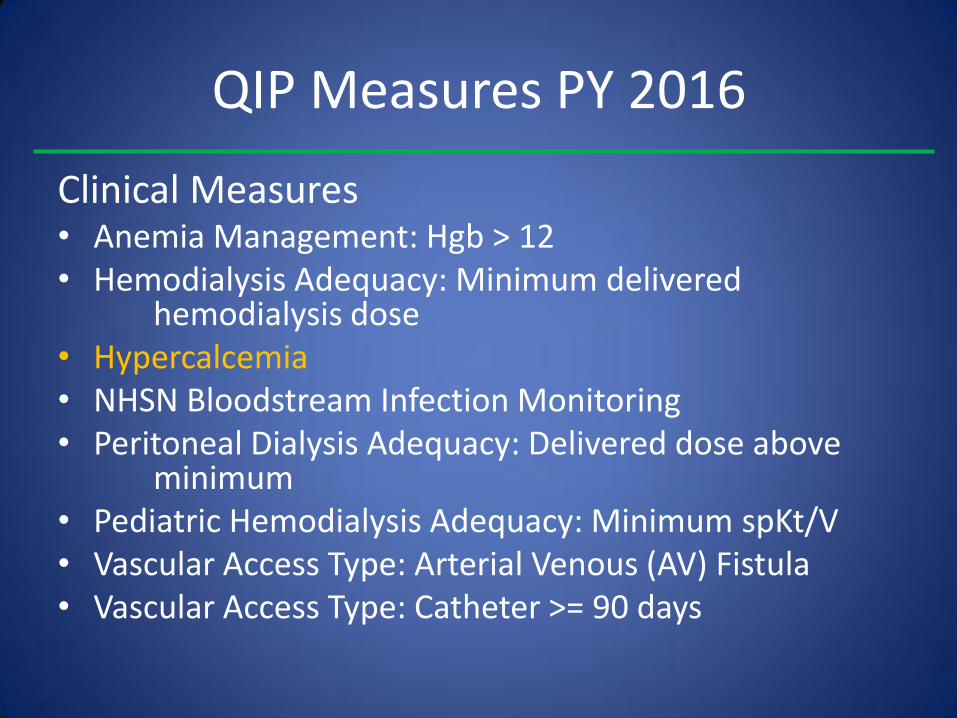
QIP Measures PY 2016
Clinical Measures • Anemia Management: Hgb > 12 • Hemodialysis Adequacy: Minimum delivered
hemodialysis dose • Hypercalcemia • NHSN Bloodstream Infection Monitoring • Peritoneal Dialysis Adequacy: Delivered dose above
minimum • Pediatric Hemodialysis Adequacy: Minimum spKt/V • Vascular Access Type: Arterial Venous (AV) Fistula • Vascular Access Type: Catheter >= 90 days

QIP Measures PY 2016
Reporting Measures
• Anemia Management Reporting
• ICH CAHPS Administration
• Mineral Metabolism Reporting
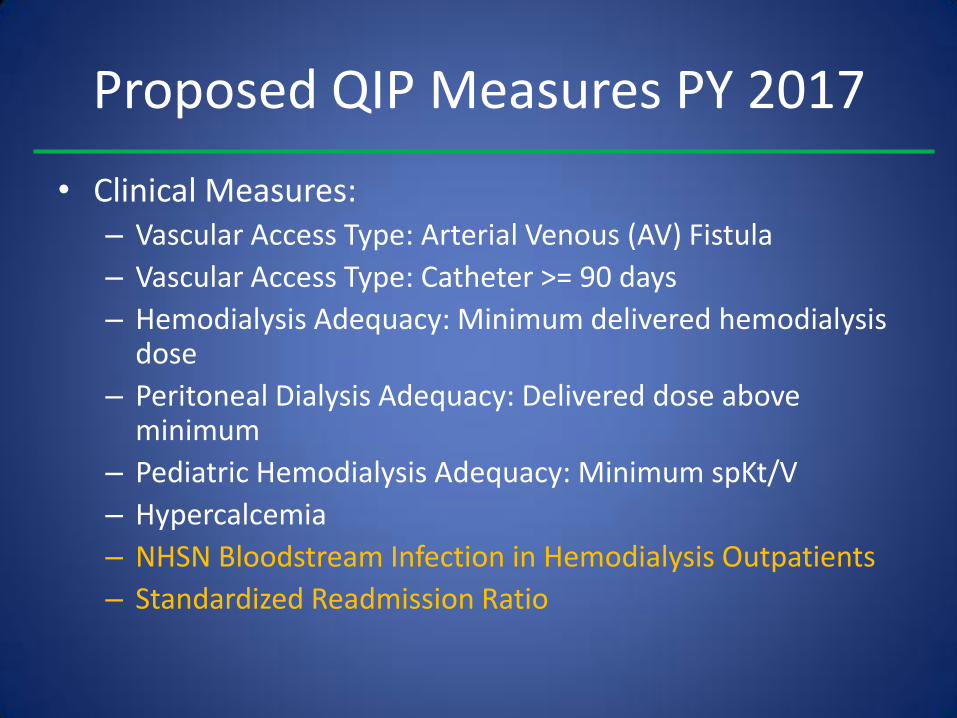
Proposed QIP Measures PY 2017
• Clinical Measures: – Vascular Access Type: Arterial Venous (AV) Fistula
– Vascular Access Type: Catheter >= 90 days
– Hemodialysis Adequacy: Minimum delivered hemodialysis dose
– Peritoneal Dialysis Adequacy: Delivered dose above minimum
– Pediatric Hemodialysis Adequacy: Minimum spKt/V
– Hypercalcemia
– NHSN Bloodstream Infection in Hemodialysis Outpatients
– Standardized Readmission Ratio

Proposed QIP Measures PY 2017
• Reporting Measures
– ICH CAHPS Administration
– Mineral Metabolism Reporting
– Anemia Management Reporting
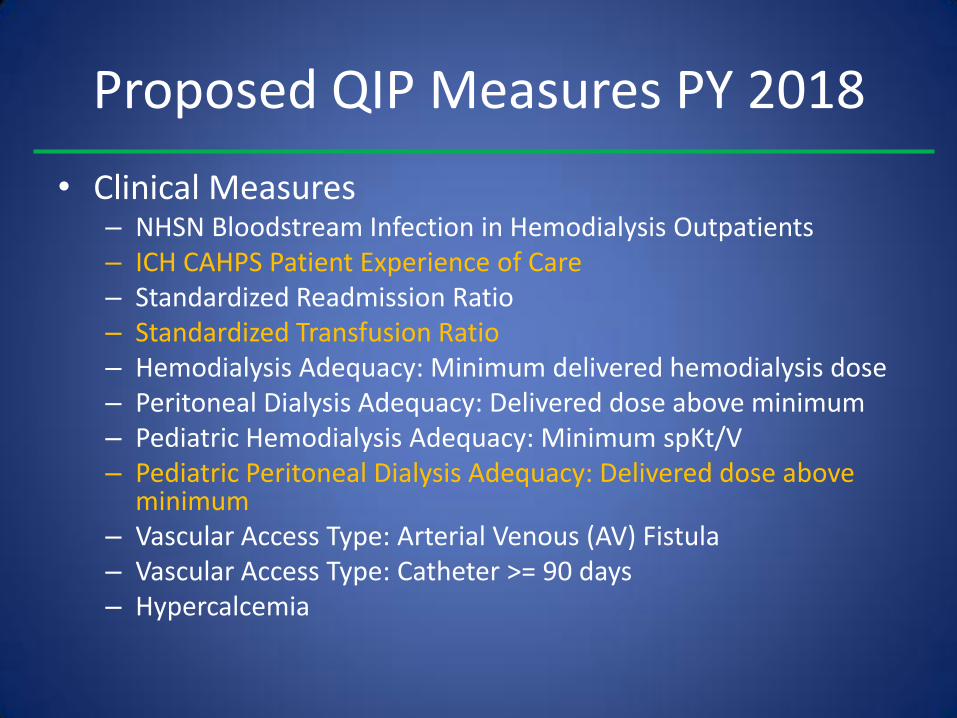
Proposed QIP Measures PY 2018
• Clinical Measures – NHSN Bloodstream Infection in Hemodialysis Outpatients – ICH CAHPS Patient Experience of Care – Standardized Readmission Ratio – Standardized Transfusion Ratio – Hemodialysis Adequacy: Minimum delivered hemodialysis dose – Peritoneal Dialysis Adequacy: Delivered dose above minimum – Pediatric Hemodialysis Adequacy: Minimum spKt/V – Pediatric Peritoneal Dialysis Adequacy: Delivered dose above
minimum – Vascular Access Type: Arterial Venous (AV) Fistula – Vascular Access Type: Catheter >= 90 days – Hypercalcemia
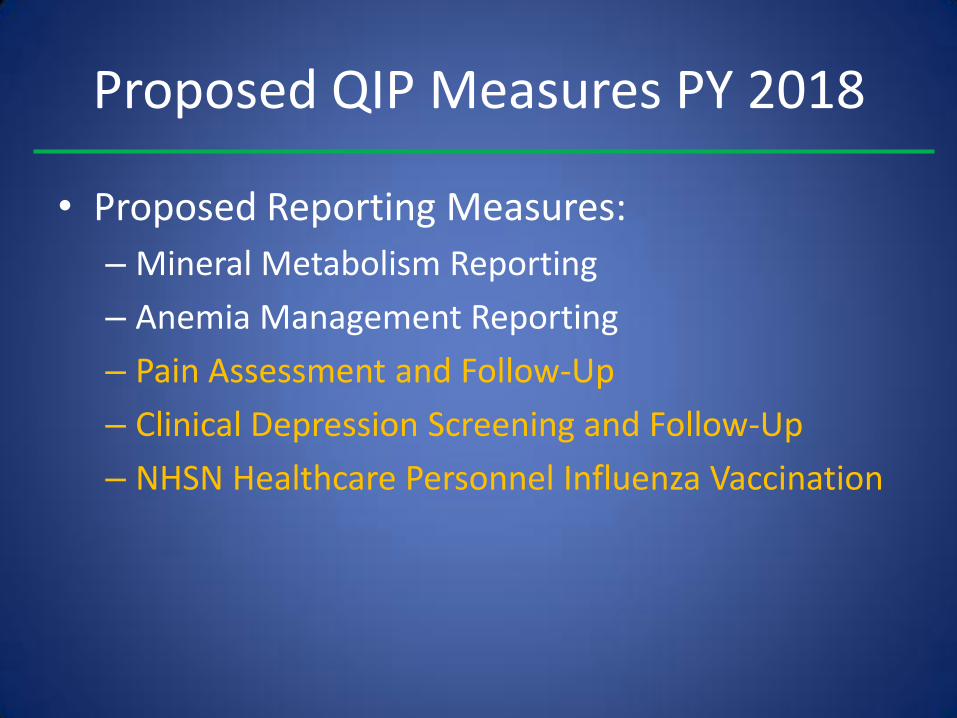
Proposed QIP Measures PY 2018
• Proposed Reporting Measures:
– Mineral Metabolism Reporting
– Anemia Management Reporting
– Pain Assessment and Follow-Up
– Clinical Depression Screening and Follow-Up
– NHSN Healthcare Personnel Influenza Vaccination
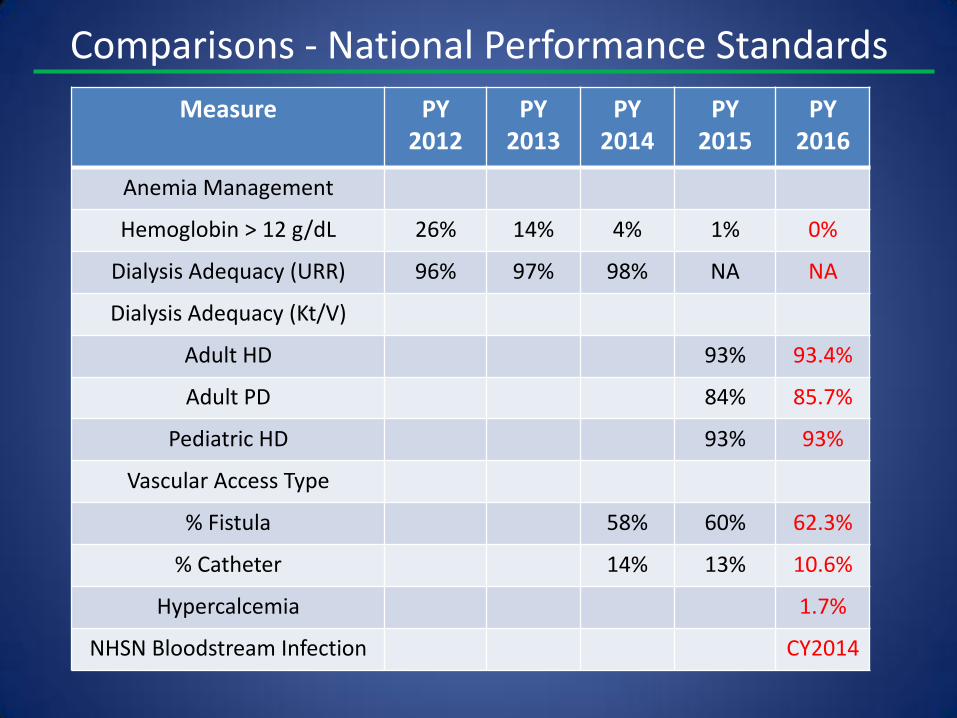
Comparisons - National Performance Standards
Measure PY 2012
PY 2013
PY 2014
PY 2015
PY 2016
Anemia Management
Hemoglobin > 12 g/dL 26% 14% 4% 1% 0%
Dialysis Adequacy (URR) 96% 97% 98% NA NA
Dialysis Adequacy (Kt/V)
Adult HD 93% 93.4%
Adult PD 84% 85.7%
Pediatric HD 93% 93%
Vascular Access Type
% Fistula 58% 60% 62.3%
% Catheter 14% 13% 10.6%
Hypercalcemia 1.7%
NHSN Bloodstream Infection CY2014
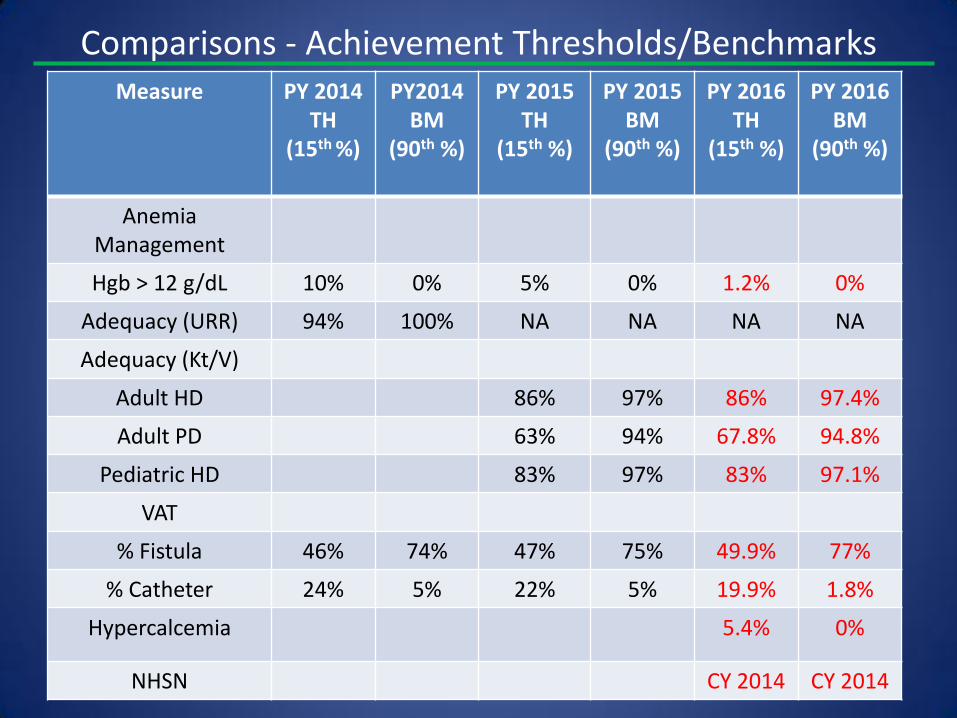
Comparisons - Achievement Thresholds/Benchmarks Measure PY 2014
TH (15th %)
PY2014 BM
(90th %)
PY 2015 TH
(15th %)
PY 2015 BM
(90th %)
PY 2016 TH
(15th %)
PY 2016 BM
(90th %)
Anemia Management
Hgb > 12 g/dL 10% 0% 5% 0% 1.2% 0%
Adequacy (URR) 94% 100% NA NA NA NA
Adequacy (Kt/V)
Adult HD 86% 97% 86% 97.4%
Adult PD 63% 94% 67.8% 94.8%
Pediatric HD 83% 97% 83% 97.1%
VAT
% Fistula 46% 74% 47% 75% 49.9% 77%
% Catheter 24% 5% 22% 5% 19.9% 1.8%
Hypercalcemia 5.4% 0%
NHSN CY 2014 CY 2014

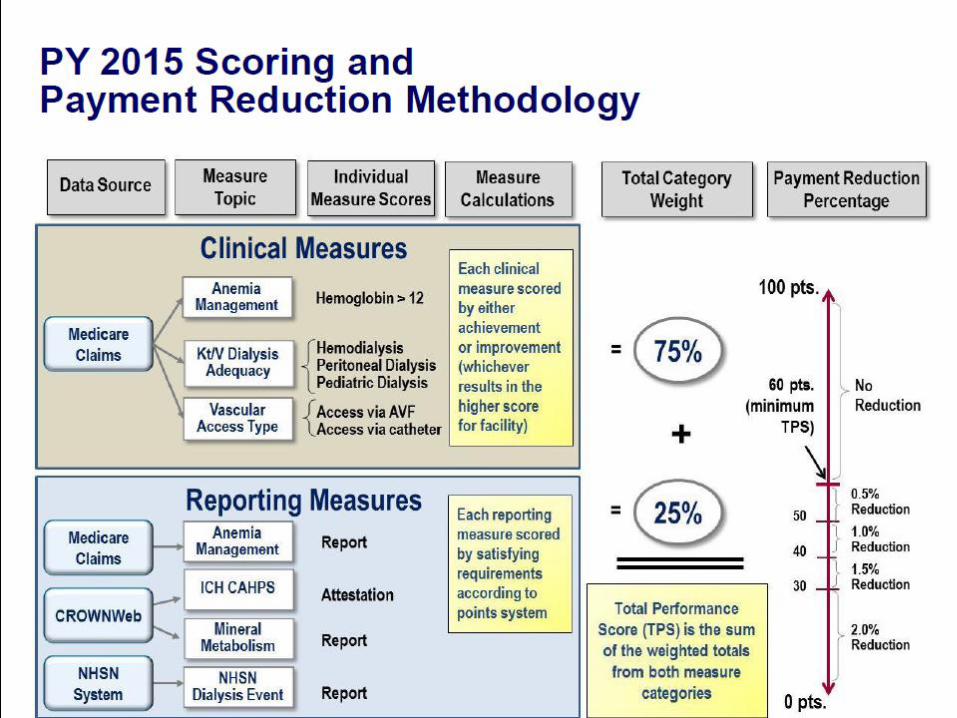
ESRD QIP Final Rule PY 2016 Total Performance Score (TPS)
• Scoring methodology identical to the PY 2014/2015 QIP
• Equally weight the clinical measures as 75 percent of the TPS
• Equally weight the reporting measures as 25 percent of the TPS
• Require a facility to have at least one clinical and one reporting measure to receive a TPS
• Case minimum threshold of 11 cases
• If the facility reports between 11 and 25 cases during the 12-month performance period, it would be scored based on its raw performance rate plus a favorable reliability adjustment to account for a possible unfavorable skew in the measure rate due to small sample size
• No adjustment for > 26 cases
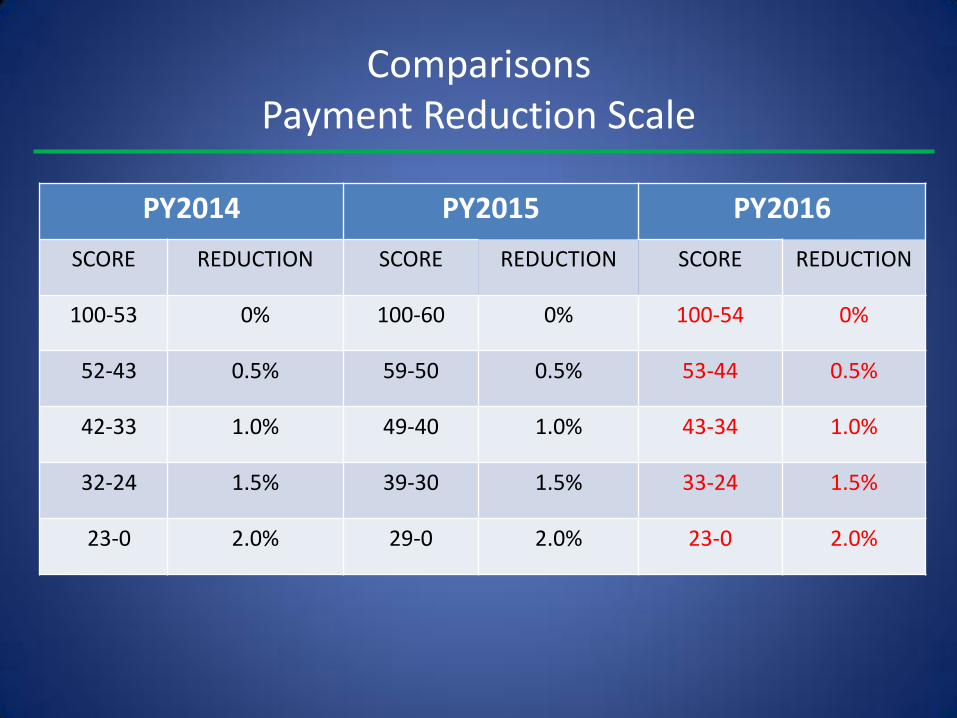
Comparisons Payment Reduction Scale
PY2014 PY2015 PY2016
SCORE REDUCTION SCORE REDUCTION SCORE REDUCTION
100-53 0% 100-60 0% 100-54 0%
52-43 0.5% 59-50 0.5% 53-44 0.5%
42-33 1.0% 49-40 1.0% 43-34 1.0%
32-24 1.5% 39-30 1.5% 33-24 1.5%
23-0 2.0% 29-0 2.0% 23-0 2.0%

Comparisons Actual Payment Reductions – Percent Penalized Facilities
Penalty PY 2012 PY2013
0.5% 16.6% -
1.0% 6% 3.2%
1.5% 7.7% 3.5%
2.0% 0.6% 2.8%
Total 30% 10%

Rebasing the Bundled Payment (1)
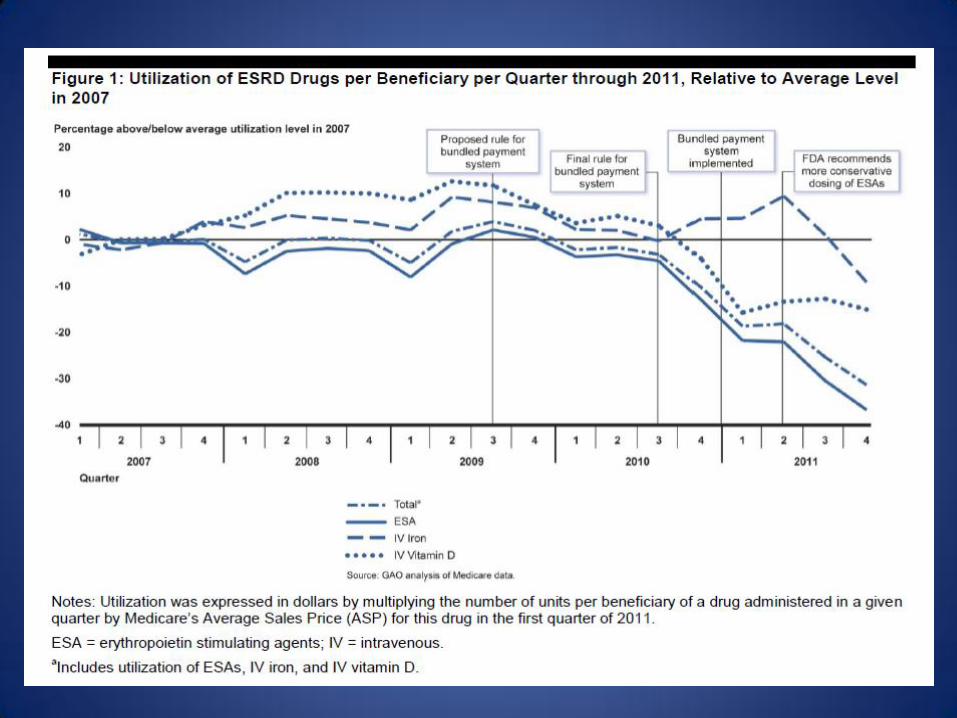
• The use of ESAs, which decreased by 37% between 2007, when its allowance in the bundle was calculated, to 2012 was due both to changes in the FDA labeling for ESAs in 2011 as well as cost-containment efforts at the facility level.
• Legislation in 2012 required Medicare to decrease (rebase) the bundled payment for dialysis in 2014 to reflect this decrease in IV drug use, which amounted to a cut of 12% or $30 per treatment.

Rebasing the Bundled Payment (2)
• Medicare subsequently decided to phase in this decrease in payment over several years to offset the increase in dialysis payment that would otherwise have occurred with inflation.
• A 3% reduction from the rebasing would offset an approximately 3% increase in the “market basket” that determines a facility’s costs for 2014 and 2015.
• Legislation in March 2014 provides that the rebasing will result in a 1.25% decrease in the market basket adjustment in 2016 and 2017 and a 1% decrease in the market basket adjustment in 2018, for an aggregate rebasing of 9.5% spread over 5 years.
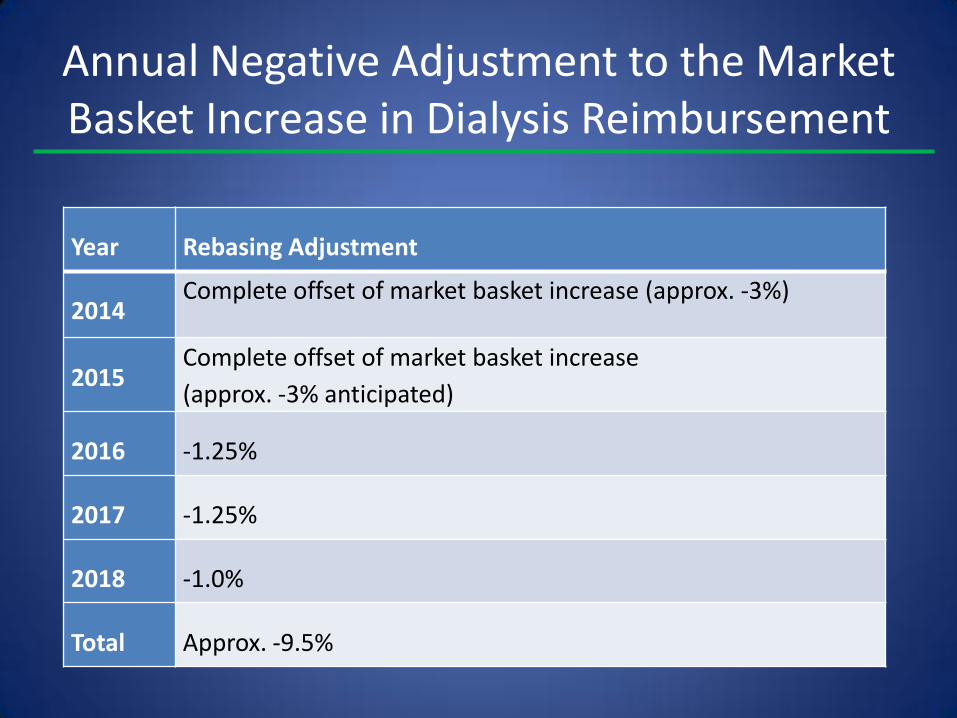
Annual Negative Adjustment to the Market Basket Increase in Dialysis Reimbursement
Year Rebasing Adjustment
2014 Complete offset of market basket increase (approx. -3%)
2015 Complete offset of market basket increase
(approx. -3% anticipated)
2016 -1.25%
2017 -1.25%
2018 -1.0%
Total Approx. -9.5%
New Payment Models for ESRD
• CMS wants to promote coordination of care, decrease hospitalizations and ER visits, and decrease overall costs of ESRD
• Current silos of payment (Medicare parts A, B, and D) and of care (dialysis facilities, hospitals, extended care facilities) do not align incentives
• End-stage renal disease seamless care organizations (ESCOs) are one approach

ESCOs
• Partnership between dialysis facilities, nephrologists, and one other Medicare provider (hospitals, another physician group, extended care facilities)
• Cost savings are shared by Medicare and the ESCO’s participants
• Savings on hospitalizations (the big ticket item) can be used by dialysis facility to fund innovation and/or offset traditionally thin margins on Medicare and Medicaid patients
• Incentivizes all partners to work collaboratively to improve quality and decrease costs
ESCOs
• Encourages expansion of the healthcare team to include vascular surgeons, pharmacists, home healthcare providers, skilled nursing facilities, palliative and hospice care
• Challenges providers to increase patient and caregiver engagement
• Promotes better pre-ESRD care (which saves money once patient is on dialysis)
• Requires shared EMR

Summary and Conclusions
• The bundled payment system in effect since 2011 is likely the first step towards global capitation of ESRD patients
• Most dialysis providers require commercial payers to survive since Medicare patient margins are thin and Medicaid margins are negative
• Rebasing may eliminate the Medicare margin for some providers and foster additional consolidation in an industry in which 2 companies already have a 70% market share
• Shared savings in an ESCO may be the only way for small and medium-sized dialysis providers that do not have a high percentage of commercial payers to survive