bumblebee-tablet · power/charging adapter and bumblebee receiver ni-mh battery charger. ... they...
TRANSCRIPT
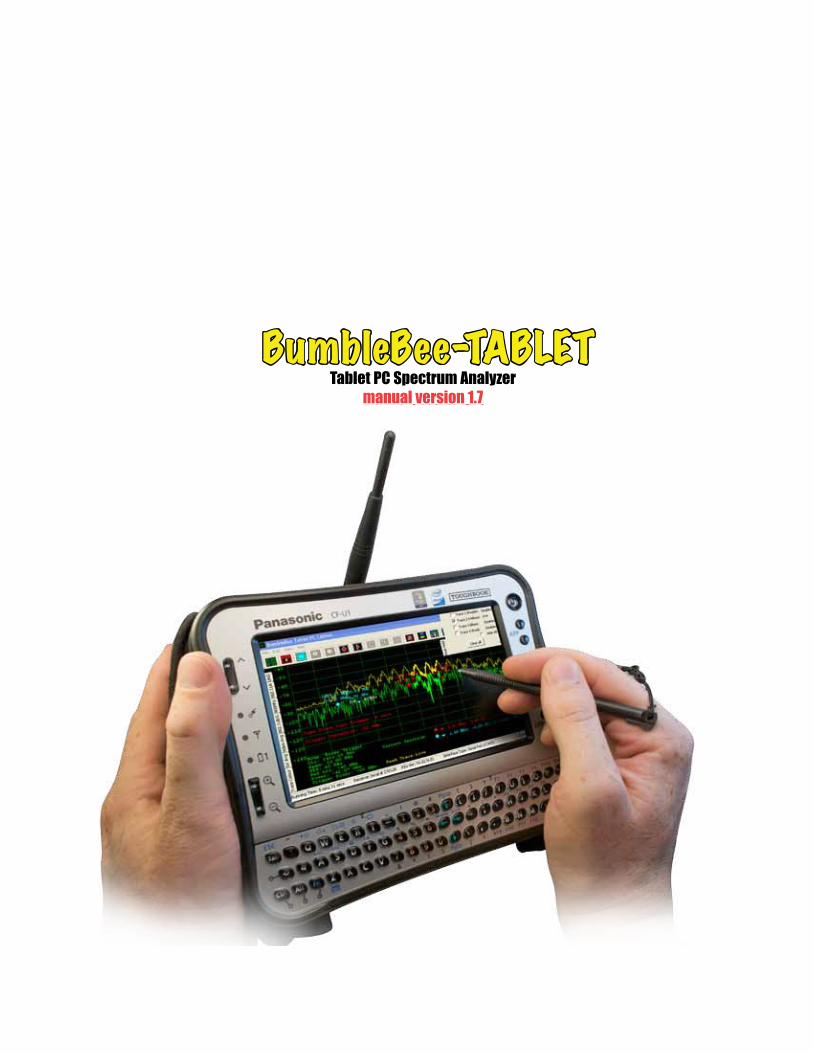
Tablet PC Spectrum Analyzermanual version 1.7
BumbleBee-TABLET

BumbleBee-TABLET Interface Hardware user’s manual BumbleBee-TABLET/BumbleBee-TABLET Interface HardwareUnpacking Your BumbleBee-TABLET.................................................................................... 2About Your BumbleBee-TABLET........................................................................................... 3Powering Your BumbleBee-TABLET...................................................................................... 3OpeningYour BumbleBee-TABLET........................................................................................ 3Optional Direction Finding Antenna Specifications................................................................... 4BumbleBee-TABLET Accessories Sheet................................................................................. 5BumbleBee-TABLET Data Sheet.......................................................................................... 5
BumbleBee-TABLET Interface Software user’s manual
Introduction..............…………………………………………………...................... 6 Installation..............…………………………………………………...................... 7 System Requirements...........…………………………………………...................... 7 Connection Status......…………………………………………………...................... 7 Operating Modes.......…………………………………………………...................... 8 Spectrum.................…………………………………………………...................... 8
Trace Options.....…………………………………………...…..................... 12 Trigger Options…..........…………………………………..…..................... 14
GPS........................…..........…………………………………..…..................... 15 Data Logs........................…..........……………..………..................... 16 Data Processing.................…..........……………..………..................... 17
Fields......................…..........…………………………………..…..................... 18 Spectrum Fields.................…..........……………..………..................... 19 GPS Fields.......................…..........……………..………..................... 20 RTC Fields.......................…..........……………..………..................... 21 Other Options....................…..........……………..………..................... 22
System information......…..........…………………………………..…..................... 23
Exit.........................…..........…………………………………..…..................... 23
IMPORTANT NOTE:
Please disable the Wireless LAN Radio and the Bluetooth Transmitter on the Tablet PC to minimize interference with the BumbleBee Receiver before you establish a connection.
1

2
Unpacking Your BumbleBee-TABLET
BumbleBee-TABLET protective case & Panasonic Toughbook Tablet
Includes Panasonic Toughbook Tablet & BumbleBee-TABLET user’s manual and software on an SD card & calibration certificate
Unpack and assemble your BumbleBee-TABLET unit as shown. Your BumbleBee-TABLET is a self-contained spectrum analyzer. The user interface (Panasonic Toughbook Tablet ), antenna and power connections are all accessible, but there is usually no need to open the protective, yellow rubber casing. The tablet may be disconnected and removed and batteries changed by users but the other components should only be accessed by Berkeley technicians. Removing such components will void your hardware warranty. Please consult the included Samsung Q1 documentation for complete operating instructions, troubleshooting and tips of tablet PC. When you open your yellow, hard, protective case you will see the BumbleBee-TABLET unit with receiver hidden below it, included antenna (frequency depending upon model ordered), spare Ni-MH AA batteries, USB cable, tablet power/charging adapter and BumbleBee receiver Ni-MH battery charger.
BumbleBee-TABLET available options shown below

BumbleBee-TABLET FRONT VIEW
BumbleBee-TABLET Receiver USB Cable
SMA Male Antenna InputWarning: Maximum input 0 dBm NO DC Input
3

2.4 GHz Omni-Directional (7.5” long)2.4 GHz Direction FindingCorner Reflector
4.9/5 GHz Direction FindingCorner Reflector
4
4.9/5 GHz Omni-Directional (5.5” long)
Optional Direction Finding Antenna Specifications
Frequency 890-960 MHzGain 9 dBiPolarization Horizontal or VerticalHorizontal Beam Width 54°Vertical Beam Width 48°Front to Back Ratio 14 dBImpedance 50 OhmMax. Input Power 100 WattsVSWR < 1.5:1 avg.Elements 5Weight 1.5 lbs. (0.7 kg)Length 19.6 in. (0.5 m)Mounting 2 in. (50.8 mm) diameter mast max.Operating Temperature -40° C to to 85° C (-40° F to 185° F)Lightning Protection DC ShortConnector N-Female
900 MHz Direction Finding Yagi 900 MHz Omni-Directional (9.5” long)
5
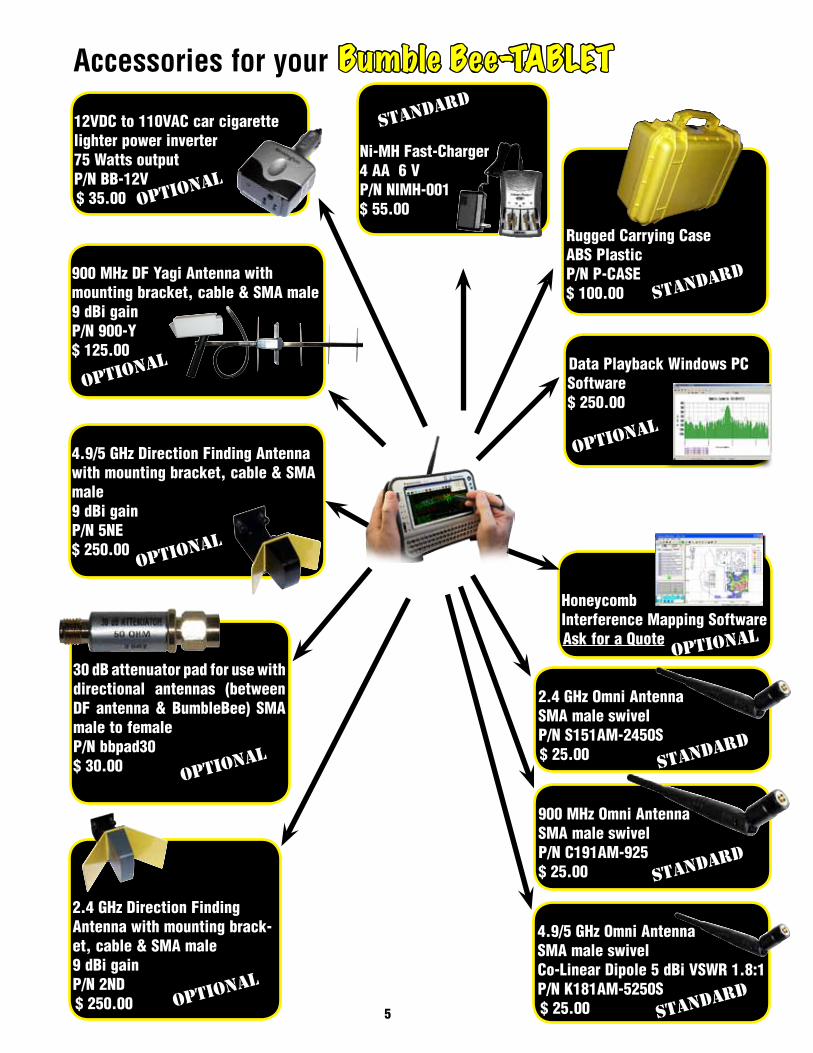
Accessories for your
Ni-MH Fast-Charger4 AA 6 VP/N NIMH-001$ 55.00
2.4 GHz Direction Finding Antenna with mounting brack-et, cable & SMA male9 dBi gainP/N 2ND$ 250.00
Rugged Carrying CaseABS PlasticP/N P-CASE$ 100.00
2.4 GHz Omni AntennaSMA male swivelP/N S151AM-2450S$ 25.00
4.9/5 GHz Direction Finding Antenna with mounting bracket, cable & SMA male9 dBi gainP/N 5NE$ 250.00
30 dB attenuator pad for use with directional antennas (between DF antenna & BumbleBee) SMA male to femaleP/N bbpad30$ 30.00
Bumble Bee-TABLET
900 MHz Omni AntennaSMA male swivelP/N C191AM-925$ 25.00
4.9/5 GHz Omni AntennaSMA male swivelCo-Linear Dipole 5 dBi VSWR 1.8:1P/N K181AM-5250S$ 25.00
12VDC to 110VAC car cigarette lighter power inverter75 Watts outputP/N BB-12V$ 35.00
OPTIONAL
OPTIONAL
OPTIONAL
OPTIONAL
STANDARD
STANDARD
STANDARD
STANDARD
STANDARD
OPTIONAL
Data Playback Windows PC Software$ 250.00
OPTIONAL
HoneycombInterference Mapping SoftwareAsk for a Quote
OPTIONAL
900 MHz DF Yagi Antenna with mounting bracket, cable & SMA male9 dBi gainP/N 900-Y$ 125.00
OPTIONAL
OPTIONAL SOFTWARE AVAILABLE FOR YOUR BUMBLEBEE
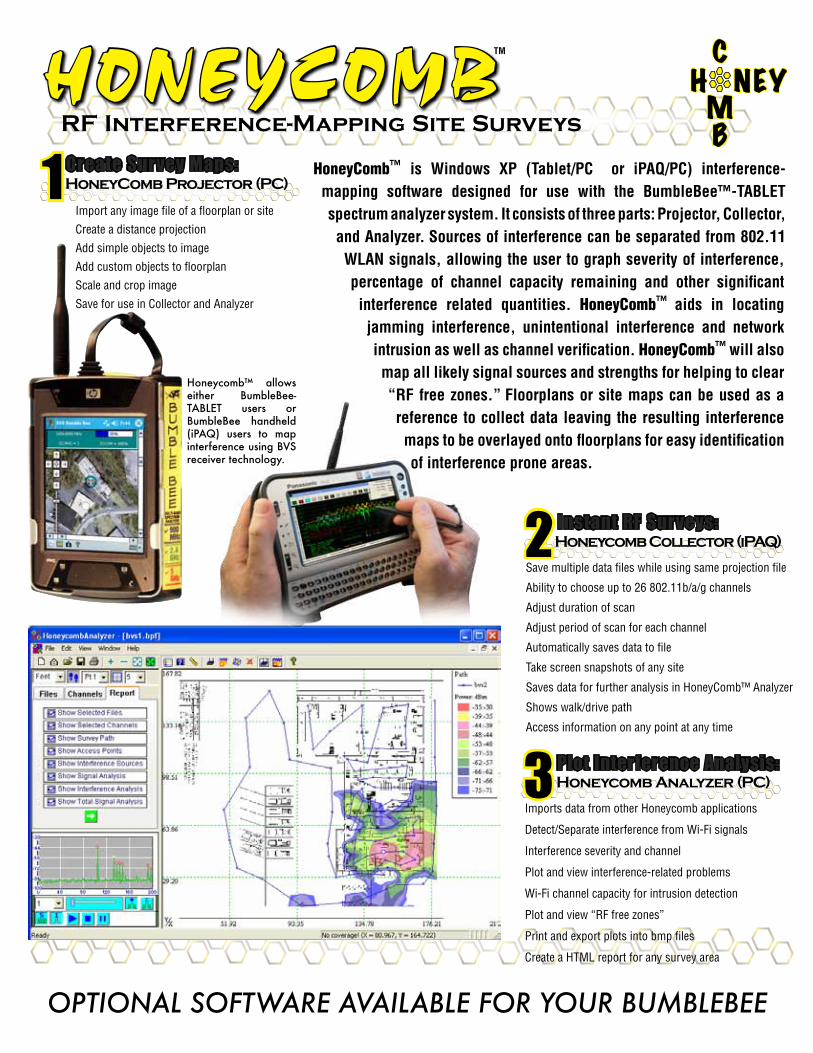
Import any image file of a floorplan or site
Create a distance projection
Add simple objects to image
Add custom objects to floorplan
Scale and crop image
Save for use in Collector and Analyzer
TM
Save multiple data files while using same projection file
Ability to choose up to 26 802.11b/a/g channels
Adjust duration of scan
Adjust period of scan for each channel
Automatically saves data to file
Take screen snapshots of any site
Saves data for further analysis in HoneyComb™ Analyzer
Shows walk/drive path
Access information on any point at any time
HoneyComb™ is Windows XP (Tablet/PC or iPAQ/PC) interference-mapping software designed for use with the BumbleBee™-TABLET spectrum analyzer system. It consists of three parts: Projector, Collector, and Analyzer. Sources of interference can be separated from 802.11 WLAN signals, allowing the user to graph severity of interference, percentage of channel capacity remaining and other significant interference related quantities. HoneyComb™ aids in locating jamming interference, unintentional interference and network intrusion as well as channel verification. HoneyComb™ will also map all likely signal sources and strengths for helping to clear “RF free zones.” Floorplans or site maps can be used as a reference to collect data leaving the resulting interference maps to be overlayed onto floorplans for easy identification of interference prone areas.
Honeycomb Analyzer (PC)3
2
Use Yellowjacket 802.11b/g PLUS receiver hardware for handheld sur-veys anywhere in the world.
RF Interference-Mapping Site Surveys
Instant RF Surveys:
Plot Interference Analysis:
Create Survey Maps:HoneyComb Projector (PC)
Honeycomb Collector (iPAQ)
H NEYC
MB
1
Honeycomb™ allows either BumbleBee-TABLET users or BumbleBee handheld (iPAQ) users to map interference using BVS receiver technology.
HONEYCOMB
Imports data from other Honeycomb applications
Detect/Separate interference from Wi-Fi signals
Interference severity and channel
Plot and view interference-related problems
Wi-Fi channel capacity for intrusion detection
Plot and view “RF free zones”
Print and export plots into bmp files
Create a HTML report for any survey area

6
BVS BumbleBee Toughbook Spectrum Analyzer User’s Manual
INTRODUCTION The BumbleBee Toughbook control software runs on a Windows-based Tablet (XP/Vista) that is connected to a BumbleBee system. This connection is made through USB. The software can also run on a Windows PC or laptop if portability is not desired. Through this USB connection, the BumbleBee can be controlled. The BumbleBee can be set to any mode and settings available. Data can be monitored in real-time and stored in a log file for later post-processing.
BumbleBee Toughbook Software

7
INSTALLATION The BumbleBee software can be installed from the SD card provided using the USB SD card adapter. .NET Framework needs to be installed on the computer in order for the software to function correctly. This framework is already installed at the factory on the tablet systems. The framework can be found on the SD card or on the internet at www.microsoft.com. SYSTEM REQUIREMENTS Below is the minimum system requirements recommended to run the BumbleBee Toughbook software. Tablet Operating Systems: Windows XP,Vista PC Operating Systems: Windows Vista, Windows 7 (32-bit) Processor Speed: 1.33 GHz Memory: 1 GB RAM Hard Drive : 15 GB (or more for large log files) CONNECTION STATUS The status bar on the bottom of the main window will display the serial number of the BumbleBee hardware and the firmware version installed. This information will only be displayed if the software has connected properly. A 'NOT CONNECTED' message will be displayed if this information was not able to be retrieved. Other items on the toolbar include a real-time clock, log file status, and whether or not the BumbleBee is being powered internally via battery or externally via the A/C transformer and cord.
OPERATING MODES When starting up the application, a main menu will appear. The options for

8
each of the menu items are discussed in the following sections.
SPECTRUM Pressing the “SPECTRUM” button from the main menu placing the instrument into “Spectrum Analysis” mode. A screen will appear which displays the current spectrum being scanned as well as an option menu on the right-hand side of the screen.
SPECTRUM ANALYSIS MODE
The 'RETURN' option on the menu will return control to the main menu. The following information is displayed underneath the current spectrum: Center Frequency Current Span
9
Start Frequency Stop Frequency Resolution Bandwidth Reference Level The settings available from the option menu are discussed in the following sections. They are listed in alphabetical order with menu depth listed in parenthesis. For instance, the option for reference level is listed as (AMPLITUDE/REF LVL). This is because the user must press the AMPLITUDE option followed by the REF LVL option. Center Frequency: (FREQUENCY/CENTER) Changes the center frequency of the spectrum being displayed. Delta: (MORE/MORE/DELTA/ON-OFF) This delta marker shows the difference in frequency and power from the marker. Delta Center: (MORE/MORE/DELTA/CENTER) Places the delta at the center frequency of the current spectrum. Delta Peak: (MORE/MORE/DELTA/PEAK) Places the delta on the highest power value. Delta Track: (MORE/MORE/DELTA/TRACK) Choosing this option will have the delta marker track the peak value. Full Span: (SPAN/FULL SPAN) That span will be set to the last span that was set using SPAN.

10
Last Span: (SPAN/LAST SPAN) The span will be set to the last span value using any of span options. Marker: (MORE/MORE/MARKER/ON-OFF) The marker menu option allows the user to place a marker at a certain frequency. The frequency and power values are shown at the marker position. Marker Center: (MORE/MORE/MARKER/CENTER) Places the marker at the center frequency of the current spectrum. Marker Peak: (MORE/MORE/MARKER/PEAK) Places the marker on the highest power value. Marker Track: (MORE/MORE/MARKER/TRACK) Choosing this option will have the marker track the peak value. Reference Level: (AMPLITUDE/REF LVL) This menu option allows the user to set the current reference level of the receiver. The valid choices are between -20 and -70 dBm, in 10 dBm increments. The Reference Level should be adjusted to obtain the greatest dynamic range. The Reference Level should be set so that the strongest signal on the display is about 10 dB down from the top of the measurement display. If a signal is drawn off the top of the measurement display or the message “clipped” is displayed, lower the Reference Level. Resolution Bandwidth: (MORE/RES BW) The BumbleBee measures the energy present in different frequency bins, each bin’s width equal to the resolution bandwidth. The resolution bandwidth is set by setting the level for the resolution bandwidth desired.
11
Why use a small Resolution Bandwidth? A small Resolution Bandwidth is appropriate to measure frequency components and signal characteristics. Smaller Resolution Bandwidths increases the Sweep Time (number of traces displayed per second) for a given frequency span. Why use a large Resolution Bandwidth? A large Resolution Bandwidth is appropriate to measure large Spans of frequencies quickly. A Resolution Bandwidth larger than the signal’s bandwidth can measure channel power. The BumbleBee may be set to a large Resolution Bandwidth and a large Span to quickly sweep and identify frequencies of interest. The Span and Center can then be decreased to measure frequency components and the signal's characteristics. Screen Averaging: (MORE/SCR AVG) Using this setting, the average of the last N sweeps will be displayed. Span: (SPAN/SPAN) Sets the new span of the spectrum being displayed. Span Zoom: (SPAN/SPAN ZOOM) Reduces the span to half of the current span. Start Frequency: (FREQUENCY/START) Sets the start frequency of the spectrum displayed. Center and Span will be adjusted accordingly. Stop Frequency: (FREQUENCY/STOP)) Sets the stop frequency of the spectrum displayed. Center and Span will be
12
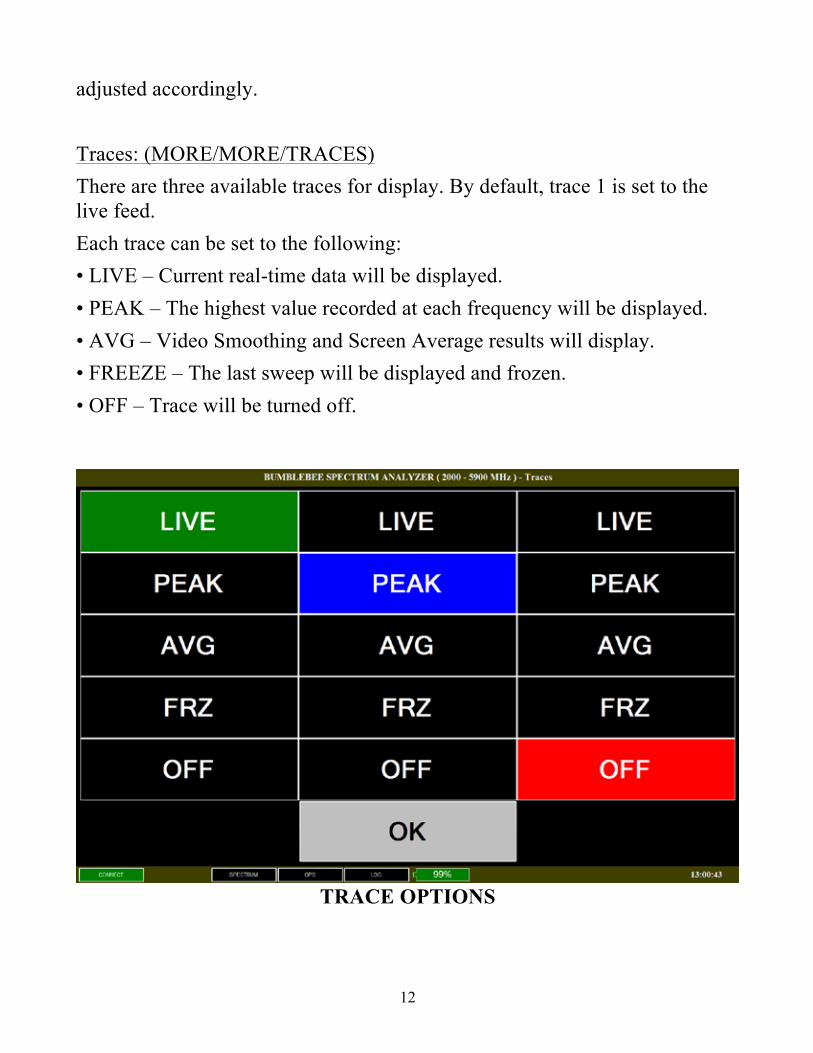
adjusted accordingly. Traces: (MORE/MORE/TRACES) There are three available traces for display. By default, trace 1 is set to the live feed. Each trace can be set to the following: • LIVE – Current real-time data will be displayed. • PEAK – The highest value recorded at each frequency will be displayed. • AVG – Video Smoothing and Screen Average results will display. • FREEZE – The last sweep will be displayed and frozen. • OFF – Trace will be turned off.
TRACE OPTIONS

13
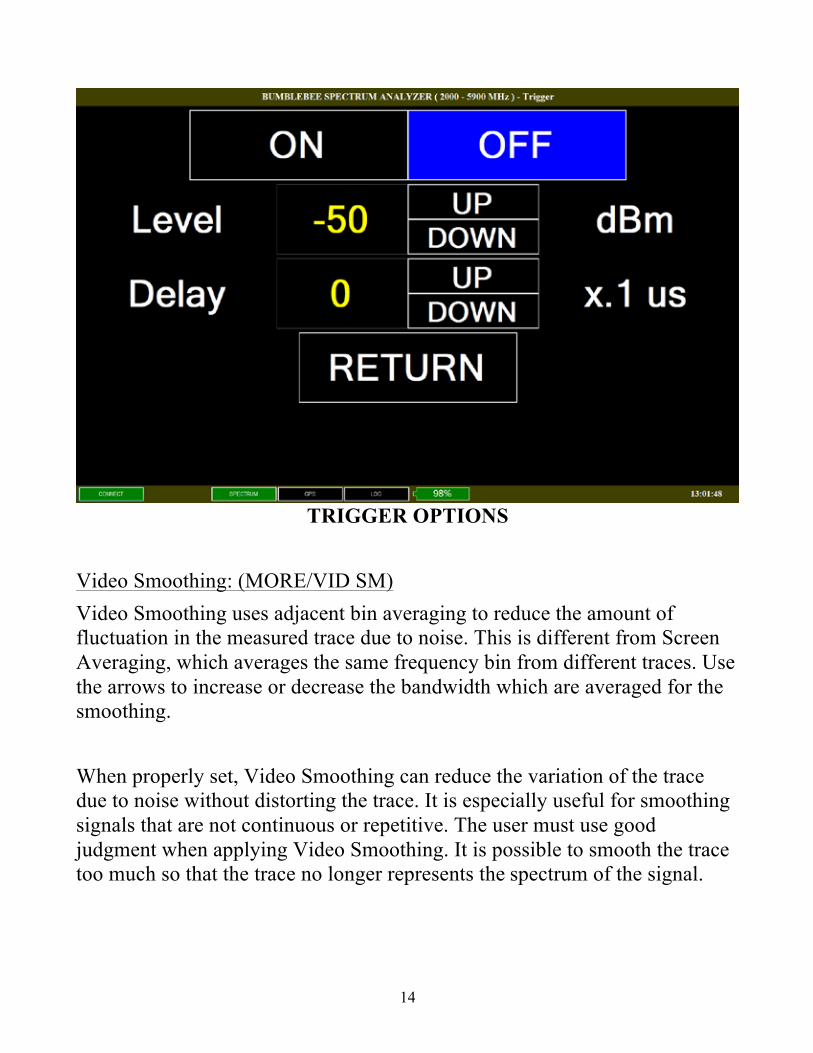
Trigger: (MORE/MORE/MORE/TRIGGER) Triggering enables the BumbleBee to quickly capture the spectrum from sources that are not continuously transmitting. The trigger threshold represents the amount of CHANNEL POWER that when exceeded will trigger the BumbleBee to measure the spectrum. The trigger delay sets a delay between the trigger threshold being exceeded and the measurement of the spectrum. The trigger threshold is set by the user in dBm, and its range is from the current Reference Level to 20dB below the current Reference Level. Trigger Mode is very useful to capture the spectrum from any source that is not continually transmitting on the same frequency. The trigger delay sets a delay between the trigger threshold being exceeded and the measurement of the spectrum. The trigger threshold is set by the user in dBm, and its range is from the current Reference Level to 20dB below the current Reference Level. Trigger Mode is very useful to capture the spectrum from any source that is not continually transmitting on the same frequency.
14
TRIGGER OPTIONS Video Smoothing: (MORE/VID SM) Video Smoothing uses adjacent bin averaging to reduce the amount of fluctuation in the measured trace due to noise. This is different from Screen Averaging, which averages the same frequency bin from different traces. Use the arrows to increase or decrease the bandwidth which are averaged for the smoothing. When properly set, Video Smoothing can reduce the variation of the trace due to noise without distorting the trace. It is especially useful for smoothing signals that are not continuous or repetitive. The user must use good judgment when applying Video Smoothing. It is possible to smooth the trace too much so that the trace no longer represents the spectrum of the signal.

15
GPS Choosing GPS from the main menu activates a display which contains information from the internal GPS receiver. This display will show the position and current time if there is a 3D lock acquired from the GPS satellites in orbit. This information can be useful in real-time and also in post-processing as it is contained in log files.
GPS If there is a point of interest during a study, the position and time will be marked in the log file along with the data taken at that point in time.
16
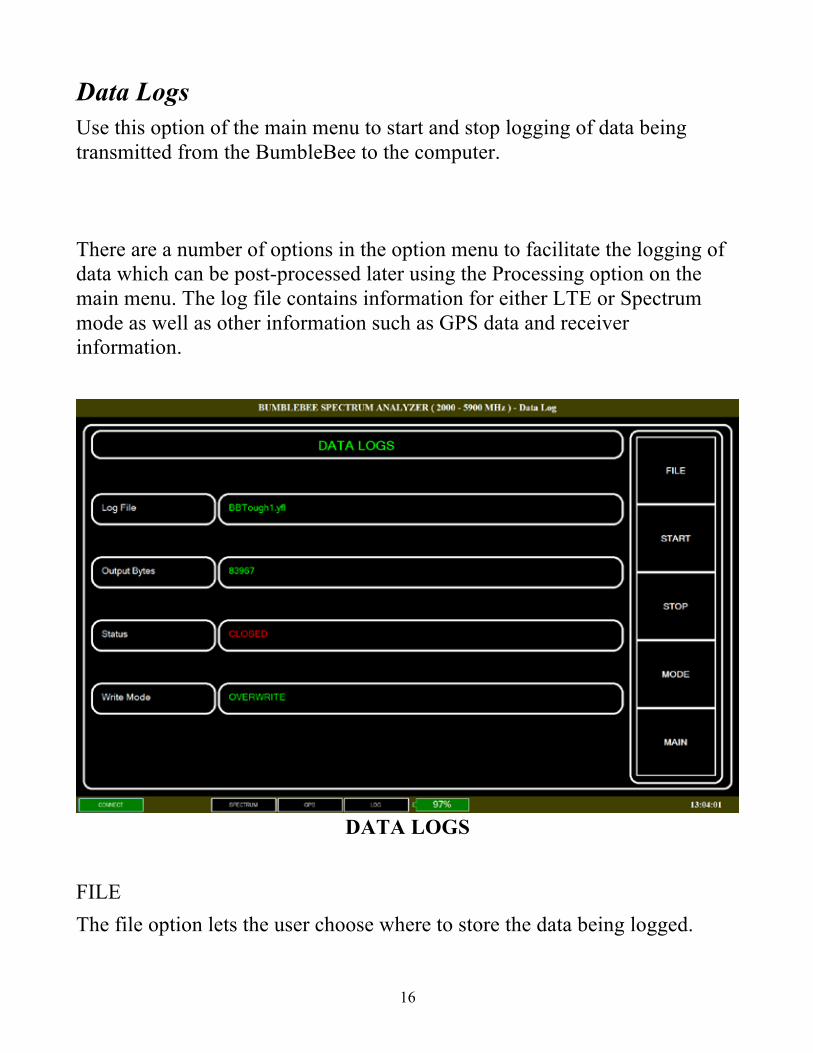
Data Logs Use this option of the main menu to start and stop logging of data being transmitted from the BumbleBee to the computer. There are a number of options in the option menu to facilitate the logging of data which can be post-processed later using the Processing option on the main menu. The log file contains information for either LTE or Spectrum mode as well as other information such as GPS data and receiver information.
DATA LOGS FILE The file option lets the user choose where to store the data being logged.
17
START Pressing this button on the option menu opens the file for logging using the current mode. STOP Pressing this button on the option menu closes the file to logging. MODE Pressing this button allows the user to decide whether or not the file will be overwritten or appended to when logging is started.
Processing The processing option off of the main menu allows the user to convert data logged into an ASCII-delimited readable format which is suitable for various spreadsheet applications as well as other applications for further post-processing. The main processing screen displays the current files selected, the fields and options selected, the number of bytes in the input file, and the progress of any conversion in progress.

18
DATA PROCESSING
The options menu on the right allows for the selection of the input (binary) file, the output (converted) file, the fields to be included in the output file, and the options to be used during conversion.
FIELDS Choosing FIELDS from the option menu displays the spectrum data. The option menu on the right the allows for the selection of individual GPS or RTC (real-time clock) fields.

19
Spectrum Spectrum fields include center, span, start and stop frequencies. Also, step size, resolution bandwidth, reference level, first frequency in the current record, count of rssi values in the current record, and the actual rssi values for the record.
SPECTRUM FIELDS

20
GPS GPS fields which can be selected include latitude, longitude, time, altitude, and status (2D or 3D lock).
GPS FIELDS

21
RTC Here the RTC date and time can be selected. This is convenient where there is no GPS available.
RTC Fields

22
OPTIONS Certain options which are selectable by pressing the options button in the option menu of the main processing display. These include the selection of a field delimiter, whether or not units will be Metric or English, and if a header record is to be included in the output file.
Other Options
23
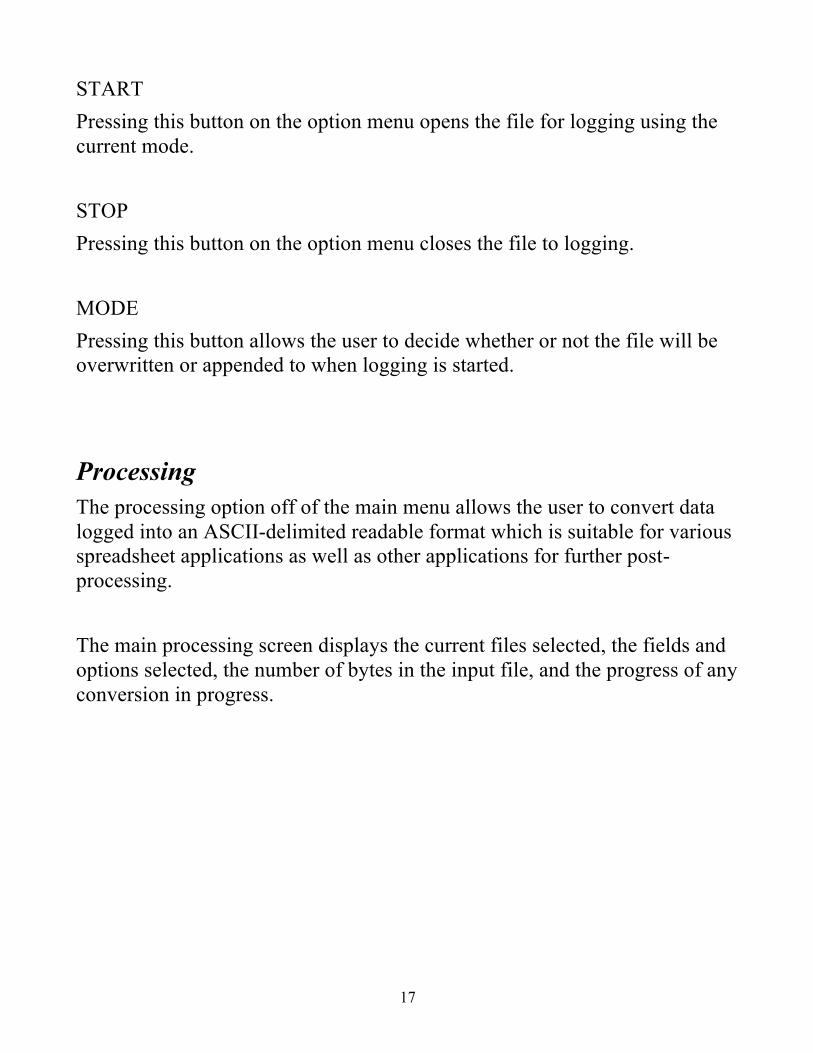
System Information The system information button on the main menu displays pertinent version and copyright information.
SYSTEM INFORMATION
Exit Pressing this button from the main menu will exit the BumbleBee application. Various settings and options are saved.