bulletin #5 11 june 2019
TRANSCRIPT
Food Price Monitoring and Analysis11 June 2019
MONTHLY REPORT ON FOOD PRICE TRENDS
BULLETIN#5
GIEWS - Global Information and Early Warning System on Food and Agriculture
KEY MESSAGES ↗ Export prices of maize from the United States of America increased in May, underpinned by the impact of heavy rains in key growing areas, which also limited the decline in the export prices of wheat. International prices of rice remained generally stable.
↗ In East Africa, severe early and mid-season dryness affecting production prospects for the 2019 harvests continued to support the increases in prices of maize in several countries of the subregion. In the Sudan and South Sudan, a halt in currency depreciations contributed to a softer tone in prices of coarse grains in the past month.
↗ In Southern Africa, prices of maize came under general downward pressure in May with the start of the 2019 harvests. By contrast, in Zimbabwe, retail prices of maize and wheat flour spiked after upward price revisions by the milling industry, reflecting the continuing depreciation of the country’s currency as well as the sharply reduced production prospects for the 2019 cereal crops.
Price warning level: High Moderate [Based on GIEWS analysis]
CONTENTSINTERNATIONAL CEREAL PRICES ............................. 2
DOMESTIC PRICE WARNINGS .................................. 3
WEST AFRICA ........................................................... 7
SOUTHERN AFRICA .................................................. 9
EAST AFRICA .......................................................... 11
EAST ASIA .............................................................. 13
CIS - ASIA AND EUROPE ......................................... 15
CENTRAL AMERICA AND THE CARIBBEAN ............. 18
SOUTH AMERICA ................................................... 19
Argentina | Grains
Haiti | Cereals
Kenya | Maize
Malawi | Maize
Mozambique | Maize
South Africa | Maize
South Sudan | Staple foods
Sudan | Staple foods
Uganda | Maize
Zambia | Maize
Zimbabwe | Cereals
Domestic price warnings
Warnings are only included if latest available price data is not older than two months.
2 11 June 2019GIEWS FPMA Bulletin
For more information visit the FPMA website here
INTERNATIONAL CEREAL PRICES
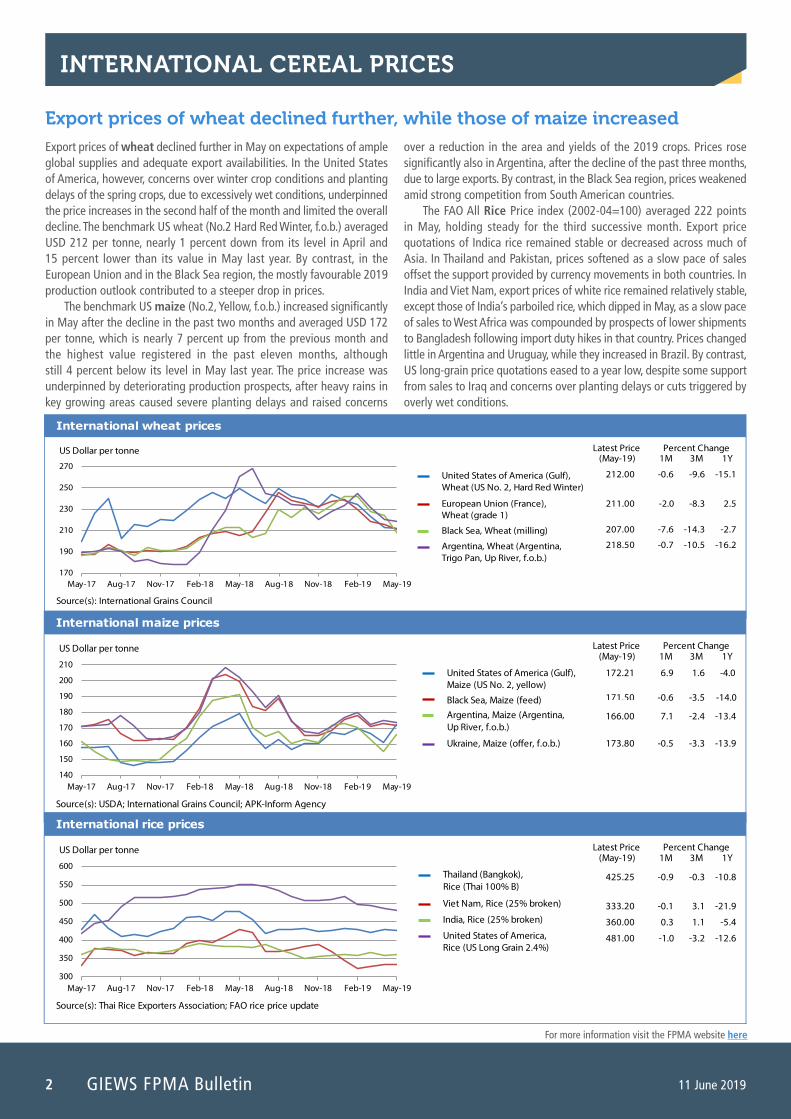
Export prices of wheat declined further in May on expectations of ample global supplies and adequate export availabilities. In the United States of America, however, concerns over winter crop conditions and planting delays of the spring crops, due to excessively wet conditions, underpinned the price increases in the second half of the month and limited the overall decline. The benchmark US wheat (No.2 Hard Red Winter, f.o.b.) averaged USD 212 per tonne, nearly 1 percent down from its level in April and 15 percent lower than its value in May last year. By contrast, in the European Union and in the Black Sea region, the mostly favourable 2019 production outlook contributed to a steeper drop in prices.
The benchmark US maize (No.2, Yellow, f.o.b.) increased significantly in May after the decline in the past two months and averaged USD 172 per tonne, which is nearly 7 percent up from the previous month and the highest value registered in the past eleven months, although still 4 percent below its level in May last year. The price increase was underpinned by deteriorating production prospects, after heavy rains in key growing areas caused severe planting delays and raised concerns
over a reduction in the area and yields of the 2019 crops. Prices rose significantly also in Argentina, after the decline of the past three months, due to large exports. By contrast, in the Black Sea region, prices weakened amid strong competition from South American countries.
The FAO All Rice Price index (2002-04=100) averaged 222 points in May, holding steady for the third successive month. Export price quotations of Indica rice remained stable or decreased across much of Asia. In Thailand and Pakistan, prices softened as a slow pace of sales offset the support provided by currency movements in both countries. In India and Viet Nam, export prices of white rice remained relatively stable, except those of India’s parboiled rice, which dipped in May, as a slow pace of sales to West Africa was compounded by prospects of lower shipments to Bangladesh following import duty hikes in that country. Prices changed little in Argentina and Uruguay, while they increased in Brazil. By contrast, US long-grain price quotations eased to a year low, despite some support from sales to Iraq and concerns over planting delays or cuts triggered by overly wet conditions.
Export prices of wheat declined further, while those of maize increased
Latest Price(May-19) 1M 3M 1Y
International wheat prices
Percent Change
170
190
210
230
250
270
May-17 Aug-17 Nov-17 Feb-18 May-18 Aug-18 Nov-18 Feb-19 May-19
US Dollar per tonne
212.00
211.00
207.00
218.50
-0.6
-2.0
-7.6
-0.7
-9.6
-8.3
-14.3
-10.5
-15.1
2.5
-2.7
-16.2
Source(s): International Grains Council
United States of America (Gulf), Wheat (US No. 2, Hard Red Winter)
European Union (France), Wheat (grade 1)
Black Sea, Wheat (milling)
Argentina, Wheat (Argentina, Trigo Pan, Up River, f.o.b.)
Latest Price(May-19) 1M 3M 1Y
International maize prices
Percent Change
140
150
160
170
180
190
200
210
May-17 Aug-17 Nov-17 Feb-18 May-18 Aug-18 Nov-18 Feb-19 May-19
US Dollar per tonne
172.21
171.50
166.00
173.80
6.9
-0.6
7.1
-0.5
1.6
-3.5
-2.4
-3.3
-4.0
-14.0
-13.4
-13.9
Source(s): USDA; International Grains Council; APK-Inform Agency
United States of America (Gulf), Maize (US No. 2, yellow)
Black Sea, Maize (feed)Argentina, Maize (Argentina, Up River, f.o.b.)
Ukraine, Maize (o�er, f.o.b.)
Latest Price(May-19) 1M 3M 1Y
International rice prices
Percent Change
300
350
400
450
500
550
600
May-17 Aug-17 Nov-17 Feb-18 May-18 Aug-18 Nov-18 Feb-19 May-19
Thailand (Bangkok), Rice (Thai 100% B)
Viet Nam, Rice (25% broken)
India, Rice (25% broken)
United States of America, Rice (US Long Grain 2.4%)
US Dollar per tonne
425.25
333.20
360.00
481.00
-0.9
-0.1
0.3
-1.0
-0.3
3.1
1.1
-3.2
-10.8
-21.9
-5.4
-12.6
Source(s): Thai Rice Exporters Association; FAO rice price update
Price warning level: High Moderate
3
For more information visit the FPMA website here
11 June 2019 GIEWS FPMA Bulletin
DOMESTIC PRICE WARNINGS
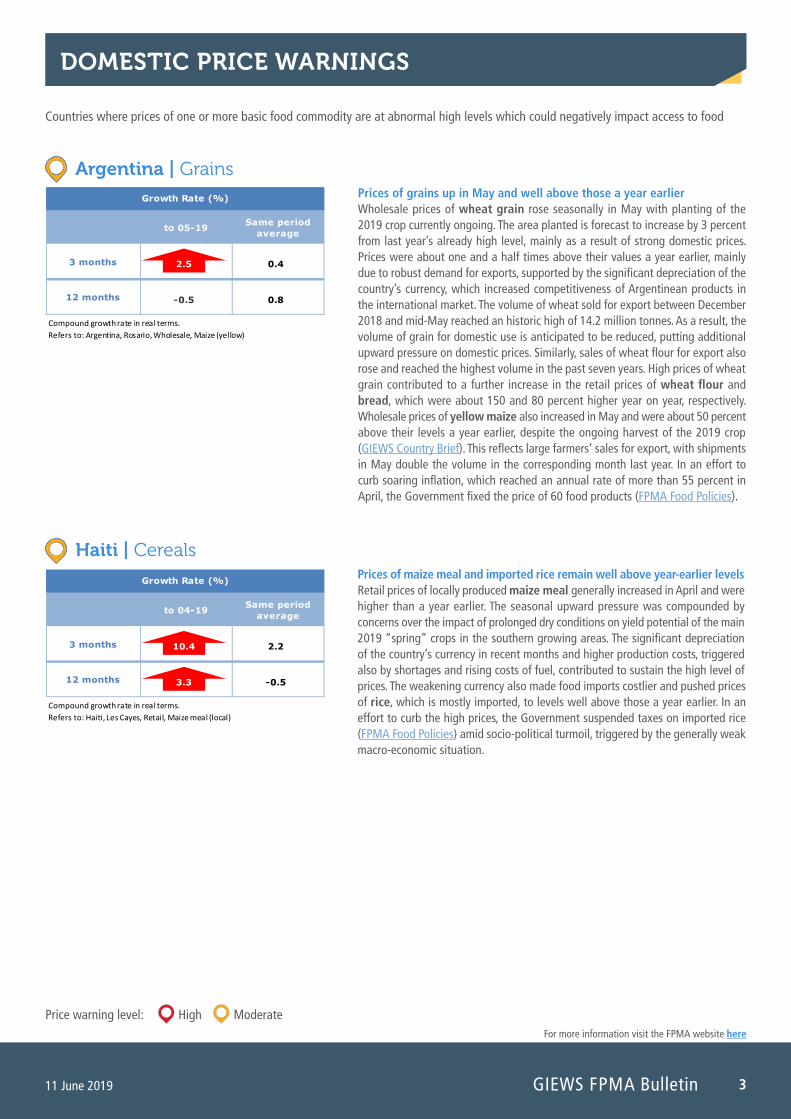
Prices of grains up in May and well above those a year earlier Wholesale prices of wheat grain rose seasonally in May with planting of the 2019 crop currently ongoing. The area planted is forecast to increase by 3 percent from last year’s already high level, mainly as a result of strong domestic prices. Prices were about one and a half times above their values a year earlier, mainly due to robust demand for exports, supported by the significant depreciation of the country’s currency, which increased competitiveness of Argentinean products in the international market. The volume of wheat sold for export between December 2018 and mid-May reached an historic high of 14.2 million tonnes. As a result, the volume of grain for domestic use is anticipated to be reduced, putting additional upward pressure on domestic prices. Similarly, sales of wheat flour for export also rose and reached the highest volume in the past seven years. High prices of wheat grain contributed to a further increase in the retail prices of wheat flour and bread, which were about 150 and 80 percent higher year on year, respectively. Wholesale prices of yellow maize also increased in May and were about 50 percent above their levels a year earlier, despite the ongoing harvest of the 2019 crop (GIEWS Country Brief). This reflects large farmers’ sales for export, with shipments in May double the volume in the corresponding month last year. In an effort to curb soaring inflation, which reached an annual rate of more than 55 percent in April, the Government fixed the price of 60 food products (FPMA Food Policies).
Argentina | Grains
Countries where prices of one or more basic food commodity are at abnormal high levels which could negatively impact access to food
Haiti | Cereals Prices of maize meal and imported rice remain well above year-earlier levels Retail prices of locally produced maize meal generally increased in April and were higher than a year earlier. The seasonal upward pressure was compounded by concerns over the impact of prolonged dry conditions on yield potential of the main 2019 “spring” crops in the southern growing areas. The significant depreciation of the country’s currency in recent months and higher production costs, triggered also by shortages and rising costs of fuel, contributed to sustain the high level of prices. The weakening currency also made food imports costlier and pushed prices of rice, which is mostly imported, to levels well above those a year earlier. In an effort to curb the high prices, the Government suspended taxes on imported rice (FPMA Food Policies) amid socio-political turmoil, triggered by the generally weak macro-economic situation.
to 05-19 Same periodaverage
3 months
12 months
Growth Rate (%)
-0.5
2.5
Compound growth rate in real terms.Refers to: Argentina, Rosario, Wholesale, Maize (yellow)
0.4
0.8
to 04-19 Same periodaverage
3 months
12 months
Growth Rate (%)
3.3
10.4
Compound growth rate in real terms.Refers to: Haiti, Les Cayes, Retail, Maize meal (local)
2.2
-0.5
Price warning level: High Moderate
4 11 June 2019
For more information visit the FPMA website here
GIEWS FPMA Bulletin
DOMESTIC PRICE WARNINGS cont’d
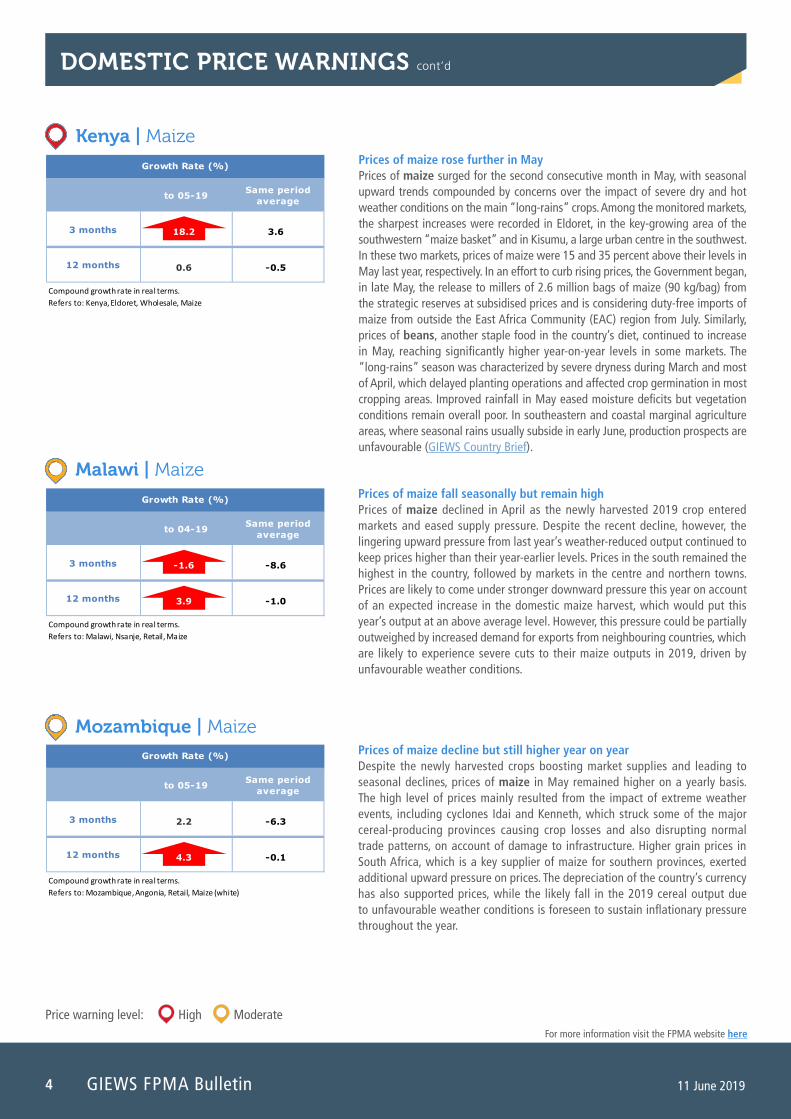
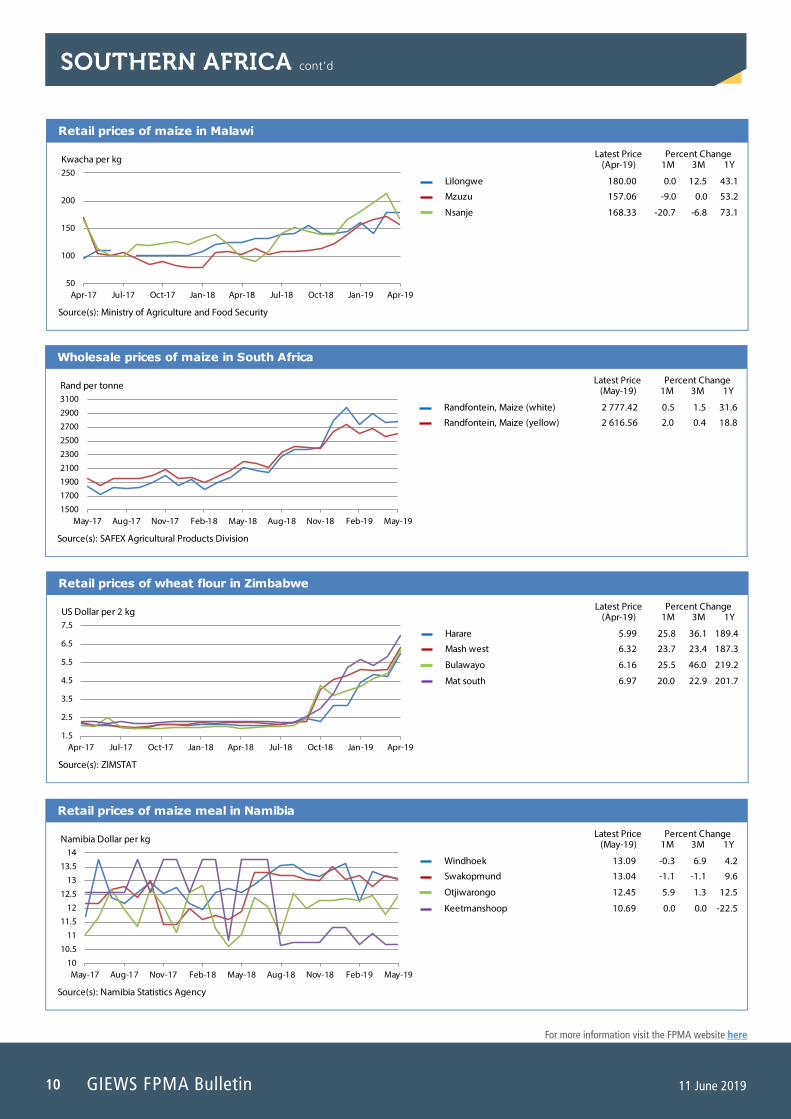
Malawi | MaizePrices of maize fall seasonally but remain high Prices of maize declined in April as the newly harvested 2019 crop entered markets and eased supply pressure. Despite the recent decline, however, the lingering upward pressure from last year’s weather-reduced output continued to keep prices higher than their year-earlier levels. Prices in the south remained the highest in the country, followed by markets in the centre and northern towns. Prices are likely to come under stronger downward pressure this year on account of an expected increase in the domestic maize harvest, which would put this year’s output at an above average level. However, this pressure could be partially outweighed by increased demand for exports from neighbouring countries, which are likely to experience severe cuts to their maize outputs in 2019, driven by unfavourable weather conditions.
Mozambique | MaizePrices of maize decline but still higher year on year Despite the newly harvested crops boosting market supplies and leading to seasonal declines, prices of maize in May remained higher on a yearly basis. The high level of prices mainly resulted from the impact of extreme weather events, including cyclones Idai and Kenneth, which struck some of the major cereal-producing provinces causing crop losses and also disrupting normal trade patterns, on account of damage to infrastructure. Higher grain prices in South Africa, which is a key supplier of maize for southern provinces, exerted additional upward pressure on prices. The depreciation of the country’s currency has also supported prices, while the likely fall in the 2019 cereal output due to unfavourable weather conditions is foreseen to sustain inflationary pressure throughout the year.
to 04-19 Same periodaverage
3 months
12 months
Growth Rate (%)
3.9
-1.6
Compound growth rate in real terms.Refers to: Malawi, Nsanje, Retail, Maize
-8.6
-1.0
to 05-19 Same periodaverage
3 months
12 months
Growth Rate (%)
4.3
2.2
Compound growth rate in real terms.Refers to: Mozambique, Angonia, Retail, Maize (white)
-6.3
-0.1
Kenya | Maize Prices of maize rose further in May Prices of maize surged for the second consecutive month in May, with seasonal upward trends compounded by concerns over the impact of severe dry and hot weather conditions on the main “long-rains” crops. Among the monitored markets, the sharpest increases were recorded in Eldoret, in the key-growing area of the southwestern “maize basket” and in Kisumu, a large urban centre in the southwest. In these two markets, prices of maize were 15 and 35 percent above their levels in May last year, respectively. In an effort to curb rising prices, the Government began, in late May, the release to millers of 2.6 million bags of maize (90 kg/bag) from the strategic reserves at subsidised prices and is considering duty-free imports of maize from outside the East Africa Community (EAC) region from July. Similarly, prices of beans, another staple food in the country’s diet, continued to increase in May, reaching significantly higher year-on-year levels in some markets. The “long-rains” season was characterized by severe dryness during March and most of April, which delayed planting operations and affected crop germination in most cropping areas. Improved rainfall in May eased moisture deficits but vegetation conditions remain overall poor. In southeastern and coastal marginal agriculture areas, where seasonal rains usually subside in early June, production prospects are unfavourable (GIEWS Country Brief).
to 05-19 Same periodaverage
3 months
12 months
Growth Rate (%)
0.6
18.2
Compound growth rate in real terms.Refers to: Kenya, Eldoret, Wholesale, Maize
3.6
-0.5
5
For more information visit the FPMA website here
11 June 2019 GIEWS FPMA Bulletin
DOMESTIC PRICE WARNINGS cont’d
Price warning level: High Moderate
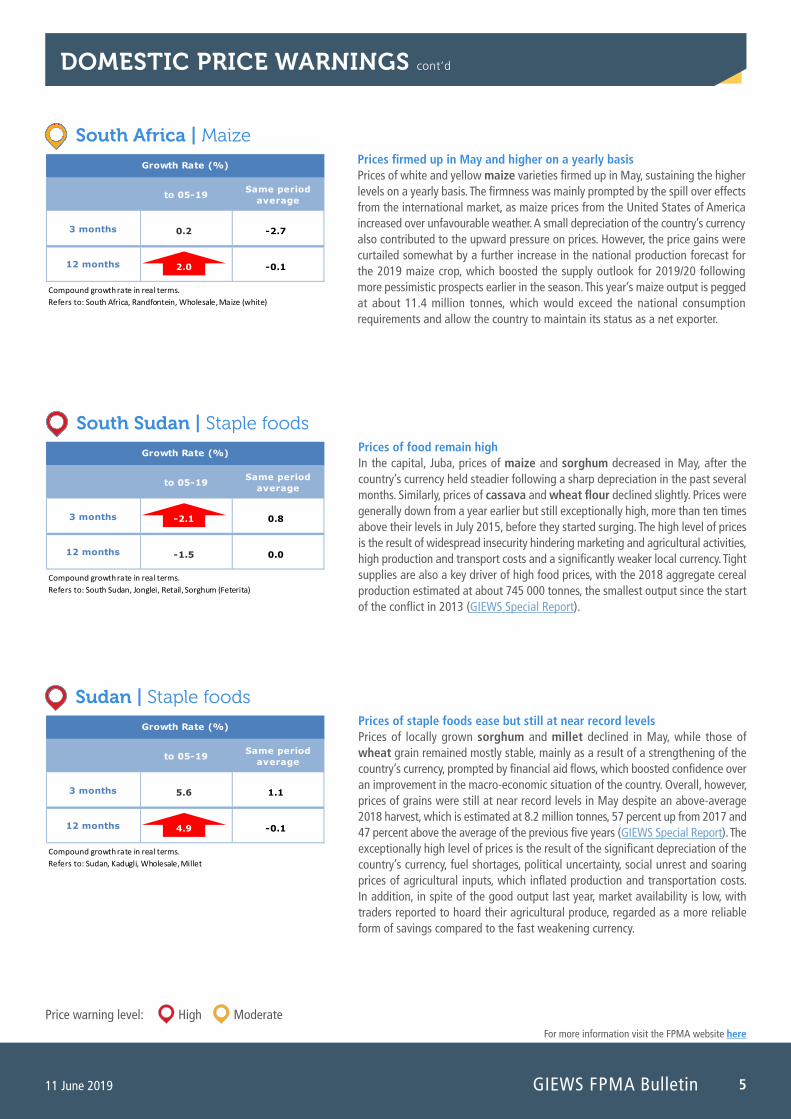
South Sudan | Staple foodsPrices of food remain high In the capital, Juba, prices of maize and sorghum decreased in May, after the country’s currency held steadier following a sharp depreciation in the past several months. Similarly, prices of cassava and wheat flour declined slightly. Prices were generally down from a year earlier but still exceptionally high, more than ten times above their levels in July 2015, before they started surging. The high level of prices is the result of widespread insecurity hindering marketing and agricultural activities, high production and transport costs and a significantly weaker local currency. Tight supplies are also a key driver of high food prices, with the 2018 aggregate cereal production estimated at about 745 000 tonnes, the smallest output since the start of the conflict in 2013 (GIEWS Special Report).
to 05-19 Same periodaverage
3 months
12 months
Growth Rate (%)
-1.5
-2.1
Compound growth rate in real terms.Refers to: South Sudan, Jonglei, Retail, Sorghum (Feterita)
0.8
0.0
South Africa | Maize Prices firmed up in May and higher on a yearly basis Prices of white and yellow maize varieties firmed up in May, sustaining the higher levels on a yearly basis. The firmness was mainly prompted by the spill over effects from the international market, as maize prices from the United States of America increased over unfavourable weather. A small depreciation of the country’s currency also contributed to the upward pressure on prices. However, the price gains were curtailed somewhat by a further increase in the national production forecast for the 2019 maize crop, which boosted the supply outlook for 2019/20 following more pessimistic prospects earlier in the season. This year’s maize output is pegged at about 11.4 million tonnes, which would exceed the national consumption requirements and allow the country to maintain its status as a net exporter.
to 05-19 Same periodaverage
3 months
12 months
Growth Rate (%)
2.0
0.2
Compound growth rate in real terms.Refers to: South Africa, Randfontein, Wholesale, Maize (white)
-2.7
-0.1
Sudan | Staple foods Prices of staple foods ease but still at near record levels Prices of locally grown sorghum and millet declined in May, while those of wheat grain remained mostly stable, mainly as a result of a strengthening of the country’s currency, prompted by financial aid flows, which boosted confidence over an improvement in the macro-economic situation of the country. Overall, however, prices of grains were still at near record levels in May despite an above-average 2018 harvest, which is estimated at 8.2 million tonnes, 57 percent up from 2017 and 47 percent above the average of the previous five years (GIEWS Special Report). The exceptionally high level of prices is the result of the significant depreciation of the country’s currency, fuel shortages, political uncertainty, social unrest and soaring prices of agricultural inputs, which inflated production and transportation costs. In addition, in spite of the good output last year, market availability is low, with traders reported to hoard their agricultural produce, regarded as a more reliable form of savings compared to the fast weakening currency.
to 05-19 Same periodaverage
3 months
12 months
Growth Rate (%)
4.9
5.6
Compound growth rate in real terms.Refers to: Sudan, Kadugli, Wholesale, Millet
1.1
-0.1

6 11 June 2019
For more information visit the FPMA website here
GIEWS FPMA Bulletin
Zimbabwe | CerealsPrice increases of cereals accelerated in April Prices of cereals spiked in April, reinforcing the significantly higher year on year levels. In the capital, Harare, prices of bread, rice and wheat flour in April were more than 150 percent above their year-earlier levels, while prices of maize meal were 60 percent higher. The recent spike follows an upward adjustment to the prices set by the milling industry, reflecting the continuing currency weakness that raised production and distribution costs. In addition, the poor prospects for the 2019 cereal crop, driven by dry weather conditions, exerted additional pressure on prices, while the reduced domestic harvest is likely to sustain the high level of prices this year. A recent upward revision to the fuel price of approximately 50 percent is expected to accentuate inflationary pressure and could prompt further hikes to food prices. The year-on-year general inflation rate averaged nearly 76 percent in April, up from 67 percent in March.
to 04-19 Same periodaverage
3 months
12 months
Growth Rate (%)
5.1
9.3
Compound growth rate in real terms.Refers to: Zimbabwe, Bulawayo, Retail, Wheat (flour)
-0.5
-0.1
Zambia | Maize Maize prices declined seasonally but remained at near record highs Prices of maize grain declined seasonally in May but remained at near record levels, while prices of maize meal products increased further but at a slower rate than in the previous months. The significantly higher year on year prices are the result of tighter domestic supplies due to last year’s reduced cereal output and impact of dry weather on this year’s maize crop, which is expected to result in a second successive below average harvest. In addition, the depreciation of the country’s currency in 2019 has driven up fuel and transportation costs, exerting further upward pressure on prices. In an effort to temper further price hikes, the Government instructed the state Food Reserve Agency (FRA) to increase sales of subsidized grain in April and reintroduced a suspension on maize grain and maize meal exports that was lifted in early March. The newly harvested 2019 crops are expected to ease the supply constraints and instigate further declines in June and July.
to 05-19 Same periodaverage
3 months
12 months
Growth Rate (%)
2.9
4.8
Compound growth rate in real terms.Refers to: Zambia, National Average, Retail, White roller maize meal
-0.4
-0.4
DOMESTIC PRICE WARNINGS cont’d
Uganda | Maize Prices of maize rose further in May but at a slower rate Prices of maize continued to increase in May but at a slower rate than in April. Improved precipitation benefiting vegetation conditions and crop prospects eased concerns over the impact of severe dryness on first season crops and limited the upward pressure on prices. Prices, however, remained well above those a year earlier. Similarly, prices of beans rose in May but to a lesser extent than in the previous month and were higher than their year-earlier levels. Exceptionally dry conditions in March and most of April delayed planting by more than one month and severely affected crop germination and establishment. Although improved rains in late April and May lifted crop prospects, vegetation conditions remained poor in several areas and the harvest is expected to be 30-50 percent below average, depending on the performance of late season rains in June. The country is a key cereal exporter in the subregion and the expected production shortfall is likely to result in lower exports to neighbouring countries.
to 05-19 Same periodaverage
3 months
12 months
Growth Rate (%)
4.3
11.9
Compound growth rate in real terms.Refers to: Uganda, Lira, Wholesale, Maize
6.0
-0.4
7
For more information visit the FPMA website here
11 June 2019 GIEWS FPMA Bulletin
WEST AFRICA
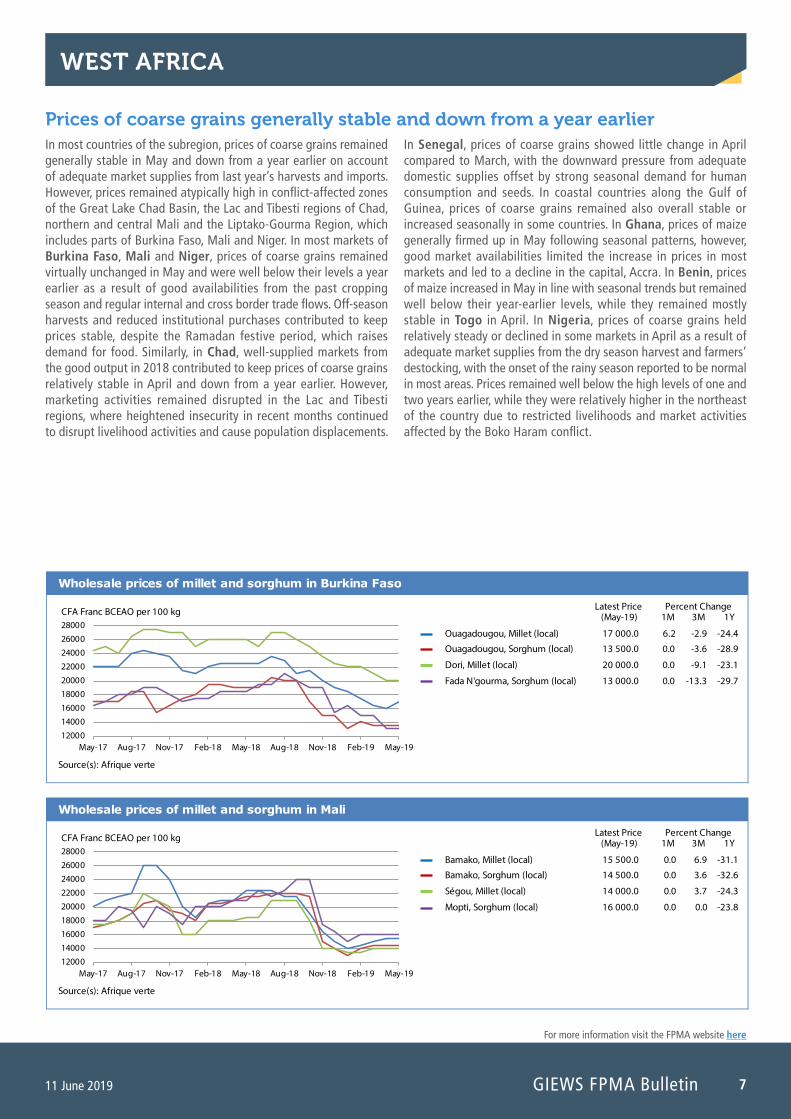
Prices of coarse grains generally stable and down from a year earlier In most countries of the subregion, prices of coarse grains remained generally stable in May and down from a year earlier on account of adequate market supplies from last year’s harvests and imports. However, prices remained atypically high in conflict-affected zones of the Great Lake Chad Basin, the Lac and Tibesti regions of Chad, northern and central Mali and the Liptako-Gourma Region, which includes parts of Burkina Faso, Mali and Niger. In most markets of Burkina Faso, Mali and Niger, prices of coarse grains remained virtually unchanged in May and were well below their levels a year earlier as a result of good availabilities from the past cropping season and regular internal and cross border trade flows. Off-season harvests and reduced institutional purchases contributed to keep prices stable, despite the Ramadan festive period, which raises demand for food. Similarly, in Chad, well-supplied markets from the good output in 2018 contributed to keep prices of coarse grains relatively stable in April and down from a year earlier. However, marketing activities remained disrupted in the Lac and Tibesti regions, where heightened insecurity in recent months continued to disrupt livelihood activities and cause population displacements.
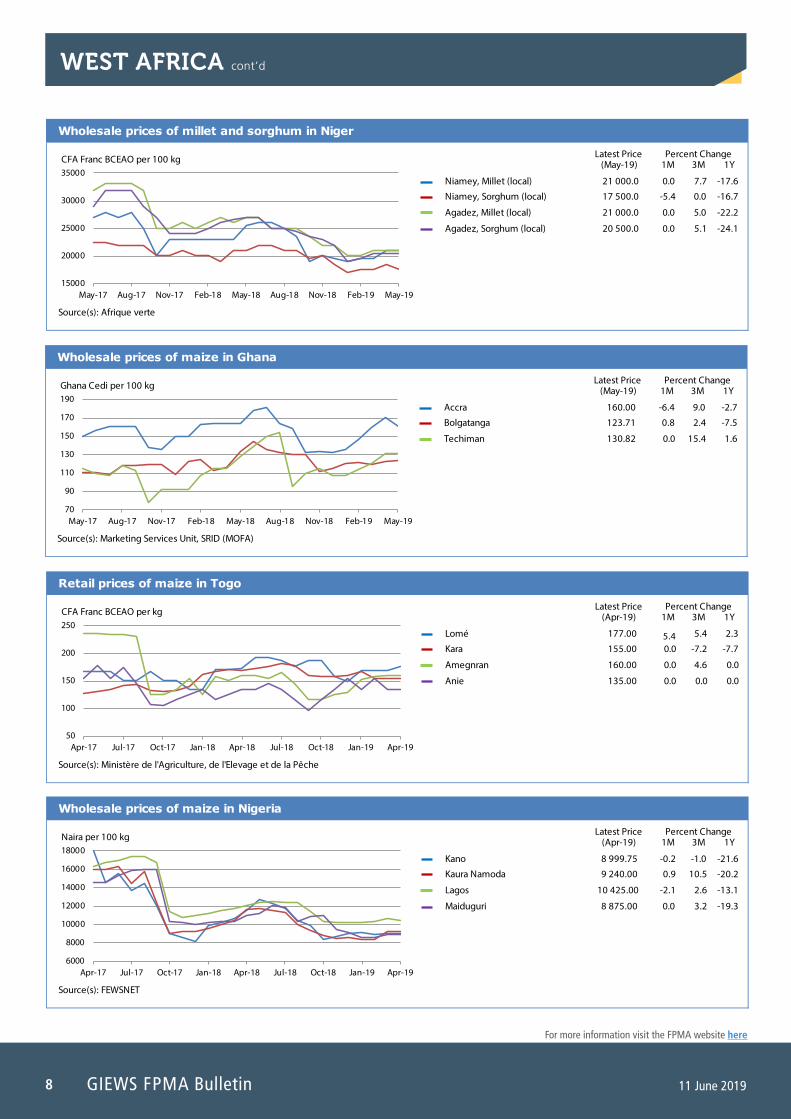
In Senegal, prices of coarse grains showed little change in April compared to March, with the downward pressure from adequate domestic supplies offset by strong seasonal demand for human consumption and seeds. In coastal countries along the Gulf of Guinea, prices of coarse grains remained also overall stable or increased seasonally in some countries. In Ghana, prices of maize generally firmed up in May following seasonal patterns, however, good market availabilities limited the increase in prices in most markets and led to a decline in the capital, Accra. In Benin, prices of maize increased in May in line with seasonal trends but remained well below their year-earlier levels, while they remained mostly stable in Togo in April. In Nigeria, prices of coarse grains held relatively steady or declined in some markets in April as a result of adequate market supplies from the dry season harvest and farmers’ destocking, with the onset of the rainy season reported to be normal in most areas. Prices remained well below the high levels of one and two years earlier, while they were relatively higher in the northeast of the country due to restricted livelihoods and market activities affected by the Boko Haram conflict.
Latest Price(May-19) 1M 3M 1Y
Wholesale prices of millet and sorghum in Burkina Faso
Percent Change
12000
14000
16000
1800020000
22000
24000
26000
28000
May-17 Aug-17 Nov-17 Feb-18 May-18 Aug-18 Nov-18 Feb-19 May-19
Ouagadougou, Millet (local)
Ouagadougou, Sorghum (local)
Dori, Millet (local)
Fada N'gourma, Sorghum (local)
CFA Franc BCEAO per 100 kg
17 000.0
13 500.0
20 000.0
13 000.0
6.2
0.0
0.0
0.0
-2.9
-3.6
-9.1
-13.3
-24.4
-28.9
-23.1
-29.7
Source(s): Afrique verte
Latest Price(May-19) 1M 3M 1Y
Wholesale prices of millet and sorghum in Mali
Percent Change
12000
14000
16000
1800020000
22000
24000
26000
28000
May-17 Aug-17 Nov-17 Feb-18 May-18 Aug-18 Nov-18 Feb-19 May-19
Bamako, Millet (local)
Bamako, Sorghum (local)
Ségou, Millet (local)
Mopti, Sorghum (local)
CFA Franc BCEAO per 100 kg
15 500.0
14 500.0
14 000.0
16 000.0
0.0
0.0
0.0
0.0
6.9
3.6
3.7
0.0
-31.1
-32.6
-24.3
-23.8
Source(s): Afrique verte
GIEWS FPMA Bulletin8 11 June 2019
For more information visit the FPMA website here
Latest Price(May-19) 1M 3M 1Y
Wholesale prices of millet and sorghum in Niger
Percent Change
15000
20000
25000
30000
35000
May-17 Aug-17 Nov-17 Feb-18 May-18 Aug-18 Nov-18 Feb-19 May-19
Niamey, Millet (local)
Niamey, Sorghum (local)
Agadez, Millet (local)
Agadez, Sorghum (local)
CFA Franc BCEAO per 100 kg
21 000.0
17 500.0
21 000.0
20 500.0
0.0
-5.4
0.0
0.0
7.7
0.0
5.0
5.1
-17.6
-16.7
-22.2
-24.1
Source(s): Afrique verte
Latest Price(May-19) 1M 3M 1Y
Wholesale prices of maize in Ghana
Percent Change
70
90
110
130
150
170
190
May-17 Aug-17 Nov-17 Feb-18 May-18 Aug-18 Nov-18 Feb-19 May-19
Accra
Bolgatanga
Techiman
Ghana Cedi per 100 kg
160.00
123.71
130.82
-6.4
0.8
0.0
9.0
2.4
15.4
-2.7
-7.5
1.6
Source(s): Marketing Services Unit, SRID (MOFA)
Latest Price(Apr-19) 1M 3M 1Y
Retail prices of maize in Togo
Percent Change
50
100
150
200
250
Apr-17 Jul-17 Oct-17 Jan-18 Apr-18 Jul-18 Oct-18 Jan-19 Apr-19
Lomé
Kara
Amegnran
Anie
CFA Franc BCEAO per kg
177.00
155.00
160.00
135.00
5.40.0
0.0
0.0
5.4
-7.2
4.6
0.0
2.3
-7.7
0.0
0.0
Source(s): Ministère de l'Agriculture, de l'Elevage et de la Pêche
Latest Price(Apr-19) 1M 3M 1Y
Wholesale prices of maize in Nigeria
Percent Change
6000
8000
10000
12000
14000
16000
18000
Apr-17 Jul-17 Oct-17 Jan-18 Apr-18 Jul-18 Oct-18 Jan-19 Apr-19
Kano
Kaura Namoda
Lagos
Maiduguri
Naira per 100 kg
8 999.75
9 240.00
10 425.00
8 875.00
-0.2
0.9
-2.1
0.0
-1.0
10.5
2.6
3.2
-21.6
-20.2
-13.1
-19.3
Source(s): FEWSNET
WEST AFRICA cont’d
9
For more information visit the FPMA website here
11 June 2019 GIEWS FPMA Bulletin
SOUTHERN AFRICA
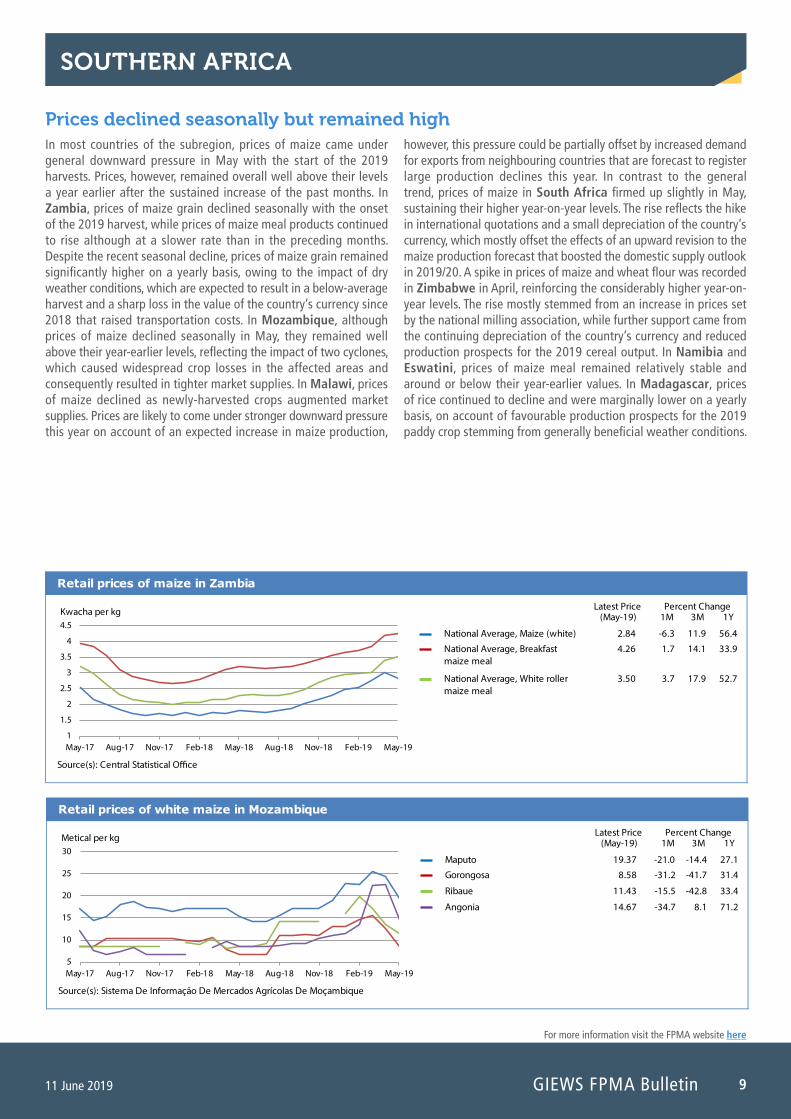
Prices declined seasonally but remained high In most countries of the subregion, prices of maize came under general downward pressure in May with the start of the 2019 harvests. Prices, however, remained overall well above their levels a year earlier after the sustained increase of the past months. In Zambia, prices of maize grain declined seasonally with the onset of the 2019 harvest, while prices of maize meal products continued to rise although at a slower rate than in the preceding months. Despite the recent seasonal decline, prices of maize grain remained significantly higher on a yearly basis, owing to the impact of dry weather conditions, which are expected to result in a below-average harvest and a sharp loss in the value of the country’s currency since 2018 that raised transportation costs. In Mozambique, although prices of maize declined seasonally in May, they remained well above their year-earlier levels, reflecting the impact of two cyclones, which caused widespread crop losses in the affected areas and consequently resulted in tighter market supplies. In Malawi, prices of maize declined as newly-harvested crops augmented market supplies. Prices are likely to come under stronger downward pressure this year on account of an expected increase in maize production,
however, this pressure could be partially offset by increased demand for exports from neighbouring countries that are forecast to register large production declines this year. In contrast to the general trend, prices of maize in South Africa firmed up slightly in May, sustaining their higher year-on-year levels. The rise reflects the hike in international quotations and a small depreciation of the country’s currency, which mostly offset the effects of an upward revision to the maize production forecast that boosted the domestic supply outlook in 2019/20. A spike in prices of maize and wheat flour was recorded in Zimbabwe in April, reinforcing the considerably higher year-on-year levels. The rise mostly stemmed from an increase in prices set by the national milling association, while further support came from the continuing depreciation of the country’s currency and reduced production prospects for the 2019 cereal output. In Namibia and Eswatini, prices of maize meal remained relatively stable and around or below their year-earlier values. In Madagascar, prices of rice continued to decline and were marginally lower on a yearly basis, on account of favourable production prospects for the 2019 paddy crop stemming from generally beneficial weather conditions.
Latest Price(May-19) 1M 3M 1Y
Retail prices of maize in Zambia
Percent Change
1
1.5
2
2.5
3
3.5
4
4.5
May-17 Aug-17 Nov-17 Feb-18 May-18 Aug-18 Nov-18 Feb-19 May-19
National Average, Maize (white)
National Average, Breakfast maize meal
National Average, White roller maize meal
Kwacha per kg
2.84
4.26
3.50
-6.3
1.7
3.7
11.9
14.1
17.9
56.4
33.9
52.7
Source(s): Central Statistical O�ce
Latest Price(May-19) 1M 3M 1Y
Retail prices of white maize in Mozambique
Percent Change
5
10
15
20
25
30
May-17 Aug-17 Nov-17 Feb-18 May-18 Aug-18 Nov-18 Feb-19 May-19
Maputo
Gorongosa
Ribaue
Angonia
Metical per kg
19.37
8.58
11.43
14.67
-21.0
-31.2
-15.5
-34.7
-14.4
-41.7
-42.8
8.1
27.1
31.4
33.4
71.2
Source(s): Sistema De Informação De Mercados Agrícolas De Moçambique
GIEWS FPMA Bulletin10 11 June 2019
For more information visit the FPMA website here
Latest Price(Apr-19) 1M 3M 1Y
Retail prices of maize in Malawi
Percent Change
50
100
150
200
250
Apr-17 Jul-17 Oct-17 Jan-18 Apr-18 Jul-18 Oct-18 Jan-19 Apr-19
Lilongwe
Mzuzu
Nsanje
Kwacha per kg
180.00
157.06
168.33
0.0
-9.0
-20.7
12.5
0.0
-6.8
43.1
53.2
73.1
Source(s): Ministry of Agriculture and Food Security
Latest Price(May-19) 1M 3M 1Y
Wholesale prices of maize in South Africa
Percent Change
1500
1700
1900
21002300
2500
2700
2900
3100
May-17 Aug-17 Nov-17 Feb-18 May-18 Aug-18 Nov-18 Feb-19 May-19
Randfontein, Maize (white)
Randfontein, Maize (yellow)
Rand per tonne
2 777.42
2 616.56
0.5
2.0
1.5
0.4
31.6
18.8
Source(s): SAFEX Agricultural Products Division
SOUTHERN AFRICA cont’d
Latest Price(Apr-19) 1M 3M 1Y
Retail prices of wheat flour in Zimbabwe
Percent Change
1.5
2.5
3.5
4.5
5.5
6.5
7.5
Apr-17 Jul-17 Oct-17 Jan-18 Apr-18 Jul-18 Oct-18 Jan-19 Apr-19
Harare
Mash west
Bulawayo
Mat south
US Dollar per 2 kg
5.99
6.32
6.16
6.97
25.8
23.7
25.5
20.0
36.1
23.4
46.0
22.9
189.4
187.3
219.2
201.7
Source(s): ZIMSTAT
Latest Price(May-19) 1M 3M 1Y
Retail prices of maize meal in Namibia
Percent Change
10
10.5
11
11.512
12.5
13
13.5
14
May-17 Aug-17 Nov-17 Feb-18 May-18 Aug-18 Nov-18 Feb-19 May-19
Windhoek
Swakopmund
Otjiwarongo
Keetmanshoop
Namibia Dollar per kg
13.09
13.04
12.45
10.69
-0.3
-1.1
5.9
0.0
6.9
-1.1
1.3
0.0
4.2
9.6
12.5
-22.5
Source(s): Namibia Statistics Agency
11
For more information visit the FPMA website here
11 June 2019 GIEWS FPMA Bulletin
EAST AFRICA
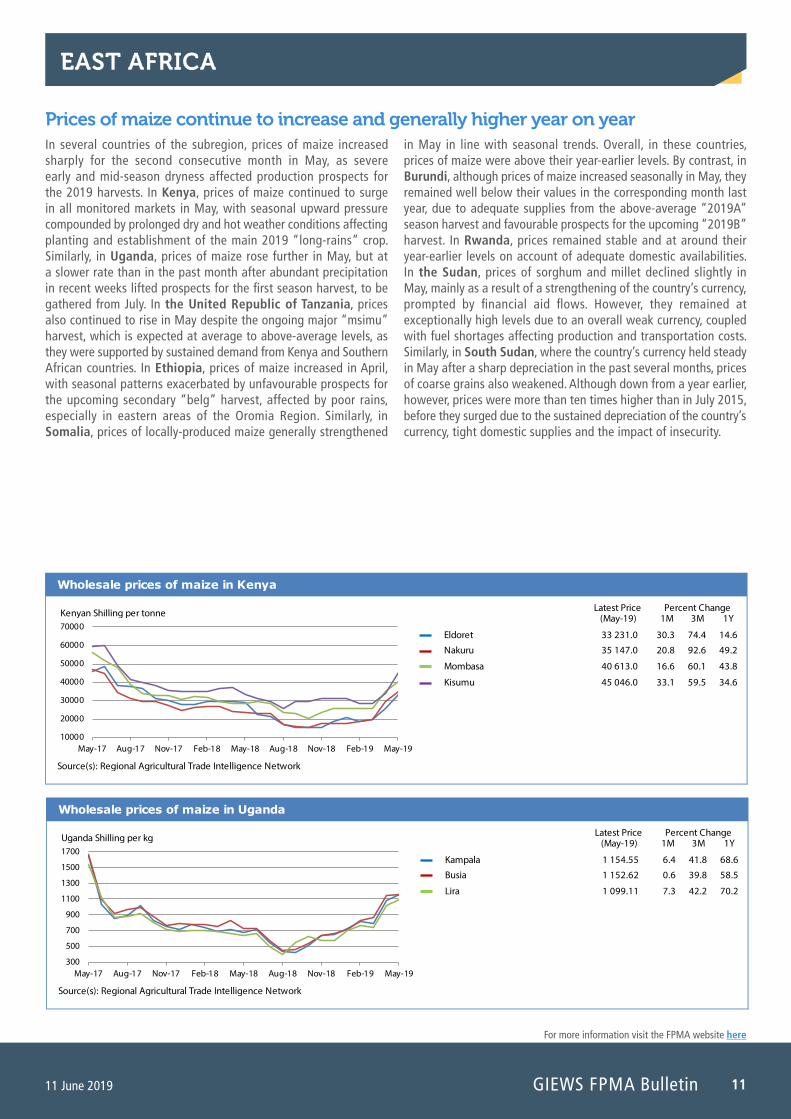
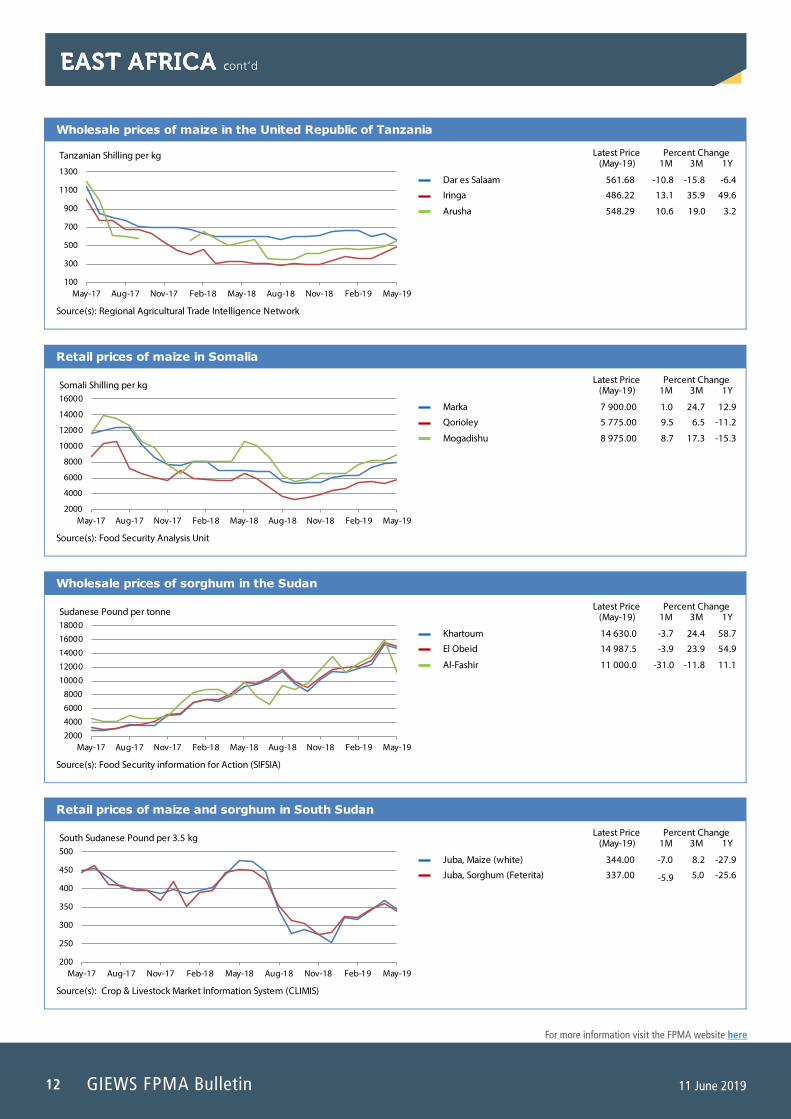
Prices of maize continue to increase and generally higher year on year In several countries of the subregion, prices of maize increased sharply for the second consecutive month in May, as severe early and mid-season dryness affected production prospects for the 2019 harvests. In Kenya, prices of maize continued to surge in all monitored markets in May, with seasonal upward pressure compounded by prolonged dry and hot weather conditions affecting planting and establishment of the main 2019 “long-rains” crop. Similarly, in Uganda, prices of maize rose further in May, but at a slower rate than in the past month after abundant precipitation in recent weeks lifted prospects for the first season harvest, to be gathered from July. In the United Republic of Tanzania, prices also continued to rise in May despite the ongoing major “msimu” harvest, which is expected at average to above-average levels, as they were supported by sustained demand from Kenya and Southern African countries. In Ethiopia, prices of maize increased in April, with seasonal patterns exacerbated by unfavourable prospects for the upcoming secondary “belg” harvest, affected by poor rains, especially in eastern areas of the Oromia Region. Similarly, in Somalia, prices of locally-produced maize generally strengthened
in May in line with seasonal trends. Overall, in these countries, prices of maize were above their year-earlier levels. By contrast, in Burundi, although prices of maize increased seasonally in May, they remained well below their values in the corresponding month last year, due to adequate supplies from the above-average “2019A” season harvest and favourable prospects for the upcoming “2019B” harvest. In Rwanda, prices remained stable and at around their year-earlier levels on account of adequate domestic availabilities. In the Sudan, prices of sorghum and millet declined slightly in May, mainly as a result of a strengthening of the country’s currency, prompted by financial aid flows. However, they remained at exceptionally high levels due to an overall weak currency, coupled with fuel shortages affecting production and transportation costs. Similarly, in South Sudan, where the country’s currency held steady in May after a sharp depreciation in the past several months, prices of coarse grains also weakened. Although down from a year earlier, however, prices were more than ten times higher than in July 2015, before they surged due to the sustained depreciation of the country’s currency, tight domestic supplies and the impact of insecurity.
Latest Price(May-19) 1M 3M 1Y
Wholesale prices of maize in Uganda
Percent Change
300
500
700
900
1100
1300
1500
1700
May-17 Aug-17 Nov-17 Feb-18 May-18 Aug-18 Nov-18 Feb-19 May-19
Kampala
Busia
Lira
Uganda Shilling per kg
1 154.55
1 152.62
1 099.11
6.4
0.6
7.3
41.8
39.8
42.2
68.6
58.5
70.2
Source(s): Regional Agricultural Trade Intelligence Network
Latest Price(May-19) 1M 3M 1Y
Wholesale prices of maize in Kenya
Percent Change
10000
20000
30000
40000
50000
60000
70000
May-17 Aug-17 Nov-17 Feb-18 May-18 Aug-18 Nov-18 Feb-19 May-19
Eldoret
Nakuru
Mombasa
Kisumu
Kenyan Shilling per tonne
33 231.0
35 147.0
40 613.0
45 046.0
30.3
20.8
16.6
33.1
74.4
92.6
60.1
59.5
14.6
49.2
43.8
34.6
Source(s): Regional Agricultural Trade Intelligence Network
GIEWS FPMA Bulletin12 11 June 2019
For more information visit the FPMA website here
EAST AFRICA cont’dEAST AFRICA c
Latest Price(May-19) 1M 3M 1Y
Wholesale prices of maize in the United Republic of Tanzania
Percent Change
100
300
500
700
900
1100
1300
May-17 Aug-17 Nov-17 Feb-18 May-18 Aug-18 Nov-18 Feb-19 May-19
Dar es Salaam
Iringa
Arusha
Tanzanian Shilling per kg
561.68
486.22
548.29
-10.8
13.1
10.6
-15.8
35.9
19.0
-6.4
49.6
3.2
Source(s): Regional Agricultural Trade Intelligence Network
Latest Price(May-19) 1M 3M 1Y
Retail prices of maize in Somalia
Percent Change
2000
4000
6000
8000
10000
12000
14000
16000
May-17 Aug-17 Nov-17 Feb-18 May-18 Aug-18 Nov-18 Feb-19 May-19
Marka
Qorioley
Mogadishu
Somali Shilling per kg
7 900.00
5 775.00
8 975.00
1.0
9.5
8.7
24.7
6.5
17.3
12.9
-11.2
-15.3
Source(s): Food Security Analysis Unit
Latest Price(May-19) 1M 3M 1Y
Wholesale prices of sorghum in the Sudan
Percent Change
2000
4000
6000
800010000
12000
14000
16000
18000
May-17 Aug-17 Nov-17 Feb-18 May-18 Aug-18 Nov-18 Feb-19 May-19
Khartoum
El Obeid
Al-Fashir
Sudanese Pound per tonne
14 630.0
14 987.5
11 000.0
-3.7
-3.9
-31.0
24.4
23.9
-11.8
58.7
54.9
11.1
Source(s): Food Security information for Action (SIFSIA)
Latest Price(May-19) 1M 3M 1Y
Retail prices of maize and sorghum in South Sudan
Percent Change
200
250
300
350
400
450
500
May-17 Aug-17 Nov-17 Feb-18 May-18 Aug-18 Nov-18 Feb-19 May-19
Juba, Maize (white)
Juba, Sorghum (Feterita)
South Sudanese Pound per 3.5 kg
344.00
337.00
-7.0
-5.9
8.2
5.0
-27.9
-25.6
Source(s): Crop & Livestock Market Information System (CLIMIS)

13
For more information visit the FPMA website here
11 June 2019 GIEWS FPMA Bulletin
EAST ASIA
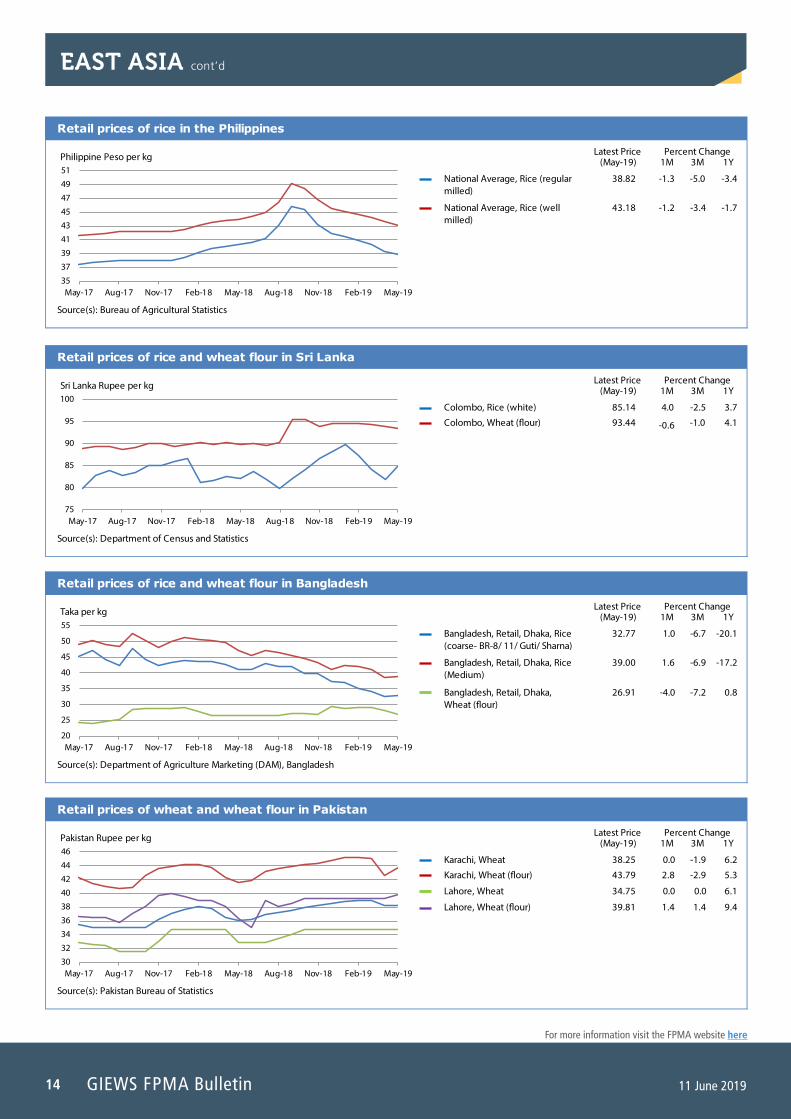
Prices of rice under downward pressure in May, while those of wheat generally decreased In most countries of the subregion, prices of rice in May were pressured downwards by improved supplies from the ongoing or recently-concluded paddy harvests. In exporting countries, overall weak export demand also weighed on prices. This was the case in Thailand and Myanmar, where improved supplies from the bumper 2019 secondary season harvests and a general slowdown in exports pressured prices downward. In Viet Nam, prices declined in the second half of the month with the start of the “summer-autumn” harvest. In India, prices remained relatively stable despite good domestic availabilities in the market, due to large Government procurement purchases. According to official estimates, as of 27 May, some 62 million tonnes of paddy was procured, representing about one-third of the country’s annual rice production. In Cambodia, prices of rice were mixed in May, they decreased or remained stable in most markets but spiked in the key producing province of Battambang, mainly reflecting concerns about the impact of dry weather conditions on the 2019 main season crops and strong exports. In China (Mainland), the subregion’s main producer, prices of rice remained generally stable or weakened and were close to their year-earlier levels, reflecting ample availabilities from the 2018 output and large carryover stocks. In the Philippines, prices eased for the eighth consecutive month in May as a result of improved supplies from the recently-concluded 2018/19 secondary paddy
harvest, estimated at a bumper level, and high imports. Prices increased seasonally in Sri Lanka, while in Bangladesh they firmed up but remained at a low level, following steady decreases registered since August 2018. The low level of prices pushed the Government to increase the import duties (FPMA Food Policies) and to lift a long-standing ban on exports. With regard to wheat grain and wheat flour, prices were generally stable or decreased in May, with the incoming supplies from the ongoing 2019 harvests, estimated at a bumper level in most countries. In China (Mainland), the subregion’s main producer, prices of wheat in May mostly declined with the onset of the 2019 harvest, forecast at an above-average level, and ample domestic supplies. In India, the ongoing large Government procurement purchases, which reached 33.2 million tonnes (more than one-third of country’s annual production), continued to offset the downward pressure from the record 2019 harvest, recently concluded. In Pakistan, prices of wheat grain and wheat flour remained relatively stable and higher than a year earlier, despite the ongoing harvest, due to strong exports and concerns over weather-induced crop damage in the key producing areas. In importing countries, prices of wheat flour decreased in Bangladesh and in Sri Lanka, reflecting high imports in recent months, while in Afghanistan, prices increased and were higher than a year earlier due to stronger export quotations from neighbouring countries.
Latest Price(May-19) 1M 3M 1Y
Wholesale prices of rice in Thailand
Percent Change
10
11
12
13
14
15
May-17 Aug-17 Nov-17 Feb-18 May-18 Aug-18 Nov-18 Feb-19 May-19
Bangkok, Rice (5% broken)
Bangkok, Rice (25% broken)
Baht per kg
11.65
10.95
-0.5
-1.0
2.1
2.2
-9.7
-9.6
Source(s): Department of Internal Trade, Ministry of Commerce
Latest Price(May-19) 1M 3M 1Y
Wholesale prices of rice in China (Mainland)
Percent Change
3500
3700
3900
4100
4300
4500
May-17 Aug-17 Nov-17 Feb-18 May-18 Aug-18 Nov-18 Feb-19 May-19
Hangzhou, Rice (Indica)
Hubei, Rice (Indica)
Jiujiang, Rice (Indica)
National Average, Rice (Indica)
Yuan Renminbi per tonne
4 272.00
4 016.00
3 960.00
3 919.20
-0.9
-1.3
0.0
-0.8
-1.6
-1.1
0.0
-0.9
4.4
-1.8
1.9
-1.5
Source(s): CnAgri - China Agriculture Consultant
GIEWS FPMA Bulletin14 11 June 2019
For more information visit the FPMA website here
EAST ASIA cont’d
Latest Price(May-19) 1M 3M 1Y
Retail prices of rice in the Philippines
Percent Change
35
37
39
4143
45
47
49
51
May-17 Aug-17 Nov-17 Feb-18 May-18 Aug-18 Nov-18 Feb-19 May-19
National Average, Rice (regular milled)
National Average, Rice (well milled)
Philippine Peso per kg
38.82
43.18
-1.3
-1.2
-5.0
-3.4
-3.4
-1.7
Source(s): Bureau of Agricultural Statistics
Latest Price(May-19) 1M 3M 1Y
Retail prices of rice and wheat flour in Sri Lanka
Percent Change
75
80
85
90
95
100
May-17 Aug-17 Nov-17 Feb-18 May-18 Aug-18 Nov-18 Feb-19 May-19
Colombo, Rice (white)
Colombo, Wheat (�our)
Sri Lanka Rupee per kg
85.14
93.44
4.0
-0.6
-2.5
-1.0
3.7
4.1
Source(s): Department of Census and Statistics
Latest Price(May-19) 1M 3M 1Y
Retail prices of rice and wheat flour in Bangladesh
Percent Change
20
25
30
35
40
45
50
55
May-17 Aug-17 Nov-17 Feb-18 May-18 Aug-18 Nov-18 Feb-19 May-19
Bangladesh, Retail, Dhaka, Rice (coarse- BR-8/ 11/ Guti/ Sharna)
Bangladesh, Retail, Dhaka, Rice (Medium)
Bangladesh, Retail, Dhaka, Wheat (�our)
Taka per kg
32.77
39.00
26.91
1.0
1.6
-4.0
-6.7
-6.9
-7.2
-20.1
-17.2
0.8
Source(s): Department of Agriculture Marketing (DAM), Bangladesh
Latest Price(May-19) 1M 3M 1Y
Retail prices of wheat and wheat flour in Pakistan
Percent Change
30
32
34
3638
40
42
44
46
May-17 Aug-17 Nov-17 Feb-18 May-18 Aug-18 Nov-18 Feb-19 May-19
Karachi, Wheat
Karachi, Wheat (�our)
Lahore, Wheat
Lahore, Wheat (�our)
Pakistan Rupee per kg
38.25
43.79
34.75
39.81
0.0
2.8
0.0
1.4
-1.9
-2.9
0.0
1.4
6.2
5.3
6.1
9.4
Source(s): Pakistan Bureau of Statistics
15
For more information visit the FPMA website here
11 June 2019 GIEWS FPMA Bulletin
CIS - ASIA AND EUROPE
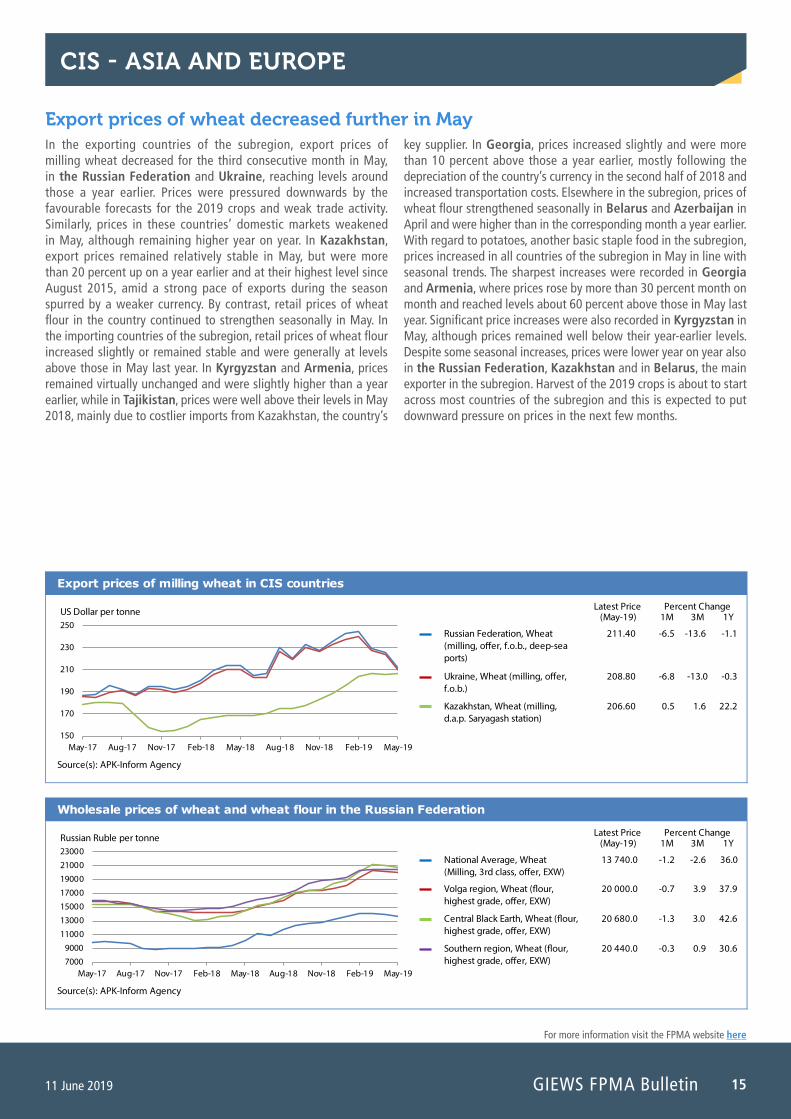
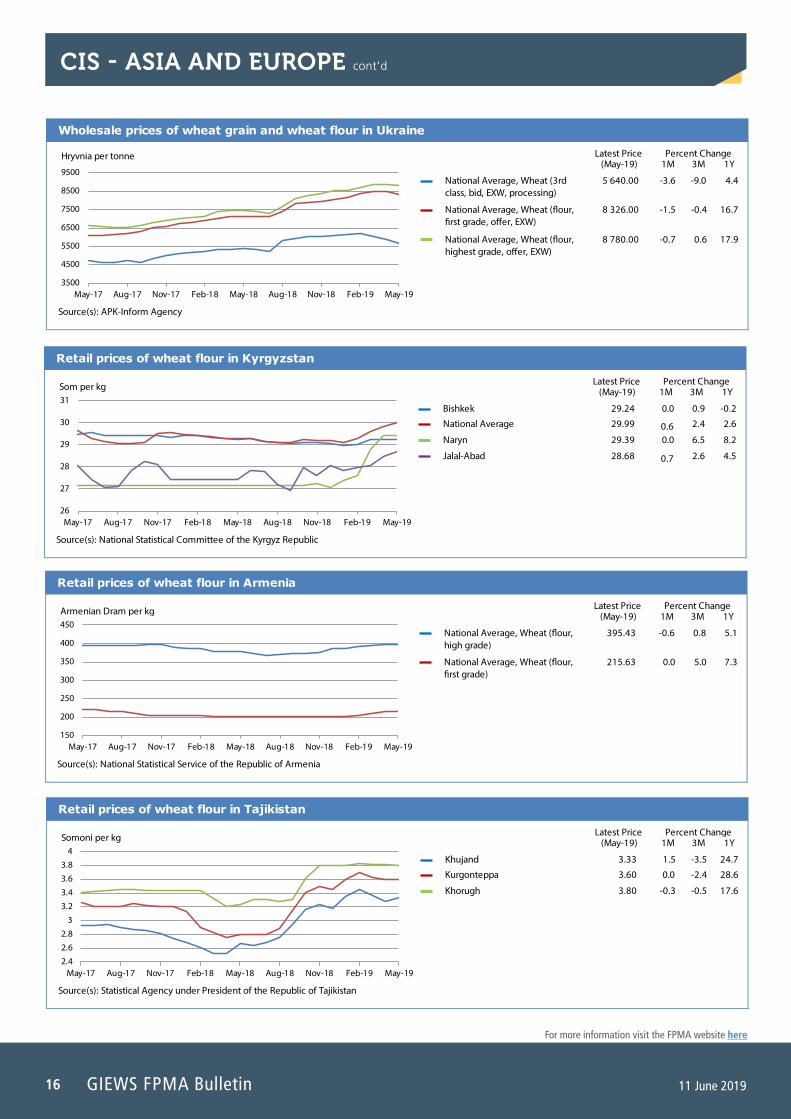
Export prices of wheat decreased further in May In the exporting countries of the subregion, export prices of milling wheat decreased for the third consecutive month in May, in the Russian Federation and Ukraine, reaching levels around those a year earlier. Prices were pressured downwards by the favourable forecasts for the 2019 crops and weak trade activity. Similarly, prices in these countries’ domestic markets weakened in May, although remaining higher year on year. In Kazakhstan, export prices remained relatively stable in May, but were more than 20 percent up on a year earlier and at their highest level since August 2015, amid a strong pace of exports during the season spurred by a weaker currency. By contrast, retail prices of wheat flour in the country continued to strengthen seasonally in May. In the importing countries of the subregion, retail prices of wheat flour increased slightly or remained stable and were generally at levels above those in May last year. In Kyrgyzstan and Armenia, prices remained virtually unchanged and were slightly higher than a year earlier, while in Tajikistan, prices were well above their levels in May 2018, mainly due to costlier imports from Kazakhstan, the country’s
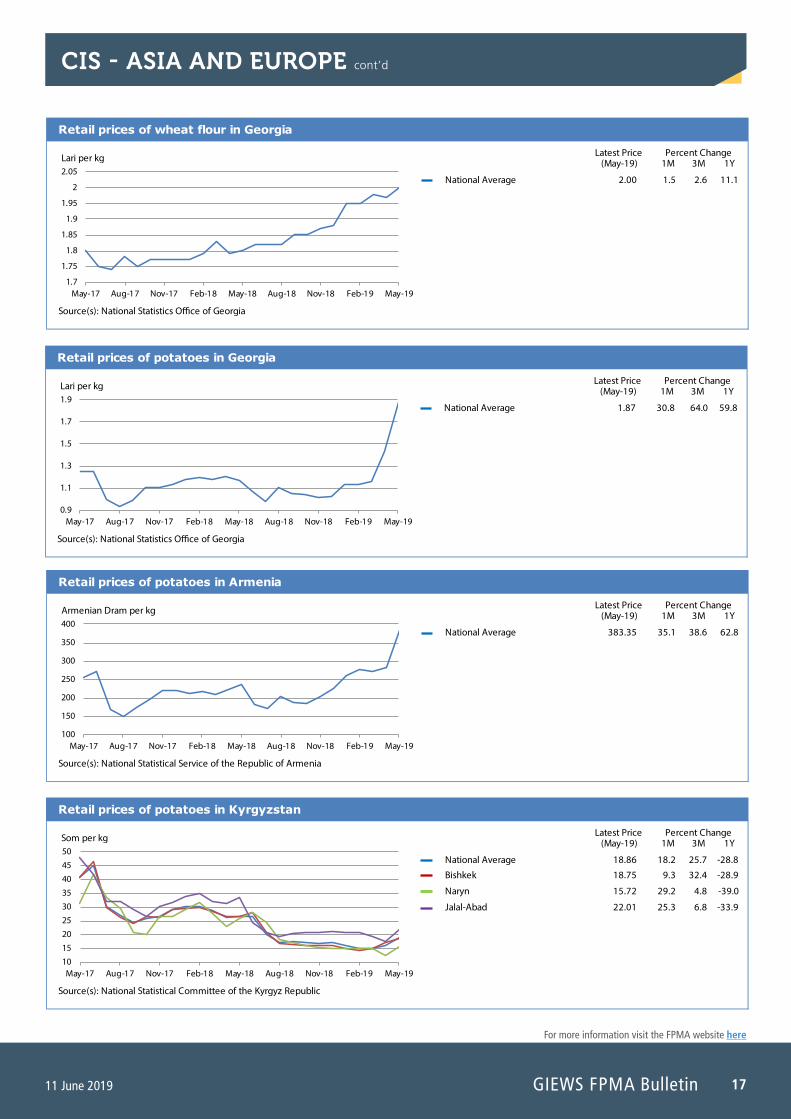
key supplier. In Georgia, prices increased slightly and were more than 10 percent above those a year earlier, mostly following the depreciation of the country’s currency in the second half of 2018 and increased transportation costs. Elsewhere in the subregion, prices of wheat flour strengthened seasonally in Belarus and Azerbaijan in April and were higher than in the corresponding month a year earlier. With regard to potatoes, another basic staple food in the subregion, prices increased in all countries of the subregion in May in line with seasonal trends. The sharpest increases were recorded in Georgia and Armenia, where prices rose by more than 30 percent month on month and reached levels about 60 percent above those in May last year. Significant price increases were also recorded in Kyrgyzstan in May, although prices remained well below their year-earlier levels. Despite some seasonal increases, prices were lower year on year also in the Russian Federation, Kazakhstan and in Belarus, the main exporter in the subregion. Harvest of the 2019 crops is about to start across most countries of the subregion and this is expected to put downward pressure on prices in the next few months.
Latest Price(May-19) 1M 3M 1Y
Wholesale prices of wheat and wheat flour in the Russian Federation
Percent Change
7000
9000
11000
1300015000
17000
19000
21000
23000
May-17 Aug-17 Nov-17 Feb-18 May-18 Aug-18 Nov-18 Feb-19 May-19
National Average, Wheat (Milling, 3rd class, o�er, EXW)
Volga region, Wheat (�our, highest grade, o�er, EXW)
Central Black Earth, Wheat (�our, highest grade, o�er, EXW)
Southern region, Wheat (�our, highest grade, o�er, EXW)
Russian Ruble per tonne
13 740.0
20 000.0
20 680.0
20 440.0
-1.2
-0.7
-1.3
-0.3
-2.6
3.9
3.0
0.9
36.0
37.9
42.6
30.6
Source(s): APK-Inform Agency
Latest Price(May-19) 1M 3M 1Y
Export prices of milling wheat in CIS countries
Percent Change
150
170
190
210
230
250
May-17 Aug-17 Nov-17 Feb-18 May-18 Aug-18 Nov-18 Feb-19 May-19
Russian Federation, Wheat (milling, o�er, f.o.b., deep-sea ports)
Ukraine, Wheat (milling, o�er, f.o.b.)
Kazakhstan, Wheat (milling, d.a.p. Saryagash station)
US Dollar per tonne
211.40
208.80
206.60
-6.5
-6.8
0.5
-13.6
-13.0
1.6
-1.1
-0.3
22.2
Source(s): APK-Inform Agency
GIEWS FPMA Bulletin16 11 June 2019
For more information visit the FPMA website here
CIS - ASIA AND EUROPE cont’d
Latest Price(May-19) 1M 3M 1Y
Retail prices of wheat flour in Armenia
Percent Change
150
200
250
300
350
400
450
May-17 Aug-17 Nov-17 Feb-18 May-18 Aug-18 Nov-18 Feb-19 May-19
National Average, Wheat (�our, high grade)
National Average, Wheat (�our, �rst grade)
Armenian Dram per kg
395.43
215.63
-0.6
0.0
0.8
5.0
5.1
7.3
Source(s): National Statistical Service of the Republic of Armenia
Latest Price(May-19) 1M 3M 1Y
Retail prices of wheat flour in Tajikistan
Percent Change
2.4
2.6
2.8
33.2
3.4
3.6
3.8
4
May-17 Aug-17 Nov-17 Feb-18 May-18 Aug-18 Nov-18 Feb-19 May-19
Khujand
Kurgonteppa
Khorugh
Somoni per kg
3.33
3.60
3.80
1.5
0.0
-0.3
-3.5
-2.4
-0.5
24.7
28.6
17.6
Source(s): Statistical Agency under President of the Republic of Tajikistan
Latest Price(May-19) 1M 3M 1Y
Wholesale prices of wheat grain and wheat flour in Ukraine
Percent Change
3500
4500
5500
6500
7500
8500
9500
May-17 Aug-17 Nov-17 Feb-18 May-18 Aug-18 Nov-18 Feb-19 May-19
National Average, Wheat (3rd class, bid, EXW, processing)
National Average, Wheat (�our, �rst grade, o�er, EXW)
National Average, Wheat (�our, highest grade, o�er, EXW)
Hryvnia per tonne
5 640.00
8 326.00
8 780.00
-3.6
-1.5
-0.7
-9.0
-0.4
0.6
4.4
16.7
17.9
Source(s): APK-Inform Agency
Latest Price(May-19) 1M 3M 1Y
Retail prices of wheat flour in Kyrgyzstan
Percent Change
26
27
28
29
30
31
May-17 Aug-17 Nov-17 Feb-18 May-18 Aug-18 Nov-18 Feb-19 May-19
Bishkek
National Average
Naryn
Jalal-Abad
Som per kg
29.24
29.99
29.39
28.68
0.0
0.60.0
0.7
0.9
2.4
6.5
2.6
-0.2
2.6
8.2
4.5
Source(s): National Statistical Committee of the Kyrgyz Republic
17
For more information visit the FPMA website here
11 June 2019 GIEWS FPMA Bulletin
CIS - ASIA AND EUROPE cont’d
Latest Price(May-19) 1M 3M 1Y
Retail prices of potatoes in Armenia
Percent Change
100
150
200
250
300
350
400
May-17 Aug-17 Nov-17 Feb-18 May-18 Aug-18 Nov-18 Feb-19 May-19
National Average
Armenian Dram per kg
383.35 35.1 38.6 62.8
Source(s): National Statistical Service of the Republic of Armenia
Latest Price(May-19) 1M 3M 1Y
Retail prices of wheat flour in Georgia
Percent Change
1.7
1.75
1.8
1.85
1.9
1.95
2
2.05
May-17 Aug-17 Nov-17 Feb-18 May-18 Aug-18 Nov-18 Feb-19 May-19
National Average
Lari per kg
2.00 1.5 2.6 11.1
Source(s): National Statistics O�ce of Georgia
Latest Price(May-19) 1M 3M 1Y
Retail prices of potatoes in Georgia
Percent Change
0.9
1.1
1.3
1.5
1.7
1.9
May-17 Aug-17 Nov-17 Feb-18 May-18 Aug-18 Nov-18 Feb-19 May-19
National Average
Lari per kg
1.87 30.8 64.0 59.8
Source(s): National Statistics O�ce of Georgia
Latest Price(May-19) 1M 3M 1Y
Retail prices of potatoes in Kyrgyzstan
Percent Change
10
15
20
2530
35
40
45
50
May-17 Aug-17 Nov-17 Feb-18 May-18 Aug-18 Nov-18 Feb-19 May-19
National Average
Bishkek
Naryn
Jalal-Abad
Som per kg
18.86
18.75
15.72
22.01
18.2
9.3
29.2
25.3
25.7
32.4
4.8
6.8
-28.8
-28.9
-39.0
-33.9
Source(s): National Statistical Committee of the Kyrgyz Republic
GIEWS FPMA Bulletin18 11 June 2019
For more information visit the FPMA website here
CENTRAL AMERICA AND THE CARIBBEAN
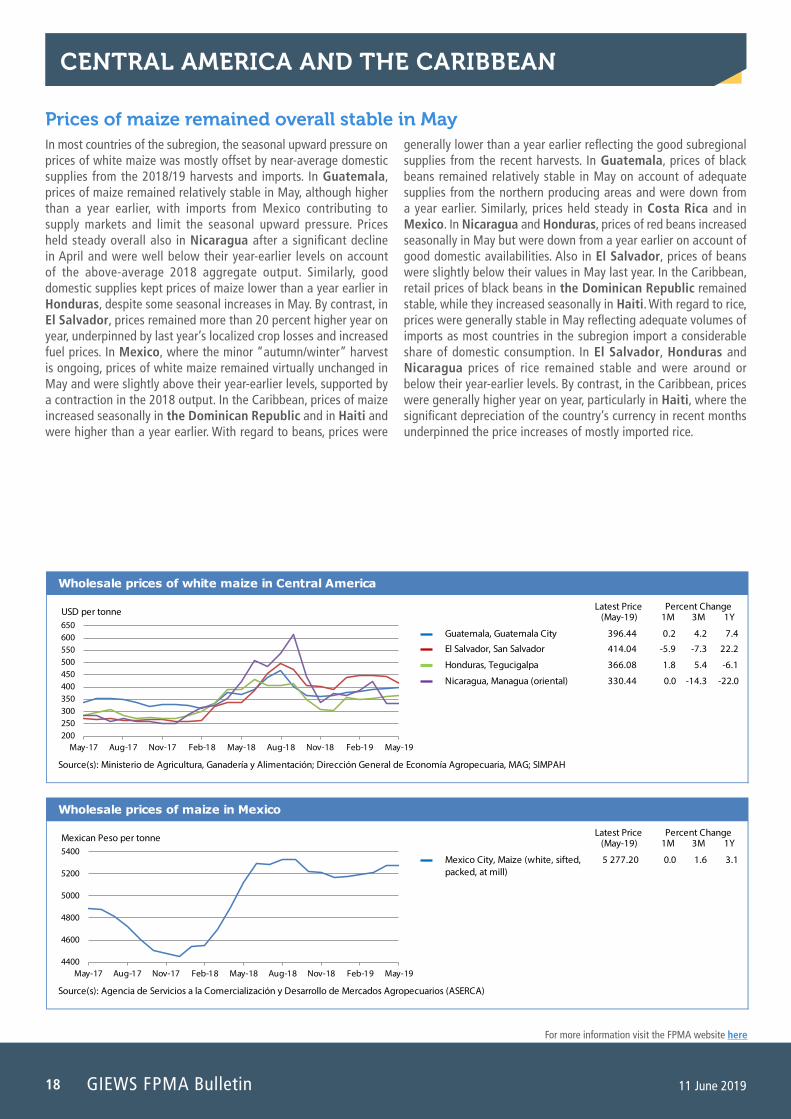
Prices of maize remained overall stable in May In most countries of the subregion, the seasonal upward pressure on prices of white maize was mostly offset by near-average domestic supplies from the 2018/19 harvests and imports. In Guatemala, prices of maize remained relatively stable in May, although higher than a year earlier, with imports from Mexico contributing to supply markets and limit the seasonal upward pressure. Prices held steady overall also in Nicaragua after a significant decline in April and were well below their year-earlier levels on account of the above-average 2018 aggregate output. Similarly, good domestic supplies kept prices of maize lower than a year earlier in Honduras, despite some seasonal increases in May. By contrast, in El Salvador, prices remained more than 20 percent higher year on year, underpinned by last year’s localized crop losses and increased fuel prices. In Mexico, where the minor “autumn/winter” harvest is ongoing, prices of white maize remained virtually unchanged in May and were slightly above their year-earlier levels, supported by a contraction in the 2018 output. In the Caribbean, prices of maize increased seasonally in the Dominican Republic and in Haiti and were higher than a year earlier. With regard to beans, prices were
generally lower than a year earlier reflecting the good subregional supplies from the recent harvests. In Guatemala, prices of black beans remained relatively stable in May on account of adequate supplies from the northern producing areas and were down from a year earlier. Similarly, prices held steady in Costa Rica and in Mexico. In Nicaragua and Honduras, prices of red beans increased seasonally in May but were down from a year earlier on account of good domestic availabilities. Also in El Salvador, prices of beans were slightly below their values in May last year. In the Caribbean, retail prices of black beans in the Dominican Republic remained stable, while they increased seasonally in Haiti. With regard to rice, prices were generally stable in May reflecting adequate volumes of imports as most countries in the subregion import a considerable share of domestic consumption. In El Salvador, Honduras and Nicaragua prices of rice remained stable and were around or below their year-earlier levels. By contrast, in the Caribbean, prices were generally higher year on year, particularly in Haiti, where the significant depreciation of the country’s currency in recent months underpinned the price increases of mostly imported rice.
Latest Price(May-19) 1M 3M 1Y
Wholesale prices of maize in Mexico
Percent Change
4400
4600
4800
5000
5200
5400
May-17 Aug-17 Nov-17 Feb-18 May-18 Aug-18 Nov-18 Feb-19 May-19
Mexico City, Maize (white, sifted, packed, at mill)
Mexican Peso per tonne
5 277.20 0.0 1.6 3.1
Source(s): Agencia de Servicios a la Comercialización y Desarrollo de Mercados Agropecuarios (ASERCA)
Latest Price(May-19) 1M 3M 1Y
Wholesale prices of white maize in Central America
Percent Change
200250300350400450500550600650
May-17 Aug-17 Nov-17 Feb-18 May-18 Aug-18 Nov-18 Feb-19 May-19
Guatemala, Guatemala City
El Salvador, San Salvador
Honduras, Tegucigalpa
Nicaragua, Managua (oriental)
USD per tonne
396.44
414.04
366.08
330.44
0.2
-5.9
1.8
0.0
4.2
-7.3
5.4
-14.3
7.4
22.2
-6.1
-22.0
Source(s): Ministerio de Agricultura, Ganadería y Alimentación; Dirección General de Economía Agropecuaria, MAG; SIMPAH
19
For more information visit the FPMA website here
11 June 2019 GIEWS FPMA Bulletin
SOUTH AMERICA
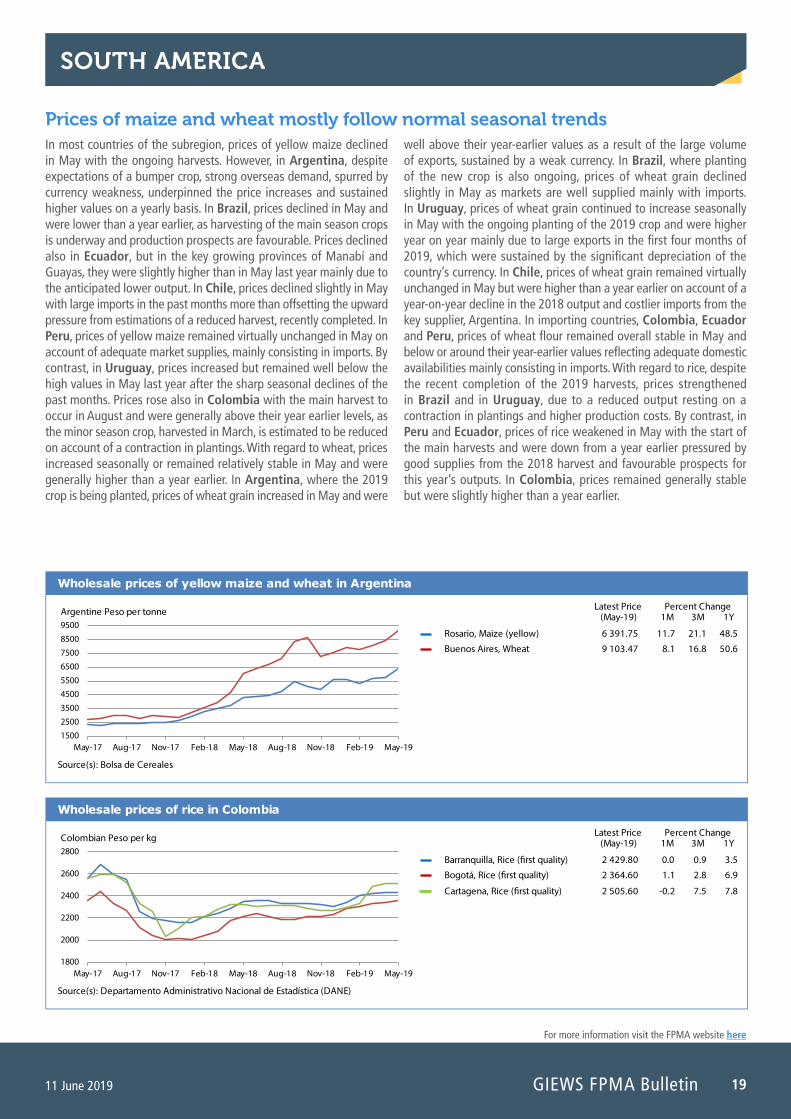
Prices of maize and wheat mostly follow normal seasonal trendsIn most countries of the subregion, prices of yellow maize declined in May with the ongoing harvests. However, in Argentina, despite expectations of a bumper crop, strong overseas demand, spurred by currency weakness, underpinned the price increases and sustained higher values on a yearly basis. In Brazil, prices declined in May and were lower than a year earlier, as harvesting of the main season crops is underway and production prospects are favourable. Prices declined also in Ecuador, but in the key growing provinces of Manabí and Guayas, they were slightly higher than in May last year mainly due to the anticipated lower output. In Chile, prices declined slightly in May with large imports in the past months more than offsetting the upward pressure from estimations of a reduced harvest, recently completed. In Peru, prices of yellow maize remained virtually unchanged in May on account of adequate market supplies, mainly consisting in imports. By contrast, in Uruguay, prices increased but remained well below the high values in May last year after the sharp seasonal declines of the past months. Prices rose also in Colombia with the main harvest to occur in August and were generally above their year earlier levels, as the minor season crop, harvested in March, is estimated to be reduced on account of a contraction in plantings. With regard to wheat, prices increased seasonally or remained relatively stable in May and were generally higher than a year earlier. In Argentina, where the 2019 crop is being planted, prices of wheat grain increased in May and were
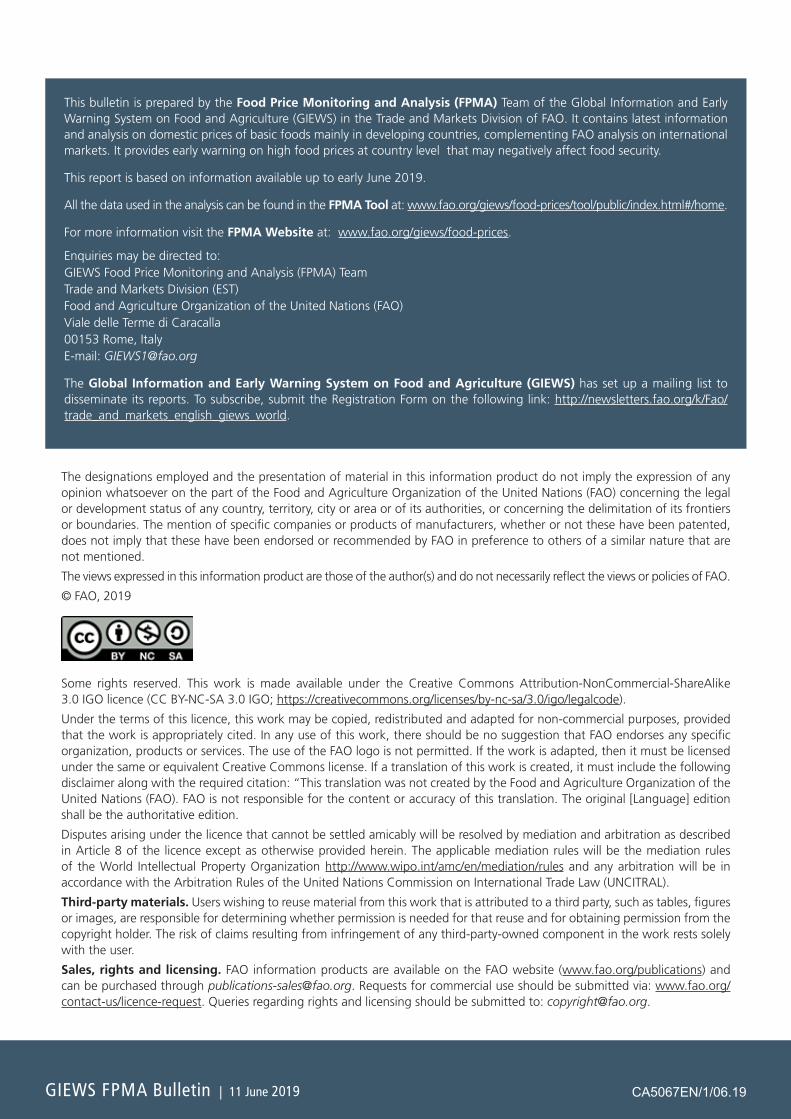
well above their year-earlier values as a result of the large volume of exports, sustained by a weak currency. In Brazil, where planting of the new crop is also ongoing, prices of wheat grain declined slightly in May as markets are well supplied mainly with imports. In Uruguay, prices of wheat grain continued to increase seasonally in May with the ongoing planting of the 2019 crop and were higher year on year mainly due to large exports in the first four months of 2019, which were sustained by the significant depreciation of the country’s currency. In Chile, prices of wheat grain remained virtually unchanged in May but were higher than a year earlier on account of a year-on-year decline in the 2018 output and costlier imports from the key supplier, Argentina. In importing countries, Colombia, Ecuador and Peru, prices of wheat flour remained overall stable in May and below or around their year-earlier values reflecting adequate domestic availabilities mainly consisting in imports. With regard to rice, despite the recent completion of the 2019 harvests, prices strengthened in Brazil and in Uruguay, due to a reduced output resting on a contraction in plantings and higher production costs. By contrast, in Peru and Ecuador, prices of rice weakened in May with the start of the main harvests and were down from a year earlier pressured by good supplies from the 2018 harvest and favourable prospects for this year’s outputs. In Colombia, prices remained generally stable but were slightly higher than a year earlier.
Latest Price(May-19) 1M 3M 1Y
Wholesale prices of yellow maize and wheat in Argentina
Percent Change
1500
2500
3500
45005500
6500
7500
8500
9500
May-17 Aug-17 Nov-17 Feb-18 May-18 Aug-18 Nov-18 Feb-19 May-19
Rosario, Maize (yellow)
Buenos Aires, Wheat
Argentine Peso per tonne
6 391.75
9 103.47
11.7
8.1
21.1
16.8
48.5
50.6
Source(s): Bolsa de Cereales
Latest Price(May-19) 1M 3M 1Y
Wholesale prices of rice in Colombia
Percent Change
1800
2000
2200
2400
2600
2800
May-17 Aug-17 Nov-17 Feb-18 May-18 Aug-18 Nov-18 Feb-19 May-19
Barranquilla, Rice (�rst quality)
Bogotá, Rice (�rst quality)
Cartagena, Rice (�rst quality)
Colombian Peso per kg
2 429.80
2 364.60
2 505.60
0.0
1.1
-0.2
0.9
2.8
7.5
3.5
6.9
7.8
Source(s): Departamento Administrativo Nacional de Estadística (DANE)
This bulletin is prepared by the Food Price Monitoring and Analysis (FPMA) Team of the Global Information and Early Warning System on Food and Agriculture (GIEWS) in the Trade and Markets Division of FAO. It contains latest information and analysis on domestic prices of basic foods mainly in developing countries, complementing FAO analysis on international markets. It provides early warning on high food prices at country level that may negatively affect food security.
This report is based on information available up to early June 2019.
All the data used in the analysis can be found in the FPMA Tool at: www.fao.org/giews/food-prices/tool/public/index.html#/home.
For more information visit the FPMA Website at: www.fao.org/giews/food-prices.
Enquiries may be directed to:GIEWS Food Price Monitoring and Analysis (FPMA) TeamTrade and Markets Division (EST) Food and Agriculture Organization of the United Nations (FAO)Viale delle Terme di Caracalla00153 Rome, ItalyE-mail: [email protected]
The Global Information and Early Warning System on Food and Agriculture (GIEWS) has set up a mailing list to disseminate its reports. To subscribe, submit the Registration Form on the following link: http://newsletters.fao.org/k/Fao/trade_and_markets_english_giews_world.
CA5067EN/1/06.19GIEWS FPMA Bulletin | 11 June 2019
The designations employed and the presentation of material in this information product do not imply the expression of any opinion whatsoever on the part of the Food and Agriculture Organization of the United Nations (FAO) concerning the legal or development status of any country, territory, city or area or of its authorities, or concerning the delimitation of its frontiers or boundaries. The mention of specific companies or products of manufacturers, whether or not these have been patented, does not imply that these have been endorsed or recommended by FAO in preference to others of a similar nature that are not mentioned.
The views expressed in this information product are those of the author(s) and do not necessarily reflect the views or policies of FAO.
© FAO, 2019
Some rights reserved. This work is made available under the Creative Commons Attribution-NonCommercial-ShareAlike 3.0 IGO licence (CC BY-NC-SA 3.0 IGO; https://creativecommons.org/licenses/by-nc-sa/3.0/igo/legalcode).
Under the terms of this licence, this work may be copied, redistributed and adapted for non-commercial purposes, provided that the work is appropriately cited. In any use of this work, there should be no suggestion that FAO endorses any specific organization, products or services. The use of the FAO logo is not permitted. If the work is adapted, then it must be licensed under the same or equivalent Creative Commons license. If a translation of this work is created, it must include the following disclaimer along with the required citation: “This translation was not created by the Food and Agriculture Organization of the United Nations (FAO). FAO is not responsible for the content or accuracy of this translation. The original [Language] edition shall be the authoritative edition.
Disputes arising under the licence that cannot be settled amicably will be resolved by mediation and arbitration as described in Article 8 of the licence except as otherwise provided herein. The applicable mediation rules will be the mediation rules of the World Intellectual Property Organization http://www.wipo.int/amc/en/mediation/rules and any arbitration will be in accordance with the Arbitration Rules of the United Nations Commission on International Trade Law (UNCITRAL).
Third-party materials. Users wishing to reuse material from this work that is attributed to a third party, such as tables, figures or images, are responsible for determining whether permission is needed for that reuse and for obtaining permission from the copyright holder. The risk of claims resulting from infringement of any third-party-owned component in the work rests solely with the user.
Sales, rights and licensing. FAO information products are available on the FAO website (www.fao.org/publications) and can be purchased through publications‑[email protected]. Requests for commercial use should be submitted via: www.fao.org/contact-us/licence-request. Queries regarding rights and licensing should be submitted to: [email protected].