building the high-performance workforcemarble-arch-online-courses.s3.amazonaws.com/clc... · this...
TRANSCRIPT

© 2002 Corporate Executive Board
Corporate Leadership Council
Building the High-Performance WorkforceA Quantitative Analysis of the Effectiveness of Performance Management Strategies

Note to Members
This project was researched and written to fulfi ll the research requests of several members of the Corporate Executive Board and as a result may not satisfy the information needs of all member companies. The Corporate Executive Board encourages members who have additional questions about this topic to contact the Board staff for further discussion. Descriptions or viewpoints contained herein regarding organizations profi led in this report do not necessarily refl ect the policies or viewpoints of those organizations.
Confi dentiality of Findings
This project has been prepared by the Corporate Executive Board for the exclusive use of its members. It contains valuable proprietary information belonging to the Corporate Executive Board and each member should make it available only to those employees and agents who require such access in order to learn from the material provided herein, and who undertake not to disclose it to third parties. In the event that you are unwilling to assume this confi dentiality obligation, please return this document and all copies in your possession promptly to the Corporate Executive Board.
Corporate Leadership Council
2000 Pennsylvania Avenue NW
Washington, DC 20006
Telephone: 202-777-5000
Facsimile : 202-777-5100
166 PiccadillyLondon, W1J 9EFUnited KingdomTelephone: +44-(0)20-7499-8700Facsimile: +44-(0)20-7499-9700
www.corporateleadershipcouncil.com
Catalog No.: CLC1V6EMX
Creative Solutions Group Project Lead
Jessie Ann Dalrymple
Senior Publications Specialist Lisa Goffredi
Council StaffPractice Manager
Carl Rhodes
Lead ConsultantGillian Marum
Contributing ConsultantJulie Houghton
Director of Content DeliveryRon Kann
Managing DirectorJean Martin-Weinstein
Executive DirectorsPeter Freire
Michael Klein
Legal Caveat
The Corporate Leadership Council has worked to ensure the accuracy of the information it provides to its members. This report relies upon data obtained from many sources, however, and the Corporate Leadership Council cannot guarantee the accuracy of the information or its analysis in all cases. Further, the Corporate Leadership Council is not engaged in render-ing legal, accounting, or other professional services. Its reports should not be construed as professional advice on any particular set of facts or circumstances. Members requiring such services are advised to consult an appropriate professional. Neither the Corporate Executive Board nor its programs is responsible for any claims or losses that may arise from (a) any errors or omissions in their reports, whether caused by the Corporate Leadership Council or its sources, or (b) reliance upon any recommendation made by the Corporate Leadership Council.

iii
Letter from the Corporate Leadership Council • v
Building a High-Performance Workforce: The Study in 10 Conclusions • vi
Chapter I—Overview and Methodology • 1
Chapter II—Seven Keys to High Performance • 11
� The Performance Management System: The Singular Power of Clarity • 13
� Performance Culture: The Freedom to Take Risks, Communicate, and Be Flexible • 18
� Manager–Employee Interaction: Solutions Enabler • 23
� Formal Performance Review: The Delicate Balance Between Praise and Critique • 27
� Informal Performance Feedback: The Primacy of Fairness and Accuracy • 31
� Day-to-Day Work: Connection Over Rewards • 36
� Job Opportunities: High Profi le, Good Fit, and New Skills • 41
Chapter III—Building the High-Performance Workforce: Guidelines for Performance Improvement • 47
Table of Contents

iv

v
Letter from the Corporate Leadership Council
As more organizations recognize the importance of human capital to the bottom line, identifying the strategies that most improve individual performance is a signifi cant source of competitive advantage. Given the consequences of success or failure in this endeavor, organizations must not only identify which performance management strategies effectively drive employee performance but also must do so with unprecedented precision and accuracy.
Throughout the Council’s yearlong review of academic and professional literature and in-depth interviews with a wide cross-section of the membership, the Council was struck by both the urgency to improve performance and the tremendous diffi culty organizations face in trying to do so. Specifi cally, today’s organizations face three challenges when formulating strategies for workforce improvement: 1) limited budgets and resources, 2) an overwhelming number of viable approaches, and 3) a lack of compelling evidence indicating the effectiveness of one approach to performance improvement over another.
The Council presents this study as a fi rst step in addressing these challenges. Ultimately, the goal of the research is to help members identify strategies that contribute most to the development of a high-performance workforce. Using a unique research design and econometric modeling techniques to identify the organizational strategies that drive individual performance, this study seeks to enable members to more effectively allocate resources toward performance management activities.
The Council sincerely hopes that the research methods and fi ndings presented in this study will support our members and their goal of building organizations capable of continuous performance improvement. As always, we encourage and look forward to your comments.
With our continued appreciation,
Corporate Leadership CouncilWashington, D.C.Fall 2002

vi
Building the High-Performance Workforce: The Study in 10 Conclusions
1. The drivers of on-the-job performance are notably different from the drivers of recruiting and retention.
2. The most effective drivers of employee performance are often underemphasized (even excluded) from “performance management” as it is traditionally defi ned. Organizations must redefi ne performance management to include all relevant organizational, managerial, and employee-level drivers.
3. No one category of performance management is singularly important. The most effective performance management strategy is composed of a portfolio of carefully selected organizational, managerial, and employee-related levers.
4. Employees perform best when they feel personally connected to their work and their organization. These connections are more important to improving employee performance than traditional fi nancial and nonfi nancial incentives.
5. Managers can most effectively drive employee performance by providing solutions to day-to-day challenges. Providing employees with informed, positive, fair, accurate, and detailed feedback is critical.
6. Organizational factors—systems and culture—have a large impact on employee performance. Three of the Council’s nine most effective performance management levers are organizationally related.
7. Communication—between employees, employees and managers, and from senior leadership—stands at the heart of an effective performance management strategy.
8. In order to drive employee performance, organizations should consider careful reexamination of any low-scoring lever. Despite their lesser impact on improving performance, these levers may be crucial to attracting and retaining top talent. In addition, these levers may potentially be redesigned (through more consistent or tailored application) so as to increase their positive impact on performance or enable their support of other higher-impact levers.
9. The impact of performance management levers is remarkably consistent across different segments of the workforce, including geographic region, company, level, function, performance level, and demographic characteristics.
10. The effectiveness of performance management levers varies tremendously, improving or destroying performance by up to 40 percent. Levers must be chosen and prioritized with precision.
Executive Summary

vii
Organization
The Performance Management
System
Performance Culture
• Ensure employee understanding of performance standards.
• Create performance standards that are perceived as fair and linked to organizational success and strategy.
• Provide feedback to employees from multiple sources (e.g., 360-degree reviews).
• Understanding, connection, and fairness are more important than system design and structure.
Building the High-Performance Workforce
• Encourage, yet manage, risk taking.
• Institutionalize the free fl ow of information, innovation, openness, and fl exibility.
• Differentially treating strong and weak performers is vital, but its ultimate impact on employee performance is limited.
Source: Corporate Leadership Council 2002 Performance Management Survey.
Manager
Manager–Employee
Interaction
Informal Feedback
• Managers must help employees fi nd tangible, immediate solutions to specifi c work challenges to improve performance.
• Managers must provide needed information, resources, and technology.
• Managers can be “performance killers” by providing employees with unclear or inconsistent expectations.
Formal Review
• Managers must emphasize the positive during formal reviews.
• Discussion of performance weaknesses must be clearly focused on specifi c suggestions for improvement or development; if not, emphasizing weaknesses can dramatically decrease performance.
• Review should also include a discussion of the employee’s long-term career in the organization.
• Fair and accurate informal feedback on performance from a knowledgeable source is the single most effective performance management lever available to the organization.
• Feedback should be voluntary, detailed, immediate, and positive.
Employee
Day-to-Day Work
Job Opportunities
• Carefully match employees to jobs: employees who understand and enjoy their work signifi cantly outperform those who do not.
• Take time to explain the big picture: employees will perform better if they understand how their work contributes to organizational strategy and success.
• The promise of promotions and fi nancial rewards drives employee performance, but the impact is smaller than employees’ personal connection to their work.
• Provide employees with highly visible opportunities that leverage their strengths.
• Training should be functionally relevant and job specifi c. General skills training is much less effective.
Executive Summary

viii
Note on Research Methodology
Research Methodology
Building the High-Performance Workforce is supported by three components.
The Corporate Leadership Council’s 2002 Performance Management Survey: The data presented in this study was gathered with a new survey instrument, the Corporate Leadership Council’s 2002 Performance Management Survey. The survey was Web-based and was administered during May and June of 2002. In total, over 41,000 employees and managers were surveyed, and completed responses were received from 19,187 respondents (a 45.8 percent response rate).
Analytical Tools: Building the High-Performance Workforce employs a number of analytical tools, chief among them structural equation models. Structural equation models are a straightforward extension of more common statistical techniques such as multiple regression and factor analysis. They estimate how one variable affects a second, how the second variable affects a third, and so on. Structural equation models are particularly useful in evaluating performance management strategies in that they allow the analyst to estimate the impact of a performance management strategy on employee attitudes and how changes in employee attitudes ultimately affect employee performance. In addition, structural equation models allow the analyst to estimate the relationship between two variables that infl uence each other. For instance, the amount of informal feedback an employee receives affects an employee’s performance, but an employee’s performance also affects how much informal feedback he or she receives. Unless otherwise noted, all results presented in this study take into account these nonrecursive relationships between strategies and performance.
The Corporate Leadership Council’s Performance Management Database: The database described in this study is maintained and updated by the Council. Organizations participating in the research were provided with a detailed analysis of the responses of their employees and managers and an organization-specifi c set of recommendations on how to optimally deploy their performance management resources. In addition, the database allowed companies to place their performance in a competitive context by benchmarking their results at the industry and aggregate levels. This report, however, summarizes the aggregate fi ndings of the study only. No organization-specifi c fi ndings from any participating member are presented in this report. All data and information presented here are based on aggregate-level fi ndings only.

ix
Interpreting Study Findings
The fi ndings from this analysis are based on data collected from a large sample of employees and managers from a diverse set of member organizations. Readers interpreting and employing these results may wish to keep the following considerations in mind:
Generalizing to Employees and Managers in Other Organizations, Industries, and Countries: The observations and conclusions to follow are based on a nonprobability sample of organizations and, as with any such sample, should be interpreted with caution. The Council believes, however, that the conclusions in this study are likely to be generalizable to many, if not most, organizations for the following reasons.
1. Employees and managers were sampled from a diverse set of organizations (34), industries (seven), and countries (29).
2. The size of the sample, over 19,000, is very large by traditional standards. In general, large samples increase the accuracy with which inferences can be drawn about the target population.
3. Through appropriate weighting, the fi nal sample and subsequent analysis is not dominated by any one organization.
Supplementing the Data in Building the High-Performance Workforce with Other Sources: Although the analysis presented here is based on a large sample of employees and managers, the Council advises members to supplement the information presented in this study with other sources where appropriate. Research is always most powerful when it draws from multiple data sources and methods.
A Note on Terminology: Throughout this study, the terms “strategy” and “lever” are used interchangeably to refer to any tactic, event, or intervention an organization may use to improve the performance of its employees.

x

1
Chapter IOverview and Methodology

2a
In Search of the High-Performance Organization
A Common Challenge: To succeed in an environment in which declining budgets are juxtaposed against aggressive growth targets, organizations must obtain the highest possible level of performance from their workforces. Already an ambitious goal, this task is made particularly challenging by the overwhelming number of viable approaches to performance management and the lack of consensus and understanding as to which strategies effectively drive performance.
As the quotations below suggest, HR executives recognize an acute pressure to allocate resources toward activities that will most successfully boost workforce performance. Across geographic regions and industry groups, executives identify this task as a persistent challenge.

2b
Which Lever to Pull“We’ve learned that you have to have the right reward structure in place or your performance management system won’t work. But beyond aligning performance criteria and rewards, we struggle with knowing what else we can do to make sure we’re getting the best performance from our employees.”
VP of HREuropean Retailer
The Performance Management ChallengeImportance and Diffi culty of Improving Employee Performance
No Way to Know“There are many drivers of high performance—leadership, recognition, development. But it is extremely diffi cult to fi gure out how to actually create a high-performance environment.”
VP of HRSouth African Financial Services Firm
The Cart Before the Horse “A system that drives improvements in employee performance drives improvements in your business. If you can’t use reviews to improve employee performance, then what’s the point?”
VP of HREuropean Manufacturer
The Manager’s Role“The manager has a critical role in driving high employee performance, and HR needs to provide managers with the support to do that well. The problem is we don’t really know which manager behaviors drive good employee performance.”
VP of HRNorth American Health Care Company
Source: Corporate Leadership Council research.

3a
A Model of Performance Improvement
The Council’s Model of Individual Performance Improvement: Before organizations can engage in a serious effort to improve the performance of their workforces, they must understand how a given strategy ultimately translates (or fails to translate) into improved individual performance. Models, both theoretical and statistical, enable this understanding by delineating how strategies work. In addition, they present hypotheses that are subject to empirical examination, allowing evidence to be gathered on the effectiveness of any given strategy before costly mistakes are made in resource allocation.
Direct and Indirect Impact: The Council’s model of performance improvement posits that performance can be improved in one of two ways. First, performance can be improved directly by providing employees with job-relevant information, experiences, or resources. Second, performance can be improved indirectly by affecting a number of attitudes that in turn drive performance.
By changing the way employees think about themselves, their jobs, and their organizations, the model hypothesizes that it is possible to have a dramatic impact on their performance. Specifi cally, by convincing employees to try harder (discretionary effort), encouraging them to personally attach to and believe in the organization (organizational commitment), increasing their confi dence that their job is the right one for them (match with job), providing employees with what they need to do their jobs (having necessary resources), surrounding them with highly motivated, highly talented, hardworking colleagues (team strength), increasing job satisfaction and reducing turnover, organizations can actively boost the performance of individual employees, and ultimately of their entire workforce.
In this study, the Council uses this model to test the impact of 106 performance management strategies. By identifying which strategies affect performance directly or indirectly, or fail to affect performance altogether, the model offers insight into how scarce performance management resources should be allocated in order to receive the highest return.
Fair and Accurate Feedback —An Example: Any given performance improvement strategy may have both direct and indirect effects on performance. For example, providing employees with fair and accurate performance feedback can affect performance directly by giving employees job-relevant information. But just as importantly, giving fair and accurate feedback also affects employee performance indirectly by driving a number of important attitudes, such as discretionary effort or organizational commitment. The true impact of a given strategy can only be identifi ed by accurately assessing both its direct and indirect effect.

3b
Formal Performance Review
Performance Culture
Informal Performance Feedback
The Corporate Leadership Council’s Model of Individual Performance Improvement
Manager–Employee Interaction
Day-to-Day Work
Job Opportunities
Individual Performance
Performance Management System
Attitudes of High Performance
• Discretionary Effort
• Organizational Commitment
• Match with Job
• Having Necessary Resources
• Team Strength
• Job Satisfaction
• Intent to Leave
Source: Corporate Leadership Council research.
Indirect Impact
on Perform
ance
Direct Impact
on Performance

4a
The Importance of Attitudes
Defi nitions of High-Performance Attitudes: The Council examined the seven high-performance attitudes most likely to impact individual performance: discretionary effort, organizational commitment, match with job, having necessary resources, team strength, job satisfaction and intent to leave. Further defi nitions of each attitude are included on the page below.

4b
Source: Corporate Leadership Council research.
Defi nitions of High-Performance Attitudes
High-Performance Attitude Defi nition
Discretionary effort • Extent to which employees put their full effort into their job, are constantly looking for ways to do their
job better, are willing to put in the extra effort to get a job done when necessary, and believe that people would describe them as enthusiastic about the work they do
Organizational commitment
• Extent to which employees feel a strong sense of belonging to the organization, feel that the organization has a great deal of personal meaning for them, enjoy discussing the organization with people outside of it, and feel that the organization’s problems are their own
Match with job • Extent to which employees feel that their work is the right type of work for them and they are the right type of person for the job
Having necessary resources
• Extent to which employees think that they can always fi nd out what they need to know to do their job successfully, always have the tools, resources, and technology they need to succeed at work, and know that they have the skills and knowledge to accomplish whatever it is that is asked of them at work
Team strength• Extent to which employees believe that every person they work with brings something important to the
team, all of the people they work with do their fair share of work, and everyone at work cares about whether they do a good job or not
Job satisfaction • Extent to which employees describe themselves as very satisfi ed with their job and with the kind of work that they do
Intent to leave
• Extent to which employees do not intend to look for a new job with another organization in the next year, do not frequently think about quitting their job and leaving the organization, are not actively looking for a job with another organization, and have not made phone calls or sent out their résumé in order to fi nd a job at another organization
• Whether employees say that they would be happy to spend the rest of their career at their organization
• Whether employees believe they could easily fi nd a job at another organization

5a
Defi nition of Performance Improvement
Performance Defi ned: Throughout this study, the Council will defi ne performance as an employee’s on-the-job performance in their current position or role. It is the goal of this research to identify the strategies that most improve on-the-job performance. To do so, the Council will intentionally exclude a number of topics from empirical examination.
For instance, this research is not about changing the composition of a company’s workforce or providing unrealistic, large leaps in workforce performance. In addition, the study does not examine the impact of recruiting, retention, or replacing low performers with high performers. In fact, strategies that attract and retain employees are often quite different from those that drive the same individuals to higher levels of performance.
Instead, this analysis focuses on helping organizations achieve steady and quantifi able improvement in the performance of their current workforce. Of course, employees’ natural abilities are always important, but there is also signifi cant opportunity for organizations to increase the performance level of their talent base by focusing on the strategies and activities that have the greatest impact on performance. In sum, this research centers on the following question: Which strategies drive the most signifi cant improvements in employee performance?

5b
Thinking About Performance ImprovementPerformance Improvement: Same Workforce, Better Performance
Source: CLC Solutions Employee Preferences Database; Corporate Leadership Council research.
Num
ber
of
Empl
oyee
s
Performance
What This Is About
• Steady, quantifi able improvement
• Same person, better performance
• Same workforce, better performance
What This Isn’t About
• Quantum (unrealistic) leap in performance
• Replacing low performers with high performers
• Changing the composition of the workforce
• Attracting and retaining talent

6a
The Council’s 2002 Performance Management Survey
Measuring the Impact of Performance Management Levers: To identify which strategies for performance improvement have the greatest impact on employee performance, the Council measured the presence and strength of 106 performance management strategies using the 2002 Performance Management Survey. The survey, given to 19,000 managers and employees in 34 member organizations, measures the extent to which employees, managers, and organizations engage in the performance management activities that appear below. These activities, culled from academic and secondary literature and interviews with senior executives, are currently used by many organizations to drive employee performance.
The 106 performance management activities are organized into seven categories: the performance management system, performance culture, manager–employee interaction, formal performance review, informal performance feedback, day-to-day work, and job opportunities. The challenge is to identify the strategies that have the greatest positive impact on performance.

6b
Formal Performance
Review• Emphasis on
performance strengths
• Emphasis on performance weaknesses
• Emphasis on personality strengths
• Emphasis on personality weaknesses
• Emphasis on skills and behaviors needed in the future
• Emphasis on specifi c outcomes of formal performance review (e.g., promotions, raises, or bonuses)
• Emphasis on specifi c suggestions for doing the job better
• Emphasis on long-term career prospects within the organization
Performance Culture
• Coworker involvement
• Diffuse decision-making authority
• Risk taking• Coworker cohesion• Innovation• Flexibility• Differential treatment
of best and worst performers
• Internal communication
• Future orientation
Informal Performance
Feedback• Emphasis on amount of
effort put into the job• Emphasis on
performance strengths • Emphasis on
performance weaknesses • Emphasis on personality
strengths • Emphasis on personality
weaknesses• Emphasis on skills and
behaviors needed in the future
• Emphasis on specifi c suggestions for doing the job better
• Fairness and accuracy of informal feedback
• Feedback that helps employees do their jobs better
• Immediate versus delayed feedback
• Manager likelihood to volunteer informal feedback
• Method of delivering informal feedback (e.g., face-to-face, in writing)
• Manager knowledgeable about employee performance
Performance Management
System• Challenge and
applicability of development plan
• Employee accountability for “things that matter”
• Employee understanding of how system works
• Employee understanding of performance standards
• Extent to which employees receive performance ratings they deserve
• Fairness of performance standards
• Link between performance management system and organizational strategy
• Number of formal reviews received each year
• Presence of 360-degree reviews
• Presence of employee development plan
• Presence of procedures for handling grievances with performance reviews
• System credibility• Use of rank-ordering
Manager–Employee Interaction
• Breaks down projects into manageable components
• Clearly communicates expectations
• Creates work plans and timetables
• Diffuses unhealthy rivalries or competition among team members
• Encourages employees to be positive and enthusiastic about work
• Expresses confi dence in employees’ ability to do job
• Helps team get started on a new project
• Helps attain needed information, resources, and technology
• Helps fi nd solutions to problems at work
• Holds people accountable• Identifi es or removes
unnecessary barriers at work (such as unnecessary rules or regulations)
• Inspires others• Listens carefully to views
and opinions• Measures performance and
results• Persuades and encourages
others to move in a desired direction
• Recognizes and rewards achievement
• Translates long-term goals into step-by-step plans
• Makes frequent changes to projects and assignments
Job OpportunitiesOn-the- Job Development OpportunitiesOpportunity to:• Spend time with a professional
coach • Do challenging and leading-edge
work• Experiment and take risks• Have signifi cant accountability
and responsibility• Help launch a new business,
initiative, or program• Help turn around struggling
business• Work with a mentor • Be promoted• Work for strong senior
executive team• Work in a different country• Work in a variety of jobs/roles• Work in new business units • Work in new functional areas• Work on the things you do best• Work with a diverse group of
peopleTraining Content• Business (e.g., accounting,
fi nance)• Diversity• IT• Leadership• New employee orientation• People management (e.g.,
communication, team-building)• Process management (e.g.,
managing timelines or budgets, resource allocation)
• Product• Quality control• Sales• Technical• Other
Day-to-Day Work• Challenge of projects and
assignments• Connection between
successful project completion and incentives such as:– Size of annual merit
increase– Size of annual bonus– Opportunity for higher
performance rating– Opportunity for
promotion– Raise in base salary
• Employee infl uence in selecting projects
• Employees’ personal enjoyment of their work
• Employee understanding of connections between day-to-day work and organizational strategy
• Employee understanding of how to complete projects and assignments
• Importance of projects to business unit and organization
• Importance of projects and assignments to employees’ long-term careers
• Importance of projects and assignments to employees’ personal development
• Number of projects and assignments
• Time to complete projects and assignments
Potential Performance Management Drivers
Source: Corporate Leadership Council research.

7a
Overview of Research Methodology
The Council’s 2002 Performance Management Survey employed a dyadic survey design—two versions of the survey, one for managers and one for employees. Each survey included more than 200 questions and took an average of 45 minutes to complete. The survey asked employees and managers about nearly all facets of their organizations’ performance management systems, including manager quality, organizational context, on-the-job development and training, and day-to-day work.
Company-Supplied Performance Data: Survey data was combined with company-supplied data on employees and managers, including, most importantly, data on individual employee performance. Given that the participating companies used many different systems to measure performance, the Council standardized all company-supplied data into a common measure for all participating companies. The standardized scale represents a measure of employee performance in which each employee’s score denotes the percentage of employees in his or her company who received a lower performance rating that he or she did. Higher percentile scores indicate higher levels of performance while lower scores represent lower levels of performance. Throughout this study, the term “impact on performance” indicates a shift, either up or down, in this percentile rank. For example, a positive impact of 25 percent means that a particular performance strategy has the potential to move an employee from the 50th percentile to the 75th percentile in terms of relative performance in his or her organization.
Performance data was subjected to a number of standard tests for validity and reliability. For example, the standardized performance measure showed appropriate relationships to education level, annual bonus size, number of promotions, and hours worked per week. There was also strong evidence of a number of predicted relationships between the Council’s standardized performance scale and many high-performance attitudes, leading to the conclusion that the standardized performance measure is a valid and reliable indicator of employee performance.
Understanding SEMs: The Council analyzed this data using structural equation models (SEMs). SEMs estimate the impact of one variable (e.g., frequency of informal feedback) on another variable (e.g., discretionary effort) and how changes in this second variable impact a third (e.g., employee performance). SEMs allowed the Council to isolate the unique impact of each of the various performance strategies and to understand why each succeeds or fails to impact attitudes of high performance and ultimately employee performance.
Goal—Improved Performance Through Focused Resource Investments: Ultimately, this research strives to bring us closer to a new science of performance improvement: one in which decisions are made that enable organizations to achieve the highest level of performance from their existing workforce with the best use of their resources.

7b
Source: Corporate Leadership Council research.
The Goal: Identify Performance Drivers
Dyadic Survey Design Plus Company-Supplied Employee Performance Data
• Managers and employees surveyed on nearly all facets of performance and performance management—manager quality, organizational context, on-the-job development and training, and day-to-day work
• Survey data combined with company-supplied data on employees and managers
Structural Equation Models
(SEMs)
• Using SEMs, the Council estimates the unique impact of each performance driver and why it works (or does not)
Goal: Improved Performance
• The Council generates a list of performance drivers, in rank-order of their impact on individual performance
Y2 = α + β1Y1 + γ1X1 + γ2X2 + γ3X3 + γ4X4 + ξ2
Y1 = α + γ1X1 + γ5X5 + γ6X6 + γ7X7 + ξ1
Y3 = α + γ8X8 + β2Y2 + ξ3
=1.2.3.4.5.
1
3
2

8a
Analysis in Action
The page below provides an overview and example of this analysis using a sample strategy (informal performance feedback from an employee’s manager) and a sample attitude of high performance (discretionary effort).
Step #1: Measure Employee Performance: Company-provided performance data on employees was standardized into a common scale and subjected to a number of tests for validity and reliability.
Step #2: Measure Presence and Effectiveness of Performance Levers: The presence and effectiveness of each performance management strategy was measured by asking employees a number of questions about their experiences with each lever. In the example below, employees are asked how often they receive informal feedback from their managers.
Step #3: Measure Attitudes of High Performance: Each of the Council’s seven attitudes of high performance was measured using a number of standard scales. The example below presents one of four questions used to measure discretionary effort.
Step #4: Estimate Impact of Lever Using SEMs: Structural equation models were then used to estimate the direct and indirect impact of each lever on employee performance. In the example below, an increase or decrease in the amount or quality of informal feedback is hypothesized to affect performance directly as well as indirectly through its impact on discretionary effort.
Step #5: Calculate Total Impact: The combination of each strategy’s direct and indirect effect provides its total impact on performance. Below, the impact of informal feedback is the sum of its direct effect on performance as well as its indirect effect on attitudes of high performance.
Step #6: Prioritize Levers According to Maximum Impact: Finally, structural equation models were used to estimate the maximum total impact of each performance management strategy. This is calculated by comparing the predicted performance level for an employee who scores “high” on a strategy (i.e., the performance of an employee who receives frequent informal feedback) with the predicted performance level for an individual who scores “low” on the strategy (i.e., the performance of an employee who receives infrequent informal feedback).

8b
A Methodological Overview and ExampleThe Impact of Informal Feedback on Discretionary Effort and Performance
Source: Corporate Leadership Council research.
Step #1: Measure Employee Performance
Step #3: Measure Attitudes of High Performance
Step #4: Estimate Impact of Lever Using SEMs
Step #2: Measure Presence and Effectiveness of “Performance Levers”
Step #6: Prioritize Levers According to Maximum Impact
Company- Provided Raw Data
5432……
Standardize
Percentile Rank in
Company
100999897……
On average, about how often does your manager give you informal feedback about your work performance?
❑ Once a day❑ 2–4 times a week❑ Once a week❑ 2–3 times a month❑ Once a month❑ 8–11 times a year❑ 4–7 times a year❑ 2–3 times a year❑ Once a year❑ Less than once a year❑ My manager never gives me informal feedback
about my work performance
When needed, I am willing to put in the extra effort to get a job done.
❑ Very strongly agree❑ Strongly agree❑ Somewhat agree❑ Neither agree nor disagree❑ Somewhat disagree❑ Strongly disagree❑ Very strongly disagree
Change in Informal Feedback
Change in Employee Discretionary Effort?
Change in Employee Performance?
Company-Reported Data
Impact on Attitudes and Performance
Estimated Maximum Change
Manager and Employee Survey Data
Statistical Analysis
Test
Validity and
Reliability Tests
Collect
Direct
IndirectIndirect
effects work through fi ve key attitudes
Cha
nge
in P
erfo
rman
ce
Step #5: Calculate Total Impact
Direct
Indirect
Total Impact
Indirect
Direct

9a
Organizations Participating in the Study
Leveraging the Council Network: The Council’s 2002 Performance Management Survey gathered information on over 19,000 employees and managers from 34 organizations across seven major industry groups and 29 countries. Organizations were selected in order to ensure a balanced sample across industry, size of company, and geography.

9b
With Sincere Thanks…Partnering with the Membership, the Council Surveyed Over 19,000 Respondents
from 34 Companies, Seven Industry Groups, and 29 Countries
Entertainment and Media
Consumer Products and Retail Health CareChemical and
Energy Manufacturing
Financial Services Technology
IADB
Source: Corporate Leadership Council 2002 Performance Management Survey.

10a
A Rich Database
Demographics of Survey Participants: The profi le of the database shown below illustrates the diversity of the survey respondents. Broad distribution across organizational level, work function, geographic region, age, gender, and tenure allows for robust analysis of the impact of various performance management strategies on different segments of the workforce. For comparisons across geographic region, for example, the study examines the experiences of more than 700 employees from Latin America, 3,900 from Europe, 500 from South Africa, 2,400 from Asia, 500 from Australia, and over 10,000 from North America.

10b
A Portrait of Our WorkforceOrganizational Level, Function, and Geography of the Survey Participants
Age, Gender, and Tenure of the Survey Participants
Work FunctionOrganizational Level
Gender Tenure with CompanyAge
17%
38%30%
14%
1%
5%12% 4%
8%
5%14%
3%4%
9%8%
7%
21%
59%41%
21%
15%
24%12%
25%
2%
57%26%
13%
3%
Male
Female18–30
Years Old
31–40 Years Old
41–50 Years Old
51–60 Years Old
61–70 Years Old
10 Years or Less
11–20 Years
21–30 Years
31–40 Years
Corporate Admin Customer Service
Engineering and Design
Finance/Accounting
Human Resources
IT
ManufacturingMarketing
Operations
Retail
Sales
Other*
Division Head/VP
Department Manager/Director
Supervisor/Administrator
Professional/Technical
Other Management
Other Nonmanagement
* Includes strategy/planning (2%), research and development (4%), quality control (2%), purchasing (2%), legal (1%), and other (10%).
Geography (by Residence)
Source: Corporate Leadership Council 2002 Performance Management Survey.
4%
21%
3%13%
3%
53%
4%
North America
Other
Asia/Pacifi c
Australia/New Zealand
Europe
Latin America
South Africa
Note: Percentages do not add up to 100 percent due to rounding.

11a

11b
Chapter IISeven Keys to High Performance

12a
Skyline of Potential Performance Drivers
The graphic below presents the list of performance drivers in order of their impact on performance, from left to right (the taller the bar, the greater the impact). A number of important implications for performance management are clear:
Wide Range in Level of Impact: The sizeable difference in height between the bars on the left side of the graph and those on the right indicates that not all performance management activities are equally effective. In fact, the difference in performance improvement from the performance management strategy with the highest bar to that with the lowest bar is nearly 50 percent, a considerable range of impact on employee performance. Certain performance management strategies are clearly much more important to performance improvement than others are, and selection of the right (or wrong) strategy can have signifi cant consequences for the overall performance of the workforce.
The performance strategies are divided below into four levels (A, B, C, D) based on the magnitude of their impact on individual performance. The items on the left side of the chart are A-level strategies, meaning they can each improve individual performance by a remarkable 25.0 percent or more. In other words, employees whose organizations successfully implement an A-level strategy rank 25.0 percentile points higher than their peers who do not receive the same A-level strategy. B-level strategies can improve performance by 10.0 to 24.9 percent. C-level strategies have a potential performance improvement of 0.0 to 9.9 percent, while D-level strategies can actually have a negative impact on employee performance.

12b
Not All Created Equal
Defi ning Relative Impact on Performance
Source: Corporate Leadership Council 2002 Performance Management Survey.
(50.0)
0.0
50.0
(50.0)
0.0
50.0
A-Level Drivers
B-Level Drivers
C-Level Drivers
D-Level Drivers
Level of Performance Driver
A-Level ≥25.0B-Level 10.0 to 24.9C-Level 0.0 to 9.9D-Level <0.0
Impact on Employee
Performance

13a
Road Map for the Research
Chapter II presents an analysis of the drivers of individual performance, examining seven categories of performance management: the performance management system, performance culture, manager–employee interaction, the formal performance review, informal performance feedback, day-to-day work, and on-the-job opportunities.
This chapter begins with an analysis of the performance management system itself, revealing the singular importance of clearly defi ned performance standards.

13b
Seven Keys to High Performance
1. The Performance Management System: The Singular Power of Clarity
2. Performance Culture: The Freedom to Take Risks, Communicate, and Be Flexible
3. Manager–Employee Interaction: Solutions Enabler
4. Formal Performance Review: The Delicate Balance Between Praise and Critique
5. Informal Performance Feedback: The Primacy of Fairness and Accuracy
6. Day-to-Day Work: Connection Over Rewards
7. Job Opportunities: High Profi le, Good Fit, and New Skills

14a
The Performance Management System
Evaluating the Impact of Performance Management Systems: Central to any analysis of the factors that drive employee performance is an assessment of the tools most organizations rely on to evaluate the performance of their workforces: the performance management system. This chapter evaluates the overall impact of the performance management system on individual performance.
Compiling the List: Based on an exhaustive review of the literature and scores of conversations with senior HR executives and other experts, the Council compiled a list of the components and characteristics of performance management systems thought to be most important for improving individual performance. To this list, the Council added a number of factors in addition to the basic components of the systems themselves, such as employee understanding of the performance management system and their perceptions of its fairness and credibility.
In all, we examined 13 items related to performance management systems across three broad categories:
Content: Elements considered the “nuts and bolts” of a performance management system, including 360-degree reviews, forced ranking, number of formal reviews, and presence and challenge of development plans.
Connection and Understanding: Employees’ understanding of and relationship to the performance management system, including their understanding of the process and evaluation standards, belief that they are held accountable for the skills, behaviors and outcomes that are critical to the success of the organization, and their assessment of the link between the performance management system and organizational strategy.
Fairness and Credibility: Employees’ belief that they receive the performance ratings they deserve and that the system is fair and credible.

© 2002 Corporate Executive Board 14b
Potential Performance DriversElements of the Performance
Management System Defi nitions
Challenge and applicability of development plan Amount of infl uence employees have in creating development plans, their perspectives on how challenging the development plan is, and the frequency with which employees refer to development plans
Employee accountability for “things that matter” Whether employees believe that they are held accountable for skills, behaviors, and outcomes that are critical to their organization’s and their business unit’s success
Employee understanding of how system works Whether employees understand how their organization’s formal performance review system works
Employee understanding of performance standards Whether employees understood the standards they were evaluated on in their most recent formal performance review
Extent to which employees receive performance ratings they deserve Whether employees believe that most people in their organization get the performance ratings they deserve
Fairness of performance standards Whether employees believe that the standards they were evaluated on in their most recent formal review were fair and realistic
Link between performance management system and organizational strategy Whether employees believe the formal performance review system is clearly linked to their organization’s overall strategy
Number of formal reviews received each year Number of formal performance reviews employees have with their manager (the person they directly report to)
Presence of 360-degree reviews Whose opinions were included in employees’ most recent formal performance review (e.g., the people who directly report to them, peers, direct managers, senior executives in the organization, clients or customers from outside the organization)
Presence of employee development plan Whether employees’ most recent formal performance review produced a written development plan for them
Presence of procedures for handling grievances with performance reviews Whether their organization has a procedure for addressing employees’ concerns about the outcome of their formal performance review
System credibility Employee belief in the formal performance review system as a determination of who gets promoted and who gets raises and bonuses
Use of rank-ordering Whether their organization formally ranks people at their level in order of their performance from best to worst
Source: Corporate Leadership Council 2002 Performance Management Survey.
The Performance Management System

15a
Impact of Performance Management System Strategies
The graph below presents the percentage impact that the 13 components of the performance management system can have on employee performance. The taller the bar on the graph, the greater the impact the performance management strategy has on individual performance (including both direct and indirect effects).
All 13 strategies related to the performance management system are arranged below by category, with the “highest impact” category on the left and the “lowest impact” category on the right. Based on this analysis, a number of important implications for resource allocation around performance management are clear:
Understanding and Connection Have the Largest Impact: Items involving “understanding and connection” to the performance management system—including understanding of performance standards, accountability for “things that matter,” and understanding how the system works—are the most important factors within the performance management system for driving performance. This group also contains the single element of the performance management system with the largest positive impact on individual performance. In fact, the dominance of that fi rst bar—employees’ understanding of performance standards—is striking. Simply by increasing employees’ knowledge and understanding of the standards by which they are evaluated results in a possible 36 percent improvement in their performance. Understanding standards is the only A-level item (greater than 25 percent impact) in the performance management system category, and is one of only nine A-level items identifi ed in this study.
A Positive, but Smaller Impact from Fairness and Credibility: The items related to the fairness and credibility of the performance management system—including the extent to which employees receive the performance ratings they deserve and the fairness of performance standards—have less impact on performance than understanding and connection but more impact than the “content” of the system.
Content Less Important Than Fairness and Understanding: Overall, the specifi c features of the system itself (e.g., the number of reviews, the use of rank ordering, the presence and effectiveness of development plans) have far less impact than do understanding, connection, fairness, and credibility. In fact, out of the fi ve items, three are C-level items (meaning their impact on individual performance is between 0 and 9.9 percent) and two are D-level items (meaning they have a neutral or negative impact on performance). When looking at the overall effect of the content of performance management systems on driving individual performance, only 360-degree reviews have a notable impact on individual performance.
Focusing on What Matters: Organizations currently focus a great deal of time, resources, and energy on the contents of the performance management system, namely deciding how many formal reviews to hold each year or whether or not to rank-order employees according to performance. However, much less effort is spent on ensuring that employees understand the system and believe that it results in a fair and credible assessment of their performance and that of their peers. These fi ndings suggest that organizations would do well to refocus their investments from the “process” of performance management toward activities that promote understanding, connection, fairness, and credibility.
Furthermore, this research suggests that a wide variety of different performance management systems will likely work equally well. What distinguishes one from another and determines its success or failure is the extent to which employees and managers understand their standards and believe that the process is fair and credible.
The following page provides a closer look at the relative impact of the content of the system compared to employee understanding of the system. The Council analyzes why understanding and connection have signifi cantly higher impact on performance than do specifi c features of the system.

15b
Emplo
yee U
nder
stand
ing o
f
Perfo
rman
ce St
anda
rds
Emplo
yee A
ccou
ntabil
ity fo
r “Th
ings T
hat M
atter
”
Emplo
yee U
nder
stand
ing o
f How
Syste
m Wor
ks
Link B
etwee
n Per
forman
ce M
anag
emen
t
Syste
m and O
rganiz
ation
al Str
ategy
Exten
t to W
hich E
mploye
es R
eceiv
e
Perfo
rman
ce R
ating
s The
y Des
erve
Fairn
ess o
f Per
forman
ce St
anda
rds
Pres
ence
of G
rieva
nce P
roce
dure
s
Syste
m Cre
dibilit
y
Pres
ence
of 3
60-D
egre
e Rev
iew
Pres
ence
of E
mploye
e Dev
elopm
ent P
lan
Challe
nge a
nd A
pplica
bility
of D
evelo
pmen
t Plan
Use o
f Ran
k-Ord
ering
Numbe
r of F
ormal
Revie
ws Rec
eived
(5.0)
20.0
45.0
36.1
5.8 5.2 4.6 3.7 3.6 3.0 2.0
8.1
1.4 0.2
(0.1) (1.0)
The Importance of Understanding and FairnessMaximum Impact of Performance Management System Levers on Employee Performance*
Change in Performance
High
Low
ContentMean = 1.6
Understandingand ConnectionMean = 12.9
Fairness and CredibilityMean = 3.1
* Each bar presents a statistical estimate of the maximum total impact on employee performance each strategy will produce. The total impact includes the strategy’s direct impact on performance as well as any indirect impact it may have through employee attitudes. The maximum total impact is calculated by comparing two statistical estimates: the predicted performance level for an employee who scores “high” on the strategy and the predicted performance level for an employee who scores “low” on the strategy. The impact of each strategy is modeled separately. A strategy that fails to achieve traditional levels of statistical signifi cance is denoted with a white bar (t < 2.0).
Source: Corporate Leadership Council 2002 Performance Management Survey.
Level of Performance Driver
A-Level ≥25.0B-Level 10.0 to 24.9C-Level 0.0 to 9.9D-Level <0.0
Performance Drivers: Performance Management System

16a
Indirect and Direct Impact
Introductory Note on “Closer Look” Analyses: Across all seven key lessons, a series of “closer look” pages provide additional information on a few items from each category. These pages explain why a particular performance lever may or may not work effectively. They also explain why strategies that have only a limited impact on individual performance may still be very important. Namely, some strategies do not have a signifi cant impact on performance, but do drive employee attitudes that are critical to other important outcomes such as retention and job commitment.
For each of these “closer look” pages, the Council investigates in further detail a number of particularly interesting items from each of the seven categories. This page provides a closer look at three items in the performance management system category: employee understanding of the standards on which they are evaluated, the number of formal reviews employees receive each year, and the presence of 360-degree reviews.
Only Positive Results from Increasing Employee Understanding: Clarifying employee performance standards not only positively impacts individual performance, but also drives several important employee attitudes. As shown below, employees who fully understand the standards on which they are evaluated try 19 percent harder, are 34 percent more committed to the organization, and are 36 percent more likely to feel “matched” to their job. These substantial changes in employee attitudes, plus the obvious direct impact on performance of 31 percent, result in a substantial total impact on performance of 36 percent.
A Closer Look at Number of Formal Reviews: Both within and across organizations today, there is wide variation in the number of formal reviews received by employees during the course of a year. Although the vast majority of employees receive one or two reviews a year, some employees never receive reviews, while others receive reviews as frequently as once a quarter. With such a high level of variation, it is important to fully understand the impact that increasing or decreasing the number of reviews may have on individual performance. As shown in the middle of the page below, as the number of formal reviews increases, key attitudes such as discretionary effort, organizational commitment, match with job, and having necessary resources remain largely unchanged and even decrease slightly. The minimal impact on of employee attitudes, in addition to a slightly negative direct impact on performance of 0.1 percent, leads to a total impact on performance that is essentially neutral.
Understanding the Value of 360-Degree Reviews: The third column on the page below provides the detail necessary to further understand the value of 360-degree reviews. As shown below, their impact on all three employee attitudes (discretionary effort, organizational commitment, and having necessary resources) is not only small but also consistently negative. However, due to their positive direct impact on performance of 9.0 percent, 360-degree reviews provide a total impact of 8.1 percent. These fi ndings suggest that some performance management activities are effective drivers of performance despite their negative impact on several key employee attitudes.
In sum, it is better to ensure that employees understand the standards on which they are evaluated and to provide multiple sources of feedback than to increase the number or frequency of formal reviews. It is from understanding and fairness, rather than from the “nuts and bolts” of the system, that workforce performance will improve.

16b
Understanding Drives Commitment, Effort, and Job Fit
Source: Corporate Leadership Council 2002 Performance Management Survey.
A Closer Look at the Performance Management System
Understanding Standards:Impact on Performance*
Number of Formal Performance Reviews:Impact on Performance*
Number of Formal Performance Reviews
Discretionary Effort (19.0%)
Commitment (34.0%)
Match with Job (36.1%)
Direct Impact (31.4%)
IncreasesIndividual Performance
by 36.1%
DecreasesIndividual Performance
by 1.0%
Discretionary Effort (0.5%)
Commitment (4.8%)
Match with Job (3.8%)
Having Necessary Resources (4.7%)
Direct Impact (0.1%)
Employee Understanding of Performance Standards
Indirect:
+ Direct:
= Total:
* The total impact of a strategy on employee performance is a weighted sum of the strategy’s direct and indirect effects. Each direct and indirect effect is weighted differently, which is why the direct and indirect effects do not sum to the total impact. Percentages next to employee attitudes denote the maximum percentage change produced by each strategy, expressed as a percentage of the total possible change.
Presence of 360-Degree Review:Impact on Performance*
Presence of 360-Degree Review
IncreasesIndividual Performance
by 8.1%
Discretionary Effort (0.3%)
Commitment (6.9%)
Having Necessary Resources (4.6%)
Direct Impact (9.0%)

17a
Impact of Development Plans
The page below provides further information about another item within the performance management system category: development plans. Starting at the top of the page and moving down, it is clear that overall, the presence of a development plan has a relatively small impact on employee attitudes and performance. In fact, having a development plan only slightly increases employees’ discretionary effort, job match, and perceptions of having necessary resources, and slightly decreases organizational commitment.
Why do development plan score so low? The graphs below suggest an explanation. Development plans are certainly good “road maps” to help employees determine what to focus on, but by themselves do little to improve performance. Rather, as currently practiced, development plans are often not truly integrated into employees’ day-to-day jobs: barely a third of employees refer to their development plan while doing their day-to-day job. These fi ndings suggest that the full impact from customized development plans can only be achieved by systematically connecting the components of the plans to employees’ day-to-day jobs.

17b
Pitfalls and Potential of Development Plans
Source: Corporate Leadership Council 2002 Performance Management Survey; Corporate Leadership Council 2001 Leadership Survey.
A Closer Look at the Performance Management System
Discretionary Effort (0.5%)
Commitment (2.0%)
Match with Job (0.2%)
Having Necessary Resources (0.5%)
Direct Impact (1.4%)
Increases Individual Performance by 1.4%
Presence of Employee Development Plan
Indirect:
+ Direct:
= Total:
1 The total impact of a strategy on employee performance is a weighted sum of the strategy’s direct and indirect effects. Each direct and indirect effect is weighted differently, which is why the direct and indirect effects do not sum to the total impact. Percentages next to employee attitudes denote the maximum percentage change produced by each strategy, expressed as a percentage of the total possible change.
2 Importance scores, derived from conjoint analysis, measure the relative importance leaders place on each program for the development of their leadership skills.
…possibly explained by loose connection with day-to-day job
Distribution of Responses to the Question:On average, about how often do you refer to your development plan while doing your day-to-day job?
14% 17% 14%22% 18%
10%5%
Almost Never
Almost Every Day
Overall limited impact on performance…
Presence of Employee Development Plan:Impact on Performance1
…despite proven importance to leaders of customized leadership development plans…
Distribution of Importance Scores for Feedback and Relationship Development Programs2
CreatingLeadership
Development Plan
Interactingwith Peers
Meetingwith an
ExecutiveCoach
Meetingwith aMentor
Feedback0.0
5.0
10.08.1
6.6 6.4 6.3 6.1Importance
Score
Percentage of Respondents

18a
Performance Culture
The next lesson focuses on organizational culture and the importance of a culture of risk taking, internal communication, and fl exibility to individual performance.

18b
Seven Keys to High Performance
1. The Performance Management System: The Singular Power of Clarity
2. Performance Culture: The Freedom to Take Risks, Communicate, and Be Flexible
3. Manager–Employee Interaction: Solutions Enabler
4. Formal Performance Review: The Delicate Balance Between Praise and Critique
5. Informal Performance Feedback: The Primacy of Fairness and Accuracy
6. Day-to-Day Work: Connection Over Rewards
7. Job Opportunities: High Profi le, Good Fit, and New Skills

19a
Understanding the Impact of Performance Culture
In Search of the High-Performance Culture: While the performance management system is clearly a critical driver of individual performance, its ultimate success or failure is a product of the cultural environment that surrounds it. Indeed, throughout the course of the research, the Council observed that some organizations’ cultures actively support high performance more successfully than do others. Although it is obvious that organizational culture plays a role in the success or failure of individuals, it is much more diffi cult to determine which cultural elements are more or less important. This chapter will examine which of nine cultural elements are most important to improving employee performance.
Measuring the Presence of Cultural Traits: To measure the impact of each cultural trait on employee performance, the Council included a series of questions within the 2002 Performance Management Survey that asked employees to agree or disagree with a series of statements about their organizations. For example, for coworker involvement, respondents were asked questions to determine whether their coworkers take pride in the organization or apply extra effort to their job. Similarly, to assess the presence of diffuse decision-making authority in an organization’s culture, employees were asked whether the organization delegates decision making and allows decisions to be made without manager approval. Details about each of the nine cultural traits are included in the table below.

19b
Potential Performance Drivers
Source: Corporate Leadership Council 2002 Performance Management Survey.
Performance Culture
Cultural Trait Defi nition
Coworker involvement • Employees’ perceptions of whether their coworkers take pride in the organization, put a lot of effort into what they do and are willing to volunteer, and whether it is diffi cult to get people to do extra work
Diffuse decision-making authority
• Employees’ perceptions on whether many actions can be taken without the approval of the manager and whether small matters have to be referred to someone higher for a fi nal answer
Risk taking• Whether employees believe that their organization has a strong desire for high-risk, high-return investments
• Whether employees believe that initial failures don’t refl ect on their competence (i.e., if people fail in the process of creating something new, the organization encourages them to keep trying)
Coworker cohesion • Whether employees take a personal interest in each other, get along well, feel like they have a lot in
common, and pitch in to help each other out
• Whether employees describe their organization as having a lot of team spirit
Innovation • Employees’ perceptions of whether their organization encourages them to fi nd new ways around old problems, develop their own ideas, and improve upon the organization’s methods
Flexibility • Whether employees agree that their organization can be described as fl exible, continually adapting to
change, and always moving toward improved ways of doing things
• Employees’ perceptions on whether or not top managers are set in their ways
Differential treatment of best and worst performers
• Employees’ beliefs that the best performers always get promoted and get much larger raises and bonuses than the worst performers
• Whether the organization weeds out the worst performing employees
Internal communication
• Extent to which there is good communication between peers
• Whether employees believe their managers are willing to share all relevant information
• Number of opportunities for junior staff to have informal conversations with senior personnel
Future orientation • Employees’ perceptions on whether the ability to plan ahead is highly valued in their organization,
management constantly plans for the future of the organization, and people are encouraged to take a long-term view of their career

20a
The Freedom to Take Risks, Communicate, and Be Flexible
The graph below presents the percentage impact that a number of cultural traits have on employee performance. The taller the bar on the graph, the greater the impact the strategy has on individual performance (including both direct and indirect effects). The nine cultural traits are displayed from left to right in descending order of impact.
Risk Taking, Internal Communication, and Flexibility Drive Performance: As shown below, the single cultural trait with the largest impact on employee performance is a culture of risk taking. Risk taking—a culture in which employees are provided with incentives and encouragement to work on new ideas despite uncertain outcomes or initial failures—can improve employee performance by a striking 39 percent, clearly making the Council’s list of A-level performance strategies.
A culture of internal communication—one that is characterized by frequent and effective communication between peers and the steady fl ow of information, not only up and down, but across the organization—is also an A-level performance strategy. Such a culture often has opportunities for junior staff to speak and interact with senior executives. As shown below, a culture of internal communication has a signifi cant impact on individual performance, leading to potential performance improvements of nearly 35 percent.
In addition to risk taking and internal communication, fl exibility—a culture that is continually adapting to change and is committed to process improvement—is also a B-level driver, improving individual performance by 22.9 percent.
Indeed, it is striking that three of the Council’s nine A-level performance drivers are all related to organizational culture. The combination of these three cultural traits—risk taking, internal communication, and fl exibility—provides an emerging defi nition of the high-performance culture as one that creates a community of openness where employees are encouraged to experiment and try new things without fear of reprisal for mistakes.
Only Minimal Impact from Differential Treatment of Best and Worst Performers: Before moving on to a more detailed look at some of these cultural traits, it is fi rst important to note not only items that excel at driving performance, but also those with a more limited impact. As shown on the right-hand side of the graph below, differential treatment of best and worst performers is much less important to driving individual employee performance than a number of other cultural traits, a fi nding that is perhaps somewhat surprising. The next page provides more detail into why risk taking and internal communication are clearly important contributors to high performance, while differential treatment of best and worst performers has a noticeably smaller impact.

20b
Risk T
aking
Inter
nal C
ommun
icatio
n
Flexib
ility
Innov
ation
Futur
e Orie
ntatio
n
Cowor
ker I
nvolv
emen
t
Cowor
ker C
ohes
ion
Diffuse
Dec
ision-M
aking
Auth
ority
Differe
ntial T
reatm
ent o
f Bes
t
and W
orst
Perfo
rmer
s0.0
25.0
50.0
38.9
34.4
22.9
16.7
9.57.7 7.2
4.71.5
The Culture of High PerformanceRisk Taking, Communication, and Organizational Flexibility Most Important
Maximum Impact of Cultural Traits on Employee Performance*
Change in Performance
Level of Performance Driver
A-Level ≥25.0B-Level 10.0 to 24.9C-Level 0.0 to 9.9D-Level <0.0
Source: Corporate Leadership Council 2002 Performance Management Survey.
Performance Drivers: Performance Culture
* Each bar presents a statistical estimate of the maximum total impact on employee performance each strategy will produce. The total impact includes the strategy’s direct impact on performance as well as any indirect impact it may have through employee attitudes. The maximum total impact is calculated by comparing two statistical estimates: the predicted performance level for an employee who scores “high” on the strategy and the predicted performance level for an employee who scores “low” on the strategy. The impact of each strategy is modeled separately. A strategy that fails to achieve traditional levels of statistical signifi cance is denoted with a white bar (t < 2.0).

21a
Indirect and Direct Impact
Why do organizational cultures that support risk tolerance and internal communication have such a strong effect on individual performance, while differential treatment of best and worst performers has such a limited impact? The graphic below explains these results in further detail, breaking down the “total impact” into its component parts of direct and indirect effects.
A Closer Look at Risk Taking: As shown below, a culture of risk tolerance has a substantial and positive impact on three important employee attitudes. Employees who work in a risk-tolerant culture are likely to put 18 percent more effort into their job, be 45 percent more committed to their organization, and feel 33 percent more closely matched with their jobs than are employees in a risk-intolerant culture. Moreover, promoting a risk-tolerant culture has further direct benefi ts. Specifi cally, it has a direct positive effect by encouraging employees to push themselves beyond their current practice, leading to a total impact on performance of nearly 39 percent.
Understanding the Benefi ts of Internal Communication: Internal communication—the extent to which information fl ows upward and downward within an organization—has a very powerful impact on employee performance. In fact, it can lead to increases in discretionary effort of 17 percent, increases in organizational commitment of 43 percent, and increases in match with job of 34 percent. It, too, has a positive direct impact on performance by providing employees with information that they may not otherwise have had, leading to a total impact on performance of 34 percent.
Only a Small Impact from Differential Treatment by Performance: The far right column presents further detail into the impact of differential treatment of best and worst performers on performance levels. A culture of differentiation can increase discretionary effort by 5 percent, commitment by 23 percent, and match with job by 13 percent. It even has a positive impact on team strength, defi ned as the degree to which individuals believe that their colleagues bring something important to the team, do their fair share of work, and care about the quality of their work. However, although a culture of differentiation clearly has strong and positive impacts on a number of important attitudes (and may support organizations’ recruiting and retention efforts), weeding out underperformers and rewarding top performers does not in itself provide employees with information, resources, or experiences that directly improve their performance.

21b© 2002 Corporate Executive Board
The Value of CultureCultural Traits Drive Attitudes of Performance
Source: Corporate Leadership Council 2002 Performance Management Survey.
A Closer Look at Performance Culture
Risk Taking: Impact on Performance*
Discretionary Effort (18.4%)
Commitment (45.7%)
Match with Job (33.4%)
Direct Impact (29.7%)
Increases Individual Performance
by 38.9%
Risk Taking
Internal Communication: Impact on Performance*
InternalCommunication
IncreasesIndividual Performance
by 34.4%
Discretionary Effort (17.1%)
Commitment (43.2%)
Match with Job (34.7%)
Direct Impact (26.7%)
Differential Treatment of Best and Worst Performers: Impact on Performance*
Differential Treatment of Best and Worst Performers
Increases Individual Performance
by 1.5%
Discretionary Effort (5.5%)
Commitment (23.2%)
Match with Job (13.1%)
Team Strength (29.3%)
Ø No Direct Impact
Indirect:
+ Direct:
= Total:
* The total impact of a strategy on employee performance is a weighted sum of the strategy’s direct and indirect effects. Each direct and indirect effect is weighted differently, which is why the direct and indirect effects do not sum to the total impact. Percentages next to employee attitudes denote the maximum percentage change produced by each strategy, expressed as a percentage of the total possible change.

22a
High-Performance Organizational Strategies
Summary of Performance Drivers—The Importance of Organizational Factors: Focusing performance management efforts solely on managers and employees may not be enough to ensure widespread performance improvement. Rather, organizations also must provide employees and managers with the institutional and cultural settings that enable and encourage high performance. Key lessons one and two revealed the importance of organizational factors to any performance management plan. In fact, three of the nine A-level performance strategies are organizational factors: ensuring that employees understand the standards on which they are evaluated, encouraging a culture of managed risk taking, and providing clear and accessible lines of communication.
Driving Individual Performance Through Understanding and Fairness: Findings from the Council’s research on the performance management system clarify the most effective ways for organizations to spend time and focus their resources. Data from this section reveals that the components of the system itself—or the system’s design and structure—are much less important than understanding, fairness, and credibility. The critical fi nding from this section is that the key to improving employee performance through the performance management system is helping employees to understand the standards on which they are evaluated and fostering a belief that they and their colleagues are being treated fairly by the system.
Many different performance management systems will likely work equally well. What is key to the success of any system, however, is that employees and managers understand how the system works and believe that the evaluation process is fair and credible.
Creating a High-Performance Culture Through Risk Taking and Internal Communication: As presented across the last few pages, the highest impact cultural elements focus on encouraging risk and creating a free fl ow of information up, down, and across the organization. While differentially treating strong and weak performers can signifi cantly impact a number of attitudes, it is obvious that a true high-performance culture requires much more than rewarding high performers and managing out low performers.
The remaining fi ve key lessons continue to build on this defi nition of high-performance. Having completed the review of organizational factors, the study next examines another set of players responsible for workforce performance: organizations’ line managers. Specifi cally, the next three key lessons investigate the importance of manager–employee interaction, the formal performance review, and informal performance feedback to employee performance.

22b
Organization
The Performance Management System
Performance Culture
Building the High-Performance WorkforceOrganizational Factors
• Encourage, yet manage, risk taking.
• Institutionalize the free fl ow of information, innovation, openness, and fl exibility.
• Differentially treating strong and weak performers is vital, but its ultimate impact on employee performance is limited.
Source: Corporate Leadership Council 2002 Performance Management Survey.
• Ensure employee understanding of performance standards.
• Create performance standards that are perceived as fair and linked to organizational success and strategy.
• Provide feedback to employees from multiple sources (e.g., 360-degree reviews).
• Understanding, connection, and fairness are more important than system design and structure.

23a
Manager–Employee Interaction
The third key lesson centers on the importance of the manager–employee relationship. Specifi cally, it discusses the sizeable impact that managers can have on employee performance by providing tangible solutions to day-to-day challenges at work.

23b
Seven Keys to High Performance
1. The Performance Management System: The Singular Power of Clarity
2. Performance Culture: The Freedom to Take Risks, Communicate, and Be Flexible
3. Manager–Employee Interaction: Solutions Enabler
4. Formal Performance Review: The Delicate Balance Between Praise and Critique
5. Informal Performance Feedback: The Primacy of Fairness and Accuracy
6. Day-to-Day Work: Connection Over Rewards
7. Job Opportunities: High Profi le, Good Fit, and New Skills

24a
Role of the Manager
This lesson explores a number of important questions on the role of the manager in driving performance: How important is it to performance that the manager be inspiring or listen carefully to others’ views? Are managers more successful at improving individual performance if they are hands-on or hands-off? Of all the various resources and information available, which should managers provide to employees to promote high performance?
Listed below are the 18 characteristics of manager–employee interaction included in the survey as potential drivers of high performance. Defi nitions for each characteristic are listed in the second column of the table. The list includes the most important elements of the many competing roles managers may play in their day-to-day interactions with employees, from manager as supporter and encourager, to manager as solutions provider, to manager as manager.
Manager as Supporter and Encourager: Items in this category include encouraging employees to be positive and enthusiastic about work, expressing confi dence in employees’ ability to do a job, inspiring others, persuading and encouraging others to move in a desired direction, recognizing and rewarding achievement, and listening carefully to views and opinions.
Manager as Solutions Provider: Items in this category include breaking down projects, clearly communicating expectations, creating work plans, helping teams get started on new projects, and translating long-term goals into step-by-step plans.
Manager as Manager: Items in this category include holding people accountable, measuring performance and results, and changing the scope of projects and assignments.
The next three pages take a closer look at each of these 18 manager characteristics in order to identify the set of managerial qualities that are most important for driving performance.

24b
Potential Performance Drivers
Manager Characteristics Defi nition
Breaks down projects into manageable components How strong or weak employees believe their manager is in breaking down a project into manageable components
Clearly communicates expectations How strong or weak employees believe their manager is in clearly communicating expectations overall and in regard to specifi c work or assignments
Creates work plans and timetables How strong or weak employees believe their manager is in creating work plans and timetables
Diffuses unhealthy rivalries or competition among team members How strong or weak employees believe their manager is in diffusing unhealthy rivalries or competition between team members
Encourages employees to be positive and enthusiastic about work
Whether employees believe that their manager encourages them to be positive and enthusiastic about their job and the organization
Expresses confi dence in employees’ ability to do job Whether employees agree that their manager expresses confi dence in their ability to do their job successfully
Helps team get started on a new project How strong or weak employees believe their manager is in helping a team get started on a new project
Helps attain needed information, resources, and technology
Employee perception of whether their manager helps them attain the information, resources, and technology they need to do their job successfully
Helps fi nd solutions to problems at work Whether employees agree that their manager helps fi nd solutions to problems at work
Holds people accountable How strong or weak employees believe their manager is in holding people accountable
Identifi es or removes unnecessary barriers at work (such as unnecessary rules or regulations)
How strong or weak employees believe their manager is in identifying or removing unnecessary barriers at work (such as unnecessary rules or regulations)
Inspires others How strong or weak employees believe their manager is in inspiring others
Listens carefully to views and opinions Whether employees feel that their manager listens carefully to their views and opinions on work issues
Measures performance and results How strong or weak employees believe their manager is in measuring performance and results
Persuades and encourages others to move in a desired direction How strong or weak employees believe their manager is in persuading and encouraging others to move in a desired direction
Recognizes and rewards achievement How strong or weak employees believe their manager is in rewarding and recognizing achievement
Translates long-term goals into step-by-step plans How strong or weak employees believe their manager is in translating a long-term goal or objective into a step-by-step plan
Makes frequent changes to projects and assignments Employee indications of how often their manager makes a fundamental change to their work projects or assignments in response to unforeseen developments or events
Source: Corporate Leadership Council 2002 Performance Management Survey.
Manager–Employee Interaction

25a
Manager: A Critical Factor in Employee Performance
Included in the graphic below are the 18 manager characteristics listed from left to right in decreasing order of their predicted impact on employee performance. As shown below, some manager characteristics have a much greater impact on employee performance than do others, and one of the studied characteristics has a negative impact. Due to this wide variation in impact, it is critical for organizations to be aware both of performance drivers and performance “killers,” and assess the presence of those behaviors in their current and future managers. Within the data presented below are three important implications for understanding the role of the manager as a driver of workforce performance.
Nearly All Manager Activities Impact Performance: Despite the variation in impact from the items listed on the far left to the item listed on the far right of the graph, nearly everything the manager does affects performance in some way. In fact, all but one of the 18 manager characteristics or behaviors improves individual performance. However, although there are numerous ways for managers to drive performance, no single activity belongs on the list of A-level performance strategies. Managers clearly have the power to improve the performance of their direct reports; however, no one manager activity stands out as one of the most important drivers of employee performance.
Manager as Solutions Enabler: The following six B-level strategies all have a sizeable impact on individual performance: helping fi nd solutions to problems at work, helping attain needed information, resources and technology, breaking down projects, translating long-term goals, clearly communicating expectations, and helping a team get started with a new project. It is noteworthy that all six of these activities center around managers providing employees with specifi c, tangible answers and assistance to help them do their day-to-day jobs. In other words, of all the activities that managers could focus on, providing day-to-day solutions for employees is what most drives performance.
Frequent Changes to Projects—A Performance Killer: Third, as shown on the far right side of the graph, managers can also destroy performance. In fact, managers who make frequent changes to their employees’ projects and assignments can reduce performance by up to 22 percent. This is one of the levers that clearly falls on the D-list of performance drivers.
With an understanding of both the positive and negative impact that managers’ actions can have on employee performance, the next goal is to understand why. What employee attitudes can managers impact, and how do shifts in those attitudes ultimately affect performance? The next page investigates two important manager-led strategies in more detail: helping employees fi nd solutions to problems at work and recognizing and rewarding achievement.

25b
Performance-Driving Management Means Providing Solutions and Required Resources
Maximum Impact of Manager–Employee Interaction on Performance*
(30.0)
0.0
30.0
23.7
19.2 18.516.7 16.2
11.9
7.3 6.8 6.8 6.7 6.1 5.7 5.6 5.6 5.3 4.6 4.4
(27.8)
Helps Find Solutions
to Problems at Work
Helps Attain Needed
Information, Resources,
and Technology
Breaks Down
Projects into Manageable Components
Translates Long-Term Goals into Step-by-Step Plans
Clearly Communicates Expectations
Helps Team Get Started on New Projects
Creates Clear Work Plans and
Timetables
Identifi es/Removes
Unnecessary Barriers
Encourages Employees
to Be Positive and Enthusiastic About Work
Persuades and Encourages Others to Move in
a Desired Direction
Holds People
Accountable
Listens Carefully to Views
and Opinions
Measures Performance and Results
Inspires Others
Diffuses Unhealthy
Rivalries and Competition
Expresses Confi dence in Ability to Do the Job
Recognizes and Rewards Achievement
Makes Frequent
Changes to Projects and Assignments
Cha
nge
in
Perf
orm
ance
Level of Performance Driver
A-Level ≥25.0B-Level 10.0 to 24.9C-Level 0.0 to 9.9D-Level <0.0
* Each bar presents a statistical estimate of the maximum total impact on employee performance each strategy will produce. The total impact includes the strategy’s direct impact on performance as well as any indirect impact it may have through employee attitudes. The maximum total impact is calculated by comparing two statistical estimates: the predicted performance level for an employee who scores “high” on the strategy and the predicted performance level for an employee who scores “low” on the strategy. The impact of each strategy is modeled separately. A strategy that fails to achieve traditional levels of statistical signifi cance is denoted with a white bar (t < 2.0).
Source: Corporate Leadership Council 2002 Performance Management Survey.
Performance Drivers: Manager–Employee Interaction

26a
Indirect and Direct Impact
Despite widespread agreement on the importance of the manager to employee performance, there is a lack of hard data and quantifi able measures explaining the difference between managers who excel and those who struggle with certain manager activities. On the page below, the Council presents a fi rst step in understanding the true impact that some managers can have on an organization’s workforce. The graphic illustrates the potential impact of a manager who helps employees fi nd solutions to problems at work and one who excels at recognizing and rewarding achievement.
Importance of Helping Employees Find Solutions: Helping fi nd solutions to employees’ problems at work has a sizeable impact on several high-performance attitudes. Specifi cally, employees whose managers provide solutions to work problems put nearly 22 percent more effort into their job, are nearly 43 percent more committed to the organization and feel 39 percent more closely matched with their jobs than do employees who have no manager assistance in solving day-to-day problems at work. Moreover, helping employees fi nd solutions to problems at work has a direct positive impact of over 17 percent. Combining these indirect and direct effects results in a total impact of nearly 24 percent.
A Smaller Impact on Performance from Recognizing and Rewarding Achievement: Recognizing and rewarding employees for their achievements also has a positive impact on performance. In fact, it leads to increases in discretionary effort of 19 percent, increases in organizational commitment of nearly 36 percent, and increases in match with job of 35 percent. However, because recognizing and rewarding achievement does not provide employees with job-relevant information, experiences, or resources, it does not have a direct impact on performance. That said, due to its sizeable impact on employee attitudes, recognizing and rewarding achievement boosts individual performance by over 4 percent.
In both cases, managers who excel at these two activities have employees who are signifi cantly more committed, who try harder, and who feel that they are in the right job. However, the two activities differ signifi cantly in their total impact on individual performance. Finding solutions directly impacts performance. The second activity—recognizing and rewarding achievement—impacts employee performance through attitudes alone. Although both positively impact individual performance, helping fi nd solutions has a much larger positive effect due to its direct effect on the challenges that employees confront day-to-day.

26b
The Power of Immediate Impact
Source: Corporate Leadership Council 2002 Performance Management Survey.
A Closer Look at Manager–Employee Interaction
Manager Helping to Find Solutions to Problems at Work: Impact on Performance*
Manager Recognizing and Rewarding Achievement: Impact on Performance*
Recognizing and Rewarding Achievement
Discretionary Effort (21.9%)
Commitment (42.9%)
Match with Job (39.4%)
Direct Impact (17.6%)
IncreasesIndividual Performance
by 23.7%
Increases Individual Performance
by 4.4%
Discretionary Effort (19.0%)
Commitment (35.9%)
Match with Job (35.5%)
Ø No Direct Impact
Helping Find Solutions to Problems at Work
Indirect:
+ Direct:
= Total:
* The total impact of a strategy on employee performance is a weighted sum of the strategy’s direct and indirect effects. Each direct and indirect effect is weighted differently, which is why the direct and indirect effects do not sum to the total impact. Percentages next to employee attitudes denote the maximum percentage change produced by each strategy, expressed as a percentage of the total possible change.

27a
Formal Performance Review
The fourth key lesson addresses the impact of the formal review on individual performance and the importance of maintaining a balance between praise and critique.

27b
Seven Keys to High Performance
1. The Performance Management System: The Singular Power of Clarity
2. Performance Culture: The Freedom to Take Risks, Communicate, and Be Flexible
3. Manager–Employee Interaction: Solutions Enabler
4. Formal Performance Review: The Delicate Balance Between Praise and Critique
5. Informal Performance Feedback: The Primacy of Fairness and Accuracy
6. Day-to-Day Work: Connection Over Rewards
7. Job Opportunities: High Profi le, Good Fit, and New Skills

28a
The Delicate Balance Between Praise and Critique
Lesson three examined the role of the manager in general. This lesson focuses on the core manager event within traditional performance management systems: the formal performance review. Throughout this study, the term “formal review” refers to the formal meetings between managers and employees that usually occur once or more per year and are used to document and discuss each employee’s performance level.
Listed below are a number of activities that managers engage in as part of the formal review process. Of course, there is a natural limit to the number of things managers can emphasize during the formal review and frequently they must make choices about how to allocate their time during the discussion. Some managers may choose to focus more on an employee’s performance or personality strengths while others may concentrate on performance or personality weaknesses. Some managers place greater emphasis on promotions and bonuses rather than skill development or long-term career prospects with the organization. The important question, however, is what sort of impact do these choices have on the performance of their direct reports? What does an ideal performance review discussion—one that drives employee performance to the next level—look like?
Across the next three pages, these questions are examined in greater detail, with the goal of further expanding the list of critical manager-led performance drivers.

28b
Potential Performance Drivers
Formal Review Characteristic Defi nition
Emphasis on performance strengths Amount of emphasis employees believe their manager placed on performance strengths in their last formal performance review
Emphasis on performance weaknesses
Amount of emphasis employees believe their manager placed on performance weaknesses in their last formal performance review
Emphasis on personality strengths Amount of emphasis employees believe their manager placed on personality strengths in their last formal performance review
Emphasis on personality weaknesses Amount of emphasis employees believe their manager placed on personality weaknesses in their last formal performance review
Emphasis on skills and behaviors needed in the future
Amount of emphasis employees believe their manager placed on skills and behaviors they need to develop in the future in their last formal performance review
Emphasis on specifi c outcomes of formal performance review (e.g., promotions, raises, or bonuses)
Amount of emphasis employees believe their manager placed on specifi c outcomes (e.g., promotions, raises, bonuses) in their last formal performance review
Emphasis on specifi c suggestions for doing the job better
Amount of emphasis employees believe their manager placed on specifi c suggestions for doing their job better in their last formal performance review
Emphasis on long-term career prospects within the organization
Amount of emphasis employees believe their manager placed on their long-term career prospects within the organization in their last formal performance review
Source: Corporate Leadership Council 2002 Performance Management Survey.
Formal Performance Review

29a
Impact of Formal Performance Review
Focus on the Positive: As shown by the height of the bar on the far left-hand side of the graphic, emphasizing the positive in performance reviews can have a substantial impact on employee performance. In fact, emphasis on performance strengths in formal reviews, with a possible impact of more than 36 percent, clearly falls onto the list of A-level performance strategies. The second bar on the graphic—emphasis on personality strengths—also has a positive impact on individual performance, but to a lesser extent than emphasis on performance strengths does.
Being Specifi c and Targeted Also a Key Driver: While the impact is slightly less than for emphasizing strengths, being specifi c with employees on the outcomes of the formal performance review (e.g., promotions, raises, or bonuses) also has a positive impact on performance of 6.6 percent.
Emphasize the Future: The middle of the graph also reveals the importance of emphasizing employees’ long-term career prospects during formal reviews. The sizeable impact on performance from communicating with employees about their long-term potential within the organization suggests that the traditional view of the labor market—one in which employees spend their career at only one or two organizations—may not be as outdated as previously believed.
Emphasis on Weaknesses—A Performance Killer: Finally, as shown on the far right of the graph, emphasis on certain things in the formal review can damage employee performance. Specifi cally, emphasis on performance weaknesses—to the exclusion of other types of feedback—reduces performance substantially. These fi ndings suggest the importance of educating line managers on the possible side effects of providing “tough” feedback and the need to accompany any negative feedback with specifi c suggestions for doing the job better.
These fi ndings offer insight into what managers should emphasize and avoid during formal review discussions with employees. Constructive comments on skills in need of development and specifi c suggestions for doing the job better are clearly very valuable, but are dwarfed by two extremes on the skyline: emphasizing the positive and emphasizing the negative. The next page offers further detail to explain the sizeable gap in performance impact between these two items.

29b
(40.0)
0.0
40.0 36.4
21.3
9.16.6 5.3 4.2
(5.5)
(26.8)
Emphasizing the Positive Drives High PerformanceMaximum Impact of Formal Performance Review on Employee Performance*
Emphasis on Performance
Strengths
Emphasis on Skills and Behaviors Needed in the Future
Emphasis on Personality
Weaknesses
Emphasis on Performance Weaknesses
Emphasis on Personality Strengths
Emphasis on Specifi c
Outcomes of Formal Review
Emphasis on Specifi c Suggestions
for Doing the Job Better
Emphasis on Long-Term
Career Prospects
Change in Performance
Level of Performance Driver
A-Level ≥25.0B-Level 10.0 to 24.9C-Level 0.0 to 9.9D-Level <0.0
* Each bar presents a statistical estimate of the maximum total impact on employee performance each strategy will produce. The total impact includes the strategy’s direct impact on performance as well as any indirect impact it may have through employee attitudes. The maximum total impact is calculated by comparing two statistical estimates: the predicted performance level for an employee who scores “high” on the strategy and the predicted performance level for an employee who scores “low” on the strategy. The impact of each strategy is modeled separately. A strategy that fails to achieve traditional levels of statistical signifi cance is denoted with a white bar (t < 2.0).
Source: Corporate Leadership Council 2002 Performance Management Survey.
Performance Drivers: Formal Performance Review

30a
Indirect and Direct Impact
The page below explains why emphasizing performance strengths drives such substantial improvements in employee performance while emphasizing performance weaknesses leads to a signifi cant decrease in performance.
Emphasizing Performance Strengths: Employees whose managers emphasize performance strengths during formal reviews are willing to extend higher levels of discretionary effort to their work, are more committed to their organization, feel well matched with their job, and believe that they have the necessary resources to do their job. In other words, by emphasizing the positive, managers are more likely to have employees who try harder, are more committed to the organization, and feel more comfortable with their work.
Emphasizing Performance Weaknesses: As demonstrated in the graphic on the right-hand side of the page, there are few benefi ts to focusing on the negative during performance reviews. In fact, emphasis on the negative reduces the presence a number of key attitudes. Managers who emphasize performance weaknesses are more likely to have employees who feel they are not in the right job and who put less effort into their work. Emphasizing weaknesses also results in a sizeable direct and negative direct impact on performance. In fact, out of all of the factors examined in the research, emphasizing performance weaknesses has the second largest negative impact on performance.
The primary lesson from this section is a note of caution. It is critical for organizations to be clear with managers about how to conduct formal reviews with their employees. While presenting employees with specifi c suggestions for doing their job better is an important driver of performance, giving predominantly “tough” or negative feedback, absent specifi c suggestions for improving performance, can ultimately undermine the goal of the formal review and lead to a drop in employee performance.

30b
Why “Going Positive” Works
Source: Corporate Leadership Council 2002 Performance Management Survey.
A Closer Look at Formal Performance Reviews
Emphasizing Performance Strengths: Impact on Performance*
Emphasizing Performance Weaknesses: Impact on Performance*
Emphasizing Performance Weaknesses
Discretionary Effort (14.0%)
Commitment (21.2%)
Match with Job (20.5%)
Having Necessary Resources (23.2%)
Direct Impact (31.2%)
Increases Individual Performance
by 36.4%
Decreases Individual Performance
by 26.8%
Discretionary Effort (6.3%)
Commitment (2.2%)
Match with Job (6.6%)
Having Necessary Resources (5.4%)
Direct Impact (25.2%)
Emphasizing Performance Strengths
Indirect:
+ Direct:
= Total:
* The total impact of a strategy on employee performance is a weighted sum of the strategy’s direct and indirect effects. Each direct and indirect effect is weighted differently, which is why the direct and indirect effects do not sum to the total impact. Percentages next to employee attitudes denote the maximum percentage change produced by each strategy, expressed as a percentage of the total possible change.

31a
Informal Performance Feedback
Lesson fi ve addresses the key role that fair and accurate informal feedback plays in driving individual performance.

31b
Seven Keys to High Performance
1. The Performance Management System: The Singular Power of Clarity
2. Performance Culture: The Freedom to Take Risks, Communicate, and Be Flexible
3. Manager–Employee Interaction: Solutions Enabler
4. Formal Performance Review: The Delicate Balance Between Praise and Critique
5. Informal Performance Feedback: The Primacy of Fairness and Accuracy
6. Day-to-Day Work: Connection Over Rewards
7. Job Opportunities: High Profi le, Good Fit, and New Skills

32a
The Primacy of Fairness and Accuracy
Unlike the formal review process, informal feedback is not a calendar-based event. Instead, informal feedback is given outside of the formal review. Managers can deliver informal feedback to employees in face-to-face conversations or anytime through e-mail and voice mail. But how much value does informal feedback add, beyond that already given through the formal performance review? Does it improve performance? How important is the frequency of informal feedback? If informal feedback is provided, what should the manager say or do to ensure that the feedback has a positive effect on performance?
The list of informal feedback characteristics that the Council examined is included below. The Council considered frequency of feedback as well as the value of proactive feedback volunteered by the manager compared to feedback that is sought out by the employee. The importance of what is emphasized during informal feedback was also examined. Finally, method of delivery, perceived fairness of feedback, and overall manager knowledge about performance were analyzed.
Beginning with the wide range of possibilities presented on this page, this lesson reveals how managers can provide informal feedback to maximize employee performance.

32b
Potential Performance DriversInformal Feedback Characteristic Defi nition
Emphasis on amount of effort put into the job Amount of emphasis employees say their manager places during informal feedback on the amount of effort they put into their job
Emphasis on performance strengths Amount of emphasis employees say their manager places on their performance strengths
Emphasis on performance weaknesses Amount of emphasis employees say their manager places during informal feedback on their performance weaknesses
Emphasis on personality strengths Amount of emphasis employees say their manager places during informal feedback on their personality strengths
Emphasis on personality weaknesses Amount of emphasis employees say their manager places during informal feedback on their personality weaknesses
Emphasis on skills and behaviors needed in the future
Amount of emphasis employees say their manager places during informal feedback on the skills and behaviors they need to improve in the future
Emphasis on specifi c suggestions for doing the job better
Amount of emphasis employees say their manager places during informal feedback on specifi c suggestions for doing their job better
Fairness and accuracy of informal feedback Whether employees believe that the informal feedback their manager gives them about their work performance is fair and accurate
Feedback that helps employees do their jobs better Whether employees believe that the informal feedback their manager gives them about their work performance helps them do their job better
Feedback that is detailed and specifi c Whether employees believe that the informal feedback their manager gives them about their work performance is detailed and specifi c
Immediate versus delayed feedback Employee reports of about how often their manager gives them informal feedback about their work performance
Manager likelihood to volunteer informal feedback Whether employees need to ask their manager for informal feedback about their work performance in order to receive it
Method of delivering informal feedback: face-to-face Whether managers usually deliver informal feedback in face-to-face conversations
Manager knowledgeable about employee performance How much employees think their manager knows about their level of performance
Source: Corporate Leadership Council 2002 Performance Management Survey.
Informal Performance Feedback
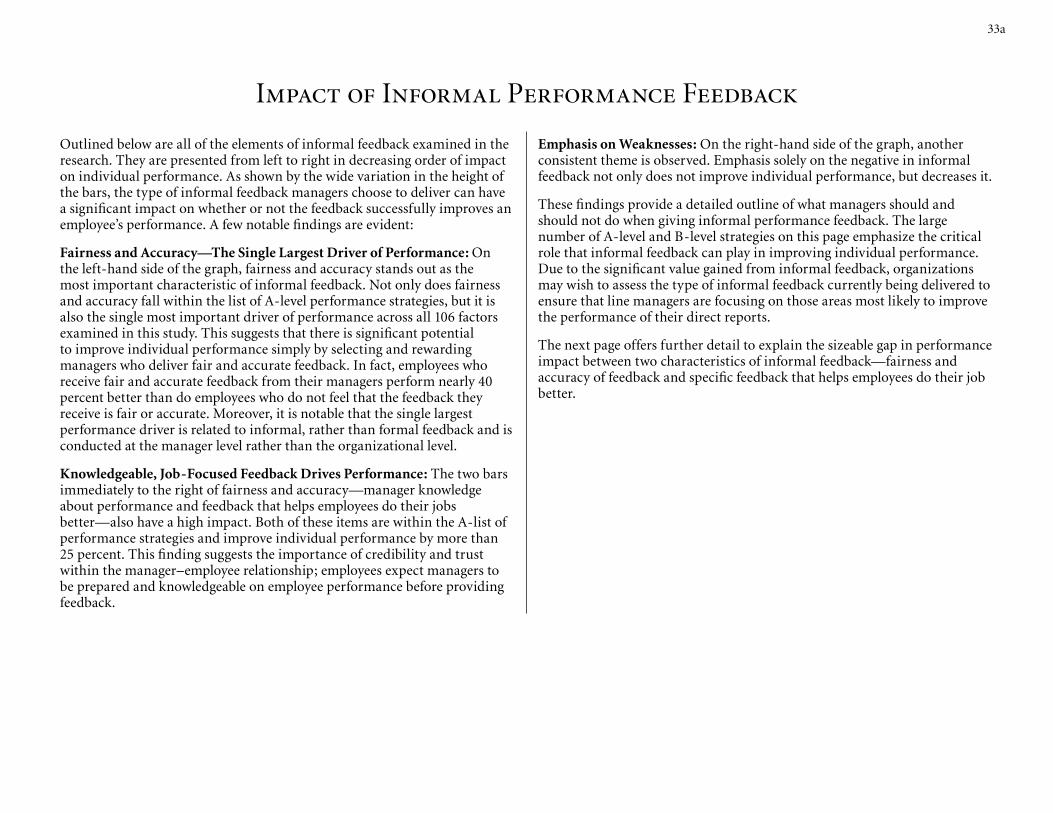
33a
Impact of Informal Performance Feedback
Outlined below are all of the elements of informal feedback examined in the research. They are presented from left to right in decreasing order of impact on individual performance. As shown by the wide variation in the height of the bars, the type of informal feedback managers choose to deliver can have a signifi cant impact on whether or not the feedback successfully improves an employee’s performance. A few notable fi ndings are evident:
Fairness and Accuracy—The Single Largest Driver of Performance: On the left-hand side of the graph, fairness and accuracy stands out as the most important characteristic of informal feedback. Not only does fairness and accuracy fall within the list of A-level performance strategies, but it is also the single most important driver of performance across all 106 factors examined in this study. This suggests that there is signifi cant potential to improve individual performance simply by selecting and rewarding managers who deliver fair and accurate feedback. In fact, employees who receive fair and accurate feedback from their managers perform nearly 40 percent better than do employees who do not feel that the feedback they receive is fair or accurate. Moreover, it is notable that the single largest performance driver is related to informal, rather than formal feedback and is conducted at the manager level rather than the organizational level.
Knowledgeable, Job-Focused Feedback Drives Performance: The two bars immediately to the right of fairness and accuracy—manager knowledge about performance and feedback that helps employees do their jobs better—also have a high impact. Both of these items are within the A-list of performance strategies and improve individual performance by more than 25 percent. This fi nding suggests the importance of credibility and trust within the manager–employee relationship; employees expect managers to be prepared and knowledgeable on employee performance before providing feedback.
Emphasis on Weaknesses: On the right-hand side of the graph, another consistent theme is observed. Emphasis solely on the negative in informal feedback not only does not improve individual performance, but decreases it.
These fi ndings provide a detailed outline of what managers should and should not do when giving informal performance feedback. The large number of A-level and B-level strategies on this page emphasize the critical role that informal feedback can play in improving individual performance. Due to the signifi cant value gained from informal feedback, organizations may wish to assess the type of informal feedback currently being delivered to ensure that line managers are focusing on those areas most likely to improve the performance of their direct reports.
The next page offers further detail to explain the sizeable gap in performance impact between two characteristics of informal feedback—fairness and accuracy of feedback and specifi c feedback that helps employees do their job better.

33b
(30.0)
10.0
50.0
39.1
30.325.8
22.3
14.710.6
6.73.1
1.2 1.1 0.2 0.0
(3.2)
(10.9)
Fair and Accurate Informal Feedback Drives PerformanceMaximum Impact of Informal Performance Feedback on Employee Performance*
Fairness and
Accuracy
Feedback That Helps Employees Do Jobs Better
Manager Likelihood
to Volunteer Informal Feedback
Emphasis on Skills to Develop in the Future
Emphasis on Performance Weaknesses
Emphasis on Personality
Weaknesses
Emphasis on Personality Strengths
Detailed and
Specifi c Feedback
Emphasis on Amount
of Effort Put into the Job
Change in Performance
Level of Performance Driver
A-Level ≥25.0B-Level 10.0 to 24.9C-Level 0.0 to 9.9D-Level <0.0
Manager Knowledgeable
About Employee
Performance
Immediate Versus
Delayed Feedback
Method of Delivering Informal
Feedback: Face-to-Face
Emphasis on Specifi c Suggestions for Doing the Job
Emphasis on Performance
Strengths
* Each bar presents a statistical estimate of the maximum total impact on employee performance each strategy will produce. The total impact includes the strategy’s direct impact on performance as well as any indirect impact it may have through employee attitudes. The maximum total impact is calculated by comparing two statistical estimates: the predicted performance level for an employee who scores “high” on the strategy and the predicted performance level for an employee who scores “low” on the strategy. The impact of each strategy is modeled separately. A strategy that fails to achieve traditional levels of statistical signifi cance is denoted with a white bar (t < 2.0).
Source: Corporate Leadership Council 2002 Performance Management Survey.
Performance Drivers: Informal Performance Feedback

34a
Indirect and Direct Impact
The page below provides further detail on two A-level strategies within the informal feedback category.
The Benefi ts of Giving Fair and Accurate Feedback: The single largest driver of individual performance—giving fair and accurate informal feedback—also has a substantial positive impact on three key high-performance attitudes. As illustrated below, increasing employees’ perceptions that the feedback they receive is both fair and accurate can substantially boost the amount of effort they put into their job, their commitment to the organization, and their belief that they are well matched with their job.
Importance of Job-Relevant Feedback: The graphic on the right-hand side of the page discusses the impact of providing employees with specifi c feedback that helps them do their jobs better. As shown below, employees who receive job-relevant feedback from their managers work nearly 22 percent harder, are 39 percent more committed to the organization, and are 42 percent more likely to feel that they are in the right job than their peers who do not receive the same type of job-relevant feedback.

34b
Tell Me How I’m DoingWhy Fair, Accurate, Job-Relevant Feedback Works
Source: Corporate Leadership Council 2002 Performance Management Survey.
A Closer Look at Informal Performance Feedback
Fair and Accurate Feedback: Impact on Performance*
Being Fair and Accurate in Giving Feedback
Discretionary Effort (23.3%)
Commitment (40.0%)
Match with Job (40.6%)
Direct Impact (33.6%)
IncreasesIndividual Performance
by 39.1%
Feedback That Helps Employees Do Their Jobs Better: Impact on Performance*
Giving Informal Feedback That Helps Employees Do Their Job Better
Discretionary Effort (21.9%)
Commitment (39.2%)
Match with Job (42.0%)
Direct Impact (20.2%)
IncreasesIndividual Performance
by 25.8%
Indirect:
+ Direct:
= Total:
* The total impact of a strategy on employee performance is a weighted sum of the strategy’s direct and indirect effects. Each direct and indirect effect is weighted differently, which is why the direct and indirect effects do not sum to the total impact. Percentages next to employee attitudes denote the maximum percentage change produced by each strategy, expressed as a percentage of the total possible change.

35a
Summary of Manager-Related Factors
Manager-related factors account for four of the nine A-level performance drivers. By emphasizing performance strengths during formal reviews, providing fair and accurate informal feedback, being knowledgeable about employee performance, and providing feedback that helps employees do their jobs better, managers have the power and opportunity to improve the performance of their direct reports by more than 25 percent.
It is clear by looking across the last three sections that the manager is truly a critical player in driving employee performance. The graphic below presents a summary of the three manager-related factors examined in this study (manager–employee interaction, formal performance review, and informal performance feedback) and summarizes exactly which activities managers should focus on in order of their impact on performance.
Manager–Employee Interaction: Everything the manager does affects performance to some extent. However, while most manager-led activities clearly boost individual performance, others can destroy it. Strategies and behaviors that directly affect individuals’ abilities to do their jobs in an immediate, day-to-day sense have the most impact on performance. On the other hand, managers can drive down performance of their direct reports—especially if they provide unclear or inconsistent expectations.
Formal Review—Positive, Specifi c, and Job-Relevant Feedback: To achieve the maximum possible positive impact on individual performance from formal reviews, managers should emphasize the positive aspects of employee performance and personality. Solid gains in performance can also be seen from offering specifi c suggestions for improvement and including a discussion of the employee’s long-term career with the organization. Focusing on the negative, without providing specifi c suggestions for improving on performance weaknesses, can decrease performance signifi cantly.
Informal Feedback—Fair, Accurate, and Proactive Feedback Also Critical: Informal feedback is an incredibly important tool for driving individual performance. In fact, not only is the number one driver of performance (fair and accurate feedback) within this category, but also two additional A-level strategies related to informal feedback (managers knowledgeable about employees’ performance and feedback that is focused on helping employees do their jobs better). While providing fair, accurate, and timely feedback is certainly critical, it is only a fi rst step on the path to improving employee performance. Managers must also recognize the importance of providing this feedback voluntarily, rather than waiting for employees to request it.
Understanding the Role of the Manager: It is critical for organizations to assist and support their managers in providing employees with the information, resources, and feedback they require to do their jobs. Incorporating this understanding of which strategies drive employee performance into selection and promotion criteria and manager training programs will ensure that managers recognize the importance of the key performance strategies and know how to exhibit them well. Across a given organization, there may be hundreds or thousands of managers, some of whom are successful at these important activities and others whom are not. It is by fi nding ways to ensure that all managers focus on and succeed at those activities identifi ed as performance drivers that organizations will begin to see signifi cant positive changes in individual performance across the entire workforce.

35b
Building the High-Performance WorkforceManager-Related Factors
Manager
Manager–Employee Interaction Informal Feedback
Source: Corporate Leadership Council 2002 Performance Management Survey.
Formal Review
• Fair and accurate informal feedback on performance from a knowledgeable source is the single most effective performance management lever available to the organization.
• Feedback should be voluntary, detailed, immediate, and positive.
• Managers must help employees fi nd tangible, immediate solutions to specifi c work challenges to improve performance.
• Managers must provide needed information, resources, and technology.
• Managers can be “performance killers” by providing employees with unclear or inconsistent expectations.
• Managers must emphasize the positive during formal reviews.
• Discussion of performance weaknesses must be clearly focused on specifi c suggestions for improvement or development; if not, emphasizing weaknesses can dramatically decrease performance.
• Review should also include a discussion of the employee’s long-term career in the organization.

36a
Day-to-Day Work
Lesson six examines the importance of employees’ day-to-day work, revealing that personal connection, rather than incentives, drives high performance.

36b
Seven Keys to High Performance
1. The Performance Management System: The Singular Power of Clarity
2. Performance Culture: The Freedom to Take Risks, Communicate, and Be Flexible
3. Manager–Employee Interaction: Solutions Enabler
4. Formal Performance Review: The Delicate Balance Between Praise and Critique
5. Informal Performance Feedback: The Primacy of Fairness and Accuracy
6. Day-to-Day Work: Connection Over Rewards
7. Job Opportunities: High Profi le, Good Fit, and New Skills

37a
Day-to-Day Work: Connection Over Rewards
With a clear understanding of both the organizational and manager-related factors that impact individual performance, the study now investigates the role of the individual employee in driving workforce performance. The discussion begins by focusing on the day-to-day work employees do at their jobs, specifi cally the kinds of activities and projects they work on and whether they enjoy their day-to-day work, understand their role, and believe they will be rewarded for performing well.
Listed below are the characteristics of employees’ day-to-day work that the Council examined in this lesson, including the degree to which work is challenging, the perceived connection between work and rewards, infl uence in selecting projects, whether employees enjoy their projects, and whether they understand the perceived importance of their projects. The next section will investigate each of these characteristics in detail, ultimately revealing which characteristics of employees’ day-to-day work matter most to individual performance.

37b
Potential Performance Drivers
Source: Corporate Leadership Council 2002 Performance Management Survey.
Day-to-Day Work Characteristic Defi nition
Challenge of projects and assignments Employees’ perceptions of how challenging their work is
Connection between successful project completion and incentives such as size of annual merit increase, size of annual bonus, opportunity for higher performance rating, opportunity for promotion, and raise in base salary
Whether employees believe that the better their performance, the more likely they are to receive a larger merit increase, larger annual bonus, higher performance rating, larger opportunity for promotion, and larger raise in base salary
Employee infl uence in selecting projects Employees’ reports on how much infl uence they have in picking which projects and assignments they work on as part of their day-to-day job
Employees’ personal enjoyment of their work Employees’ indication of whether or not they personally enjoy their job
Employee understanding of connections between day-to-day work and organizational strategy
Whether employees understand how their work projects or assignments are connected to their organization’s overall strategy
Employee understanding of how to complete projects and assignments
Whether employees feel like they understand how to successfully complete their work
Importance of projects to business unit and organization How important employees believe it is to their business unit and their organization that they successfully complete their work
Importance of projects and assignments to employees’ long-term careers
How important employees believe it is to their long-term careers that they successfully complete their work
Importance of projects and assignments to employees’ personal development
How important employees believe it is to their personal development that they successfully complete their work
Number of projects and assignments The number of projects or assignments employees report working on at any one time
Time to complete projects and assignments The amount of time employees need to complete each project or assignment that they are asked to work on
Day-to-Day Work

38a
Performance Impact of Work Characteristics
Presented below are the 15 day-to-day work factors grouped into four categories: personal connection, organizational connection, incentives, and work characteristics. The categories are listed from left to right in order of impact on performance.
Personal Connection Drives Performance: Personal connection—including employees’ understanding of how to complete their projects, personal enjoyment of their work, and infl uence in selecting projects—represents the day-to-day work category with the single greatest impact on performance. In other words, employees perform better if they understand how to do their work, feel that it is connected to their personal development, and enjoy it.
Connection to “Something Larger” Also Important: Employees who feel connected to the organization and feel that they can advance within it outperform those who do not. Organizational connection—including connections between employees’ work and organizational strategy and the importance of employees’ projects to the business unit and organization—is the category with the second largest impact on individual performance.
Incentives and Basic Nature of Work Have Less Impact: Incentives and the basic characteristics of employees’ work, such as number of projects, have signifi cantly less impact. While the prospect of fi nancial rewards for performance does positively impact performance, the effect of any one of these activities in isolation is relatively small. Raises, bonuses, and promotions contribute to overall performance improvements, but on their own, are not the activities that lead to a signifi cant positive change in performance. It is certainly possible to pay employees to perform better, but the impact is limited and much smaller than ensuring that they understand, enjoy, and believe in what they are doing.
No Day-to-Day Work Factor Qualifi es as an A-Level Driver: It is clear that none of the day-to-day work factors fall among the A-level performance strategies, and only four can be included on the list of B-level items. Furthermore, those four B-level items are all found within the personal connection category: employee understanding of how to complete projects and assignments, employees’ enjoyment of their work, employee infl uence in selecting their projects, and the degree to which their work is challenging.
An important lesson emerges in comparing the fi ndings presented on this page. Specifi cally, fi nancial rewards do drive key attitudes, and ultimately affect performance, but they simply cannot substitute for a personal connection and appreciation of one’s work and a belief that it makes a difference to the organization. Therefore, while offering the “right” fi nancial incentives may be critical to attracting and retaining employees, its power to make an employee better at his or her job is limited.
The following page explains in further detail the importance of ensuring that employees feel personally connected to their day-to-day work. Specifi cally, it examines the impact of employee understanding of how to complete their projects and assignments and enjoyment of their work on performance and several high-performance attitudes.

38b
Emplo
yee U
nder
stand
ing o
f How
to
Comple
te Pr
ojects
and A
ssign
ments
Emplo
yees
’ Enjo
ymen
t of T
heir W
ork
Emplo
yee I
nflue
nce i
n Sele
cting
Proje
cts
Challe
nge o
f Pro
jects
and A
ssign
ments
Impo
rtanc
e of P
rojec
ts an
d Assi
gnmen
ts
to Em
ploye
es’ P
erso
nal D
evelo
pmen
t
Impo
rtanc
e of P
rojec
ts an
d Assi
gnmen
ts
to Em
ploye
es’ L
ong-T
erm C
areer
Emplo
yee U
nder
stand
ing o
f Con
necti
ons
Impo
rtanc
e of P
rojec
t to
Busin
ess
Unit an
d Orga
nizati
on
Perce
ived R
eward
: Rais
e in B
ase Sa
lary
Perce
ived R
eward
: Opp
ortun
ity fo
r Pro
motion
Perce
ived R
eward
: Size
of A
nnua
l Mer
it Inc
rease
Perce
ived R
eward
: Opp
ortun
ity fo
r High
er Pe
rform
ance
Rati
ng
Rece
ived R
eward
: Size
of A
nnua
l Bon
us
Time t
o Com
plete
Proje
cts an
d Assi
gnmen
ts
Numbe
r of P
rojec
ts an
d Assi
gnmen
ts0.0
10.0
20.0
13.2 13.1 12.511.1
9.08.0 8.3
6.4
4.2 4.1 3.8 3.62.0
0.0 0.0
Betw
een W
ork a
nd St
rateg
y
Incentives Drive Performance, but Connection Matters MoreMaximum Impact of Work Characteristics on Employee Performance*
Change in Performance
High
Low
IncentivesMean = 3.5
Personal ConnectionMean = 11.2
Organizational ConnectionMean = 7.4
Work CharacteristicsMean = 0.0
Level of Performance Driver
A-Level ≥25.0B-Level 10.0 to 24.9C-Level 0.0 to 9.9D-Level <0.0
* Each bar presents a statistical estimate of the maximum total impact on employee performance each strategy will produce. The total impact includes the strategy’s direct impact on performance as well as any indirect impact it may have through employee attitudes. The maximum total impact is calculated by comparing two statistical estimates: the predicted performance level for an employee who scores “high” on the strategy and the predicted performance level for an employee who scores “low” on the strategy. The impact of each strategy is modeled separately. A strategy that fails to achieve traditional levels of statistical signifi cance is denoted with a white bar (t < 2.0).
Source: Corporate Leadership Council 2002 Performance Management Survey.
Performance Drivers: Day-to-Day Work

39a
Indirect and Direct Impact
The page below compares two important items within the day-to-day work category: understanding how to complete projects and assignments and enjoyment of work.
Understanding How to Complete Projects and Assignments: As illustrated below, employees who understand how to complete their projects and assignments put more effort into their job, are more committed to the organization, and feel more closely matched to their jobs than do their peers who do not have the same level of understanding. In addition to its impact on these high-performance attitudes, increasing employees’ understanding of how to complete their projects has a direct effect on performance, leading to a sizeable performance improvement of up to 13 percent.
Employees’ Enjoyment of Their Work: Similarly, employees’ enjoyment of their work has tremendous positive impact on discretionary effort, commitment, and in particular match with job. Specifi cally, by more closely matching employees with the types of projects and assignments on which they personally enjoy working, organizations can observe a 37 percent increase in employees’ discretionary effort and a 57 percent increase in their commitment to the organization. Moreover, the more employees enjoy what they are doing day-to-day, the more they believe they are in the right job for them. In the end, however, enjoying one’s work does not have a direct impact on performance, because it does not give employees the necessary resources, information, or experiences to do their jobs better. Nevertheless, because of the signifi cant attitudinal improvements, the total impact on performance makes this one of the B-level strategies.
Not only does employees’ day-to-day work positively impact performance, but it also serves as a powerful recruiting and retention tool. Organizations that carefully consider employees’ strengths, skills, and personal interests during staffi ng and project assignment decisions will benefi t from increased effort levels and organizational commitment. The importance of employees’ day-to-day work to attitudes of high performance is further emphasized by contrasting it to the impact from fi nancial rewards, as presented on the following page.

39b
Source: Corporate Leadership Council 2002 Performance Management Survey.
A Closer Look at Day-to-Day Work
Understanding and EnjoymentUnderstanding and Enjoyment Drive Performance and Attitudes
Understand How to Complete Projectsand Assignments: Impact on Performance*
Understand How to Complete Projects and Assignments
IncreasesIndividual Performance
by 13.2%
Discretionary Effort (29.3%)
Commitment (35.6%)
Match with Job (34.4%)
Direct Impact (4.9%)
Indirect:
+ Direct:
= Total:
* The total impact of a strategy on employee performance is a weighted sum of the strategy’s direct and indirect effects. Each direct and indirect effect is weighted differently, which is why the direct and indirect effects do not sum to the total impact. Percentages next to employee attitudes denote the maximum percentage change produced by each strategy, expressed as a percentage of the total possible change.
Employees’ Enjoyment of Their Work: Impact on Performance*
Employees’ Enjoyment of Their Work
Increases Individual Performance
by 13.1%
Discretionary Effort (37.5%)
Commitment (57.4%)
Match with Job (65.8%)
Ø No Direct Impact

40a
Pay for Retention, Not Performance
The Council’s research on fi nancial incentives suggests that incentives are more likely to attract and retain employees than drive performance. In fact, as shown below, increases in base salary, merit increase, and annual bonus heighten employees’ intention to stay with the organization by approximately 19 percent. As shown on the right-hand side of the page, employee perceptions that their bonus will be closely tied to their performance level also increase the key attitudes of discretionary effort, organizational commitment, and match with job.
However, employee perceptions of a link between their performance and the size of their bonus does not have a direct impact on employee performance. As a result, despite the positive impact that a clear link between performance ratings and size of bonus can have on a number of key attitudes, the lack of a direct impact on performance results in an overall increase in employee performance levels of just 2 percent. Although there are obvious reasons to offer fi nancial rewards to employees, as illustrated by the positive impact they have on attraction and retention, fi nancial rewards only affect performance indirectly and do not improve employees’ abilities to do their day-to-day jobs.

40b
A Closer Look at Day-to-Day Work
Driving Retention Versus PerformanceFinancial Incentives Drive Retention, but Have Less Impact on Performance
Importance Score ofJob Offer Attribute Categories
Perceived Reward—Size of Bonus: Impact on Performance*
Perceived Reward—Size of Bonus
Increases Individual Performance
by 2.0%
Discretionary Effort (4.9%)
Commitment (18.1%)
Match with Job (7.5%)
Ø No Direct Impact
Indirect:
+ Direct:
= Total:
* The total impact of a strategy on employee performance is a weighted sum of the strategy’s direct and indirect effects. Each direct and indirect effect is weighted differently, which is why the direct and indirect effects do not sum to the total impact. Percentages next to employee attitudes denote the maximum percentage change produced by each strategy, expressed as a percentage of the total possible change.
Impact of FinancialIncentives on Retention
Compe
nsati
on an
d Ben
efits
Develo
pmen
t and
Wor
k Env
ironm
ent
Wor
k–Lif
e Bala
nce
Compa
ny En
viron
ment
0.00
3.50
7.00
4.303.85 3.57 3.46
Impo
rtan
ce
Scor
e
Incentive
Impact on Intent to Stay
Increase in Base Salary 19.1%
Merit Increase 18.9%
Annual Bonus 19.1%
Source: CLC Solutions Employee Preferences Database; Corporate Leadership Council research.
$

41a
Job Opportunities
The fi nal lesson of this chapter discusses the value of on-the-job development and training. High-profi le development opportunities that match employees’ interests and skills have the most sizeable impact on performance.

41b
Seven Keys to High Performance
1. The Performance Management System: The Singular Power of Clarity
2. Performance Culture: The Freedom to Take Risks, Communicate, and Be Flexible
3. Manager–Employee Interaction: Solutions Enabler
4. Formal Performance Review: The Delicate Balance Between Praise and Critique
5. Informal Performance Feedback: The Primacy of Fairness and Accuracy
6. Day-to-Day Work: Connection Over Rewards
7. Job Opportunities: High Profi le, Good Fit, and New Skills
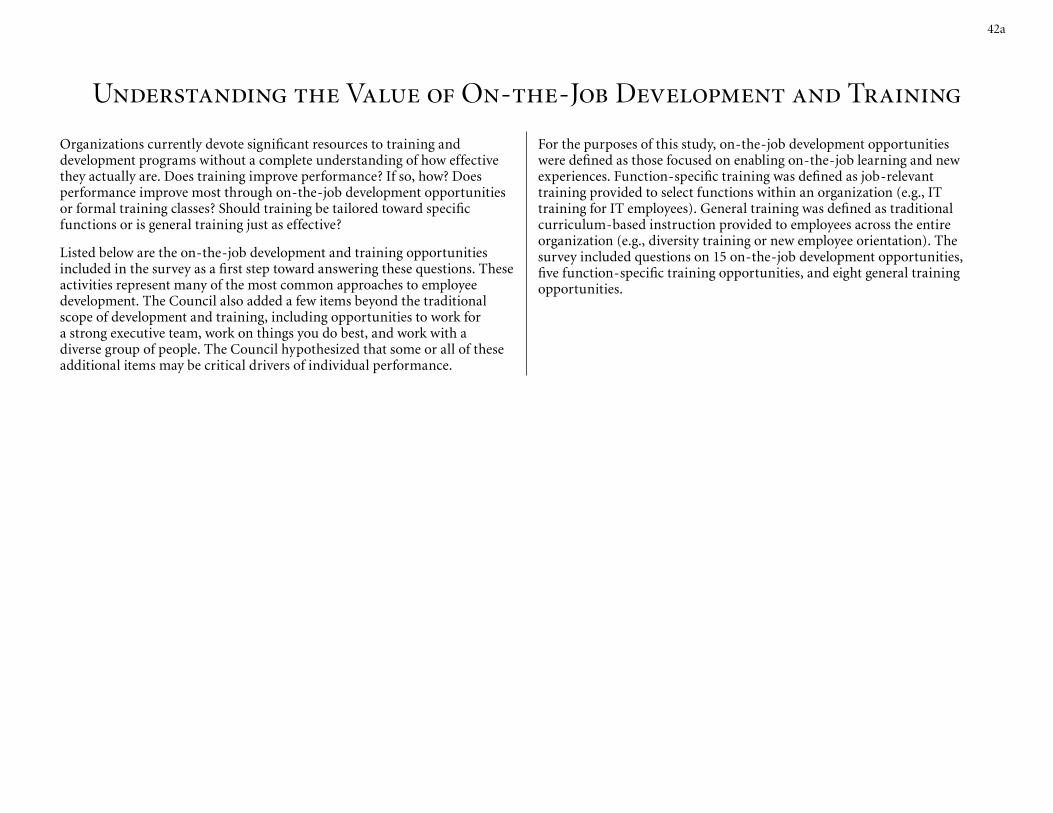
42a
Understanding the Value of On-the-Job Development and Training
Organizations currently devote signifi cant resources to training and development programs without a complete understanding of how effective they actually are. Does training improve performance? If so, how? Does performance improve most through on-the-job development opportunities or formal training classes? Should training be tailored toward specifi c functions or is general training just as effective?
Listed below are the on-the-job development and training opportunities included in the survey as a fi rst step toward answering these questions. These activities represent many of the most common approaches to employee development. The Council also added a few items beyond the traditional scope of development and training, including opportunities to work for a strong executive team, work on things you do best, and work with a diverse group of people. The Council hypothesized that some or all of these additional items may be critical drivers of individual performance.
For the purposes of this study, on-the-job development opportunities were defi ned as those focused on enabling on-the-job learning and new experiences. Function-specifi c training was defi ned as job-relevant training provided to select functions within an organization (e.g., IT training for IT employees). General training was defi ned as traditional curriculum-based instruction provided to employees across the entire organization (e.g., diversity training or new employee orientation). The survey included questions on 15 on-the-job development opportunities, fi ve function-specifi c training opportunities, and eight general training opportunities.

42b
Potential Performance Drivers
Source: Corporate Leadership Council 2002 Performance Management Survey.
Job Opportunity Defi nition
Opportunity to spend time with a professional coach • Whether employees have a professional, paid consultant from outside their fi rm who speaks with them about their job and career • Amount of time those with a professional coach spend with this person each month discussing their job and career
Opportunity to do challenging and leading-edge work • Amount of opportunity employees say they have to do challenging and leading-edge work
Opportunity to experiment and take risks • Amount of opportunity employees say they have to experiment and take risks
Opportunity to have signifi cant accountability and responsibility • Amount of opportunity employees say they have to have signifi cant accountability and responsibility
Opportunity to help launch a new business, initiative, or program
• Amount of opportunity employees say they have to help launch a new business, initiative, or program
Opportunity to help turn around struggling business or project • Amount of opportunity employees say they have to help turn around a struggling business or project
Opportunity to work with a mentor • Whether employees say they have someone in their organization to whom they go for advice about their job and career • Amount of time they spend with this person each month discussing their job and career
Opportunity to be promoted • Amount of opportunity employees say they have to be promoted with the organization
Opportunity to work for strong senior executive team • Amount of opportunity employees say they have to work for a strong executive team
Opportunity to work in a different country • Amount of opportunity employees say they have to work in countries they haven’t worked in before
Opportunity to work in a variety of jobs/roles • Amount of opportunity employees say they have to work in a variety of jobs and roles
Opportunity to work in new business units • Amount of opportunity employees say they have to work in new business units or divisions
Opportunity to work in new functional areas • Amount of opportunity employees say they have to work in new functional areas (such as marketing or fi nance)
Opportunity to work on the things you do best • Amount of opportunity employees say they have to work on the things they do best
Opportunity to work with a diverse group of people • Amount of opportunity employees say they have to work with a diverse group of people
Training effectiveness • Whether employees believe their training to be effective (i.e., improved skills and abilities, advanced career, held accountable)
Business training • Whether employees in business functions have received business training since joining the organization
Diversity training • Whether employees have received diversity training since joining the organization
IT training • Whether employees in IT functions have received IT training
Leadership training • Whether employees have received leadership training
New employee orientation • Whether employees have received new employee orientation
People management training • Whether employees have received people management training
Process management training • Whether employees have received process management training
New product training • Whether employees have received new product training
Quality control training • Whether employees have received quality control training
Sales training • Whether employees in sales functions have received sales training
Technical training • Whether employees have received technical training
Job Opportunities

43a
Job Opportunities: High Profi le, Good Fit
Exhibited below are the 27 job opportunities and training activities examined in the research. The items are grouped into three broad categories: on-the-job development opportunities, function-specifi c training, and general training. Within each category, the items are listed in decreasing order of impact from left to right.
“What I Do Best” with a Strong Team: The fi ve on-the-job development opportunities with the greatest impact on individual performance are opportunities to:
• work on things you do best
• work for a strong senior executive team
• help launch a new business, initiative, or program
• turn around a struggling business or project
• have signifi cant responsibility and accountability
Although the fi rst two (work on things you do best and work for a strong executive team) are not necessarily thought of as part of the traditional performance management system, they both belong within the list of A-level items and can positively impact individual performance by more than 25 percent. Providing employees with additional opportunities to work on the things they do best and to work with a strong executive team contributes more than any other on-the-job development or training opportunities to an organization’s goal of improving performance.
High-Profi le Opportunities Also Important: Opportunities to launch a new business, turn around a struggling business, and have signifi cant responsibility and accountability all improve individual performance and are within the Council’s list of B-level strategies. In fact, this is one of just two areas in the study where the Council identifi ed such a large number of strategies that can lead to a performance improvement of over 20 percent. The sizeable number of on-the-job development opportunities falling within the A-level and B-level items strongly indicates that on-the-job development makes an important difference in the performance of the workforce and should be considered a critical part of any performance management strategy.
In devising a development program designed to improve individual performance, organizations should focus their investments on those opportunities that contain high-profi le work matched to employees’ strengths and providing opportunities to develop new skills.
Training Has Less Impact: At the category level, training has less of an overall impact on performance than do on-the-job opportunities. That said, some signifi cant lessons become clear through a closer look at each of the two training categories:
Function-Specifi c Training Can Sometimes Drive Performance: In the category labeled function-specifi c training, the Council assesses the impact that function-specifi c training has on employee performance. As shown below, IT training may increase the performance of IT employees by up to 13 percent. In addition, accounting and fi nance employees who receive training in accounting and fi nance outperform their peers who do not receive it by almost 8 percent. However, other function-specifi c training programs (customer service, quality control, and sales training) show little impact on individual performance and generally fall short of statistical signifi cance, meaning that employees receiving such training do not signifi cantly outperform their peers who are not trained. This suggests that there are other factors, besides training, that explain the relative performance of the sales or customer services staff.
General Training Only When Effective: Overall, training that is more general and less focused on a specifi c functional area does little to improve individual performance. Moreover, as shown on right side of the graphic, the effectiveness of the course might well be more important than the content. In fact, employees who report that training was “effective” (i.e., improved their skills and abilities, helped them perform better in their job, and helped advance their career) outperform their peers by as much as 10 percent. These fi ndings suggest that problems with training are associated with ineffective execution, rather than content of the training course.
The following two pages take a closer look at the relative impact of several on-the-job development opportunities and training. Specifi cally, the Council analyzes in further detail the impact that three important on-the-job development opportunities (working with a diverse group of people, working on what you do best, and experimenting and taking risks), general training, and function-specifi c training have on several high-performance attitudes.

43b
High-Profi le and Good-Fit Opportunities Work BestMaximum Impact of Development and Training on Employee Performance*
Wor
k on t
he Th
ings Y
ou D
o Be
st
Wor
k for
a Str
ong S
enior
Exec
utive
Team
Help La
unch
a New
Bus
iness,
Initia
tive,
or Pr
ogram
Help Tu
rn A
roun
d a St
rugg
ling B
usine
ss or
Proje
ct
Have S
ignific
ant R
espo
nsibi
lity an
d Acc
ounta
bility
Do Cha
lleng
ing an
d Lea
ding-E
dge W
ork
Expe
rimen
t and
Take
Risk
s
Wor
k with
a Dive
rse G
roup
of P
eople
Wor
k with
a Men
tor
Wor
k in N
ew D
ivision
s or B
usine
ss Unit
s
Be Pr
omot
ed W
ithin
the O
rganiz
ation
Wor
k in a
Varie
ty of
Jobs a
nd R
oles
Wor
k in N
ew Fu
nctio
nal A
reas
Wor
k in D
iffere
nt Cou
ntries
Spen
d Tim
e with
a Pr
ofessi
onal
Coach
IT Tr
aining
Busin
ess T
rainin
g
Custo
mer Se
rvice
Train
ing
Qua
lity C
ontro
l Train
ing
Sales
Train
ing
Effec
tiven
ess o
f Trai
ning
Peop
le Man
agem
ent T
rainin
g
Diversi
ty Tr
aining
Lead
ersh
ip Tr
aining
New Em
ploye
e Orie
ntatio
n
New Pr
oduc
t Trai
ning
Proc
ess M
anag
emen
t Trai
ning
Tech
nical T
rainin
g0.0
15.0
30.0 28.8
25.723.8
20.9
18.416.7
15.4
6.3 5.6 5.3 5.0 4.9 4.11.7
<1.0
13.2
7.5
<1.0 <1.0 <1.0
9.5
2.0<1.0 <1.0 <1.0 <1.0 <1.0 <1.0
On-the-Job Development OpportunitiesGeneral Training
Change in Performance
Level of Performance Driver
A-Level ≥25.0B-Level 10.0 to 24.9C-Level 0.0 to 9.9D-Level <0.0
* Each bar presents a statistical estimate of the maximum total impact on employee performance each strategy will produce. The total impact includes the strategy’s direct impact on performance as well as any indirect impact it may have through employee attitudes. The maximum total impact is calculated by comparing two statistical estimates: the predicted performance level for an employee who scores “high” on the strategy and the predicted performance level for an employee who scores “low” on the strategy. The impact of each strategy is modeled separately. A strategy that fails to achieve traditional levels of statistical signifi cance is denoted with a white bar (t < 2.0). Impact of training courses controls for time spent in training and training effectiveness. Impact of training effectiveness controls for specifi c course and time spent in training. Function-specifi c training is defi ned as training for functional employees in their functional area (e.g., IT training for IT employees).
Source: Corporate Leadership Council 2002 Performance Management Survey.
Performance Drivers: Job Opportunities
Function-Specifi c Training

44a
Indirect and Direct Impact of Development Opportunities
The page below explains the impact of three development opportunities: the opportunity for employees to work with a diverse group of people, work on what they do best, and experiment and take risks.
Work with a Diverse Group of People: Organizations currently devote signifi cant time and resources to the important issue of diversity, despite the diffi culty of quantifying the benefi ts of a diverse organizational culture. The Council’s research serves as an initial step toward the goal of understanding the value of diversity. As shown below, the benefi ts of working with a diverse group of people are clearly demonstrated by examining the impact that diversity has on a number of high-performance attitudes. Employees who feel that their companies give them an opportunity to work with a diverse group of people put 24 percent more effort into their job, are 34 percent more committed to the organization, and are 32 percent more likely to feel that the job they have is right for them. Providing employees with opportunities to work with a diverse group of people also has a small positive direct effect on performance, leading to an overall boost in performance of up to 6 percent.
Matching Employees with What They Do Best: The graphic in the center of the page provides further details on the single biggest performance driver in this category: providing employees with opportunities to do what they do best. As shown below, creating opportunities for employees to capitalize on their strengths increases discretionary effort by nearly 30 percent and drives organizational commitment by an astonishing 50 percent. Furthermore, fi nding opportunities for employees to do what they do best increases their feeling that they are in the right job by more than 65 percent. These sizeable positive effects on various high-performance attitudes, coupled with a substantial direct impact, leads to a total impact on performance of 29 percent.
Experiment and Take Risks: The fi nal item listed below—the opportunity to experiment and take risks—also drives a number of critical high-performance attitudes. As presented earlier in the organizational culture section, not only does providing opportunities for managed risk taking and experimentation increase employees’ effort level, commitment to the organization, and belief that they are well matched with their job, it also has a notable direct impact on individual performance. Experimentation and risk taking provide employees with clear opportunities to develop new skills, leading to a total performance improvement of over 15 percent.

44b
Three Levers, Different Impact
Source: Corporate Leadership Council 2002 Performance Management Survey.
A Closer Look at Job Opportunities
Work with a Diverse Group of People: Impact on Performance*
Discretionary Effort (23.8%)
Commitment (41.3%)
Match with Job (32.0%)
Direct Impact (0.0%)
Increases Individual Performance
by 6.3%
Matching Employees with What They Do Best: Impact on Performance*
Matching Employees with What They Do Best
Increases Individual Performance
by 28.8%
Discretionary Effort (29.3%)
Commitment (49.1%)
Match with Job (65.7%)
Direct Impact (25.1%)
Work with a Diverse Group of People
Indirect:
+ Direct:
= Total:
* The total impact of a strategy on employee performance is a weighted sum of the strategy’s direct and indirect effects. Each direct and indirect effect is weighted differently, which is why the direct and indirect effects do not sum to the total impact. Percentages next to employee attitudes denote the maximum percentage change produced by each strategy, expressed as a percentage of the total possible change.
Experiment and Take Risks: Impact on Performance*
Experiment and Take Risks
Increases Individual Performance
by 15.4%
Discretionary Effort (23.3%)
Commitment (47.1%)
Match with Job (41.0%)
Direct Impact (9.0%)

45a
Indirect and Direct Impact of Training
The page below illustrates in further detail why function-specifi c training improves performance more than generalized training.
Process Management Training: As shown below, there are limited positive effects from general training such as process management courses. Like many of the other training courses examined in the survey, process management training marginally improves organizational commitment and provides employees with resources that they feel are valuable. Such training has a direct effect on employee performance as well, although the effect is substantively quite small at 0.2 percent.
Function-Specifi c IT Training: By comparison, function-specifi c IT training (i.e., IT training provided to IT staff) has a much more signifi cant impact on employee performance. It drives increases in two high-performance attitudes (organizational commitment and employees’ feelings of having the necessary resources). IT training for IT staff also directly improves performance by 13 percent, indicating that it provides employees with the skills and information they need to do their job better. Overall, IT training for IT staff increases individual performance by 13.2 percent and falls onto the list of B-level performance strategies.
The two examples presented below suggest how to best allocate resources and training dollars to those courses with the potential for the greatest impact on individual performance. Effective training can have an impact, albeit small, on individual performance. Training is most effective when it is job relevant and specifi cally targeted to certain functions.

45b
The Value of Tailored Training
Source: Corporate Leadership Council 2002 Performance Management Survey.
A Closer Look at Job Opportunities
Process Management Training: Impact on Performance*
Process ManagementTraining
IncreasesIndividual Performance
by <1.0%
Commitment (3.5%)
Necessary Resources (1.0%)
Direct Impact (0.2%)
Indirect:
+ Direct:
= Total:
Function-Specifi c IT Training: Impact on Performance*
Function-Specifi cIT Training
IncreasesIndividual Performance
by 13.2%
Commitment (1.6%)
Necessary Resources (1.5%)
Direct Impact (13.0%)
* The total impact of a strategy on employee performance is a weighted sum of the strategy’s direct and indirect effects. Each direct and indirect effect is weighted differently, which is why the direct and indirect effects do not sum to the total impact. Percentages next to employee attitudes denote the maximum percentage change produced by each strategy, expressed as a percentage of the total possible change. Function-specifi c training is defi ned as training for functional employees in their functional area (e.g., IT training for IT employees).

46a
Summary of Employee-Related Factors
The last two sections demonstrated specifi c ways in which employees themselves can improve their performance—balance opportunities to work on the things they do best, gain visibility, and seek new skills. However, improving performance requires more than simply providing employees with certain experiences. Improved performance comes from ensuring that employees understand the “big picture,” feel connected to their work and their organization, and ultimately, enjoy what they are doing day-to-day.
Day-to-Day Work—Importance of Understanding and Enjoyment: While there are number of different ways to improve performance through an employees’ day-to-day work experience, none of the items in this category fall onto the Council’s A or B list. As organizations prioritize their efforts and resources, it is important to consider that although day-to-day work certainly has a positive impact on workforce performance, the impact is signifi cantly less than that achieved through a number of other manager- and organization-related activities. That said, carefully matching employees with jobs and taking time to explain to employees how their work contributes to organizational success and strategy is extremely important in driving a number of high-performance attitudes, specifi cally organizational commitment, discretionary effort, and match with job.
Job Opportunities More Important Than Training : Employees’ performance improves most through high-visibility development opportunities that allow them to work on what they do best—another reason for careful selection of employees’ projects and assignments.
Two of the 15 on-the-job development opportunities examined in this research fall onto the Council’s list of A-level items that improve performance by more than 25 percent: opportunities to work on things you do best and work for a strong executive team. The Council found training courses to be most effective when they are focused on specifi c functional or technical needs.

46b
Building the High-Performance WorkforceEmployee-Related Factors
Employee
Day-to-Day Work Job Opportunities
Source: Corporate Leadership Council 2002 Performance Management Survey.
• Provide employees with highly visible opportunities that leverage their strengths.
• Training should be functionally relevant and job specifi c. General skills training is much less effective.
• Carefully match employees with jobs: employees who understand and enjoy their work signifi cantly outperform those who do not.
• Take time to explain the big picture: employees will perform better if they understand how their work contributes to organizational strategy and success.
• The promise of promotions and fi nancial rewards drives employee performance, but their impact is smaller than the employees’ personal connection to their work.

47a

47b
Chapter IIIBuilding the High-Performance Workforce: Guidelines for Performance Improvement

48a
A, B, C, and D Drivers
Taken together, the A, B, C, and D performance drivers act as a blueprint for focusing organizational investments on the strategies that matter most to the high-performance workforce.
A-Level Performance Strategies (page 48b): The page below provides the overall list of A-level performance strategies in rank-order by their impact on individual performance. These nine items result in the largest improvements in employee performance of all 106 potential performance strategies examined in the research. Careful selection and implementation of the right strategies can lead to huge individual performance improvements of more than 25 percent.
With the exceptions of manager quality and day-to-day work, each of the seven categories of performance strategies is represented on the list of A-level strategies, meaning that high performance is about excellence across all components of the performance management process. Careful and precise strategy selection, providing fair and accurate informal feedback, creating a culture of managed risk taking and internal communication, emphasizing performance strengths, and ensuring that employees understand the standards upon which they are evaluated should go furthest to improve employee performance.
B-Level Strategies (page 49b): The inventory of the Council’s 22 B-level performance strategies, in their order of impact, is presented on page 49b. Each B-level driver can improve performance by between 10 and 25 percent, providing organizations with another set of tools that have a signifi cant and positive impact on the performance of the workforce. Like the A-level performance strategies, the B-level strategies also come from each of the seven different performance management categories examined in the research.
C-Level Strategies (page 50b): The C-level performance strategies are listed on page 50b. The largest of the four groups, the C-level strategies have a smaller impact on performance, ranging from no impact to 9.9 percent improvement in individual performance. Although the impact on performance is relatively small, these items have numerous benefi ts, including increases in many high-performance attitudes as well as benefi ts to areas such as employee retention and recruiting.
D-Level Strategies (page 51b): The seven D-level performance strategies listed on page 51b were found to decrease employee performance. Given the potential for lowering employee performance levels, the Council encourages members to safeguard against these factors. In fact, the items outlined at the bottom of the list—emphasizing performance weaknesses and frequently changing projects and assignments—can result in decreases in employee performance by between 10 and 28 percent.
Building the High-Performance Workforce reveals that the most effective performance management “strategy” involves a portfolio of carefully selected organizational-, managerial-, and individual-level drivers. It is only through systematic selection across different types of performance management activities that organizations can be confi dent that their selections are powerful drivers of individual, and ultimately, organizational performance. The Council sincerely hopes that this analysis not only helps organizations to identify the specifi c activities that most improve performance and but also provides some precision and clarity around why certain strategies are more effective than others.
On the next page, the Council presents a summary of key fi ndings from each of the seven categories of performance management activities examined in this study. The Council believes that this list provides organizations with a detailed blueprint for more effective selection of performance management strategies in order to produce the greatest impact on the overall performance of the workforce.

48b
No One Category Drives PerformanceA-Level (≥25 Percent Improvement)* Performance Drivers by Category
In Rank-Order by Impact on Performance
Source: Corporate Leadership Council 2002 Performance Management Survey.* A-level is defi ned as having 25 percent or greater positive impact on performance.
A-Level (High-Impact) Performance Drivers Attribute Category
1. Fairness and accuracy of informal feedback Informal Feedback
2. Risk taking Performance Culture
3. Emphasis (in formal review) on performance strengths Formal Review
4. Employee understanding of performance standards Performance Management System
5. Internal communication Performance Culture
6. Manager knowledgeable about performance Informal Feedback
7. Opportunity to work on the things you do best Job Opportunities
8. Feedback that helps employees do their jobs better Informal Feedback
9. Opportunity to work for a strong executive team Job Opportunities

49a

49b
Summary of Performance Drivers B-Level (10.0 to 24.9 Percent Improvement) Performance Drivers by Category
In Rank-Order by Impact on Performance
Source: Corporate Leadership Council 2002 Performance Management Survey.
B-Level Performance Drivers
10. Opportunity to help launch a new business, initiative, or program
11. Manager helps fi nd solutions to problems
12. Organizational fl exibility
13. Emphasis (in informal feedback) on personality strengths
14. Emphasis (in formal reviews) on personality strengths
15. Opportunity to help turn around struggling business
16. Manager helps attain information, resources, and technology
17. Manager breaks down projects into manageable components
18. Opportunity to have signifi cant responsibility and accountability
19. Opportunity to do challenging and leading-edge work
20. Culture of innovation
21. Manager translates long-term goals into step-by-step plans
22. Manager clearly communicates expectations
23. Opportunity to experiment and take risks
24. Manager likelihood to deliver voluntary informal feedback
25. Function-specifi c training: IT
26. Employee understanding of how to complete projects
27. Employees’ personal enjoyment of their work
28. Employee infl uence in selecting projects
29. Helps team get started on a new project
30. Challenge of projects and assignments
31. Level of specifi city in informal feedback

50a

50b
Summary of Performance Drivers C-Level (0.0 to 9.9 Percent Improvement) Performance Drivers by Category
In Rank-Order by Impact on Performance
Source: Corporate Leadership Council 2002 Performance Management Survey.
C-Level Performance Drivers
32. Overall effectiveness of training33. Future orientation34. Emphasis on specifi c outcomes of formal performance review (e.g., promotions, raises, or bonuses)35. Importance of projects and assignment to employees’ personal development36. Employee understanding of connection between day-to-day work and organizational strategy37. Presence of 360-degree reviews38. Importance of projects to employees’ long-term careers39. Coworker involvement40. Function-specifi c training: business (e.g., accounting, fi nance)41. Manager creates work plans and timetables42. Coworker cohesion43. Manager identifi es/removes unnecessary barriers at work44. Manager encourages employees to be positive and enthusiastic about work45. Manager persuades/encourages others to move in desired direction46. Immediate versus delayed informal feedback47. Emphasis (in formal reviews) on specifi c suggestions for doing the job better48. Importance of project to business unit and organization49. Manager holds people accountable50. Opportunity to work with a diverse group of people51. Employee accountability for “things that matter”52. Manager listens carefully to views and opinions53. Measures performance and results54. Inspires others55. Opportunity to work with a mentor56. Opportunity to work in new divisions or business units57. Emphasis (in formal reviews) on skills to develop in the future58. Diffuses unhealthy rivalries or competition59. Employee understanding of how system works60. Opportunity to be promoted within the organization61. Opportunity to work in a variety of jobs and roles62. Diffuse decision-making authority63. Manager expresses confi dence in employees’ ability to do job64. Link between performance management and organizational strategy65. Manager recognizes and rewards achievement
66. Emphasis (in formal review) on long-term career prospects67. Connection between successful project completion and raise in base salary68. Connection between successful project completion and opportunity for promotion69. Opportunity to work in new functional areas70. Connection between successful project completion and opportunity for stock options71. Connection between successful project completion and size of annual merit increase72. Extent to which employees receive performance ratings they deserve73. Fairness of performance standards74. Connection between successful project completion and opportunity for higher performance rating75. Emphasis (in informal feedback) on amount of effort put into job76. Presence of procedures for handling grievances with performance reviews77. Connection between successful project completion and size of annual bonus78. People management training (e.g., communication, team building)79. Performance management system credibility80. Opportunity to work in a different country81. Differential treatment of low and high performers82. Presence of employee development plan83. Emphasis (in informal feedback) on specifi c suggestions for doing the job84. Method of delivering informal feedback: face-to-face85. Challenge and applicability of development plan86. Emphasis (in informal feedback) on skills to develop in the future87. Customer service training88. Diversity training89. Leadership training90. New employee orientation91. New product training92. Process management training93. Quality control training94. Sales training95. Technical training96. Emphasis (in informal feedback) on performance strengths97. Time to complete projects and assignments98. Number of projects and assignments99. Opportunity to spend time with a professional coach

51a

51b
Summary of Performance Drivers D-Level (<0 Percent Improvement) Performance Drivers by Category
In Rank-Order by Impact on Performance
Source: Corporate Leadership Council 2002 Performance Management Survey.
D-Level Performance Drivers
100. Use of rank-ordering
101. Increasing the number of formal reviews received each year
102. Emphasis (in informal feedback) on personality weaknesses
103. Emphasis (formal reviews) on personality weaknesses
104. Emphasis (in informal feedback) on performance weaknesses
105. Emphasis (in formal reviews) on performance weaknesses
106. Manager makes frequent changes to employees’ projects

52a
Characteristics of the High-Performance Workforce
The Council designed this study as a fi rst step toward addressing the key challenges that organizations face in successfully improving workforce performance. Specifi cally, this research provides organizations with the quantitative evidence necessary to select, with confi dence, from the vast number of performance management strategies at their disposal.
Having explored seven distinct categories of performance management strategies in depth, we now conclude with an outline of the most important characteristics of the high-performance workforce.

52b
Organization
The Performance Management
System
Performance Culture
• Ensure employee understanding of performance standards.
• Create performance standards that are perceived as fair and linked to organizational success and strategy.
• Provide feedback to employees from multiple sources (e.g., 360-degree reviews).
• Understanding, connection, and fairness are more important than system design and structure.
Building the High-Performance Workforce
• Encourage, yet manage, risk taking.
• Institutionalize the free fl ow of information, innovation, openness, and fl exibility.
• Differentially treating strong and weak performers is vital, but its ultimate impact on employee performance is limited.
Source: Corporate Leadership Council 2002 Performance Management Survey.
Manager
Manager–Employee
Interaction
Informal Feedback
• Managers must help employees fi nd tangible, immediate solutions to specifi c work challenges to improve performance.
• Managers must provide needed information, resources, and technology.
• Managers can be “performance killers” by providing employees with unclear or inconsistent expectations.
Formal Review
• Managers must emphasize the positive during formal reviews.
• Discussion of performance weaknesses must be clearly focused on specifi c suggestions for improvement or development; if not, emphasizing weaknesses can dramatically decrease performance.
• Review should also include a discussion of the employee’s long-term career in the organization.
• Fair and accurate informal feedback on performance from a knowledgeable source is the single most effective performance management lever available to the organization.
• Feedback should be voluntary, detailed, immediate, and positive.
Employee
Day-to-Day Work
Job Opportunities
• Carefully match employees to jobs: employees who understand and enjoy their work signifi cantly outperform those who do not.
• Take time to explain the big picture: employees will perform better if they understand how their work contributes to organizational strategy and success.
• The promise of promotions and fi nancial rewards drives employee performance, but the impact is smaller than employees’ personal connection to their work.
• Provide employees with highly visible opportunities that leverage their strengths.
• Training should be functionally relevant and job specifi c. General skills training is much less effective.

53a
Access This Study Online athttp://www.corporateleadershipcouncil.com
• Retrieve this study and other completed “goldbooks” (strategic studies) online.
• Uncover related resources through our research archive.
• Plug into the Council’s online member network.
• Access online HR information fi lters, including industry resource centers and the Council Briefi ng.
Order additional copies of this study online at no additional charge.
Our Online Resource Archive• More than 2,000 research briefs providing succinct overviews of theory and practice on a broad range of member-generated HR issues
• More than 30 “goldbooks” capturing best practices addressing members’ most pressing HR concerns
• More than 50 case profi les detailing real examples of HR challenges and solutions
• More than 140 graphics ready to be cut-and-pasted into members’ own presentations

53b
On your fi rst visit, request a username and password:
• No limit to number of usernames for each member organization
• Individual usernames allow for site customization
• Check “Remember My Username and Password” to log directly onto the site on future visits
Frequently Asked QuestionsQ: How much does it cost to download research from the site?A: All research on our site may be downloaded free of charge by member organizations, and paper copies of our “goldbooks” (strategic studies)
may be ordered in unlimited quantities for no additional cost.
Q: How many individuals at member organizations may access the site?A: An unlimited number of usernames and passwords are available for contacts at member organizations.
Q: Must I access the Council Web site from my offi ce?A: No, you may access the Council Web site from your home computer or from any location with Internet access.
Q: Can we link the Council Web site to our HR or corporate intranet?A: Yes; this is an effective means of increasing awareness of your Council membership within your organization. Contact your relationship
manager for assistance in establishing a link.
Q: Do we need any special technology to access the Council Web site?A: The only requirements are Adobe Acrobat (4.0 or higher) and Internet Explorer (5.5 or higher) or Netscape Navigator (4.7 or higher).
http://www.corporateleadershipcouncil.com

54a

ORDER FORMThe study titled Building the High-Performance Workforce is in tend ed for broad dis sem i na tion among senior ex ec u tives and management within your or ga ni za tion. Mem bers are wel come to un lim it ed copies without charge. Online ordering is avail able at http://www.corporateleadershipcouncil.com. Al ter na tive ly, you can call the Pub li ca tions Department at 202-777-5921, e-mail your order to [email protected], or fax in the order form on this page. Additionally, members interested in reviewing any of the Council’s past strategic research are encouraged to request a listing of completed work.
Study Requested Quantity
Building the High-Performance WorkforceA Quantitative Analysis of the Effectivenessof Performance Management Strategies
CATALOG NO.: CLC1V6EMX ____________
Name & Title _______________________________________
Institution _______________________________________
Address _______________________________________
_______________________________________
_______________________________________
Telephone ___________________________________________
COPY AND FAX TO:Corporate Leadership Council202-777-5270
Corporate Leadership Council
You may order an unlimited number of copies without additional charge.
Corporate Leadership Council2000 Pennsylvania Avenue NW
Washington, DC 20006Telephone: 202-777-5000
www.corporateleadershipcouncil.com