building real-time web applications using arcgis geoevent extension
DESCRIPTION
Building Real-Time Web Applications Using ArcGIS GeoEvent Extension. Ryan Elliott Software Engineer ArcGIS GeoEvent E xtension for Server [email protected]. Mark Bramer Senior Technical Analyst Esri Professional Services [email protected]. Agenda. - PowerPoint PPT PresentationTRANSCRIPT

Building Real-Time Web Applications Using ArcGIS GeoEvent Extension
Ryan ElliottSoftware EngineerArcGIS GeoEvent Extension for [email protected]
Mark BramerSenior Technical AnalystEsri Professional [email protected]
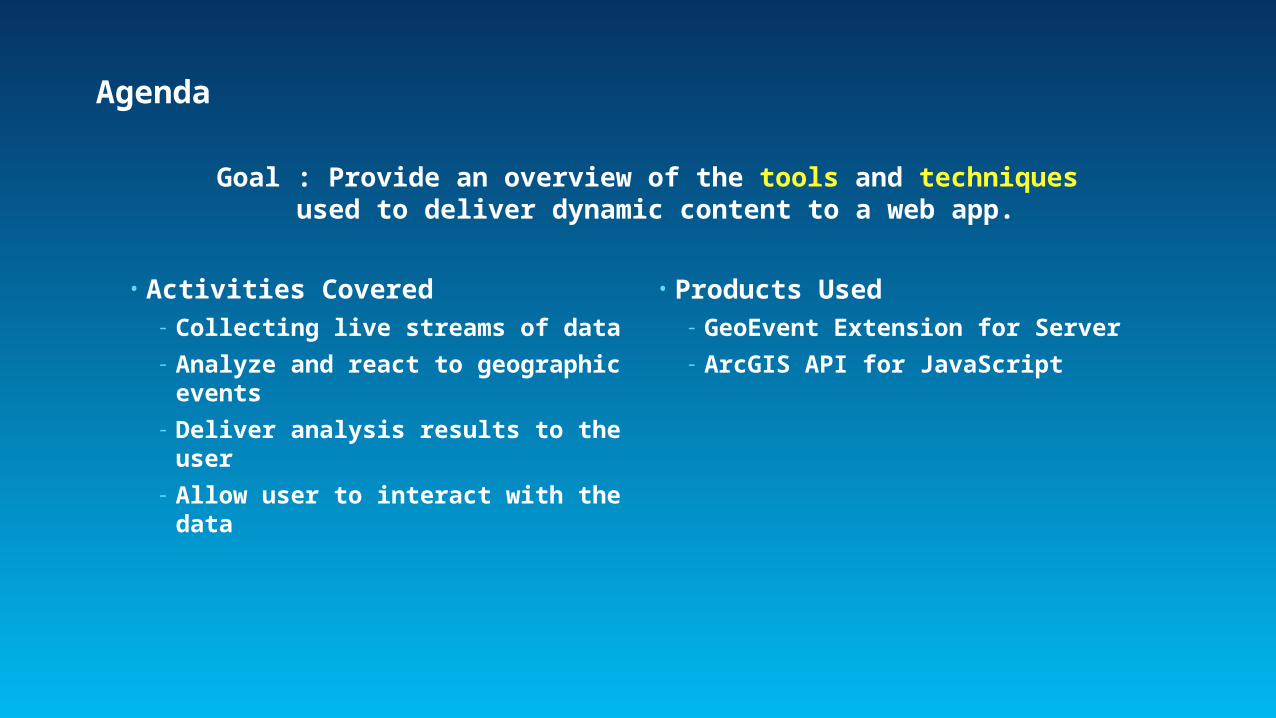
Agenda
• Activities Covered- Collecting live streams of data
- Analyze and react to geographic events
- Deliver analysis results to the user
- Allow user to interact with the data
• Products Used- GeoEvent Extension for Server
- ArcGIS API for JavaScript
Goal : Provide an overview of the tools and techniques used to deliver dynamic content to a web app.
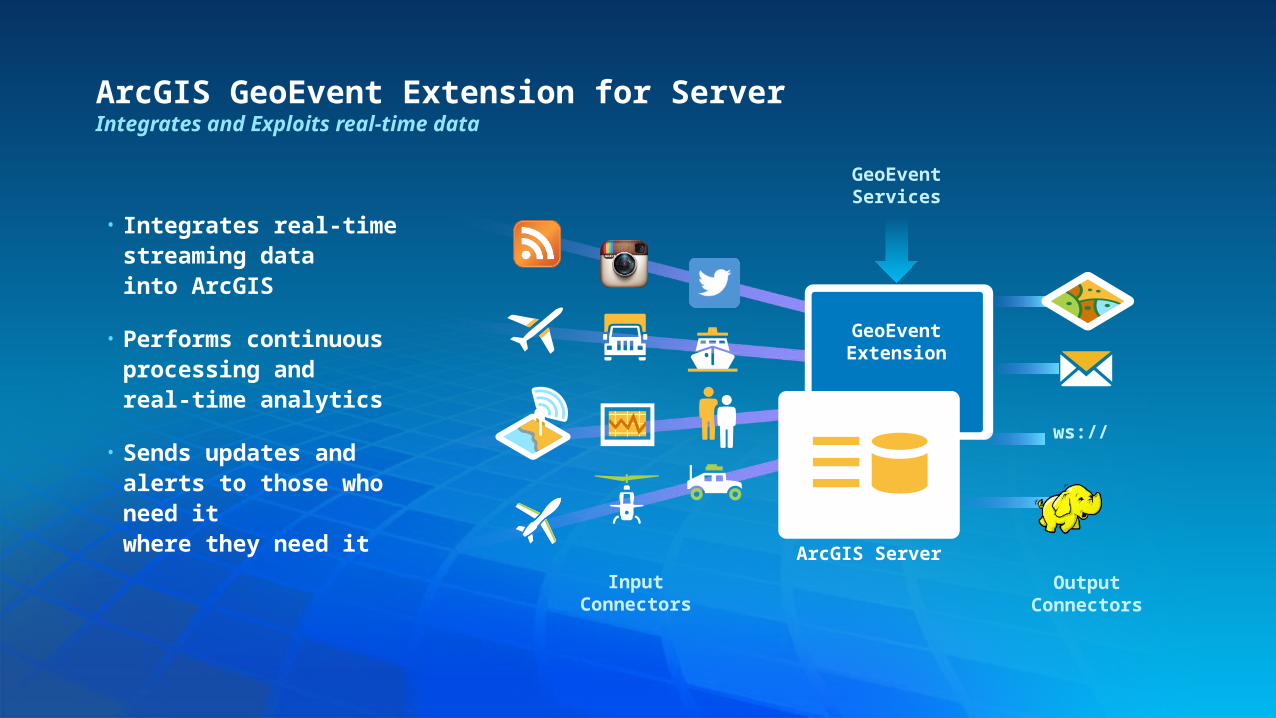
ArcGIS GeoEvent Extension for ServerIntegrates and Exploits real-time data
• Integrates real-time streaming data into ArcGIS
• Performs continuous processing and real-time analytics
• Sends updates and alerts to those who need it where they need it
GeoEvent Services
GeoEventExtension
ArcGIS Server
InputConnectors
ws://
OutputConnectors

ArcGIS Web API for JavaScript
• Gives developers tools to add GIS functionality to web applications
- Interactive maps for visualizing data.
- Widgets for finding addresses, editing data, making legends…
- Analysis – Run a model and view results, enrich existing data with detailed demographic information
- Embed into existing web page or make new focused application

DemonstrationInternational Space Station
Demo
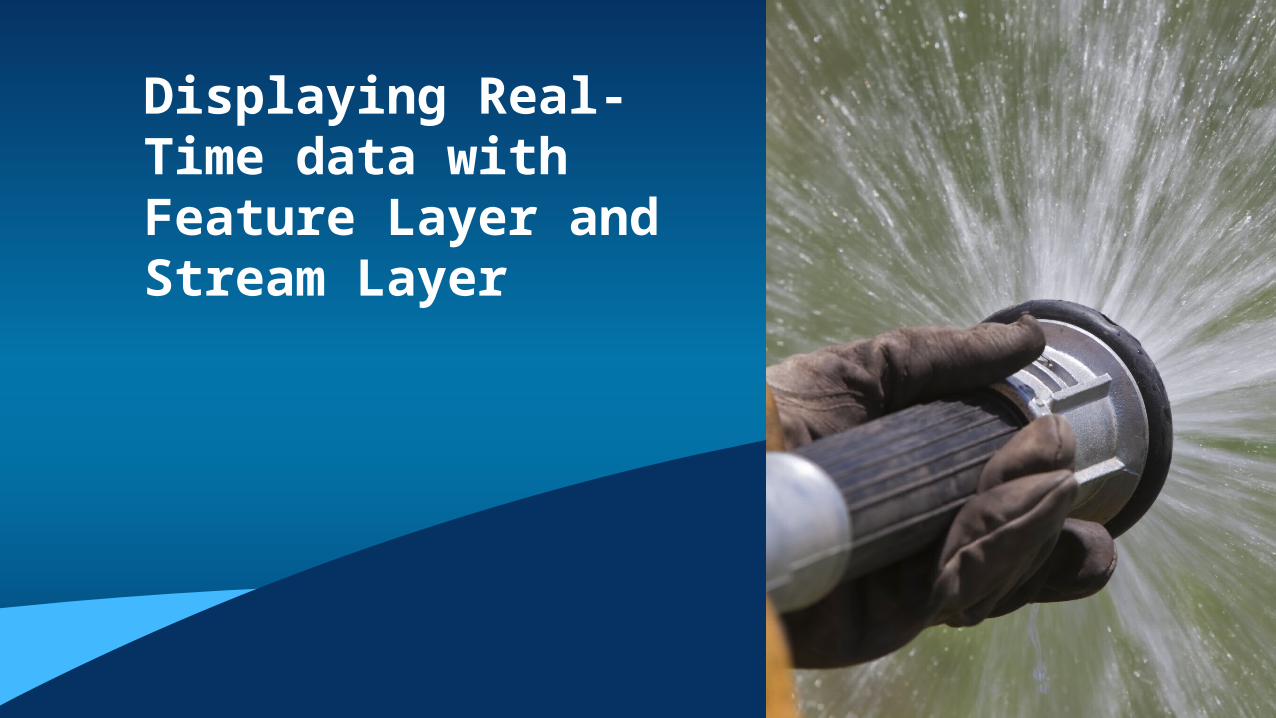
Displaying Real-Time data with Feature Layer and Stream Layer

Sending Real-time Events to ClientsPatterns – pull and push
• Pull from a Feature Services- Must be backed by an enterprise geodatabase (EGDB)
- Clients poll to get updates
• Push via Web Socket output- Low latency, high throughput
- Clients subscribe to features of interest
GeoEvent Extension
ArcGIS Server
ArcGIS Server
feature layersfeature layers
YourApplications
YourApplications
Update a FeatureAdd a Feature
Polling(Pull)
EGDB
Broadcast Featuresws://
Stream Layer
GeoEvent Services
Map ServicesFeature Services
…
Feature Layer

ArcGIS Server
Feature serviceFeature service
Stream LayerWhat is it?
• A layer in the Javascript API- Available since version 3.6
• Draws data on map using client-side graphics
Stream Layer
GETHTTP PUSHWeb
Socket
esri/layers/GraphicsLayer
esri/layers/FeatureLayer
esri/layers/StreamLayer
ArcGIS Server
GeoEvent Extension
RESPONSE Geometry• Attributes• Symbol
Graphic
Graphics Layer
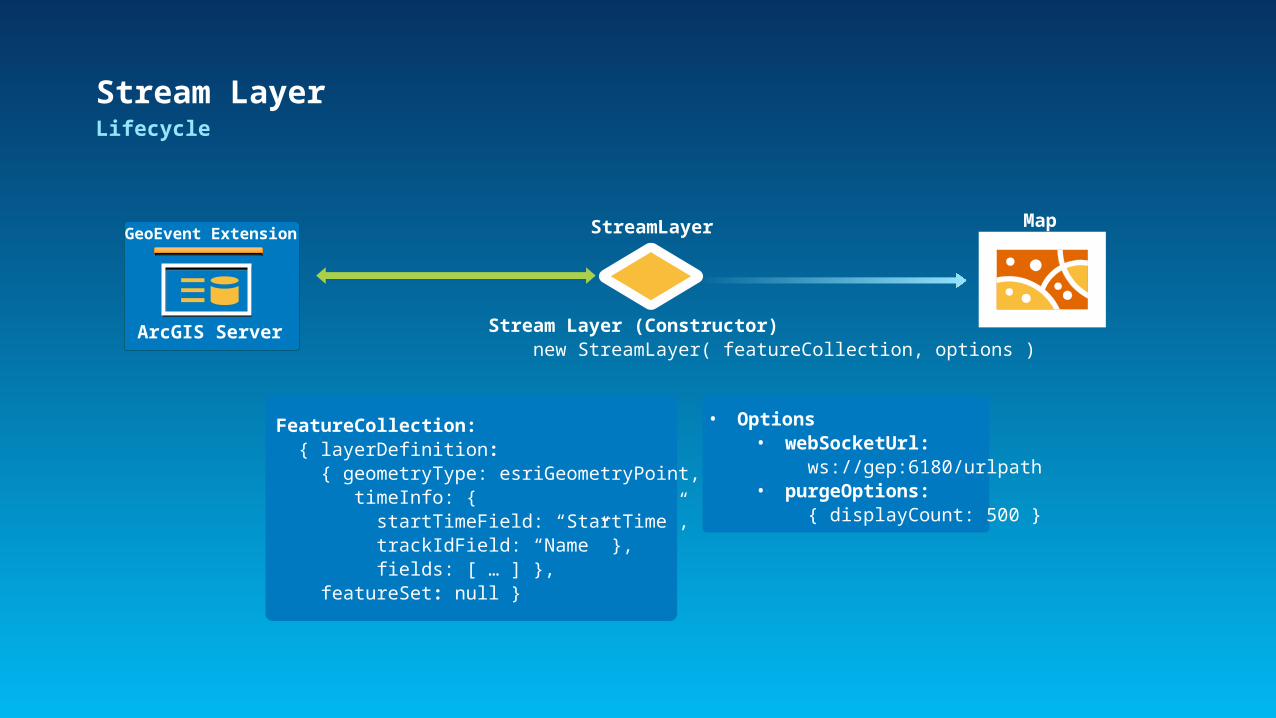
Stream LayerLifecycle
Stream Layer (Constructor) new StreamLayer( featureCollection, options )
FeatureCollection: { layerDefinition: { geometryType: esriGeometryPoint, timeInfo: { startTimeField: “StartTime”, trackIdField: “Name” }, fields: [ … ] }, featureSet: null }
• Options• webSocketUrl:
ws://gep:6180/urlpath• purgeOptions:
{ displayCount: 500 }
MapStreamLayer
ArcGIS Server
GeoEvent Extension

Stream LayerAdvantages
• More responsive- Features appear on the map right away.
• More efficient transfer of data. - Features are only sent once.
- Messages sent without extra headers
Stream Layer
RequestResponse
ArcGIS Server
Feature serviceFeature service
ArcGIS Server
GeoEvent Extension
DataEstablish
Connection

Performance
• HTTP Headers can add alot of overhead
• Polling overhead- One frame = 871 bytes
• Web Socket overhead- One frame = 2 bytes
Web Sockets versus Http Polling
(credit: www.websockets.org/quantum.html)
Use case: 100,000 Stock Quotes / Second

Stream LayerWhat is needed
• GeoEvent Extension Output Connector- Feature JSON over Web Socket
• Browser that supports Web Socketshttp://caniuse.com/websockets
• Web Socket protocol allowed on networkws://, wss://
• No Plugins Required (standard JavaScript)
10 +10 +
6 +6 +
6 +6 +
14 +14 +
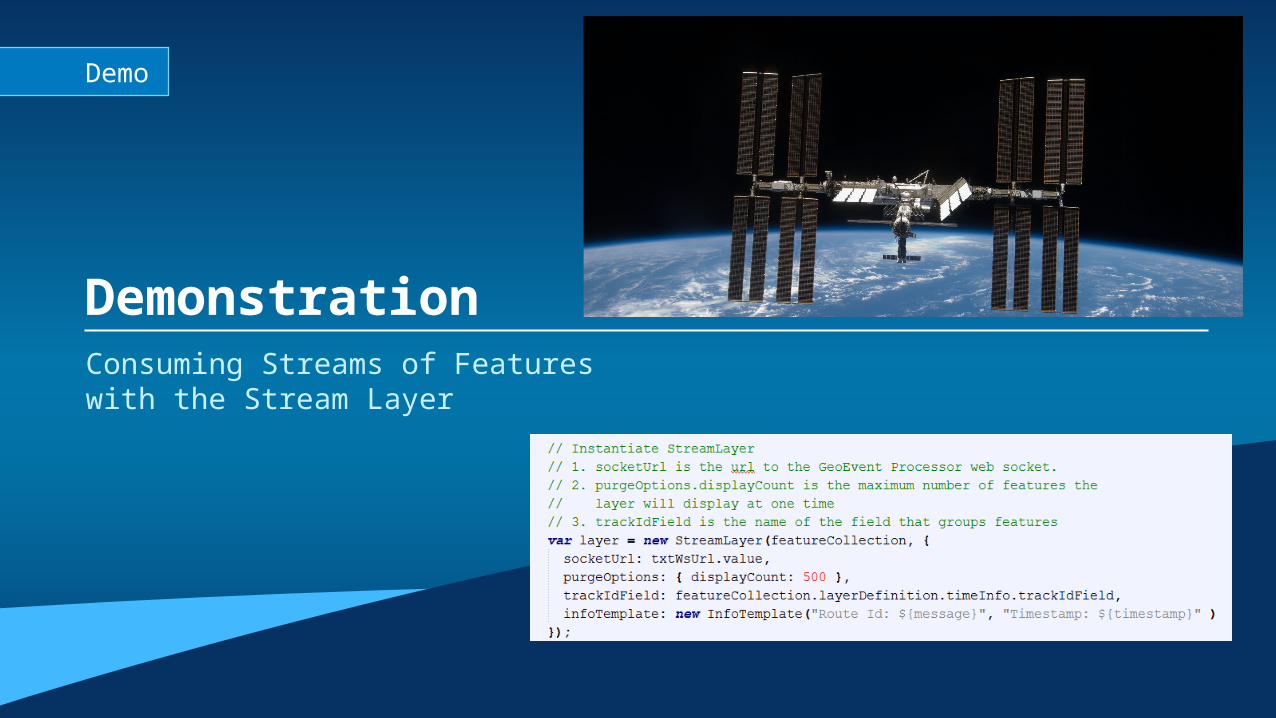
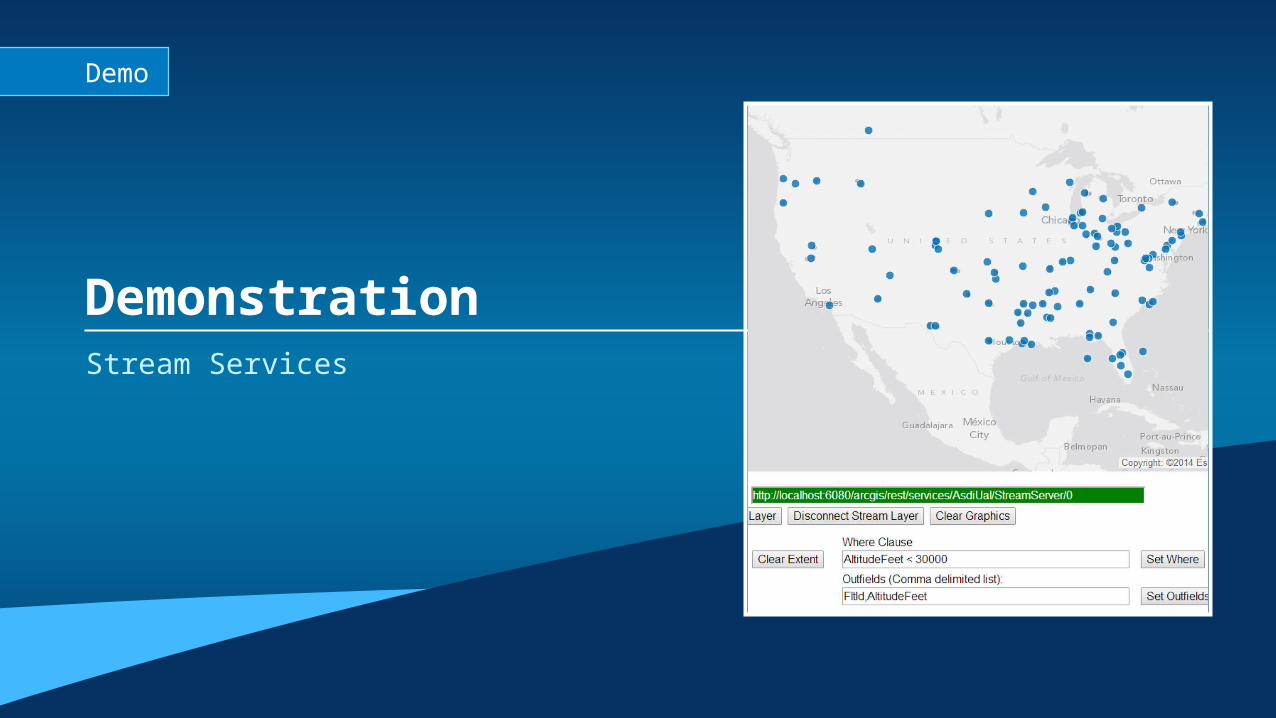
DemonstrationConsuming Streams of Features with the Stream Layer
Demo
Finding and Consuming Real-Time Data

Receiving Real-Time DataInput Connectors• Easily integrate real-time streaming data with ArcGIS by using an input connector.
You can createyour own
connectors.
You can createyour own
connectors.
GeoEvent Extension
Inp
uts
Ou
tpu
ts
GeoEvent Services
Receive RSS Receive RSS
Receive text from a TCP Socket Receive text from a TCP Socket
Receive text from a UDP Socket Receive text from a UDP Socket
Receive JSON on a REST endpoint Receive JSON on a REST endpoint
Receive Features on a REST endpoint Receive Features on a REST endpoint
Receive JSON on a Web Socket Receive JSON on a Web Socket
Receive JSON on external Web Socket Receive JSON on external Web Socketws://
http://
http://
ws://
Poll an ArcGIS Server for Features Poll an ArcGIS Server for Features
Poll an external website for JSON Poll an external website for JSONhttp://
Watch a folder for new .csv files Watch a folder for new .csv files
Watch a folder for new .json files Watch a folder for new .json files
.csv
.json
Ou
t o
f th
e B
ox
Esr
i Gal
lery
Twitter Twitter
Instagram Instagram
VMF VMF
Cursor-on-Target Cursor-on-Target
CAP CAP
TAIP (Trimble) TAIP (Trimble)
NMEA NMEA
RabbitMQ RabbitMQ
RAP (Sierra Wireless) RAP (Sierra Wireless)
GeoMessage GeoMessage
ActiveMQ ActiveMQ
Par
tner
Gal
lery
GNIP GNIP
Geofeedia Geofeedia
OSIsoft OSIsoft
ASDI (FAA) ASDI (FAA)
exactEarth exactEarth
Zonar Zonar
NetworkFleet NetworkFleet
CompassCom CompassCom
Valarm Valarm
Harris Harris

DemonstrationConnecting to Real-Time Data Feeds
Demo
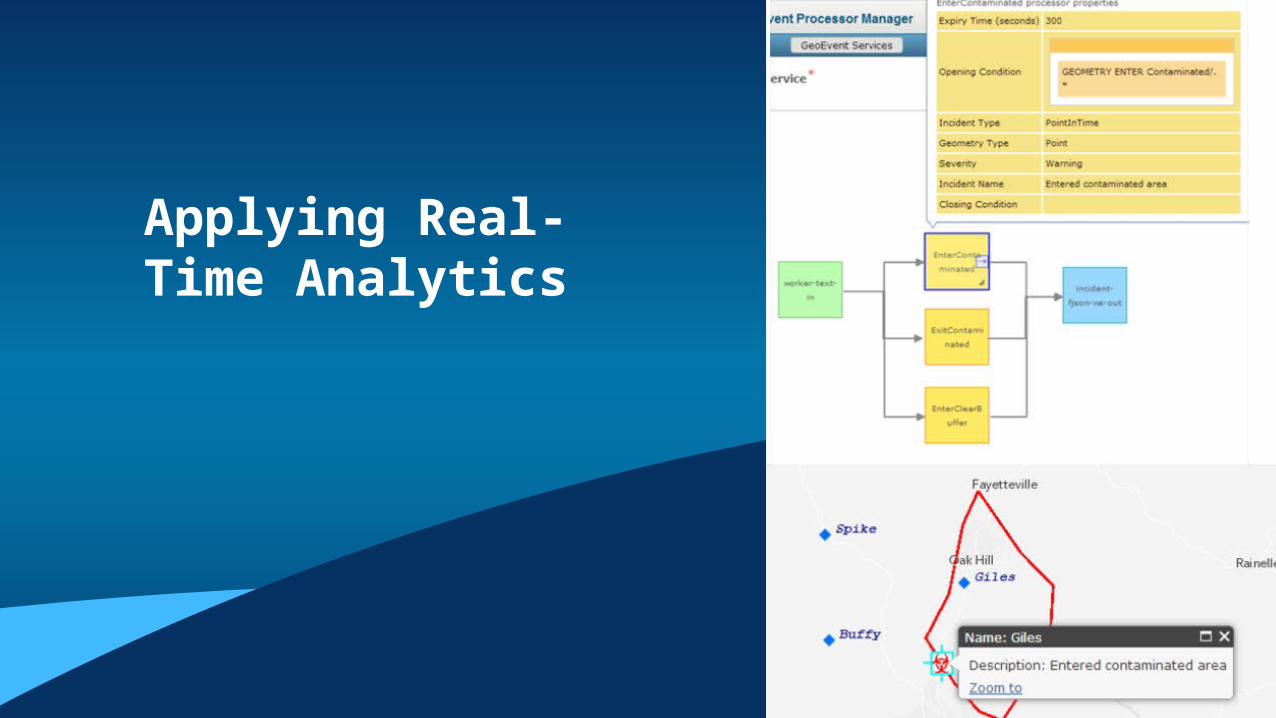
Applying Real-Time Analytics

Applying real-time analytics
• A GeoEvent Service configures the flow of GeoEvents,- the Filtering and GeoEvent Processing steps to perform,- what input(s) to apply them to,- and what outputs(s) to send the results to.
GeoEvent Services
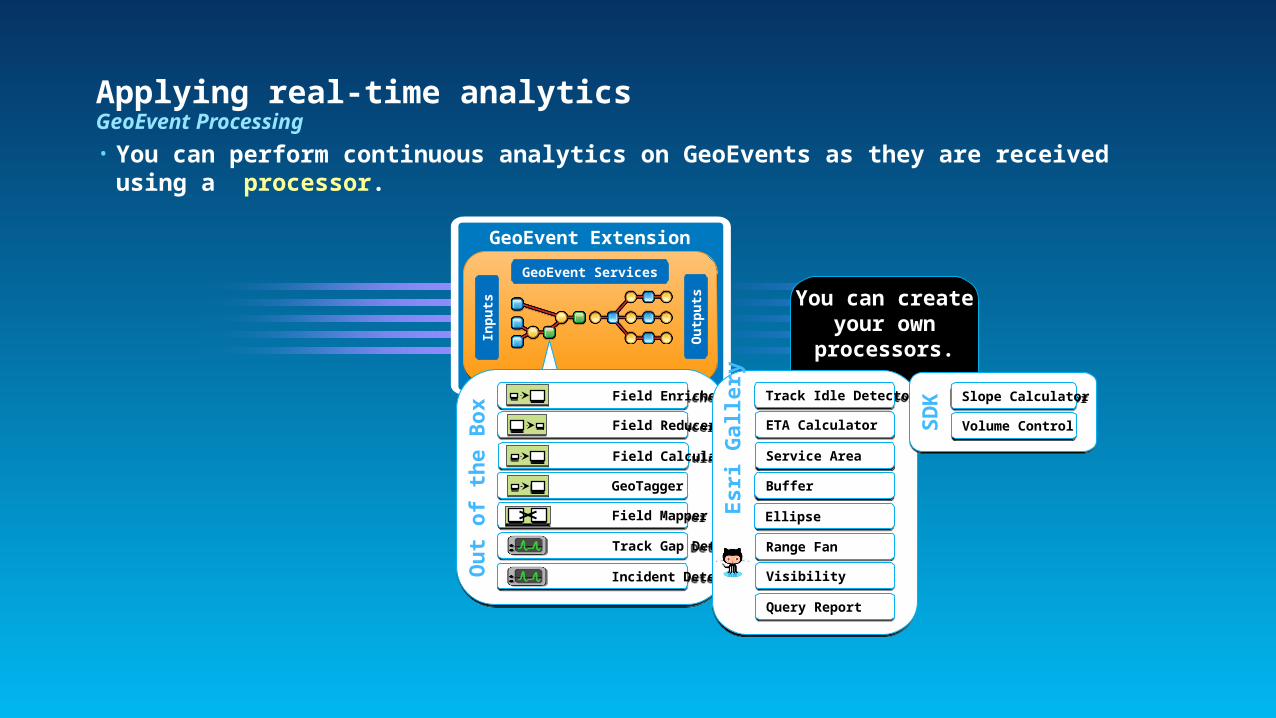
Applying real-time analyticsGeoEvent Processing
• You can perform continuous analytics on GeoEvents as they are received using a processor.
GeoEvent Extension
Inp
uts
Ou
tpu
ts
GeoEvent Services
Ou
t o
f th
e B
ox
Field Enricher Field Enricher
Field Reducer Field Reducer
Track Gap Detector Track Gap Detector
Incident Detector Incident Detector
Field Mapper Field Mapper
GeoTagger GeoTagger
Field Calculator Field Calculator
You can createyour own
processors.
You can createyour own
processors.
Track Idle DetectorTrack Idle Detector
Esr
i Gal
lery ETA CalculatorETA Calculator
Service AreaService Area
BufferBuffer
EllipseEllipse
Range FanRange Fan
VisibilityVisibility
Query ReportQuery Report
Slope CalculatorSlope Calculator
SD
K
Volume ControlVolume Control

DemonstrationDetecting GeoFence Violations
Demo
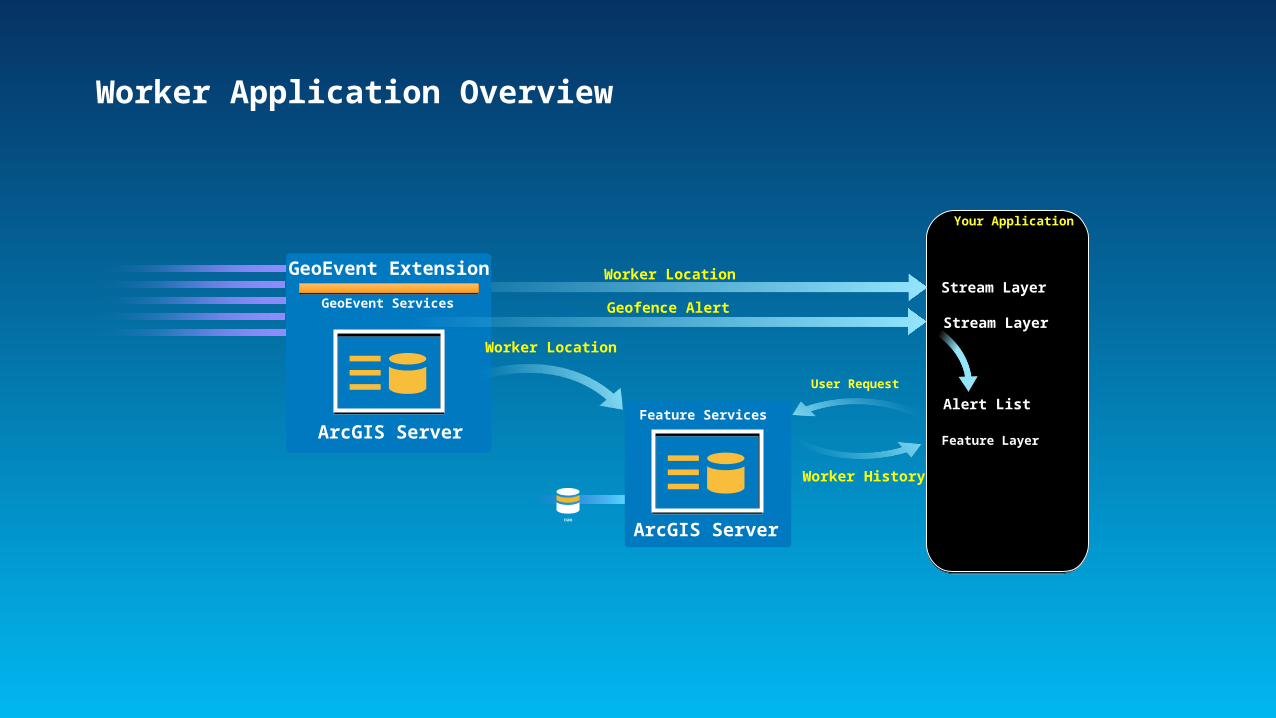
Worker LocationStream Layer
Worker Application Overview
GeoEvent Extension
ArcGIS Server
GeoEvent Services
EGDB
Feature Services
ArcGIS Server
Feature Layer
User Request
Your Application
Worker Location
Geofence Alert
Alert List
Worker History
Stream Layer

Road AheadStream Services

Real-Time GIS Apps using Stream Services
• Developer Productivity- Make streams of data easy to discover and use.
• Customizable- Individualized client connections provide filtering and projection.
• Scalable- Features published to a stream services are accessible from any machine in the
cluster.

Stream Services – The Future of Streaming Data
GeoEvent Extension
Stream LayerSubscription changes
Subscribews://
Subscription changes
Subscribews://
Stream Layer
Stream ServiceStream Service
Stream ServiceStream Service
ArcGIS Server
ArcGIS Server
GeoEvent Extension
DemonstrationStream Services
Demo

Stationary Sensor Data on a Real-Time Web App
• Stationary geographic feature with attributes that change over time.
Sensor ValuesGeoEvent Extension
ArcGIS Server
Sensor Locations
Your Application
Stream LayerStream ServiceStream Service
Feature ServiceFeature Service
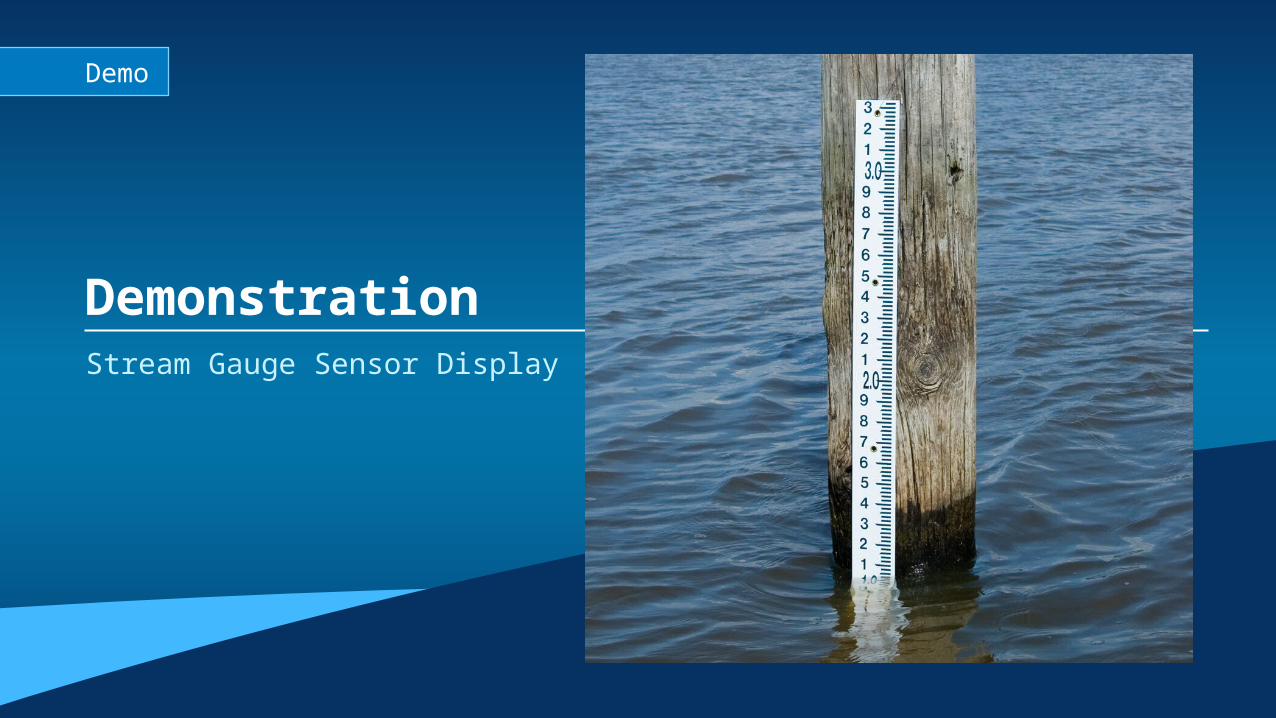
DemonstrationStream Gauge Sensor Display
Demo
What We Covered Today
• Consumed Live data from Sensors and a Web Service
• Filtered and generated incidents from spatial behavior
• Pushed events to a web app through feature services and web sockets
• Used JavaScript API Stream Layer to receive messages pushed from server and display them on a map
• Saw a preview of the Stream Service that will allow developers to easily receive data through a web socket and set filters that are processed on the server
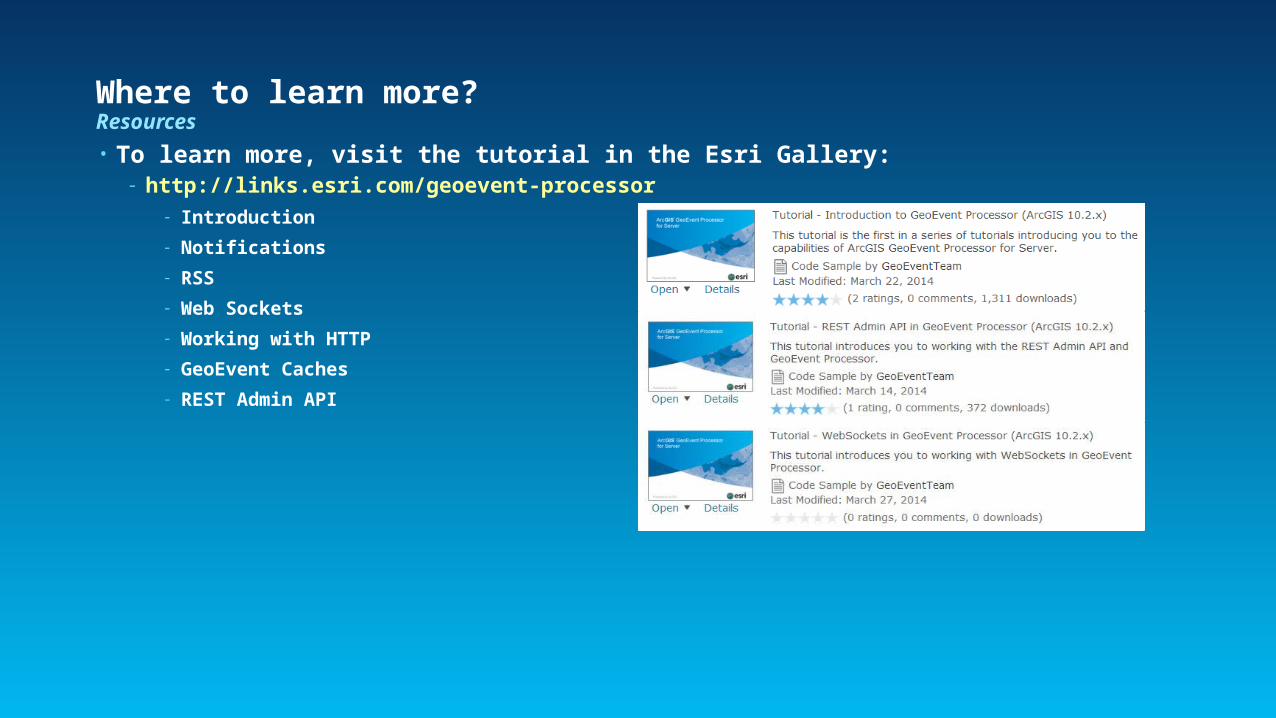
Where to learn more?Resources
• To learn more, visit the tutorial in the Esri Gallery:- http://links.esri.com/geoevent-processor
- Introduction
- Notifications
- RSS
- Web Sockets
- Working with HTTP
- GeoEvent Caches
- REST Admin API

Where to learn more?Remaining Sessions
• Applying Real-Time Analytics- Tue 1:30-2:45pm (Ballroom 6E), Wed 3:15-4:30pm (Ballroom 6A), Fri 9:00-10:15am (Room 7A/B)
• The Internet of Things (IoT)- Tue 3:15-4:30pm (Ballroom 6E)
• ArcGIS GeoEvent Extension for Server: An Introduction- Wed 8:30am-9:45am (Ballroom 6E)
• Extending with New Processors and Connectors- Wed 10:15-11:30am (Room 3)
• Using Community Connectors- Wed 12:30-1:00pm (Exhibit Hall C – Geodata Management Demo Theater)
• ArcGIS for Server and Portal for ArcGIS: The Road Ahead- Wed 1:30-2:45pm (Ballroom 6A)
• Applying Real-Time GIS to Fire, Ice, and Sustainable Mobility- Wed 3:15-4:30pm (Room 23C, Moderated Paper Session)
• Real-Time GIS SIG- Wed 5:30-7:00pm (Room 10)
• Applying Real-Time GIS to Asset Protection- Thu 3:15-4:30pm (Room 24A, Moderated Paper Session)

Additional resources
• ArcGIS API for JavaScript Resource Centerhttps://developers.arcgis.com/javascript
• Stream Layer Code Sampleshttps://developers.arcgis.com/javascript/jssamples/layers_streamlayer.html

ArcGIS API for JavaScriptAdditional Workshops
• ArcGIS API for JavaScript: An Introduction
Wed 8:30am – 9:45am Ballroom 6 C
• Strategies for Building Mobile Apps Using ArcGIS API for JavaScript
Tue 3:15pm – 4:30pm Ballroom 6 F, Thurs 10:15am – 11:30am Ballroom 6 D
• ArcGIS Web APIs: The Road AheadWed 10:15am – 11:30 am Ballroom 6 F
• ArcGIS API for JavaScript: What’s New
Wed 1:30pm – 2:45pm Room 16 B, Thurs 1:30pm – 2:45pm Room 14 B
• ArcGIS API for JavaScript: Mapping and Visualization
Wed 3:15 – 4:30 Room 5 A
• Optimizing Your JavaScript Web App for Performance
Thurs 10:15am – 11:30am Room 31 B

Thank you…
• Please fill out the session survey:
Offering ID: 1135
Online – www.esri.com/ucsessionsurveys
Paper – pick up and put in drop box
https://developers.arcgis.com/javascript
Questions / Feedback?
To learn more:
http://pro.arcgis.com/share/geoevent-processor
Ryan ElliottSoftware EngineerArcGIS GeoEvent Extension for [email protected]
Mark BramerSenior Technical AnalystEsri Professional [email protected]
