building on 150 years - corporate€¦ · · 2017-10-31proposed return of capital to achieve a...
TRANSCRIPT

1
1
Building on 150 yearsCSR Limited Results PresentationYear ended 31 March 2005
18 MAY 2005
CSR 1855-2005 CELEBRATING 150 YEARS
2
Highlights
Significant improvement in earnings - net profit1 up 25%Net profit up 25%
Growth projects continue
Proposed capital return
$400+ million of growth projects underway over last two years
$182 million or 20 cents per share – gearing to lift to around 30%
1. Net profit excluding significant items
2
3
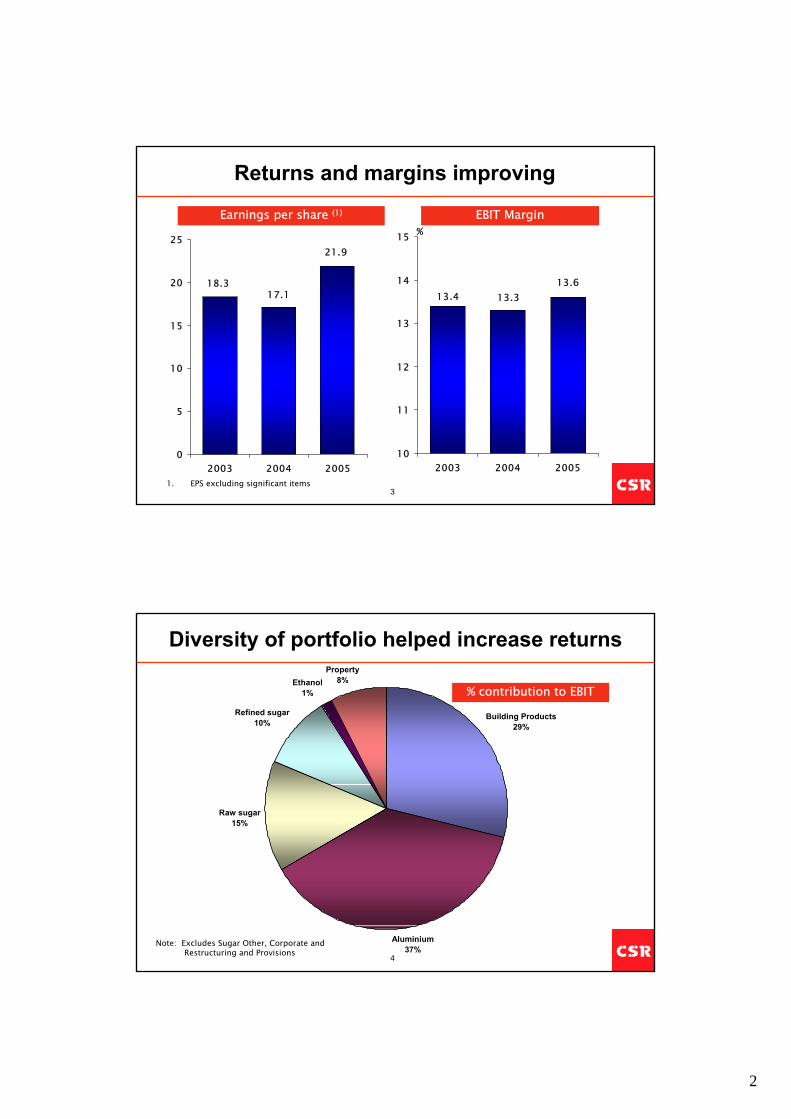
Returns and margins improving
17.118.3
21.9
0
5
10
15
20
25
2003 2004 2005
13.613.4 13.3
10
11
12
13
14
15
2003 2004 2005
%Earnings per share (1) EBIT Margin
1. EPS excluding significant items
4
Diversity of portfolio helped increase returns
% contribution to EBIT
Note: Excludes Sugar Other, Corporate and Restructuring and Provisions
Building Products29%
Aluminium37%
Raw sugar15%
Refined sugar10%
Ethanol1%
Property8%

3
5
Proposed capital return of $182 million
Proposed return of capital to achieve a one-off structural alteration to CSR’s gearing and share capital
Provides a more efficient capital structure and provides adequate flexibility for future growth
CSR understands that the ATO will issue a class ruling confirming that the return of capital will not be subject to tax
Cost base for shares will be reduced by $0.20 for capital gains tax calculations
Shareholders will vote on capital return at the AGM on 14 July 2005
6
Strategy to maximise shareholder returns
Lifting operational performance and seeking opportunities for value creating growth
Building Products:
Aggressively pursue operational performance improvement and pursue sensible growth
Leverage off China insulation and Australian market position to build value creating growth options
Build Sugar into self-sustaining business through growth in stable, higher value businesses (refining, renewable energy, ethanol)
Increasing value of Aluminium by improving Tomago operational performance, creeping capacity and lifting value added production
Take advantage of hedging opportunities to lock in returns
Establish Property as a sustainable earnings source
4
7
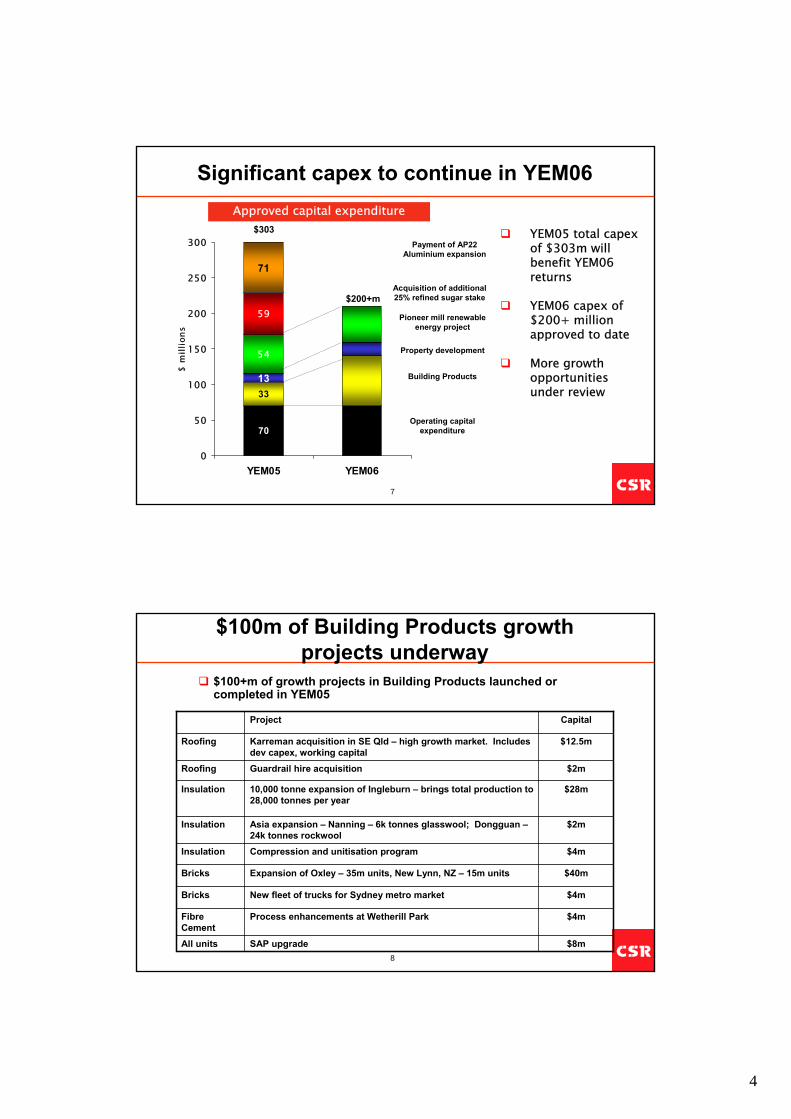
70
3313
54
59
71
0
50
100
150
200
250
300
YEM05 YEM06
$ m
illio
nsSignificant capex to continue in YEM06
YEM05 total capexof $303m will benefit YEM06 returns
YEM06 capex of $200+ million approved to date
More growth opportunities under review
Approved capital expenditure$303
$200+m
Pioneer mill renewable energy project
Building Products
Acquisition of additional 25% refined sugar stake
Operating capital expenditure
Property development
Payment of AP22 Aluminium expansion
8
$4mProcess enhancements at Wetherill ParkFibre Cement
$8mSAP upgradeAll units
$2mAsia expansion – Nanning – 6k tonnes glasswool; Dongguan –24k tonnes rockwool
Insulation
$4mNew fleet of trucks for Sydney metro marketBricks
$2mGuardrail hire acquisitionRoofing
$40mExpansion of Oxley – 35m units, New Lynn, NZ – 15m unitsBricks
$4mCompression and unitisation programInsulation
$28m10,000 tonne expansion of Ingleburn – brings total production to 28,000 tonnes per year
Insulation
$12.5mKarreman acquisition in SE Qld – high growth market. Includes dev capex, working capital
Roofing
CapitalProject
$100m of Building Products growth projects underway
$100+m of growth projects in Building Products launched or completed in YEM05

5
9
Three year plan to generate $75m in savings in Building Products
$-
$10
$20
$30
$40
$50
$60
$70
$80
YEM04 YEM05 YEM06 YEM07
• Rosehill improvement
• Overhead restructure
• Insulation unitisation
• Improved procurement savings
• General Operational Improvement Programs (OIP)
• Bricks logistics
• Rosehill improvement
• Reduced distribution costs
• Improved factory performance
• Insulation market growth
• NZ brick expansion
• Fibre cement upgrade
• China insulation expansion
• Improved procurement savings
• General OIP
• Ingleburn capacity expansion
• Oxley, Qld brick expansion
• Improved factory performance
• Reduced distribution costs
• Reduced customer service costs
• SAP upgrade
• Improved procurement savings
• General OIP
10
108-3
-517-1813
-8113
80
90
100
110
120
YEM04 Volume Price Inflation OIP Expensedimprovement
initiatives
Other YEM05
$ m
illio
n
19.4%16.5%ROFE (12 mths)12.3%11.6%EBIT Margin
-4113108EBIT
2918932Trading revenue%20042005$m YEM
Building Products – returns lower as housing market slowed
Returns impacted by additional costs to improve operations and customer service
Volumes lower as demand slowed in core regions
Expensed improvement initiatives will deliver benefits in YEM06
Movements in EBIT

6
11
Gyprock, Fibre
Cement42%
Other1%Insulation,
Hebel (inc Asia)22%
Roofing18%
Bricks and Pavers
17%
YEM05 Trading Revenue - $932 million
Gyprock™ – improved performance with sales and marketing restructured on specific market segments and higher value products
CSR Fibre Cement – volumes steady despite slowdown in some markets. Continued success with compressed sheet products
Monier ™ and Wunderlich ™ Roofing –Prices increased with volumes lower. Rosehill production fully meeting demand
PGH ™ Bricks & Pavers – good increase in pricing (from a low base) offset by volume reduction as NSW market softened
Bradford Insulation ™ – strong increase in profits with 15% volume expansion
• Asia – China performing well with Malaysia impacted by price competition
Paroc Panel ™ – Sales increasing with leading builders and architects
All Building Products businesses targeting new products and markets
12
67.9%51.0%ROFE (12 mths)
32.1%30.0%EBIT Margin
-2144142EBIT
5449474Trading Revenue
%20042005$m YEM
Aluminium EBIT down slightly with higher exchange rates and lower prices from hedged sales
Trading revenue up 5% to $474m as tonnage sold increased due to ramp-up of AP22 expansion project
EBIT was down slightly to $142m due to higher A$/US$ exchange rate and lower prices from hedged sales
A$2,440A$2,154A$2,402A$ ave spot price per
tonne
0.5590.6950.740US$/A$ average rate
$1,497
166,723
2004
$1,364
165,690
2003
$1,776
173,060
2005
LME US$ price per tonne
GAF sales in tonnes
YEM
10 year aluminium price
1,000
1,500
2,000
2,500
3,000
3,500
4-Jan
-93
29-Ju
l-94
21-F
eb-96
17-S
ep-97
20-A
pr-99
22-N
ov-00
9-Jul-
02
17-F
eb-04
1,000
1,500
2,000
2,500
3,000
3,500US$/tonneA$/tonne
7
13
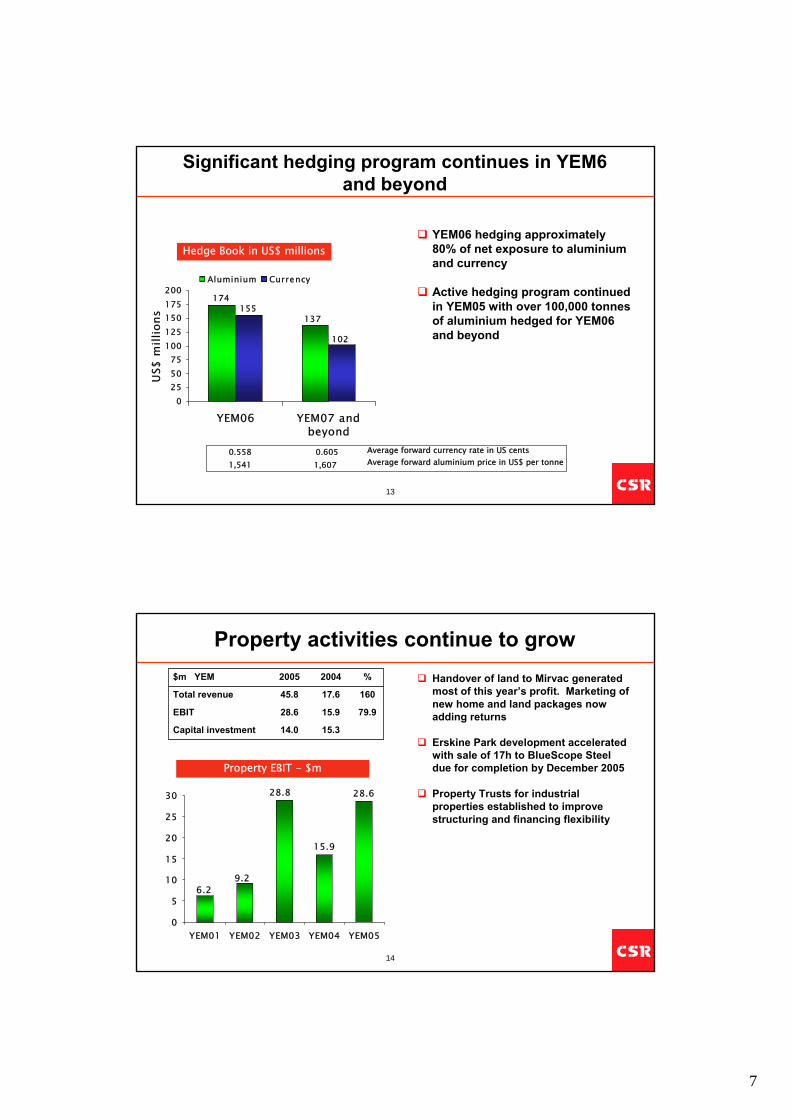
Hedge Book in US$ millions
174
137155
102
0255075
100125150175200
YEM06 YEM07 andbeyond
US$
mill
ions
Aluminium Currency
Average forward currency rate in US centsAverage forward aluminium price in US$ per tonne
Significant hedging program continues in YEM6 and beyond
YEM06 hedging approximately 80% of net exposure to aluminium and currency
Active hedging program continued in YEM05 with over 100,000 tonnes of aluminium hedged for YEM06 and beyond
0.6051,607
0.5581,541
14
15.314.0Capital investment
79.915.928.6EBIT
16017.645.8Total revenue
%20042005$m YEM
Property EBIT - $m
15.9
28.628.8
6.29.2
0
5
10
15
20
25
30
YEM01 YEM02 YEM03 YEM04 YEM05
Property activities continue to growHandover of land to Mirvac generated most of this year’s profit. Marketing of new home and land packages now adding returns
Erskine Park development accelerated with sale of 17h to BlueScope Steel due for completion by December 2005
Property Trusts for industrial properties established to improve structuring and financing flexibility

8
15
Property returns sustainable over long-term
YEM06 YEM07 YEM08 YEM09 YEM10 Beyond
Woodcroft
20 hectare residential development
Penrith Lakes
•5,000 residential lots
•CSR 20% interest
Erskine Park
100 hectare industrial development
Ongoing activities
•Enviroguard
•Other industrial properties
YEM11 YEM13YEM12 YEM14 YEM15
Home sales commenced in May 2005 with revenue upside to CSR
Ferntree Gully
75 residential lots
Development accelerated with sale of 17 hectares to Bluescope. Discussions with other parties continues with possible leasing opportunities
Land sales to begin in YEM06
Delays in gazettal likely to push start of returns to YEM07
Narangba
400 residential lots
Possible sale or development of up to 400 residential lots
16
Market OutlookJohn Hodgkinson
EGM Insulation Systems and Business
Development

9
17
100
120
140
160
180
200
1991
1992
1993
1994
1995
1996
1997
1998
1999
2000
2001
2002
2003
2004
2005
2006
2007
2008
Star
ts (0
00's
)
BIS Shrapnel View HIA View Underlying Demand Actual Commencements
Diverse views on housing market outlook
Forecast
Post-Olympics + GST impact
18
New brand marketing initiative
New campaigns to reach a broader base of customersBrand strategies to promote the key strengths of each product
10
19
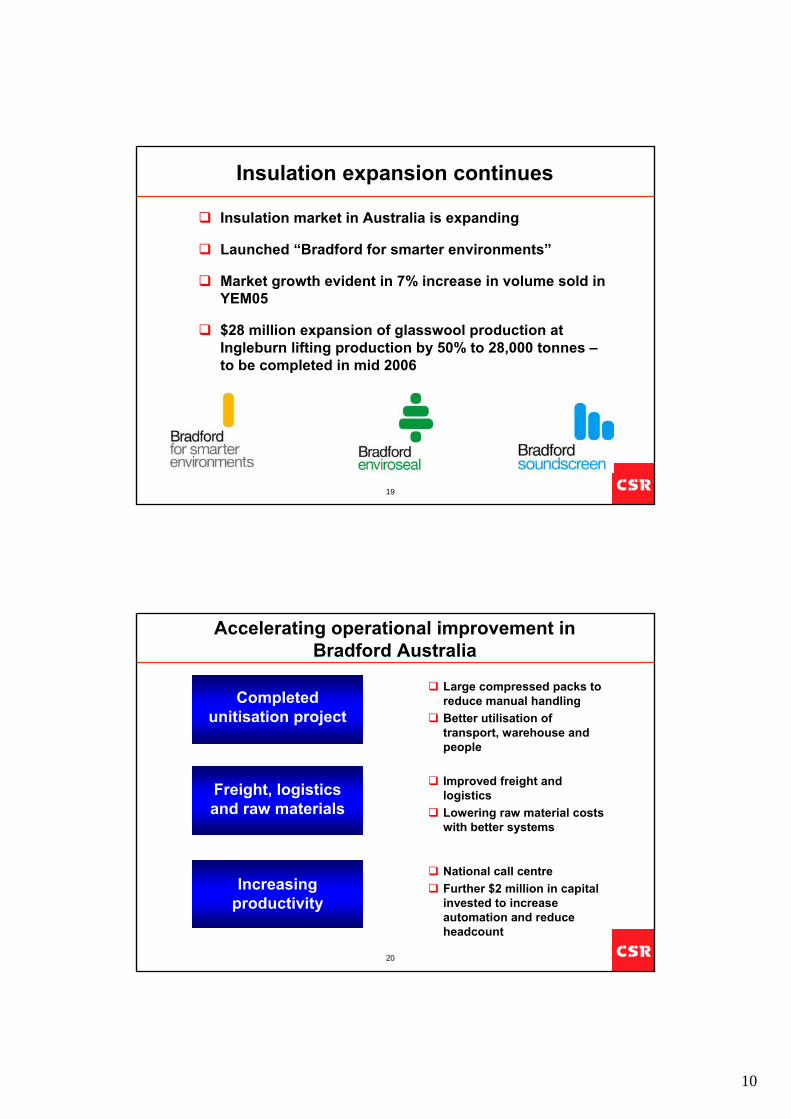
Insulation expansion continues
Insulation market in Australia is expanding
Launched “Bradford for smarter environments”
Market growth evident in 7% increase in volume sold in YEM05
$28 million expansion of glasswool production at Ingleburn lifting production by 50% to 28,000 tonnes –to be completed in mid 2006
20
Accelerating operational improvement in Bradford Australia
Large compressed packs to reduce manual handlingBetter utilisation of transport, warehouse and people
National call centreFurther $2 million in capital invested to increase automation and reduce headcount
Completed unitisation project
Freight, logistics and raw materials
Increasing productivity
Improved freight and logistics Lowering raw material costs with better systems

11
21
Growth in Asian insulation
6,000 tonne expansion of glasswool plant in Nanning completed in August 2004
4,000 tonne expansion of rockwool plant in Dongguan completed in March 2005 which increased capacity to 24,000 tonnes
Reviewing additional opportunities for low cost insulation expansion in Asia
22
Sales of Paroc Panels continue to increase
Significant growth in the last year
Projects underway with leading architects and builders
Sales capability established in Australia, NZ and China
Reviewing manufacturing opportunities in ChinaParoc Panels installed at Parkwood Homes head office in Gosford, NSW

12
23
Sugar Performance
Ian McMasterCEO CSR Sugar
24
CSR Sugar strategy
Playing a leading role in industry restructuring and deregulation
Performance improvement through the whole raw sugar value chain
Spread risk away from the volatile Australian raw sugar milling business by seeking growth in refining, cogeneration, ethanol
Longer term, capitalise on biotechnology research to increase sugarcane yield and create new product opportunities

13
25
Opportunities in Sugar Refining following increased ownership
CSR holding 75% ownership since 1 April 2004 – full consolidation of results began on 1 October 2004
Streamlined management structure
Renewed focus on key strategies for improvement
New product initiatives (CSR Smart packs)
Improving safety performance
Major asset review
Cost reduction in logistics
Focus on margin improvement
26
5.7%10.2%ROFE (12 mths)6.3%9.3%EBIT Margin
1393890EBIT60600961Trading Revenue%20042005$m YEM
9.1 4.5
23.9 37.0
37.1
15.6
55.1
-2.2 -4.2 -6.8
12.1
17.1
YEM03 YEM04 YEM05
Ethanol Refined sugarRaw sugar Other
EBIT by Business
Crop increased 4.6% with improved weather and farm productivity
Raw sugar price of $255 per tonne (11% increase from previous year)
Refining result improved with better food and beverage demand.
Ethanol result down as domestic and export prices fell due to increased competition
Investing in the future of the sugar industry
Includes additional 25% stake in refining JVs
Improvement in sugar returns

14
27
4
5
6
7
8
9
10
11
12
US
cent
s pe
r pou
nd
Sugar price recovered in YEM05
Crop size increasing with better weather and productivity improvements
Sugar price recovered to the A$255 per tonne range during the year
NY#11 Prompt Sugar Price
YEM01 YEM02 YEM03 YEM04 YEM05
14.0714.2114.95Cane crushed (mt)
229
6.76
14.65%
2.14
2004
274
5.86
14.86%
2.14
2003
255
8.10
14.46%
2.23
2005
CSR Final Pool Price
(YEM)
NY11 Average US cents per
lb
CCS% of Sugarcane
Raw Sugar Production
(mt)
YEM
28
5
6
7
8
9
10
05-Ja
n-04
05-A
pr-04
05-Ju
l-04
05-O
ct-04
05-Ja
n-05
05-A
pr-05
US
cent
s pe
r pou
nd
Factors influencing world sugar prices
India’s 2003/04 crop in question
India’s 2003/04 crop in question
Wet weather in Brazil
Wet weather in Brazil
Brazil crop behind schedule
Brazil crop behind schedule
Short term oversupply and fund liquidation
Short term oversupply and fund liquidation
Funds liquidate and turn net short as appetite for commodities wanes
Funds liquidate and turn net short as appetite for commodities wanes
2005/06
Rising Ethanol demand
Continued India / Pakistan imports
Brazilian growth
Russian demand
Global risks
EU Reform
2005/06
Rising Ethanol demand
Continued India / Pakistan imports
Brazilian growth
Russian demand
Global risks
EU Reform
Raw sugar demand from India and Pakistan
Raw sugar demand from India and Pakistan

15
29
Financial Results
Warren SaxelbyCFO
30
2817.121.9Earnings per share (cents) 1
13.3%13.6%EBIT/trading revenue
(13)(19)Net finance expense(61)(69)Tax expense(29)(33)Outside equity interest
16.2%
201
322438
2,368
2005
14.9%Return on shareholders’ funds
19370EBITDA
160
263
1,971
2004
25Net profit 1
23EBIT
20($ million unless stated)
Trading revenue
% Change
Year ended 31 March
Strong improvement in profits
1 Excluding significant items

16
31
86Total significant items after tax
(39)Write-off of legal costs55Tax consolidation
Breakdown of significant items21Settlement with Alcan4Write-back of settlement provisions
45
28786201
2005
––Significant items160
160
2004
Settlement with certain insurers
79Net profit after significant items
25($ million unless stated)
Net profit before significant items
% Change
Year ended 31 March
Significant items contributed to higher cash flow
32
79.915.928.6Property(18.6)(16.9)Corporate costs
-1.6144.2141.9Aluminium
$m EBITYear ended 31 March
262.7(29.0)291.7
37.6
112.62004
22.6322.0Total EBIT(29.4)Restructure and provisions 3
20.5351.4Subtotal
138.889.8Sugar 1
-4.1108.0Building Products
% Change2005
1. Assumes raw sugar price of A$255 per tonne for YEM05 and $229 for YEM042. Includes product liability provision and superannuation top-up payment.
Portfolio of businesses underpinned earnings growth
17
33
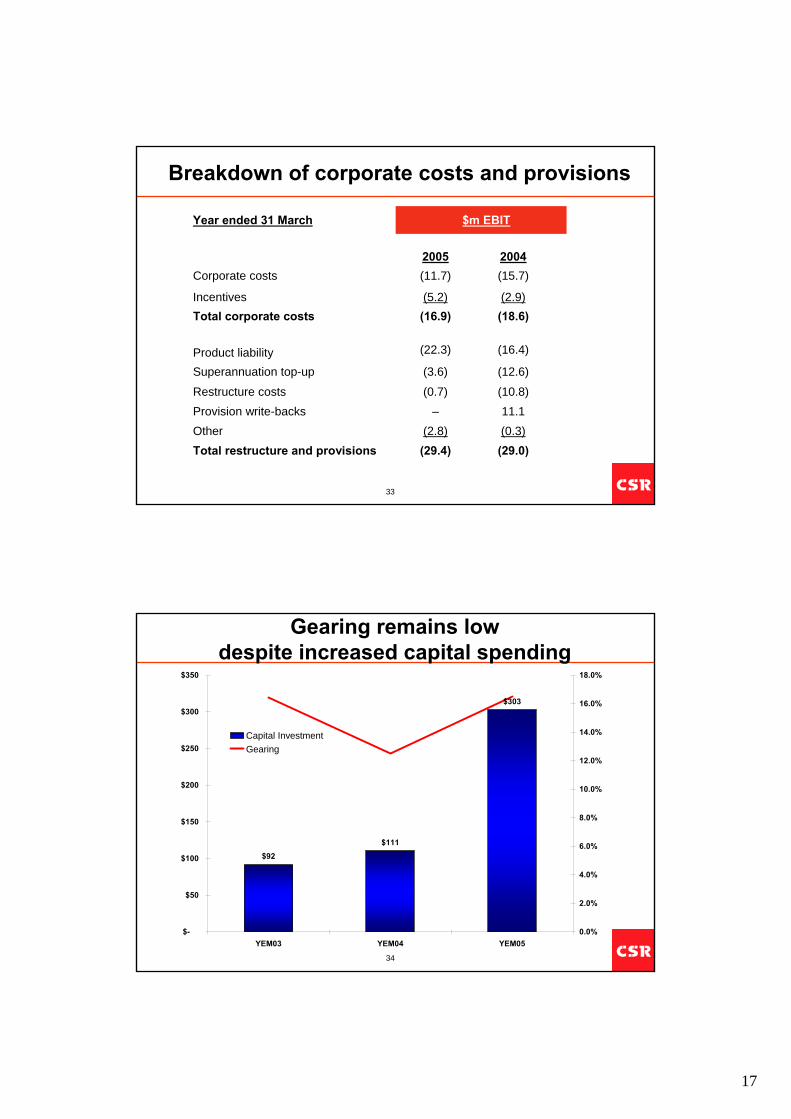
(10.8)(0.7)Restructure costs
(16.4)(22.3)Product liability(12.6)(3.6)Superannuation top-up
(2.9)(5.2)Incentives
$m EBITYear ended 31 March
(29.0)(0.3)11.1
(18.6)
(15.7)2004
(29.4)Total restructure and provisions(2.8)Other
–Provision write-backs
(16.9)Total corporate costs
(11.7)Corporate costs2005
Breakdown of corporate costs and provisions
34
Gearing remains low despite increased capital spending
$92$111
$303
$-
$50
$100
$150
$200
$250
$300
$350
YEM03 YEM04 YEM050.0%
2.0%
4.0%
6.0%
8.0%
10.0%
12.0%
14.0%
16.0%
18.0%
Capital InvestmentGearing

18
35
Gearing (pro forma for capital return) to increase to approximately 30%
Gearing to increase to approximately 30%
Interest expense after tax to increase by approximately $8 million per year ($5 million in YEM06)
Interest cover (EBITDA / net interest expense) is expected to remain at conservative levels
27.6%16.5%Gearing (Debt/Debt + Equity)
1,638.01,638.0Funds employed
452.2182.1270.1Net debt
1,185.8(182.1)1,367.9Total equity
After return of capitalReturn of capital transaction
As reportedAs at 31 March 2005 –$ million
36
A-IFRS impact
CSR to prepare financial statements that comply with Australian equivalents to International Reporting Standards (A-IFRS) for the half year ending 30 September 2005
Balance sheet as at 31 March 2005 to be re-stated to apply A-IFRS
Interpretation of new accounting standards is ongoing
Key accounting policy differences and current estimates have notbeen subject to audit
Shareholders’ funds to reduce by 5%
EBIT to increase by approximately 10%
NPAT to increase by 3 - 5%
Detailed review of A-IFRS impacts included in appendix slides

19
37
Outlook
Alec Brennan Managing Director
38
Outlook
CSR’s returns are subject to a number of influences, including movements in exchange and interest rates, aluminium and raw sugar prices and levels of building activity
At this early stage in the year, we expect to achieve a result broadly in line with last year
An updated outlook statement will be provided at the AGM on 14 July 2005
Insurance litigation continues with a trial currently expected in October 2005

20
39
Outlook by businessBuilding Products
Plans based on housing starts to fall by around 5%Aggressive OIP program should offset impact of softer marketsResult should be broadly in line with last year
Aluminium
Lower A$ returns to reduce EBIT by 5-10%
SugarCrop expected to be slightly below last year, but result will benefit from renewable energy revenueAssuming sugar price remains at current levels, result should bebroadly in line with last year
Property
Result at least in line with last year
40
Appendix

21
41
A-IFRS impact on Shareholders’ Funds
A-IFRS impact still under review – details below have not been subject to auditShareholders’ Funds is expected to be reduced by 5%
$1,296Shareholders’ funds at 31 March 2005 –net A-IFRS impact
10Adjustment to tax balances
(16)Superannuation funds
(6)Write-off of start-up costs
(6)Write-off of internal generated brand names
4Fair value of investment in Sugar Terminals Limited
42Fair value of derivatives
(100)Write down of assets (1)
$1,368Shareholders’ funds as at 31 March 2005 –($ million)
1. Some write-downs may be required of sugar milling assets following valuation review at the regional level compared to the value of the total milling assets. Other asset adjustments are expected to be minor.
42
A-IFRS impact on EBIT
EBIT to increase by approximately 10%
$352EBIT for the year ended 31 March 2005 –net A-IFRS impact
(1)Other
(2)Expensing of employee shares
22Unwinding of discounted liabilities (1)
3Reduced amortisation
8Reduced depreciation on assets
$322EBIT for the year ended 31 March 2005 –($ million)
1. Unwinding of the interest component of discounted assets and liabilities will be treated as interest (borrowing costs), rather than as general expense/income. There will be a corresponding increase in net borrowing costs. $17 million relates to the product liability provision.
22
43
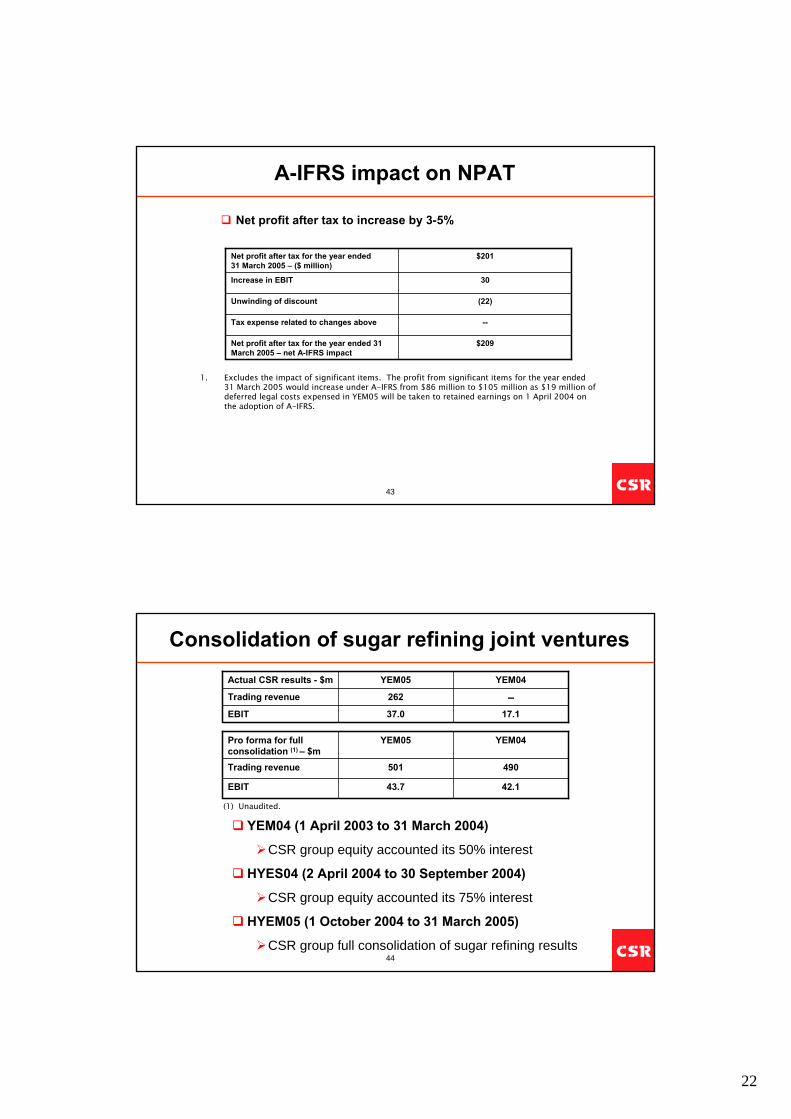
A-IFRS impact on NPAT
Net profit after tax to increase by 3-5%
$209Net profit after tax for the year ended 31 March 2005 – net A-IFRS impact
--Tax expense related to changes above
(22)Unwinding of discount
30Increase in EBIT
$201Net profit after tax for the year ended 31 March 2005 – ($ million)
1. Excludes the impact of significant items. The profit from significant items for the year ended 31 March 2005 would increase under A-IFRS from $86 million to $105 million as $19 million of deferred legal costs expensed in YEM05 will be taken to retained earnings on 1 April 2004 on the adoption of A-IFRS.
44
Consolidation of sugar refining joint ventures
YEM04 (1 April 2003 to 31 March 2004)
CSR group equity accounted its 50% interest
HYES04 (2 April 2004 to 30 September 2004)
CSR group equity accounted its 75% interest
HYEM05 (1 October 2004 to 31 March 2005)
CSR group full consolidation of sugar refining results
17.137.0EBIT
262Trading revenue
YEM04YEM05Actual CSR results - $m
42.143.7EBIT
490501Trading revenue
YEM04YEM05Pro forma for full consolidation (1) – $m
(1) Unaudited.

23
45
Insurance litigation
In 1995, CSR commenced proceedings in the US against various insurers which issued policies to CSR between 1978 and 1989
CSR has settled disputes with certain defendants for a total of A$53 million – including Lloyds for A$41 million
CSR asserts that the remaining insurers have the major liability for CSR’s claims
CSR is pursuing litigation against the remaining defendants. A trial is expected to commence on or about October 2005
Legal costs in respect of litigation to 31 March 2005 of $39.4 million have been written off
The potential benefit of this litigation is not included in CSR’s financial statements as the outcome is uncertain