building net-ready information interoperability performance …€¦ · data is based on a survey...
TRANSCRIPT
NDIA 2008 Systems Engineering Conference
Building net-ready information interoperability
performance indicator widgets for DoDAF 2.0
dashboards
Jayson DurhamNAERG/ELS Project Lead (ASN RDA CHSENG)SPAWAR Systems Center Pacific, Code 56150
Bill Anderson & David ZubrowCarnegie Mellon, Software Engineering Institute

2
Agenda
Motivation
Goal Driven Measurement – GQIM
Workshop Outcomes
Case Example: Mission-Architecture IPT
Next Steps

Information Technology Association of America
HSDII Committee Objective
3
Benefit ITAA/GEIA members, government
sponsors, builders, developers, and
users of …
Products, Processes and Tools related to …
Information Interoperability by …
Filling critical gaps,
Improving performance, and
Reducing costs.

Information Technology Association of America
But How Do We Judge?
4
Measurement!

5
Agenda
Motivation
Goal Driven Measurement – GQIM
Workshop Outcomes
Case Example: DODAF 2.0
Next Steps

6
Goal-Driven Measurement
When using goal-driven measurement,
the primary question is not:
“What metrics should I use?”
rather, it is:
“What do I want to know or learn?”
© 2008 by Carnegie Mellon University

Version 6.6 7
Measuring Goal Achievement
Success
criteria1 2 3 4 1 2 3 4
%
Reporting Periods
Success indicatorsStrategy to
accomplish
goal
Task 1Task 2Task 3
Task n
••
Tasks to accomplish goal
••••
Progress indicators
Analysis indicators
80
20
40
60
100
Tasks
Test C
ases
Co
mp
lete
Functions
For project
manager
Reporting Periods
Planned
Actual
Reporting Periods
Planned
Actual
Roll-up for
higher management
Reporting Periods
Planned
Actual
Reporting Periods
Planned
Actual
80
2040
60
10080
2040
60
10080
2040
60
100
Goal
Impact
© 2006 by Carnegie Mellon University

Version 6.6 8
Indicator Template
Goal ID:
Objective
Question
Inputs
Algorithm
Assumptions
Components of
good goal statements
Step : Goals
Clear articulation of
the criteria you will
use to decide if the
goal has been met.
Step : Success Criteria
Step :
Clarify Questions
to refine the goal
Step :
Operationalize Goals
Operationalize
goal statement
Step :
Decomposing
Goals
Subgoals by
perspective
Step :
Identify the actions
needed to implement
your measures
Planning
TasksData Elements
Task 1
Task 2
Task 3
Task n
1 2 3 4 5
50
Y
Y
Y
N
N
Y
Y
YY
Step :
Identify the data elements
Data
Elements
Size
Defects
Avail Source
+
0
-
0
+
- -
QA
CM
?
Etc.
•
•
Verification and
action plans
Step :
Strategies &
Activities
Step : Success Indicators
Postulate Success Indicators
Step : Prepare a plan
Indicator Template1
2
3
56
4
7
8 9
10
Workshop Steps
© 2006 by Carnegie Mellon University
Version 6.6 9
Agenda
Motivation
Goal Driven Measurement – GQIM
Workshop Outcomes
Case Example: Mission-Architecture IPT
Next Steps

Information Technology Association of America
Workshop Outcomes: Top Three Goals
• Enable precision information sharing among stakeholders
– Minimal ambiguity
• Measure the “goodness” for information interoperability standards
– Then standards in general
– “Goodness” for information interoperability
– How effectively are users getting & using information exchanges
• Systems and enterprise‟s achieve more effective collaboration and/or achieve greater success by enabling inter-enterprise collaboration
10

Information Technology Association of America
Enable information sharing among
stakeholders with minimal ambiguity.
11

Information Technology Association of America
Quality Evaluation
Standard Quality Evaluation
0%
10%
20%
30%
40%
50%
60%
70%
80%
90%
100%
Extensibility Simplicity Openness Security Scalability Usability
Categories
Go
od
ness
Notes:
Each category is graded on a scale of 1-5 and weighted to a total of 100%.
Data is based on a survey of stakeholders.
Users of the indicator include:
• standard developers and associated marketing
• potential adopters
• actual users
Scalability means across multiple domains
Usability means by multi-functions (non-IT experts)
12

Information Technology Association of America
Interface Maintenance
Cost of Interface Maintenance
0
20
40
60
80
100
120
Period 1 Period 2 Period 3 Period 4 Period 5 Period 6 Period 7 Period 8 Period 9 Period 10
Do
llars
13

Information Technology Association of America
Adoption
Standard Adoption
0
2000
4000
6000
8000
10000
12000
Year 1 Year 2 Year 3 Year 4 Year 5 Year 6 Year 7 Year 8 Year 9 Year 10
Nu
mb
er
Adopters Target
14

Information Technology Association of America
Session time Session time
La
ten
cy
# o
f tou
ch
es
WordNet
Cyc{
Semantic Alignment
15
Information Technology Association of America
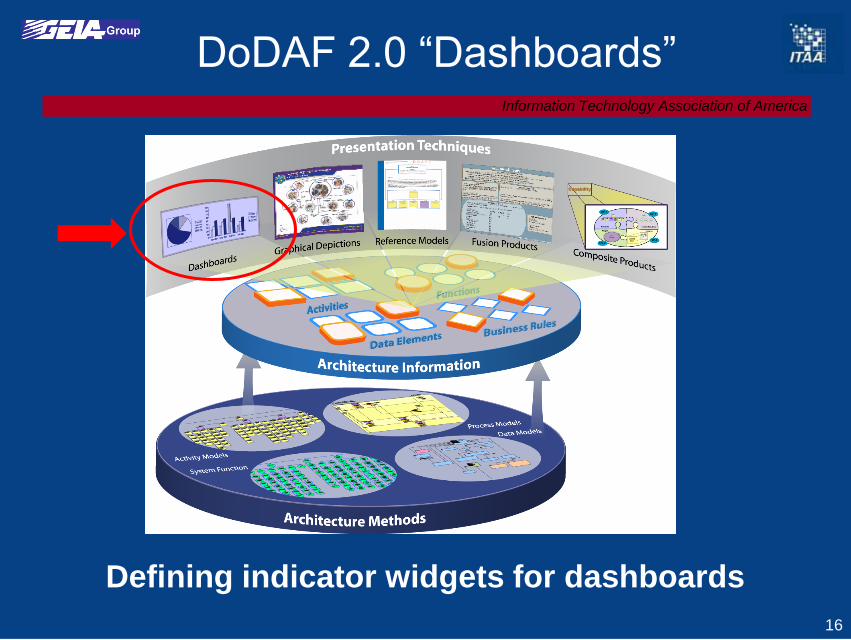
DoDAF 2.0 “Dashboards”
Defining indicator widgets for dashboards
16
Information Technology Association of America
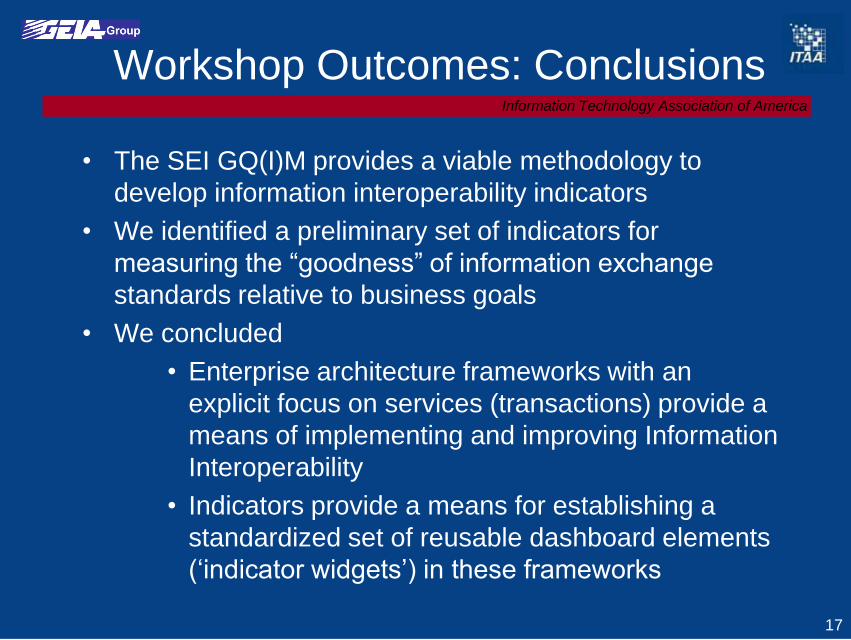
Workshop Outcomes: Conclusions
• The SEI GQ(I)M provides a viable methodology to
develop information interoperability indicators
• We identified a preliminary set of indicators for
measuring the “goodness” of information exchange
standards relative to business goals
• We concluded
• Enterprise architecture frameworks with an
explicit focus on services (transactions) provide a
means of implementing and improving Information
Interoperability
• Indicators provide a means for establishing a
standardized set of reusable dashboard elements
(„indicator widgets‟) in these frameworks
17

Information Technology Association of America
Workshop Outcomes: Observations
• The DoDAF 2.0 presentation technology working
group has set forth dashboards as a category of
presentation views
• Baseline indicators for information interoperability
need to be developed (similar to baseline KPI‟s for
enterprise architecture frameworks)
• Existing work from assessment, performance, and
other model based efforts provide valuable
resources for developing information
interoperability (as well as other) indicator widgets
18
19
Agenda
Motivation
Goal Driven Measurement – GQIM
Workshop Outcomes
Case Example: Mission-Architecture IPT
Next Steps
DAHIEFYSTEMSNGINEER
20
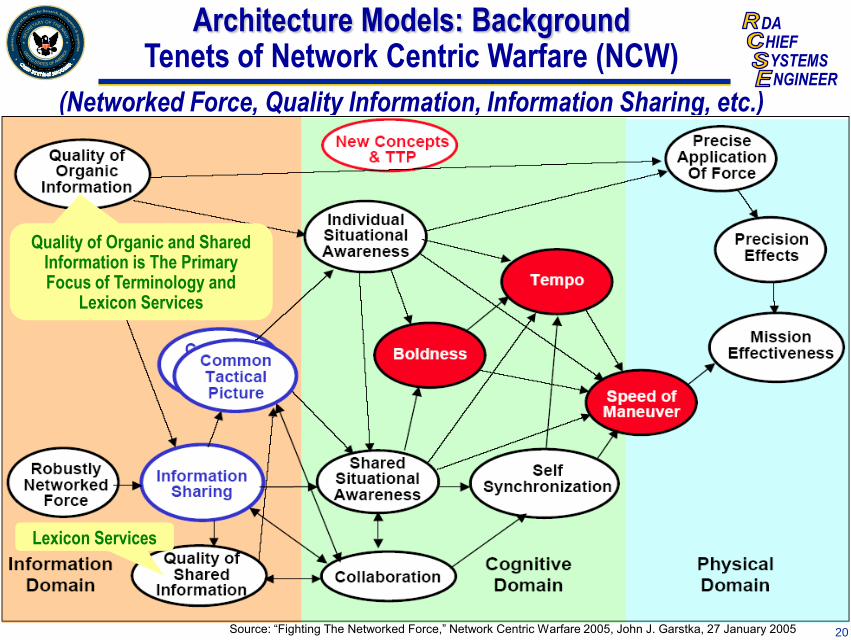
Architecture Models: BackgroundTenets of Network Centric Warfare (NCW)
(Networked Force, Quality Information, Information Sharing, etc.)
Source: “Fighting The Networked Force,” Network Centric Warfare 2005, John J. Garstka, 27 January 2005
Quality of Organic and Shared Information is The Primary Focus of Terminology and
Lexicon Services
Lexicon Services

DAHIEFYSTEMSNGINEER
21
Terminology Services: ChallengeSemantic Interoperability Scoping
Terminology Services Primary Focus

DAHIEFYSTEMSNGINEER
22
Terminology Services: ChallengeInformation Interoperability
Common Lexicon vs Ad-Hoc Reverse Engineering
Reverse Engineering is Expensive, Difficult, and Often Not Feasible
ArchitectureData
ModelsInformation Exchange
Common Terminology Makes Information Interoperability Possible
Common Terminology Common Terminology
Reverse EngineeringAd-Hoc Terminology
Reverse EngineeringAd-Hoc Terminology

DAHIEFYSTEMSNGINEER
23
Terminology Services: Related WorkCapability-Based Systems-of-Systems Engineering (SOSE)
Common Access Card (CAC) Enabled Websites
https://ncee.navy.mil/Pages/default.aspx https://stalwart.spawar.navy.mil/naerg
NCEE NAERGNaval Collaborative Engineering Environment (NCEE) Naval Architecture Element Reference Guide (NAERG)
NAERG Link at CHSENG NCEE
Home Page
DAHIEFYSTEMSNGINEER
http://www.visualmining.com/products/live-dashboard-examples.shtml
http://www.powerstrat.com/index.php?page=16
http://www.geis.fhp.osd.mil/GEIS/SurveillanceActivities/ESSENCE/ESSENCE.asp#fig1
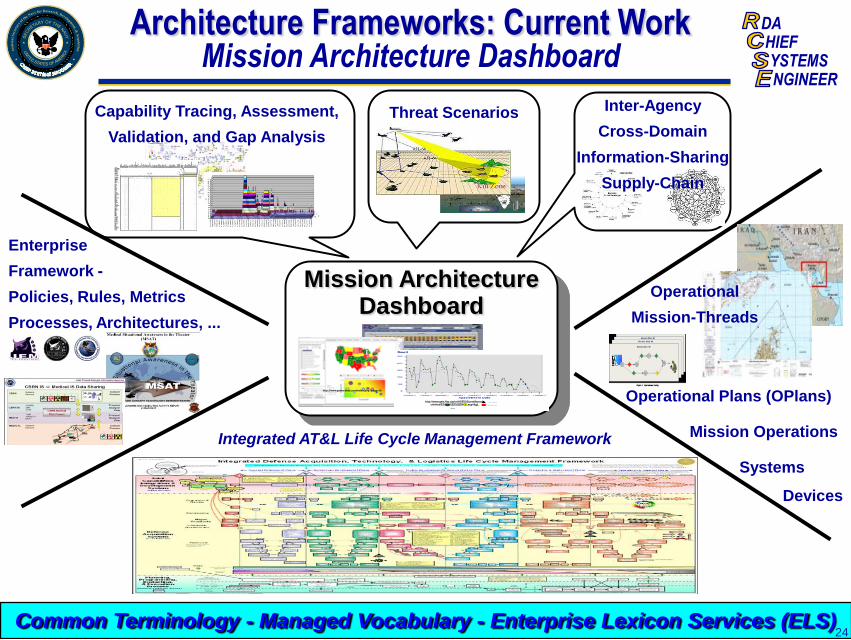
Enterprise
Framework -
Policies, Rules, Metrics
Processes, Architectures, ...
Mission Architecture Dashboard
Integrated AT&L Life Cycle Management Framework
Capability Tracing, Assessment,
Validation, and Gap Analysis
Threat Scenarios Inter-Agency
Cross-Domain
Information-Sharing
Supply-Chain
Operational Plans (OPlans)
Operational
Mission-Threads
Mission Operations
Systems
Devices
Common Terminology - Managed Vocabulary - Enterprise Lexicon Services (ELS)
Architecture Frameworks: Current WorkMission Architecture Dashboard
24
DAHIEFYSTEMSNGINEER
25
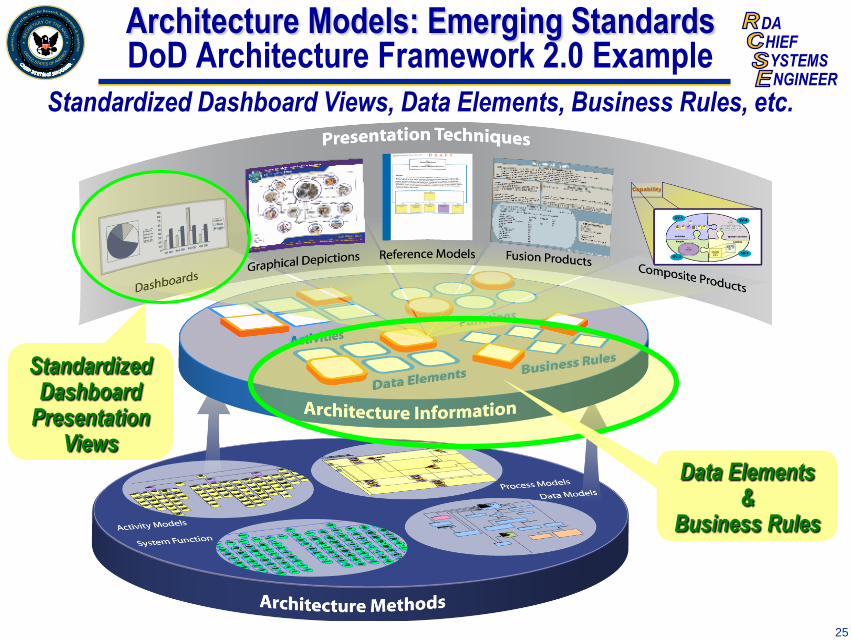
Architecture Models: Emerging StandardsDoD Architecture Framework 2.0 Example
Standardized Dashboard Views, Data Elements, Business Rules, etc.
Data Elements&
Business Rules
StandardizedDashboard
PresentationViews

DAHIEFYSTEMSNGINEER
26
Architecture Frameworks: Emerging Focus Enterprise Dashboards and Widgets
Decision Makers
SOA
KPI
DoDAF 2.0
Business Logic
Data Resources
Presentation Layer
DashboardsRoles & Responsibilities
Ent
erpr
ise
Lexi
con
Ser
vice
s
Multiple Dashboards &
Decision Makers
KPI – Key Performance Indicator
27
Agenda
Motivation
Goal Driven Measurement – GQIM
Workshop Outcomes
Case Example: Mission-Architecture IPT
Next Steps

Information Technology Association of America
Way Ahead
• Further explore leveraging DoDAF 2.0 to
help define an open standard for indicator
widgets
• Produce an exemplar reference
implementation for a set of indicator widgets
• Produce guidance on how to go from
existing standards to the indicator widget
paradigm
28
29
Questions?

Information Technology Association of America
Resources Related to Information Interoperability
Indicator and Assessment
• DOD Net-Centric Checklist, Version 2.1.4, July 30, 2004
– Assists program managers in understanding the net-centric attributes that their programs need to
implement to move into the net-centric environment as part of a service-oriented architecture in the
Global Information Grid.
• NCIOC Network Centric Analysis Tool (NCAT) & SCOPE model
– NCAT is a metric measurement tool developed by the NCOIC for use in evaluating the ability of a
system/subsystem/component to operate in a network centric environment. Designed to leverage
complementary tools developed by DISA and others, the NCAT is highly flexible, easily adaptable, and
can be tailored for specific requirements.
• DOD's Modular Open Systems Approach (MOSA) Program Assessment and Rating Tool (PART)
– An analytical tool to aid DoD Program Managers assess their approach to open systems throughout the
acquisition life cycle.
• Navy Open Architecture Assessment Tool (OAAT)
– A Navy tool to assess the openness of a systems or program.
• DOD's Data and Service Exposure Verification Tracking Sheets
– Used to measure net-centricity in support of the DOD's Net-Centric Data Strategy.
A catalog of reusable indicators can be readily derived
30

`© 2008 Carnegie Mellon University
NO WARRANTY
ANY CARNEGIE MELLON UNIVERSITY AND SOFTWARE ENGINEERING INSTITUTEMATERIAL CONTAINED HEREIN IS FURNISHED ON AN “AS-IS" BASIS. CARNEGIEMELLON UNIVERSITY MAKES NO WARRANTIES OF ANY KIND, EITHEREXPRESSED OR IMPLIED, AS TO ANY MATTER INCLUDING, BUT NOT LIMITED TO,WARRANTY OF FITNESS FOR PURPOSE OR MERCHANTABILITY, EXCLUSIVITY,OR RESULTS OBTAINED FROM USE OF THE MATERIAL. CARNEGIE MELLONUNIVERSITY DOES NOT MAKE ANY WARRANTY OF ANY KIND WITH RESPECT TOFREEDOM FROM PATENT, TRADEMARK, OR COPYRIGHT INFRINGEMENT.
Use of any trademarks in this presentation is not intended in any way to infringe on therights of the trademark holder.
This Presentation may be reproduced in its entirety, without modification, and freelydistributed in written or electronic form without requesting formal permission. Permission isrequired for any other use. Requests for permission should be directed to the SoftwareEngineering Institute at [email protected].
This work was created in the performance of Federal Government Contract NumberFA8721-05-C-0003 with Carnegie Mellon University for the operation of the SoftwareEngineering Institute, a federally funded research and development center. TheGovernment of the United States has a royalty-free government-purpose license to use,duplicate, or disclose the work, in whole or in part and in any manner, and to have orpermit others to do so, for government purposes pursuant to the copyright license underthe clause at 252.227-7013.