building mineral linkages and economic diversification the ... value addition in ghana... · the...
TRANSCRIPT

Building mineral linkages and economic diversification – the case of Ghana and ECOWAS
John SloanAfrican Minerals Development Centre

Outline of Presentation
1. The Africa Mining Vision context and scope of this initiative
2. Mining Sector’s Contribution to Value Addition
3. Opportunities for Local Production
4. Spatial and Regional Potential
5. Challenges and Policy Recommendations
The Africa Mining Vision context and scope of this initiative

The Africa Mining Vision
• Adopted by African Heads of State in 2009
• Advocates for a fundamental shift towards harnessing minerals for inclusive and sustainable opportunities
• The only African-owned transformative framework on minerals
• Moves away from focus on mineral rents/revenues
• Focus on mainstreaming mineral sector into broad-based development.
• African Minerals Development Centre established as an implementing agency of the AMV.
• Work on establishing linkages is central to AMDC’s activities
Strategic considerations for our engagement
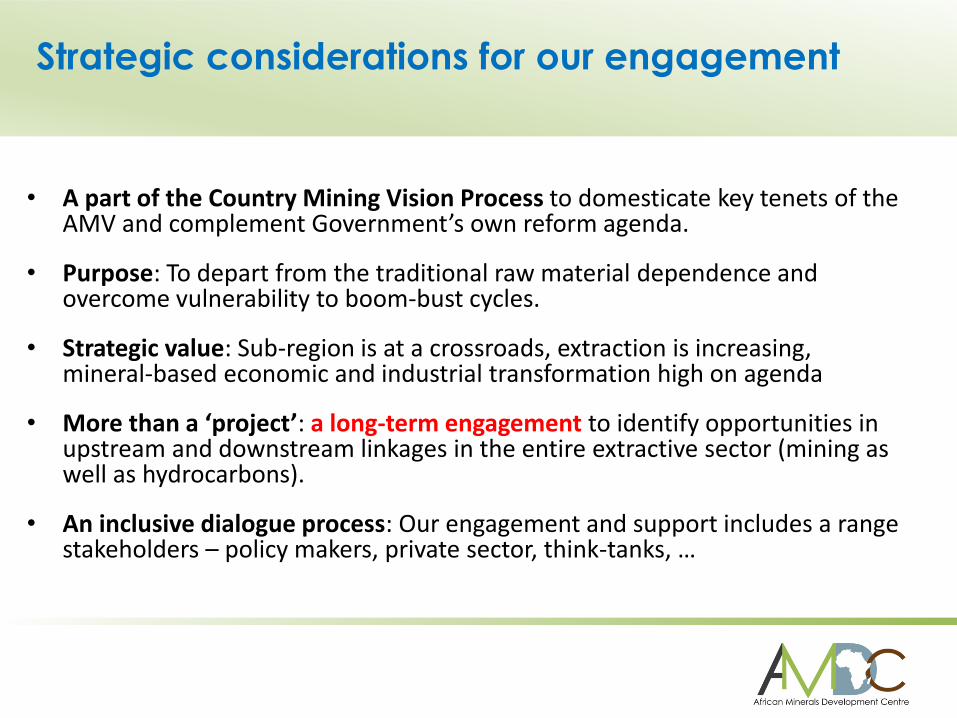
• A part of the Country Mining Vision Process to domesticate key tenets of the AMV and complement Government’s own reform agenda.
• Purpose: To depart from the traditional raw material dependence and overcome vulnerability to boom-bust cycles.
• Strategic value: Sub-region is at a crossroads, extraction is increasing, mineral-based economic and industrial transformation high on agenda
• More than a ‘project’: a long-term engagement to identify opportunities in upstream and downstream linkages in the entire extractive sector (mining as well as hydrocarbons).
• An inclusive dialogue process: Our engagement and support includes a range stakeholders – policy makers, private sector, think-tanks, …

Scope of initiative and steps taken
• Roll-out in three phases:
– Phase 1 (NOW): Analysis of opportunities in upstream value creation in mining
– Phase 2: Analysis of downstream linkage potential in mining (including artisanal small scale mining and industrial minerals - starting soon)
– Phase 3: Analysis of sidestream linkages with the hydrocarbon sector
• Steps thus far:1. Request from Government of Ghana to identify potential mineral linkages;
2. Study of regional upstream opportunities completed;
3. Results discussed with and validated by stakeholders (public, private, etc)
4. Approval of Cabinet Memo by EMT endorsing this initiative for value-addition
5. Workshop and launch of National Supplier Development Programme (NSDP)

Analysis undertaken
Research approach – analysis of opportunities in upstream value creation:
– Assessing the state of upstream industrial linkages in West Africa
– Identifying opportunities and means to scale-up local procurement along a
set of realizable products (BGR);
– Studied challenges in the business environment, capacities and institutional
constraints;
– Considering economic clustering and means to link mining and industry;
– Proposing an NSDP to support domestic industries.

Mining Sector’s Contribution to Value Addition
Foreign Direct Investment
Mining dominates total FDI flows
Exports
Mining exports constitute a significant share of foreign
revenue
Fiscal revenue
Mining taxation key to total tax revenues
National income
Jobs
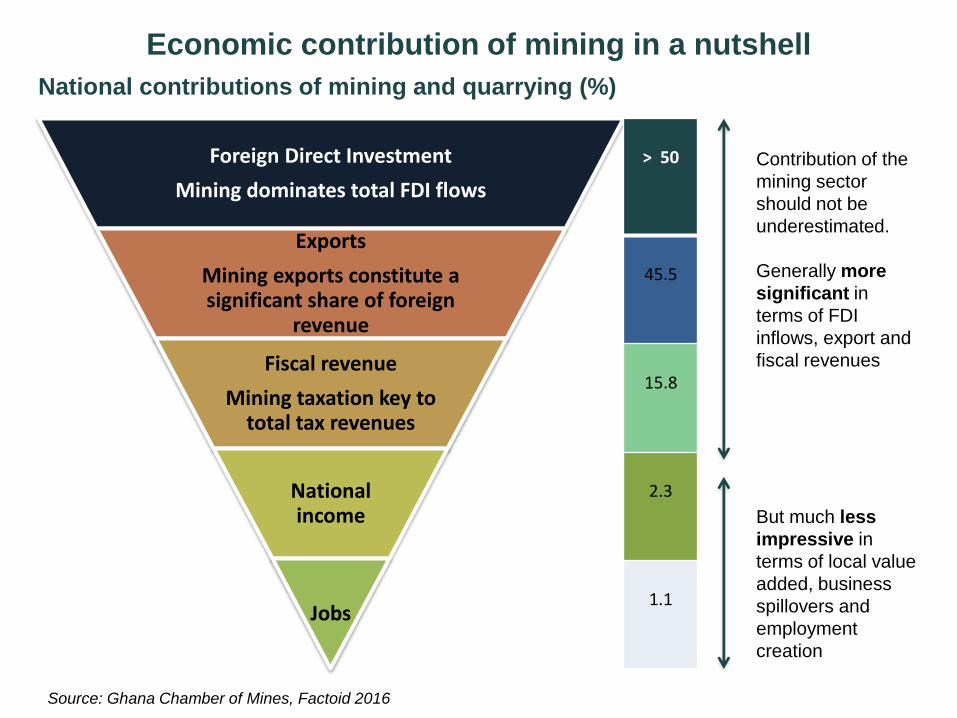
> 50
45.5
15.8
2.3
1.1
National contributions of mining and quarrying (%)
Economic contribution of mining in a nutshell
Contribution of the
mining sector
should not be
underestimated.
Generally more
significant in
terms of FDI
inflows, export and
fiscal revenues
But much less
impressive in
terms of local value
added, business
spillovers and
employment
creation
Source: Ghana Chamber of Mines, Factoid 2016

US$, million 2015 2016
Total Local Purchases (incl. energy) 1492,9 48% 1690,97 52%
Total Local Purchases (excl. Diesel & Electric Power) 865,6 28% 1013,8 31%
Total Local Purchase on Diesel and Energy 627,3 20% 677,2 21%Payment to employees 429,97 14% 435,6 13%Total Fiscal payments 377,3 12% 427,23 13%
Expenditure on Corporate Social Investment 17,8 0,6% 12,2 0,4%Total mineral revenue 3118,1 3257,6
Meanwhile, the industry reported in-country contributions as follows
Source: Ghana Chamber of Mines, 2016
0 200 400 600 800 1000 1200 1400 1600 1800
Total Local Purchases (incl. energy)
Total Local Purchases (excl. Diesel & Electric Power)
Payment to employees
Total Fiscal payments
Expenditure on Corporate Social Investment
Mining companies' in-country expenditure 2015-16 (US$, million)
2016
2015
> 50
45.5
15.8
2.3
1.1
Foreign Direct Investment
Mining dominates total FDI flows
Exports
Mining exports constitute a significant share of foreign revenue
Fiscal revenue
Mining taxation key to total tax revenues
National income
Jobs
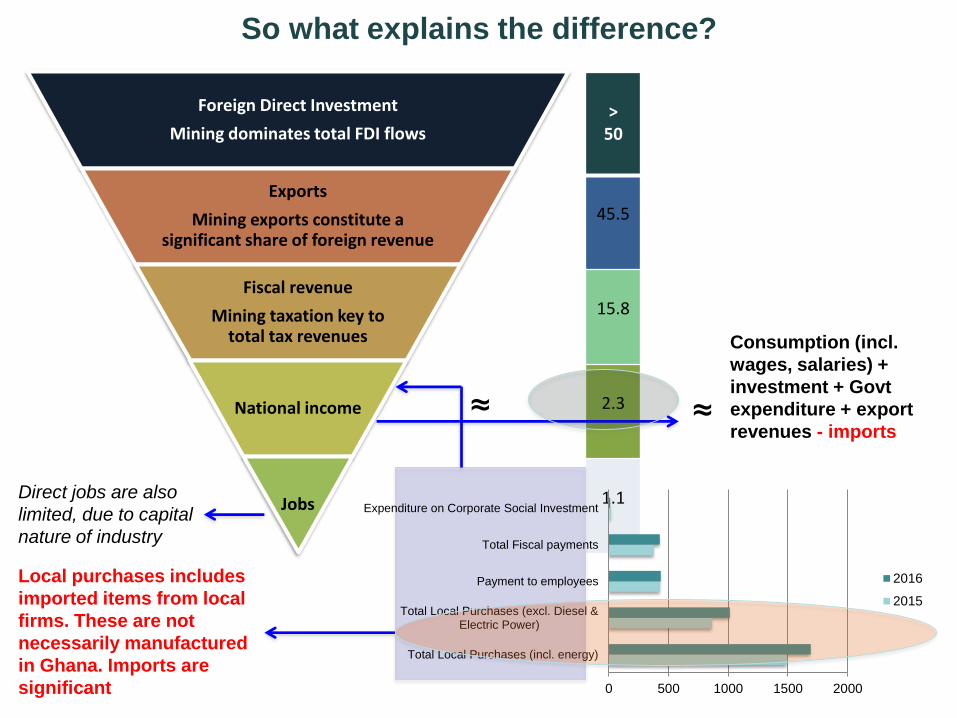
So what explains the difference?
Consumption (incl.
wages, salaries) +
investment + Govt
expenditure + export
revenues - imports
Local purchases includes
imported items from local
firms. These are not
necessarily manufactured
in Ghana. Imports are
significant
≈
Direct jobs are also
limited, due to capital
nature of industry
≈
0 500 1000 1500 2000
Total Local Purchases (incl. energy)
Total Local Purchases (excl. Diesel &Electric Power)
Payment to employees
Total Fiscal payments
Expenditure on Corporate Social Investment
2016
2015

Goods or services 1st
edition of LC, 2014
2nd
edition of LC 2016
Forthcoming 3
rd Edition of
LC, 2018* 1 Grinding media 2 Explosive (emulsion) 3 Cement and cement product/ grout 4 Quick and hydrated lime 5 Electric cables 6 High Density Polyethylene (HDPE) and PVC
pipes
7 General lubricants 8 Re-treading tyres 9 Bolts and nuts
10 Crucibles 11 Plastic sample bags 12 Calico bags 13 Bullion boxes 14 Chain link, fencing, wire netting, barbed wire
etc
15 Conveyor rollers 16 Metal/ PVC core trays 17 Overall and work clothes 18 Haulage services 19 Catering services 20 Activated carbon* 21 Ammonium sulphate* 22 Chemicals (caustic soda)* 23 Mill liners* 24 Motor re-winding and re-furbishing* 25 Rock bolts and split-sets* 26 Steel products (plate, angles, brackets,
sprockets)*
27 Ventilation ducting* 28 Wood products* 29 Yelomine pipes*
Local Content Requirements under LI 2173 of 2012

Local content regulation: total procurement based on procurement plans and list
of 8 products (LI 2173) assessed in 2016
Based on the assessment made by the Minerals Commission in 2016, mining
companies purchased 73.3% of the initial 8 products listed on Regulation LI 2173
from “local” sources. However, when calculated against the total purchases
made, this was equivalent to only 8.4% (if fuel is incl) and 14.5% without fuel
Source: Minerals Commission, 2016
Product
2015 Total
procurement
(US$)
2015 Total local
procurement (US$)
2015 2015 True local
procurement
(US$)
2015 % True local
% local
1. Grinding Media 62,3 28,13 45,2 17,89 63,6
2. Heavy duty electrical cables 1,35 0,95 70,4 0,49 36.1
3. HDPE/PVC pipes 9,77 9,75 99,8 9,73 86.7
4. General lubricants 11,22 10,93 97,4 10,93 50.1
5. Quick/ hydrated lime 21,81 21,81 100,0 21,81 100
6. Tyre re-treading 0,75 0,75 100,0 0,75 100
7. Explosives 63,29 63,29 100,0 63,3 100
8. Cement 0,77 0,77 100,0 0,77 100
Total (8 items on LI 2172, 2015) 171,25 136,38 79,6 125,66 73.3
Total purchases including diesel and energy, 2015 1492,9 9,1 8,4
Total Local Purchases (excl. Diesel & Electric Power) 865,6 15,8 14,5

What prevents local sourcing?
• Reliability of supply and quality of manufactured inputs listed as KEY CONSTRAINT to sourcing higher value goods locally.
• ECA (2013): local sourcing accounted for 67-79% of total spending by three largest gold mining firms, BUT this does not reflect value addition or domestic ownership.
• ACET (2015): 20% of spending by mining firms went to local procurement, but figure does not reflect ownership of suppliers.
• These issues persist regardless of commodity prices, need for change in approach as per the AMV.

Opportunities for Local Production
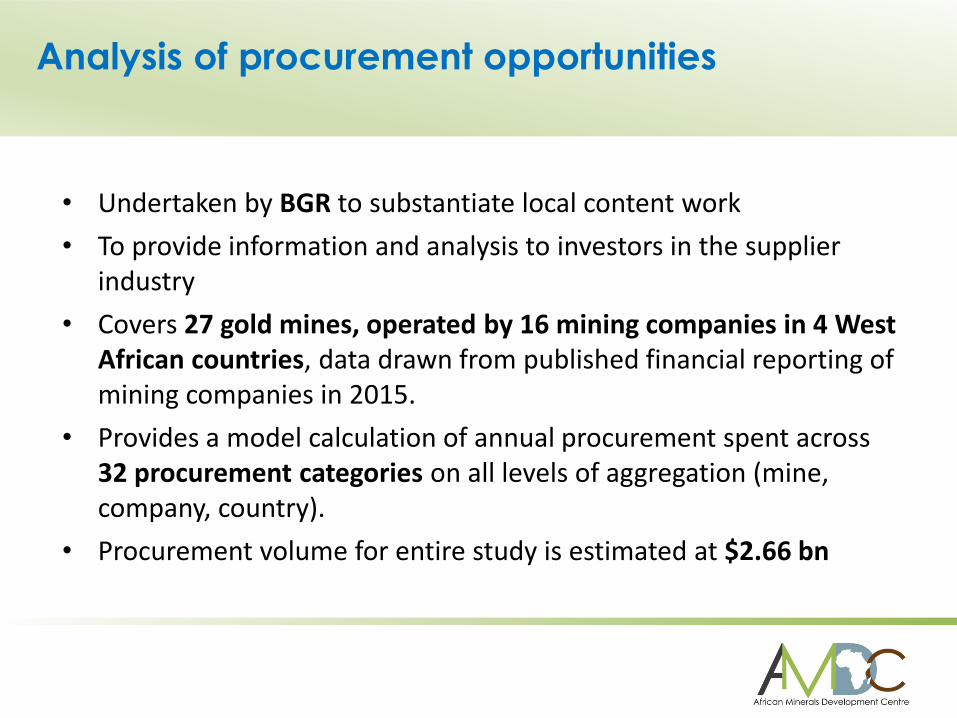
Analysis of procurement opportunities
• Undertaken by BGR to substantiate local content work
• To provide information and analysis to investors in the supplier industry
• Covers 27 gold mines, operated by 16 mining companies in 4 West African countries, data drawn from published financial reporting of mining companies in 2015.
• Provides a model calculation of annual procurement spent across 32 procurement categories on all levels of aggregation (mine, company, country).
• Procurement volume for entire study is estimated at $2.66 bn
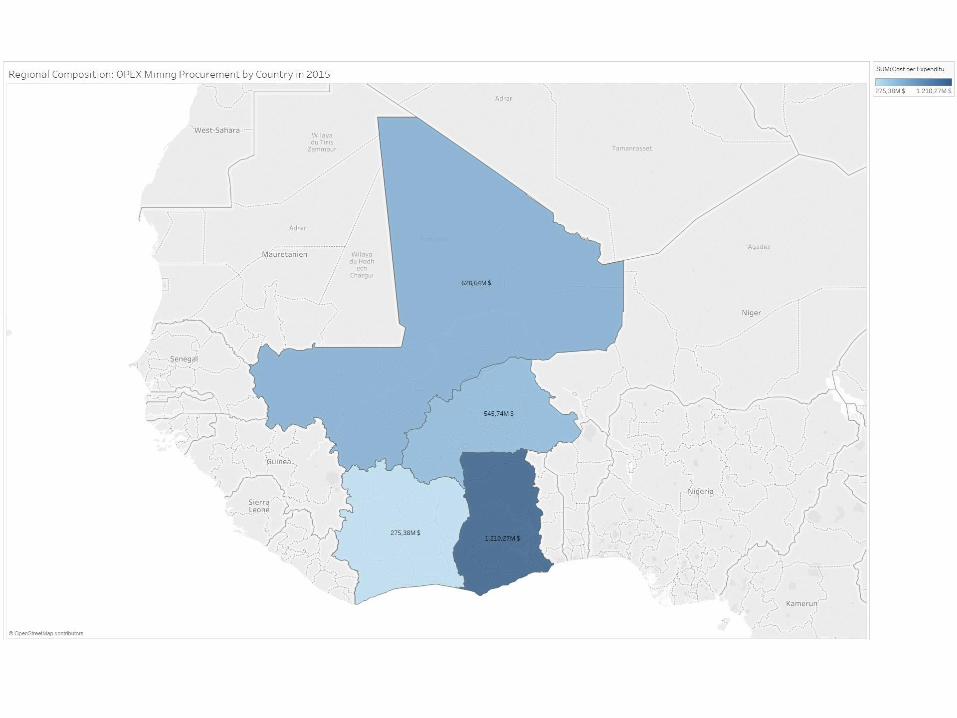

Local procurement opportunities are significant
.00 20.00 40.00 60.00 80.00 100.00 120.00 140.00 160.00 180.00
Fuel and lubricants - power
Other reagents
Fuel and lubricants - mining
Spare parts and opex equipment
Grinding media
Electricity
Explosives and accessories
Lime
Tyres
Geological and exploration services
Supply chain services
Analysis and testing
Environmental services
Equipment & Plant maintenance & repair
Safety and protective equipment
Site related services
Drilling equipment and services
Food and beverages
Construction, and related materials and services
Electrical equipment and supplies
Exploration consumables
Equipment rental
Feasibility, design and engineering
Corporate / Admin services
Telecommunications
Water services (including general waste management)
Personnel related services
Office supplies and equipment
Electronic equipment and supplies
General maintenance & repair
Camp / site supplies
Total procurement by top categories for Ghana, 2015, US$ million
Source: BGR Procurement Model
Spatial and Regional Potential
Mineral-industrial cluster to spur value chains
• Significant opportunities in geographical and sectoral clusters
• Cluster – concentrated development of a set of economic activities. Can be regional- sectoral- or export-focus: SEZs, EPZs, industrial parks etc.
• Multiplier and agglomeration effects in output, productivity, employment, knowledge spillovers.
• Avenues for both upstream and downstream linkages, as per AMV
• What strategic clusters are possible, what policy interventions are needed?
• How can the NSDP help mineral-industrial clusters succeed?

Opportunity: Ghana / West Africa Mineral Supply Cluster
• A Mineral Supply Cluster can draw on our assets (mineral endowments and mining activities; existing zones) to coordinate support to suppliers.
• Overcome regional concentration: manufacturing less distributed geographically than minerals – ie Ghana mainly around major cities (i.e. 25% of manufacturing in greater Accra, 25% in Ashanti).
• Mineral Supply Cluster to support industrialization initiatives – One District One Factory, etc.
• Ensure that establishment of factories based on: existing business environment, past industrialization efforts, resource endowments, human capital, connectivity to other districts, regions and countries.
• Link export-oriented nature of existing zones domestically

Regional Opportunities
• ECOWAS – 15 country and over $700 billion GDP region.
• Regional role of some clusters/zones (Suame manufacturing cluster)
• Region’s imports feature many manufactures / industrial goods.
• Cluster to help reach minimum threshold for efficiency (aluminum, steel etc)
• Joint ventures with other West African firms
• Capitalize on emerging and increasing mineral producers’ growing supply needs (Nigeria)
• Re-think on how ROOs, regional trade and industrial policy rules can fit in to and enhance cluster strategy

Challenges and Policy Recommendations

Overall Policy Landscape and constraints
• Mining and even industry framework too focused on rent maximisation, insufficient emphasis on supply chain development and broader linkages with other economic sectors
• Currently key policy is Local Content – needed but not sufficient – there is still very little to show in terms of value addition.
• A number of supply-side constraints became apparent
• Insufficient policy coherence, coordination and consistency (e.g. duty exemptions for inputs; Free Zone cap on domestic supply; capital requirements on foreign investment seems to limit FDI or JVs with local firms; etc. )
• No systematic approach to or strategy to reinforce industrial capacity and capacity of service providers.

Industry and even manufacturing still commodity-driven
Industrial value-added growth Manufacturing value-added growth
0
5
10
15
20
25
30
35
40
45
2007 2008 2009 2010 2011 2012 2013 2014 2015
Gro
wth
rat
e (%
)
-5
0
5
10
15
20
2007 2008 2009 2010 2011 2012 2013 2014 2015G
row
th r
ate
(%)
Improving the business climate and opportunities
for local firms
• Firms face barriers including administrative procedures; latent levels of
infrastructure particularly energy, transport; etc.
• Need to address these competitiveness and cost-of-doing-business
challenges, to reach small local firms with significant potential.
• Pursue beneficial state-business relations and collaborative partnerships,
including within private sector between local buyers and sellers.
• Properly harness Local Content – address challenges facing local suppliers,
entrenched interests etc. and revise it to be comprehensive across the
region.
Expanding and enriching the local market
• Pursue market opportunities as modeled by BGR
• Harness regional opportunities – market size matters.
• Need upstream mining supply chains to go beyond the mining sector.
• Link policy with industrialization of region and individual countries
including devising means for IP implementation.
• Also strategic interventions in aluminium, petrochemicals, iron and
steel, salt etc.
Boosting skills to stimulate value addition across
sectors
• A highly educated workforce is important to ensure proper technology and
knowledge transfers and spillovers.
• Yet labour productivity remains low by international standards. Skills
mismatches impact on the absorptive capacity of the supply chain. The quality
of the workforce is a major challenge
Options to address this:
• Comprehensive cross-sector skills development programme and
competitiveness and productivity council
• Assessment of capabilities and skills gaps
• Link TVET better with needs of future activities, orient towards STEM fields
• Facilitate movement of professionals across region
• Boost R&D, improve climate for innovation

Potential impact
• A regional economy both taking advantage of naturally occurring linkages and directly promoting new linkages between the mineral sector and economy at large
• Several suppliers serving the national and ECOWAS markets
• More firms and activities which feed into existing Free Zones and other clustering initiatives
• Job creation in higher-value fields
• A strengthened institutional structure supporting cross-discipline policy making across Ministries and other stakeholders
• Success in tandem with goals for broad, cross-sector industrialization

Thank You!