building materials and components: monthly statistics
TRANSCRIPT

Responsible statistician: Amy Symes-Thompson Email: [email protected] Media enquiries: 020 7215 1000 Public enquiries: +44 (0)207 215 6498 Next publication: 3 March 2021
Monthly Statistics of Building Materials and Components
Commentary, January 2021
Coverage: UK and Great Britain Geographical Area: Country, region and county
3 February 2021 National Statistics
Headline Findings
There was a 16.4% decrease in brick deliveries in December 2020 compared to
December 2019, according to the seasonally adjusted figures. The month-on-month
change shows a 9.4% decrease in December 2020.
In 2020, on the same basis, brick deliveries decreased by 23.4% compared to 2019,
the largest annual decrease since 2008.
Chart 1: Seasonally Adjusted Deliveries of Bricks, GB Number of bricks
Proposed withdrawal of bulletin The production team are considering discontinuing publication of the PDF bulletin section of this publication. As data in the bulletin is also published in Excel and ODS tables, the change would not result in any loss of information in the publication. When taking the decision, readers feedback is important. If you have any comments on this proposal, please email [email protected]
Monthly Statistics of Building Materials and Components – January 2021
_______________________________________________________________
________________________________________________
_________________________________________________________
______________________________________________________
_______________________________________________________
___________________________________________________________
________________________________________________________________
__________________________________________________________________
__________________________________________________________________
__________________________________
______________________________________________________
____________________________________________________
______________________________________________________
______________________________
___________________________________________
___________________________________________
______________________________________________
___________________________________________________________
_______________________________________________________
_______________________________________________________
_______________________________________________________________
_________________________________________________________
____________________________________________
________________________________________________________
_________________________________________________________
____________________________________________________
________________________________________________________
______________________________________________
________________________________________________________________
Contents
Introduction 3
Seasonal Adjustment Review 3
Summary of Results 4
Material Price Indices 4
Cement and Clinker 5
Sand & Gravel 6
Concrete 7
Bricks 8
Blocks 9
Imports and Exports of Construction Materials 10
Economic Background 12
COVID-19 Intelligence 12
Construction Output 12
Bank of England Summary of Business Conditions 13
Gross Domestic Product Estimate 13
Gross Domestic Product Forecast 13
Construction Output Forecasts 14
Manufacturing 15
Accompanying tables 16
Technical information 17
Definitions 19
Further information 19
Future updates to these statistics 19
Related statistics 19
Revisions policy 20
Uses of these statistics 20
User engagement 20
National Statistics designation 20
Contact 21
2
Monthly Statistics of Building Materials and Components – January 2021
Introduction
This commentary accompanies the latest Monthly Statistics of Building Materials and Components bulletin, published on the BEIS building materials web page on 3rd February
3
2021. It provides an overview of recent trends in the data presented in the bulletin.
The bulletin presents the latest detailed information on selected building materials and components. It covers the following building materials statistics:
Construction material price indices (monthly, UK)
Sand and gravel sales (quarterly, GB*)
Slate production, deliveries and stocks (quarterly, GB)
Cement and clinker production, deliveries and stocks (annual, GB)
Bricks production, deliveries and stocks (monthly, GB*)
Concrete building blocks production, deliveries and stocks (monthly, GB*)
Concrete roofing tiles production, deliveries and stocks (quarterly, GB)
Ready-mixed concrete deliveries (quarterly, UK)
Values of overseas imports and exports trades for selected materials and components for use in construction (quarterly, UK)
Value of EU and Non-EU Trade for selected materials and components for use in construction (annual, UK)
Note: * Regional figures available
These statistics support analysis of the construction materials market and business planning. They are regularly reported in the construction press and are used for a variety of purposes, including policy development and evaluation concerning the construction products industry, as well as monitoring market trends. Further detail is available in this document under Uses of these statistics.
Seasonal Adjustment Review
Seasonally adjusted series for deliveries of bricks, concrete blocks, ready-mixed concrete and sales of sand & gravel are published in this bulletin. The purpose of correcting the reported series is to allow for seasonal factors such as winter weather (including the reduction in hours of daylight, and frost and rain) and other seasonal events such as Christmas and Easter. Thus, seasonally adjusted figures show the underlying trend more clearly. Further information can be found in this document under Technical Information.
Monthly Statistics of Building Materials and Components – January 2021
Summary of Results
Material Price Indices
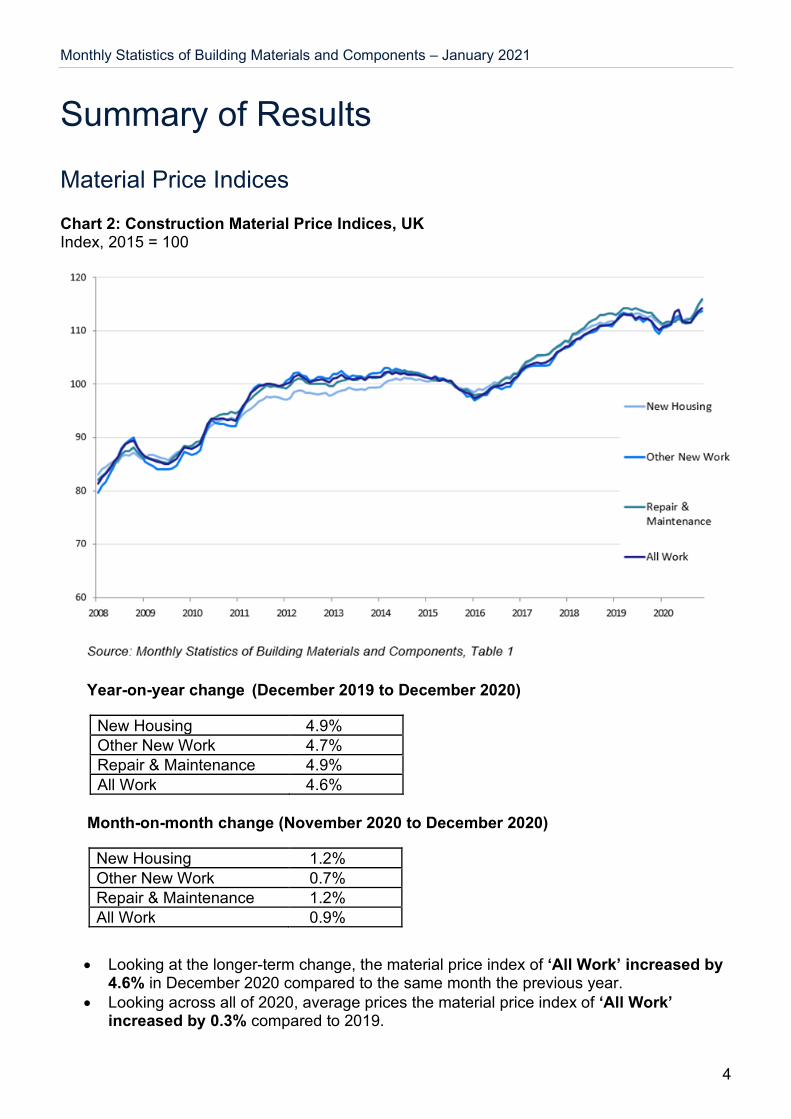
Chart 2: Construction Material Price Indices, UK Index, 2015 = 100
Year-on-year change (December 2019 to December 2020)
4
New Housing 4.9%Other New Work 4.7%Repair & Maintenance 4.9%All Work 4.6%
Month-on-month change (November 2020 to December 2020)
New Housing 1.2%Other New Work 0.7%Repair & Maintenance 1.2%All Work 0.9%
Looking at the longer-term change, the material price index of ‘All Work’ increased by 4.6% in December 2020 compared to the same month the previous year.
Looking across all of 2020, average prices the material price index of ‘All Work’ increased by 0.3% compared to 2019.
Monthly Statistics of Building Materials and Components – January 2021
Cement and Clinker
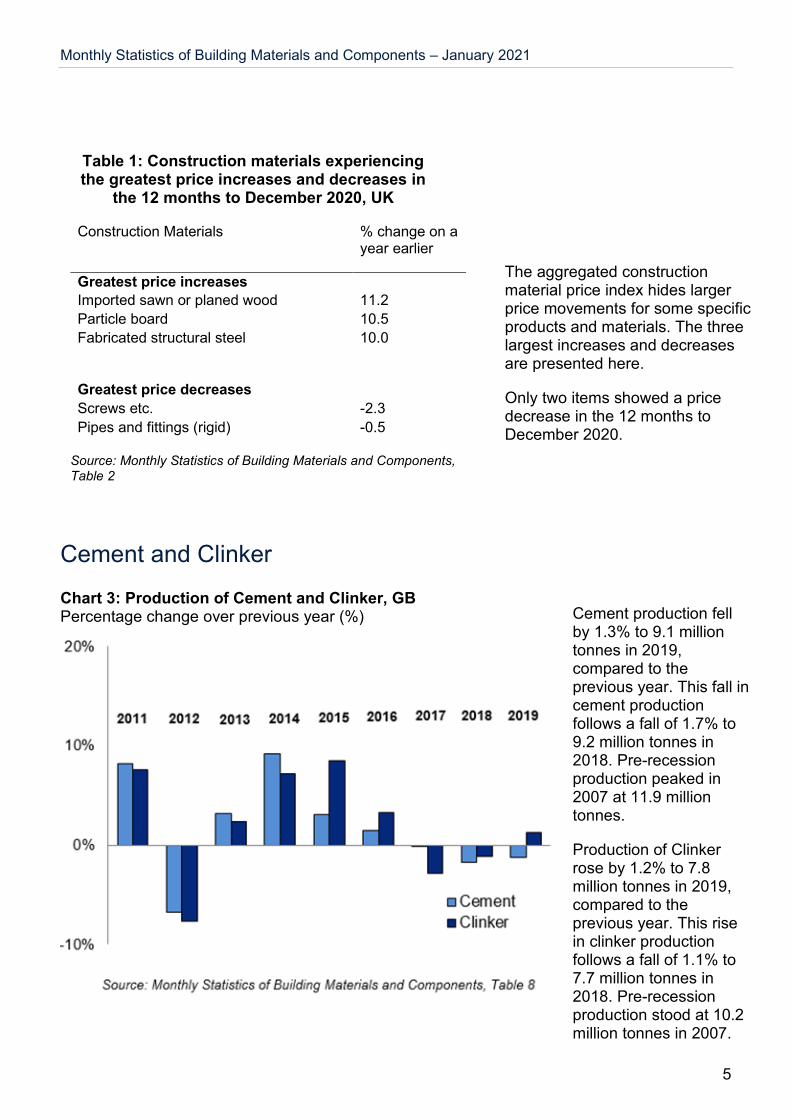
Chart 3: Production of Cement and Clinker, GB Percentage change over previous year (%)
5
Table 1: Construction materials experiencing the greatest price increases and decreases in
the 12 months to December 2020, UK
Construction Materials % change on a year earlier
Greatest price increases
Imported sawn or planed wood 11.2
Particle board 10.5
Fabricated structural steel 10.0
Greatest price decreases
Screws etc. -2.3
Pipes and fittings (rigid) -0.5
Source: Monthly Statistics of Building Materials and Components, Table 2
The aggregated construction material price index hides larger price movements for some specific products and materials. The three largest increases and decreases are presented here.
Only two items showed a price decrease in the 12 months to December 2020.
Cement production fell by 1.3% to 9.1 million tonnes in 2019, compared to the previous year. This fall in cement production follows a fall of 1.7% to 9.2 million tonnes in 2018. Pre-recession production peaked in 2007 at 11.9 million tonnes.
Production of Clinker rose by 1.2% to 7.8 million tonnes in 2019, compared to the previous year. This rise in clinker production follows a fall of 1.1% to 7.7 million tonnes in 2018. Pre-recession production stood at 10.2 million tonnes in 2007.
Monthly Statistics of Building Materials and Components – January 2021
Sand & Gravel
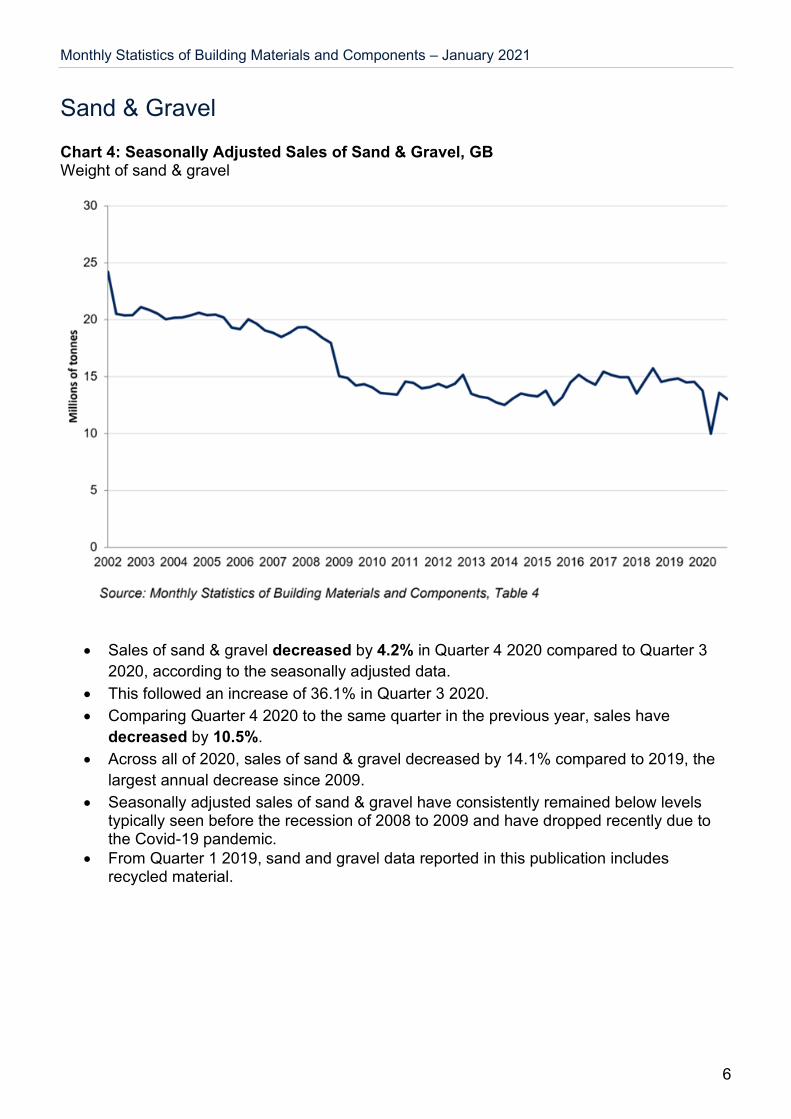
Chart 4: Seasonally Adjusted Sales of Sand & Gravel, GB Weight of sand & gravel
Sales of sand & gravel decreased by 4.2% in Quarter 4 2020 compared to Quarter 3
2020, according to the seasonally adjusted data.
This followed an increase of 36.1% in Quarter 3 2020.
Comparing Quarter 4 2020 to the same quarter in the previous year, sales have
decreased by 10.5%.
Across all of 2020, sales of sand & gravel decreased by 14.1% compared to 2019, the
largest annual decrease since 2009.
Seasonally adjusted sales of sand & gravel have consistently remained below levels typically seen before the recession of 2008 to 2009 and have dropped recently due to the Covid-19 pandemic.
From Quarter 1 2019, sand and gravel data reported in this publication includes recycled material.
6

Monthly Statistics of Building Materials and Components – January 2021
Concrete
Chart 5: Seasonally Adjusted Sales of Ready-Mixed Concrete, GB Volume of concrete
Ready-mixed concrete sales decreased by 30.5% in Quarter 2 2020 compared to
Quarter 1 2020, according to the seasonally adjusted data.
This followed a 9.4% decrease in Quarter 1 2020.
Sales in Quarter 2 2020 decreased by 39.4% compared to the same quarter in the
previous year, following a 14.3% decrease in Quarter 1 2020, on the same basis.
After the 2008 to 2009 recession, seasonally adjusted sales of ready-mixed concrete had been recovering steadily since Q2 2012, until the recent drop due to the Covid-19 pandemic.
7

Monthly Statistics of Building Materials and Components – January 2021
Bricks
Chart 6: Seasonally Adjusted Deliveries of Bricks, GB Number of bricks
There was a 16.4% decrease in brick deliveries in December 2020 compared to
December 2019, according to the seasonally adjusted figures.
This followed a 4.8% decrease in November 2020, on the same basis.
The month-on-month change shows a 9.4% decrease in December 2020.
This followed a 0.9% increase in November 2020, on the same basis.
In comparison to 2019, brick deliveries decreased by 23.4% in 2020, the largest annual
decrease since 2008.
Deliveries of bricks declined during the recession of 2008 to 2009. They have recovered slowly since 2013, until the recent drop due to the Covid-19 pandemic.
8

Monthly Statistics of Building Materials and Components – January 2021
Blocks
Chart 7: Seasonally Adjusted Deliveries of Concrete Blocks, GB Area of concrete blocks
There was a 7.6% increase in concrete block deliveries in December 2020 compared to
December 2019, according to the seasonally adjusted figures.
This followed a 2.0% increase in November 2020, on the same basis.
The month-on-month change shows a 1.6% increase in December 2020.
This followed a 0.5% increase in November 2020, on the same basis.
Compared to 2019, deliveries of concrete blocks decreased by 11.7% in 2020, the
largest annual decrease since 2009.
Concrete block deliveries declined during the recession of 2008 to 2009. The general
trend has been one of growth since 2013, until the recent drop due to the Covid-19
pandemic.
9
Monthly Statistics of Building Materials and Components – January 2021
Imports and Exports of Construction Materials
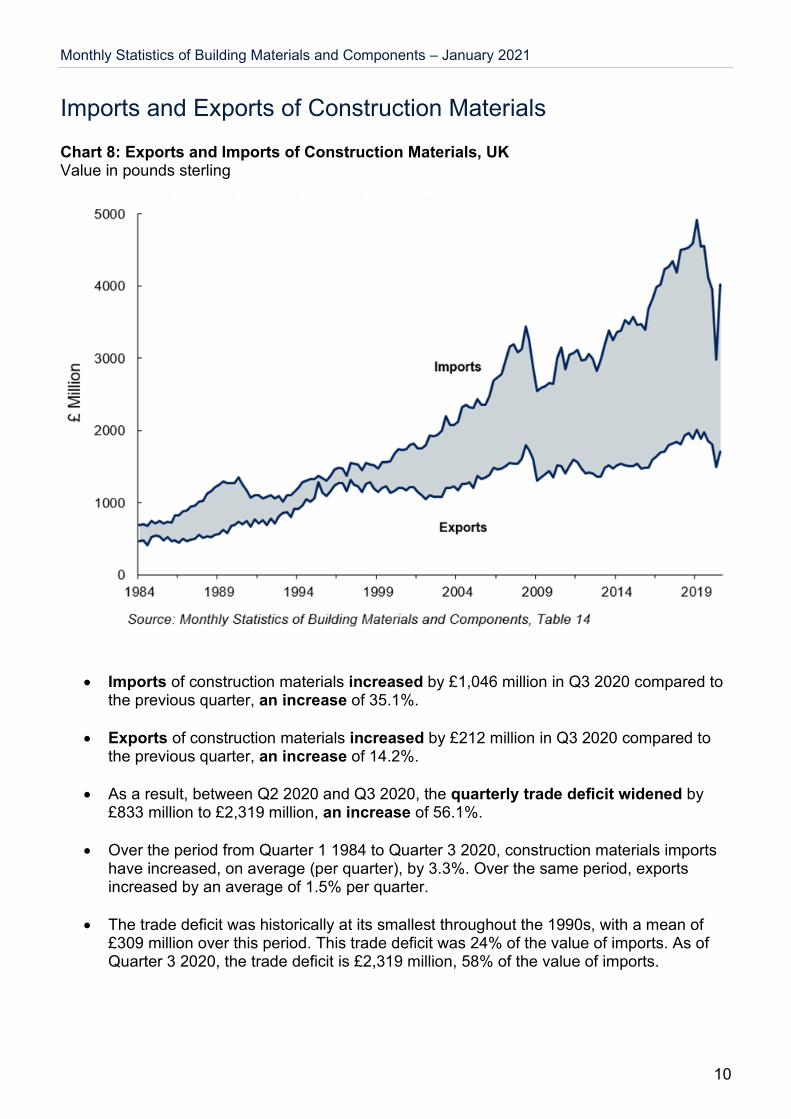
Chart 8: Exports and Imports of Construction Materials, UK Value in pounds sterling
Imports of construction materials increased by £1,046 million in Q3 2020 compared to the previous quarter, an increase of 35.1%.
Exports of construction materials increased by £212 million in Q3 2020 compared to the previous quarter, an increase of 14.2%.
As a result, between Q2 2020 and Q3 2020, the quarterly trade deficit widened by £833 million to £2,319 million, an increase of 56.1%.
Over the period from Quarter 1 1984 to Quarter 3 2020, construction materials imports have increased, on average (per quarter), by 3.3%. Over the same period, exports increased by an average of 1.5% per quarter.
The trade deficit was historically at its smallest throughout the 1990s, with a mean of £309 million over this period. This trade deficit was 24% of the value of imports. As of Quarter 3 2020, the trade deficit is £2,319 million, 58% of the value of imports.
10

Monthly Statistics of Building Materials and Components – January 2021
Table 2: Top-5 Exported and Imported Construction Materials in 2019
11
Top-5 Exported Materials £ million
Top-5 Imported Materials £ million
Electrical Wires 879 Electrical Wires 1,936
Paints & Varnishes 752 Lamps & Fittings 983
Plugs & Sockets 476 Sawn Wood> 6mm thick 799
Air Conditioning Equipment
403 Air Conditioning Equipment
666
Lamps & Fittings 385 Central Heating Boilers 622
Source: Monthly Statistics of Building Materials and Components, Table 14
Source: Monthly Statistics of Building Materials and Components, Table 15
Source: HMRC Overseas Trade Statistics
The ‘Rotterdam Effect’ (also known as the ‘Antwerp Effect’) may affect trade figures. This is explained in detail by HM Revenue & Customs.
All Building Materials & Components£ million (% of total trade in italics) EU Non-EU
Imports 10,778 7,366
59% 41%
Exports 4,336 3,367
56% 44%
Top-5 Export Markets £ million
Top-5 Import Markets £ million
Republic of Ireland 1,219 China 3,190
Germany 763 Germany 2,412
USA 705 Italy 1,003
France 646 Spain 932
Netherlands 571 Netherlands 857
The top five exported materials in 2019 accounted for 37% of total construction material exports.
The top five imported construction materials in 2019 accounted for 28% of total construction material imports.
Table 3: UK Trade of Construction Materials with EU and Non-EU Countries, 2019
Compared to pre-recession levels in 2007, the share of total UK construction material exports going to the EU has declined from 70% to 56%.
Table 4: Top 5 UK Export and Import Markets for Construction Materials in 2019 The top five export markets
comprised 51% of total construction materials exports in 2019. The Republic of Ireland remains the largest market, despite having shrunk from a pre-recession peak of 27% of total exports in 2007, to 16% in 2019.
The top 5 import markets comprised 46% of total construction materials imports in 2019. 18% of all imports are from China.
Monthly Statistics of Building Materials and Components – January 2021
Economic Background
COVID-19 Intelligence
12
The Office for National Statistics published further information from their fortnightly Business insights and impact on the UK economy publication on 28th January 2021, relating to 11th January to 24th January 2021.
Key points:
Weighted by count, 67.3% of construction firms said they were currently trading and had been for more than the last two weeks, compared with an all-industry average of 67.0%. 5.5% had started trading in the last two weeks after a pause in trading.
Weighted by turnover, 5.0% of construction firms still trading said their turnover had decreased by more than 50%. A further 10.5% said turnover had decreased by between 20% and 50%, and 22.5% said it had decreased by up to 20%.
Weighted by employment, the average proportion of the workforce on partial or furlough leave was 3.7% for construction businesses which had not permanently stopped trading.
Construction Output
The most recent provisional construction output figures for November 2020 were published by the Office for National Statistics on 15th January 2021.
Key points:
Construction output grew by 1.9% in the month-on-month all work series in November 2020, because of a 3.5% increase in new work, offsetting a 0.6% fall in repair and maintenance. This was the seventh consecutive month of growth since the 40.7% decline in April 2020.
The level of construction output in November 2020 was 0.6% above the February 2020 level, with repair and maintenance work 7.4% above and new work 3.1% below its pre-pandemic level.
The monthly increase in new work (3.5%) in November 2020 was because of growth in all new work sectors apart from public new housing and public other new work, which fell by 2.4% and 2.8% respectively.
Construction output grew by 12.4% in the three months to November 2020 compared with the previous three-month period, because of growth in both new work (11.9%) and repair and maintenance (13.2%).
Monthly Statistics of Building Materials and Components – January 2021
Bank of England Summary of Business Conditions
The Bank of England published its most recent update to the Agents’ Summary of Business
13
Conditions on 17th December 2020, covering intelligence gathered between mid-November and early December 2020.
Key points:
Activity picked up in most areas except for commercial development, with output mostly supported by infrastructure projects. Contacts reported that public sector repair and maintenance work was holding up, and demand for household repair and maintenance work was strong. This had resulted in shortages of some materials, constraining output.
Construction of private new build housing was reported to be close to normal levels, driven in part by strong consumer demand. However, contacts said they expected demand to slow in the coming months when government support measures, such as the temporary reduction in stamp duty and the current form of the Help to Buy scheme, come to an end. And construction of social housing was weaker than for private housing due to the postponement of projects.
Contacts expressed concerns about the weak pipeline of commercial projects, such as office and retail development, which could weigh on output in 2021. There was also some concern that public projects could be delayed due to budget constraints. However, there were hopes that investment in green projects would support activity further out.
Gross Domestic Product Estimate
The Office for National Statistics published their estimate of gross domestic product for November 2020 on 15th January 2021.
Key points:
GDP fell by 2.6% in November 2020, back to 8.5% below the levels seen in February 2020, following six consecutive monthly increses.
The services sector fell by 3.5% and production fell by 0.1% in November 2020, whilst construction grew by 1.9% in the same period.
Gross Domestic Product Forecast
The latest monthly Consensus Economics forecast survey (which uses an average of private sector forecasts) results were published on 11th January 2021.
Key points:
The mean GDP forecast for 2021 is 4.3% growth, down from 5.3% growth in the previous month’s survey.
The mean GDP growth forecast for 2022 is 5.8%, up from 4.8% in the previous month’s survey.
The Office for Budget Responsibility published a new Economic and Fiscal Outlook on
25th November.
Monthly Statistics of Building Materials and Components – January 2021
GDP will fall by 11.3% in 2020 in the central scenario, by 10.6% in the upside scenario and by 12.0% in the downside scenario.
Construction Output Forecasts
In January 2021, Experian published their Winter 2020/21 forecasts for the construction sector.
14
Key points:
All construction sectors are estimated to have seen a decline in output in 2020 as projects struggled to put in place Covid-19 safety protocols, especially during the first national lockdown in the second quarter of the year. However, the falls were by no means uniform, with some sectors faring relatively better than others.
Construction output is expected to fall by 16.6% in 2020 and then grow by 11.5% in 2021 and 7.6% in 2022.
Total new work is forecast to fall by 17% in 2020, and then recover by 13% in 2021 and 8% in 2022. Total housing, private industrial and private commercial sub-sectors are all forecast to fall by between 21% and 23% in 2020. Infrastructure is forecast to experience the smallest fall of the subsectors in 2020 (5%).
Repair and maintenance is forecast to fall by 15% in 2020 before recovering by 9% in 2021 and 6% in 2022.
The Construction Products Association published updated scenarios for construction in January 2021.
The CPA’s latest Construction Industry Scenarios sees a ‘W’-shaped economic recession and recovery as its main assumption, with construction output expected to rise 14% in 2021 and 4.9% in 2022. This takes account of lockdown restrictions over winter 2020/21 before a sustained recovery from 2021 Q2 as vaccines are rolled out and the services-based economy can reopen again.
With government making it clear that the construction and manufacturing sectors should continue to operate despite Covid-19 restrictions, output has been able to rise and recover relatively rapidly. The 14.0% rise in 2021 follows an estimated contraction of 14.3% overall in 2020 caused by the sharp fall in the first half of last year. Output is only expected to recover to pre-Covid levels in 2022. There is also the risk that once furlough and self-employment support schemes end in April, there may be a sharp rise in unemployment that could potentially dampen this recovery.
The CPA’s Scenarios show that private housing was one of the quickest sectors to recover in 2020, with mortgage lending and property transactions above pre-Covid levels at the end of the year. A slower recovery has been seen in the commercial sector, with store closures and low rent collection in retail and leisure as well as the shift to working from home causing uncertainty for the offices sub-sector. Homeworking has had a positive impact on the private housing RM&I sector, with households investing accumulated savings from lower daily expenditure back into homes.

Monthly Statistics of Building Materials and Components – January 2021
Manufacturing
The latest Index of Production data for November 2020 were published on 15th January 2021
15
by the Office for National Statistics.
Key points for the SIC 23.1-4/7-9 industry (includes the manufacture of bricks, tiles and other construction products):
When comparing November 2020 with November 2019, output increased by 9.5% When comparing November 2020 with October 2020, output increased by 3.1%
Key points for the SIC 23.5-6 industry (includes the manufacture of concrete, cement and other products for construction purposes):
When comparing November 2020 with November 2019, output increased by 3.6% When comparing November 2020 with October 2020, output increased by 1.7%
Monthly Statistics of Building Materials and Components – January 2021
Accompanying tables
The most recently published bulletin (available in PDF format) and accompanying data tables (available in Excel and ODS format) can be found on BEIS’ Building Materials and Components website. The list of tables in the bulletin is as follows:
16
1 Construction Material Price Indices
2 Price Indices of Construction Materials – monthly
3 Price Indices of Construction Materials – annual averages
4 Sales of Sand and Gravel in Great Britain (including seasonally adjusted sales)
5 Sales of Sand and Gravel by English Regions, Wales and Scotland
6 Sales of Sand and Gravel by English and Welsh Counties and Scottish Region
7 Slate: Production, Deliveries and Stocks
8 Cement and Clinker: Production, Deliveries and Stocks
9 Bricks: Production, Deliveries and Stocks for Great Britain (including seasonally adjusted deliveries)
10 Bricks: Production, Deliveries and Stocks by English Regions, Wales and Scotland (including seasonally adjusted deliveries)
11 Concrete Building Blocks: Production, Deliveries and Stocks for Great Britain
12 Concrete Building Blocks: Production, Deliveries and Stocks by English Regions, Wales and Scotland
13 Concrete Roofing Tiles and Ready-Mixed Concrete (including seasonally adjusted sales of ready-mixed concrete)
14 Value of Overseas Trade in Selected Materials and Components for Constructional Use: Imports (CIF) and Exports (FOB)
15 Value of EU and Non-EU Trade in Selected Materials and Components for Constructional Use: Imports (CIF) and Exports (FOB)
Accompanying tables with data relating to 2011 are accessible from this link.
Accompanying tables for 2005 - 2010 are accessible from this link.
Requests for older data should be sent to [email protected].

Monthly Statistics of Building Materials and Components – January 2021
Technical information
1. The Office of National Statistics (ONS) replaced the following price indices for construction
materials from the November 2020 release of this publication (published on 4th December
2020) onwards; Sand & Gravel excluding/including levy, Crushed rock excluding/including
levy, and Bituminous materials. This affects Tables 1, 2 and 3 in the bulletin and Table 1 in
the commentary. Further information is provided in the footnotes of each table. A back
series of both the previous and replacement indices was published alongside the
November 2020 release of this publication.
2. In work done for the Department for Business, Innovation and Skills (BIS) on improving the
quality of statistics published in the Monthly Statistics of Building Materials and
Components, the Office for National Statistics’ Methodology Advisory Service (MAS)
recommended that BIS should start seasonally adjusting key data series (see ONS/MAS
17
review of building materials statistics: final report for more detail). Seasonal adjustment is
widely used in official statistics and aids data interpretation by removing effects associated
with the time of the year or arrangement of the calendar. Seasonal effects frequently
obscure features of interest in data, such as long-term trends and the effects of unusual
occurrences. By removing seasonal effects, users can more readily identify the features of
interest.
Following advice from the MAS, and the results of a consultation (see the results of the BIS consultation on seasonal adjustment for more detail), BIS agreed to publish seasonally adjusted data for the following series:
Sand and gravel, total sales Concrete blocks, all types deliveries Bricks, all types deliveries Ready-mixed concrete, deliveries
For the initial publication of seasonally adjusted data, data from 1983 onwards will be seasonally adjusted. Subsequently, for each monthly publication, data up to 12 months or 4 quarters previous to the new data point will be revised. Upon the completion of each year’s data series, data for the previous 12 years will be revised. BEIS will publish both non-seasonally adjusted and seasonally adjusted data in the tables of this publication. From the June 2015 edition this publication will only use seasonally adjusted data in the commentary for these series.
3. Quality issues related to the Building Materials and Components outputs are discussed in the review of the Building Material statistics that was carried out in 2010 by BIS’s construction team. The review aimed to ascertain user needs, examine whether existing data collection methodologies are fit for purpose, estimate compliance costs, assess compliance with the Code of Practice and identify options for change.
The full report can be found on the BEIS Building Materials and Components webpage.
Detailed information on data suppliers, coverage and data collection methodology can be found in sections 2.1-2.10. Quality issues (coverage and accuracy of sample panels,

Monthly Statistics of Building Materials and Components – January 2021
response rates, survey results processing, disclosure etc.) and potential measures that could be employed to improve the quality of the statistics are discussed in section 2.11 of the review. Users’ views on the quality of the Building Materials and Components statistics are given in section 3.3.4. These are derived from a user survey carried out in early 2010, as part of the review (see section 3 for details).
4. Following the review, BIS acted on the recommendations including commissioning the Office for National Statistics Methodology Advisory Service (ONS/MAS) to address some of the recommendations from the 2010 review. In July 2011, MAS published their interim report.
18
In July 2012, MAS published their final report.
5. HM Revenue and Customs use administrative sources to produce Overseas Trade Statistics. A Statement of Administrative Sources used to compile construction material trade statistics is available on the BEIS Building Materials and Components webpage:
Separately, HM Revenue and Customs also have a Statement of Administrative Sources which covers Overseas Trade Statistics.
6. The pre-announcement of any major changes to samples or methodology also details some methodological changes to the collection of data.
7. The following table gives a summary of response rates related to some of the latest survey results. Where the response rate is less than 100%, estimates are made for missing values.
For latest data used Bulletin table number Response rate
Quarterly Sand and Gravel 4, 5 & 6 60%Quarterly Sand and Gravel – Land Won 4, 5 & 6 56%Quarterly Sand and Gravel – Marine Dredged 4, 5 & 6 84%
Quarterly Slate 7 100%
Quarterly Concrete Roofing Tiles 13 100%
Monthly Bricks Provisional data 9 100%
Monthly Bricks Final data 9 & 10 100%Monthly Concrete Blocks 11 & 12 90%

Monthly Statistics of Building Materials and Components – January 2021
Definitions
Further information
Future updates to these statistics
The next publication in this series will be on 3rd February 2021.
Related statistics
1. Construction Statistics: Sources and Outputs lists the known sources of information available
19
on the construction industry and their outputs. These include information on employees, employment, enterprises, output and new orders in the construction industry as well as the contribution of the industry to the economy. Related information, for example housing, is also included.
2. The Construction Statistics Annual brings together a wide range of statistics currently available on the construction industry from a variety of sources and provides a broad perspective on statistical trends in the construction industry, with some international comparisons.
3. In its monthly Index of Production (IoP) publication, the Office for National Statistics
Production Products completed and ready for dispatch
publishes Gross Value Added (seasonally adjusted, UK) data for the following two industries:
SIC 23.1-4/7-9 industry, which includes the manufacture of bricks, tiles and other construction products.
SIC 23.5-6 industry, which includes the manufacture of concrete, cement and other products for construction purposes.
Deliveries Sold products which have left the premises
Stocks Manufacturer’s stocks
CIF Cost, insurance and freight (for more information on shipping terms, visit the HMRC website)
FOB Free on-board (for more information on shipping terms, visit the HMRC website)
Sand and gravel -
land won
Sand and gravel from pits and quarries, including that derived from beaches and rivers
Sand and gravel -
marine dredged
Sand and gravel derived from seas and estuaries

Monthly Statistics of Building Materials and Components – January 2021
These data are not directly comparable with the data in this bulletin, due to differences in coverage and methodology. They are nevertheless useful in illustrating the latest output trends of related construction materials as measured by the Office for National Statistics.
Revisions policy
1. Our revisions policy can be found on the BEIS Building Materials webpage.
20
2. The pre-announcement of any major changes to samples or methodology and Summary of Revisions give further information on revisions and other changes to data and can also be found on the BEIS Building Materials webpage.
Uses of these statistics
The Building Materials and Components statistics are used for a variety of purposes, including policy development and evaluation concerning the construction products industry, as well as monitoring market trends. In a wider context, the figures are regularly reported in the construction press to facilitate market analysis and business planning for its wide range of readers. The statistics are also increasingly used by financial institutions for assessing market information and industry trends. For more information on the uses of the Building Materials statistics, their usefulness to users and users’ views on the quality of these statistics, see Section 3 of the Building Materials and Components review.
User engagement
Users are encouraged to provide comments and feedback on how these statistics are used and how well they meet user needs. Comments on any issues relating to this statistical release are welcomed and should be sent to: [email protected]
The Consultative Committee on Construction Industry Statistics (CCCIS) meets twice a year, chaired by BEIS, to discuss issues relating to the collection and dissemination of UK construction statistics. The CCCIS has a wide membership representing government, the construction industry and independent analysts. Minutes of previous CCCIS meetings are available from the BEIS building materials web page.
The BEIS statement on statistical public engagement and data standards sets out the department’s commitments on public engagement and data standards as outlined by the Code of Practice for Statistics.
National Statistics designation
National Statistics status means that our statistics meet the highest standards of trustworthiness, quality and public value, and it is our responsibility to maintain compliance with these standards.
The statistics last underwent a full assessment against the Code of Practice for Statistics in 2011.

Monthly Statistics of Building Materials and Components – January 2021
o changed the survey from sample survey to a census, increasing the panel from
200 sites to around 500 sites
Since the latest review by the Office for Statistics Regulation, we have continued to comply with the Code of Practice for Statistics, and have made the following improvements:
carried out a public consultation and introduced publication of seasonally adjusted data
21
on deliveries of sand and gravel, concrete blocks, bricks, and ready-mixed concrete
in response to the cessation of MHCLG’s Annual Minerals Raised Inquiry, which
previously supplied the sampling frame for the land-won sand and gravel survey, we
have:
o refreshed the panel of sites annually using information from the British Geological
Survey
o made the survey statutory under the Statistics of Trade Act 1947, bringing it into
line with the marine-dredged sand and gravel survey
improved the design of the blocks survey, making it fully monthly instead of a mixture of
monthly and quarterly data collection
introduced the publication of the tables in an OpenDocument (ODS) spreadsheet, in
addition to Microsoft Excel and PDF
rebased all price indices series to 2015=100 in the November 2020 publication
Contact
Responsible statistician: Amy Symes-Thompson
Email: [email protected]
Media enquiries: 020 7215 1000
Public enquiries: +44 (0)207 215 6498

© Crown copyright 2021
This publication is licensed under the terms of the Open Government Licence v3.0 except where otherwise stated. To view this licence, visit nationalarchives.gov.uk/doc/open-government-licence/version/3 or write to the Information Policy Team, The National Archives, Kew, London TW9 4DU, or email: [email protected].
Where we have identified any third-party copyright information you will need to obtain permission from the copyright holders concerned.
This publication is available from: https://www.gov.uk/government/collections/building-materials-and-components-monthly-statistics-2012
If you need a version of this document in a more accessible format, please email [email protected]. Please tell us what format you need. It will help us if you say what assistive technology you use.