building effective partnerships for urban air quality ... the air quality management community in...
TRANSCRIPT
Strengthening the air quality management community in Asiawww.cleanairnet.org/caiasia
Building Effective Partnerships for Urban Air Quality Management in Asia
Sustainable Urban Mobility in AsiaA CAI-Asia Program
Cornie HuizengaHead of Secretariat, CAI-Asia
California Air Resources Board23 June 2006
Strengthening the air quality management community in Asiawww.cleanairnet.org/caiasia
Outline
• Urban Air Quality in Asia: – Drivers– Pressure– State– Impact– Response
• What or who is CAI-Asia?• Short history of the organization and key
outputs
Strengthening the air quality management community in Asiawww.cleanairnet.org/caiasia
Part 1: Urban Air Quality in Asia
Strengthening the air quality management community in Asiawww.cleanairnet.org/caiasia
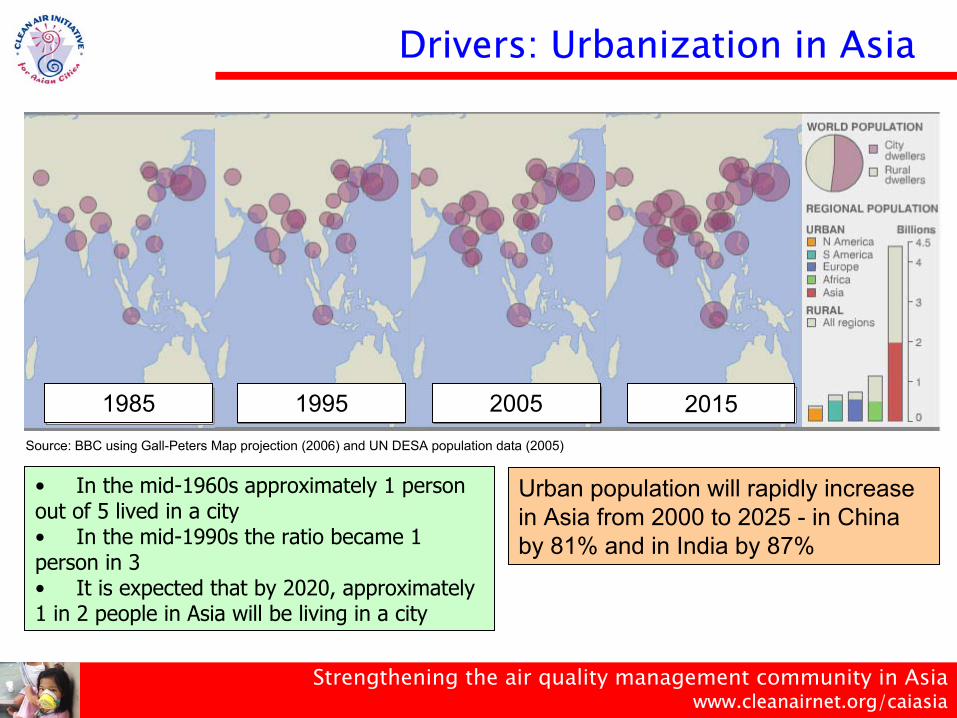
Drivers: Urbanization in Asia
Source: BBC using Gall-Peters Map projection (2006) and UN DESA population data (2005)
1985 1995 2005 2015
• In the mid-1960s approximately 1 person out of 5 lived in a city• In the mid-1990s the ratio became 1 person in 3• It is expected that by 2020, approximately 1 in 2 people in Asia will be living in a city
Urban population will rapidly increase in Asia from 2000 to 2025 - in China by 81% and in India by 87%
Strengthening the air quality management community in Asiawww.cleanairnet.org/caiasia
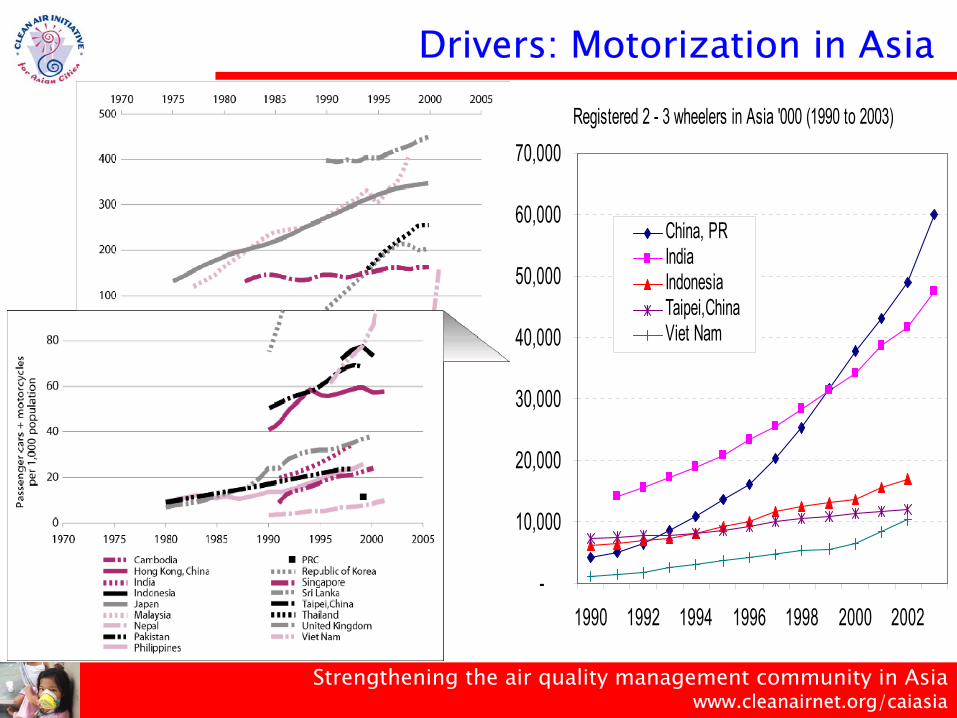
Drivers: Motorization in AsiaRegistered 2 - 3 wheelers in Asia '000 (1990 to 2003)
-
10,000
20,000
30,000
40,000
50,000
60,000
70,000
1990 1992 1994 1996 1998 2000 2002
China, PRIndiaIndonesiaTaipei,ChinaViet Nam
Strengthening the air quality management community in Asiawww.cleanairnet.org/caiasia
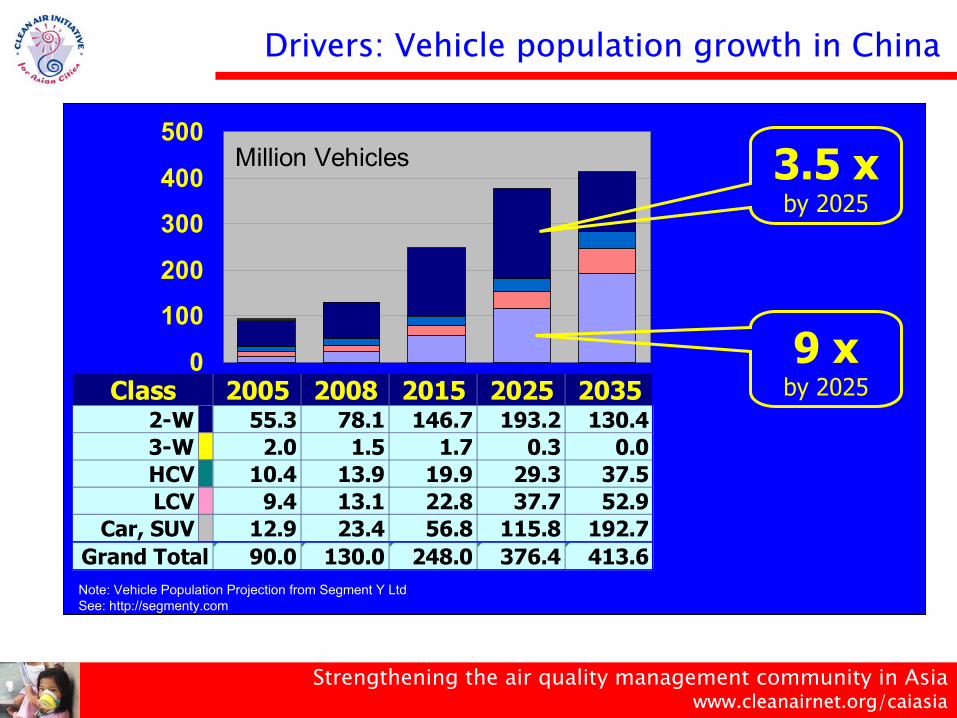
Drivers: Vehicle population growth in China
2005 2008 2015 2025 20352-W 55.3 78.1 146.7 193.2 130.43-W 2.0 1.5 1.7 0.3 0.0HCV 10.4 13.9 19.9 29.3 37.5LCV 9.4 13.1 22.8 37.7 52.9
Car, SUV 12.9 23.4 56.8 115.8 192.790.0 130.0 248.0 376.4 413.6
Class
Grand Total
0
100
200
300
400
500Million Vehicles
Note: Vehicle Population Projection from Segment Y LtdSee: http://segmenty.com
9 xby 2025
3.5 xby 2025
Strengthening the air quality management community in Asiawww.cleanairnet.org/caiasia
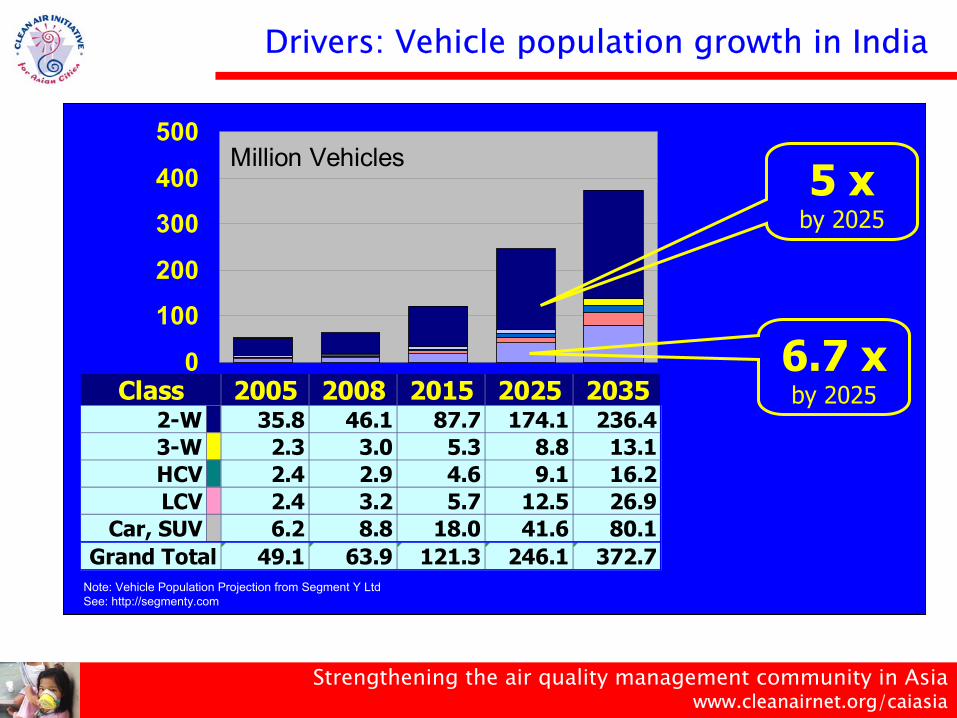
Drivers: Vehicle population growth in India
2005 2008 2015 2025 20352-W 35.8 46.1 87.7 174.1 236.43-W 2.3 3.0 5.3 8.8 13.1HCV 2.4 2.9 4.6 9.1 16.2LCV 2.4 3.2 5.7 12.5 26.9
Car, SUV 6.2 8.8 18.0 41.6 80.149.1 63.9 121.3 246.1 372.7
Class
Grand Total
0
100
200
300
400
500Million Vehicles
Note: Vehicle Population Projection from Segment Y LtdSee: http://segmenty.com
6.7 xby 2025
5 xby 2025

Strengthening the air quality management community in Asiawww.cleanairnet.org/caiasia
Drivers: Motorcycles in Asia
0
50
100
150
200
250
2005 2008 2015 2025 2035
mill
ions
India China Thailand
Note: The forecasts used in Figures 2 and 3 were developed by Segment Y Ltd
• Asia is different from Europe, USA and Japan – India, China and Thailand:–2005: 100 million–2008: 140 million– 2015: 250 million
• When will the tipping point be reached after which people switch to cars: China 2025?
• Motor cycles now breaking into new markets e.g. Philippines
• 2-3 wheelers play an important role in transit in Asia, e.g. –Tricycles in Philippines–Rickshaws in South Asia–Tuk-tuk in Thailand
Strengthening the air quality management community in Asiawww.cleanairnet.org/caiasia
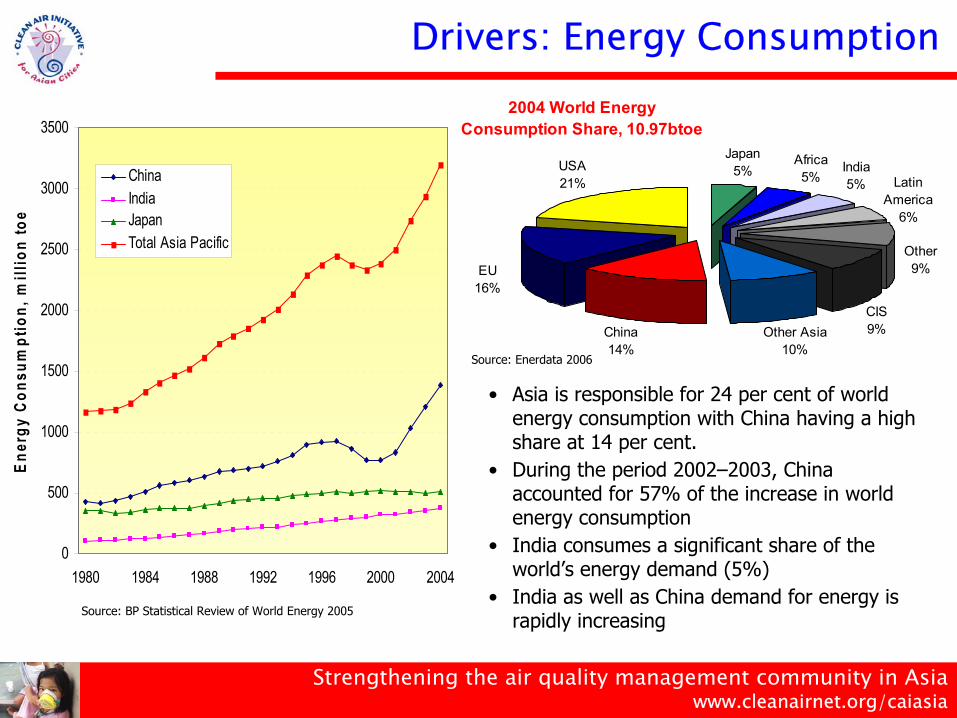
Drivers: Energy Consumption
Source: BP Statistical Review of World Energy 2005
• Asia is responsible for 24 per cent of world energy consumption with China having a high share at 14 per cent.
• During the period 2002–2003, China accounted for 57% of the increase in world energy consumption
• India consumes a significant share of the world’s energy demand (5%)
• India as well as China demand for energy is rapidly increasing
0
500
1000
1500
2000
2500
3000
3500
1980 1984 1988 1992 1996 2000 2004
Ener
gy C
onsu
mpt
ion,
mill
ion
toe
ChinaIndiaJapanTotal Asia Pacific
2004 World Energy Consumption Share, 10.97btoe
Japan5%
Africa5%
India5%
China14%
USA21% Latin
America6%
EU16%
Other Asia10%
CIS9%
Other9%
Source: Enerdata 2006
Strengthening the air quality management community in Asiawww.cleanairnet.org/caiasia
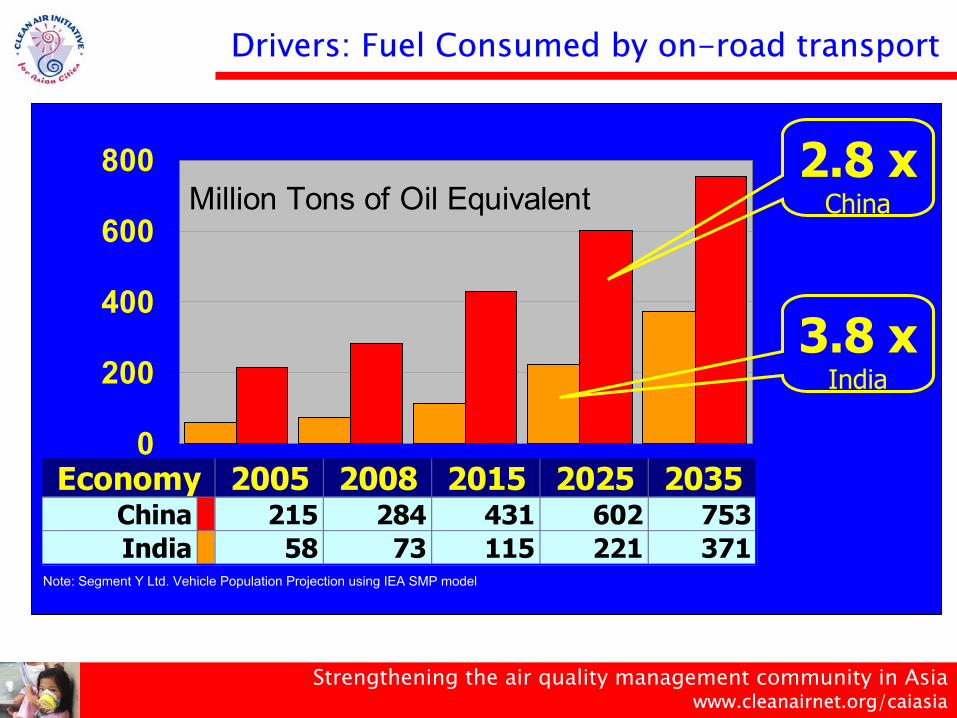
Drivers: Fuel Consumed by on-road transport
2005 2008 2015 2025 2035China 215 284 431 602 753India 58 73 115 221 371
Economy0
200
400
600
800Million Tons of Oil Equivalent
3.8 xIndia
2.8 xChina
Note: Segment Y Ltd. Vehicle Population Projection using IEA SMP model
Strengthening the air quality management community in Asiawww.cleanairnet.org/caiasia
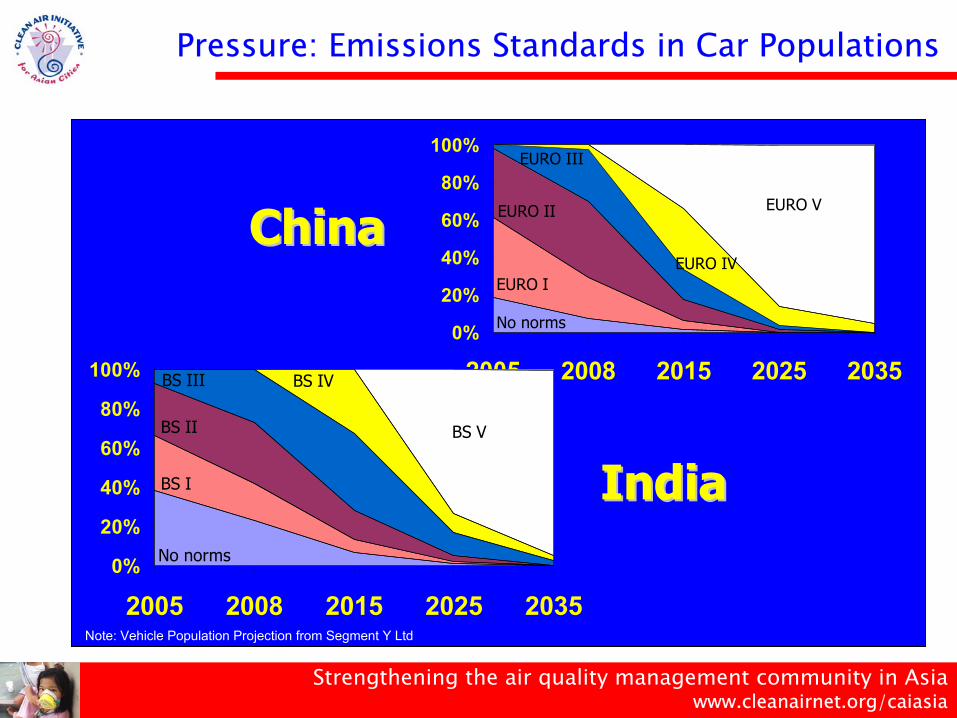
Pressure: Emissions Standards in Car Populations
0%
20%
40%
60%
80%
100%
2005 2008 2015 2025 2035
EURO V
EURO IV
EURO III
EURO II
EURO I
No norms
0%
20%
40%
60%
80%
100%
2005 2008 2015 2025 2035
BS V
BS IVBS III
BS II
BS I
No norms
IndiaIndia
ChinaChina
Note: Vehicle Population Projection from Segment Y Ltd
Strengthening the air quality management community in Asiawww.cleanairnet.org/caiasia
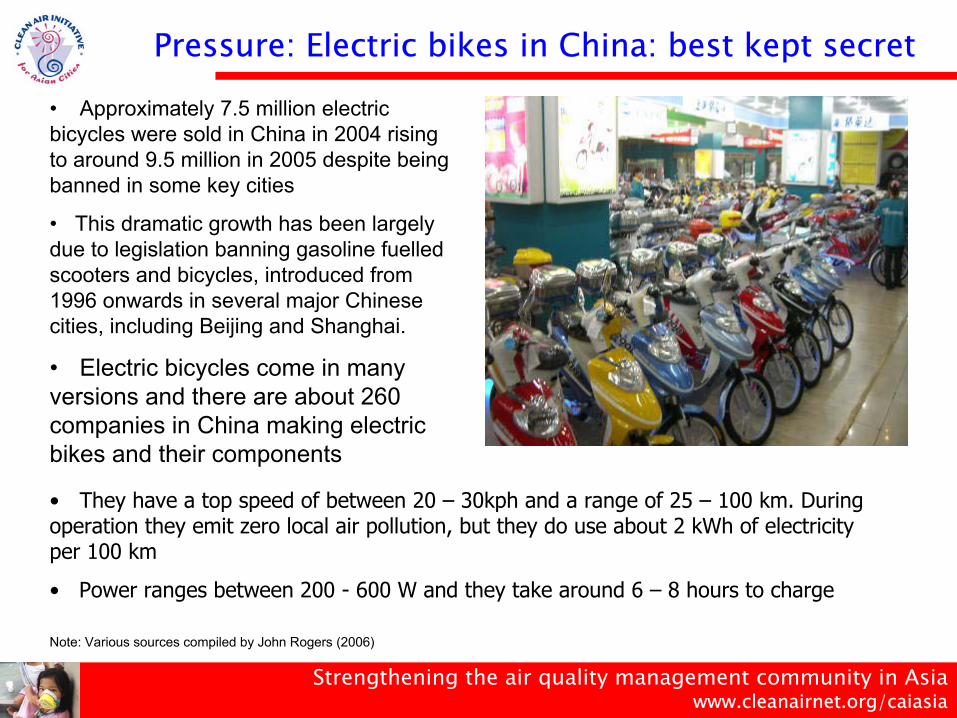
Pressure: Electric bikes in China: best kept secret
• Approximately 7.5 million electric bicycles were sold in China in 2004 rising to around 9.5 million in 2005 despite being banned in some key cities
• This dramatic growth has been largely due to legislation banning gasoline fuelled scooters and bicycles, introduced from 1996 onwards in several major Chinese cities, including Beijing and Shanghai.
• Electric bicycles come in many versions and there are about 260 companies in China making electric bikes and their components
• They have a top speed of between 20 – 30kph and a range of 25 – 100 km. During operation they emit zero local air pollution, but they do use about 2 kWh of electricity per 100 km
• Power ranges between 200 - 600 W and they take around 6 – 8 hours to charge
Note: Various sources compiled by John Rogers (2006)
Strengthening the air quality management community in Asiawww.cleanairnet.org/caiasia
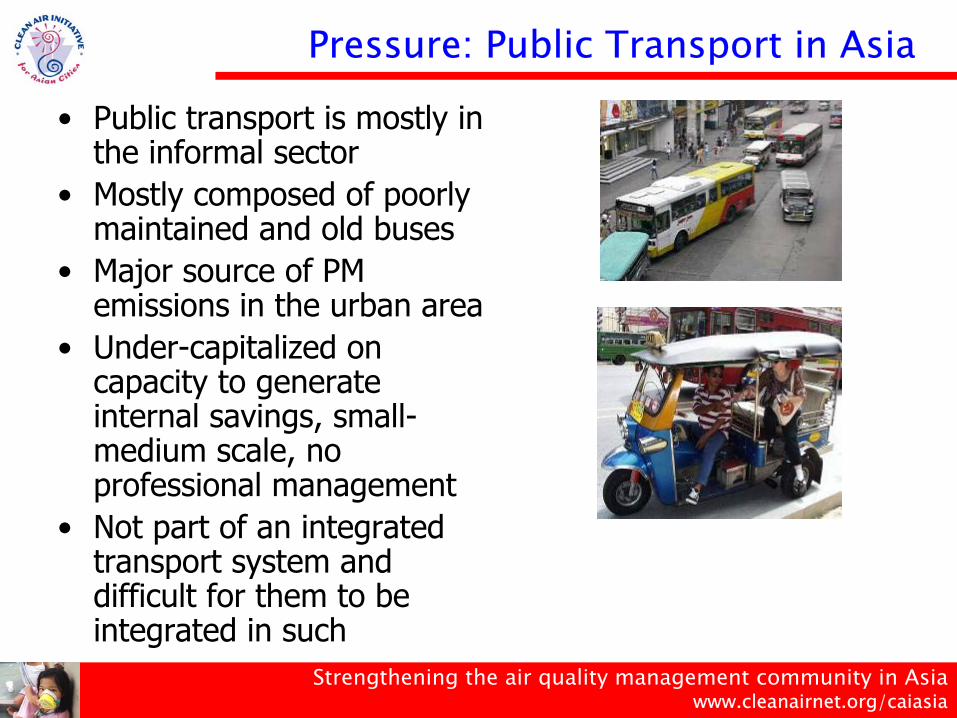
Pressure: Public Transport in Asia
• Public transport is mostly in the informal sector
• Mostly composed of poorly maintained and old buses
• Major source of PM emissions in the urban area
• Under-capitalized on capacity to generate internal savings, small-medium scale, no professional management
• Not part of an integrated transport system and difficult for them to be integrated in such
Strengthening the air quality management community in Asiawww.cleanairnet.org/caiasia
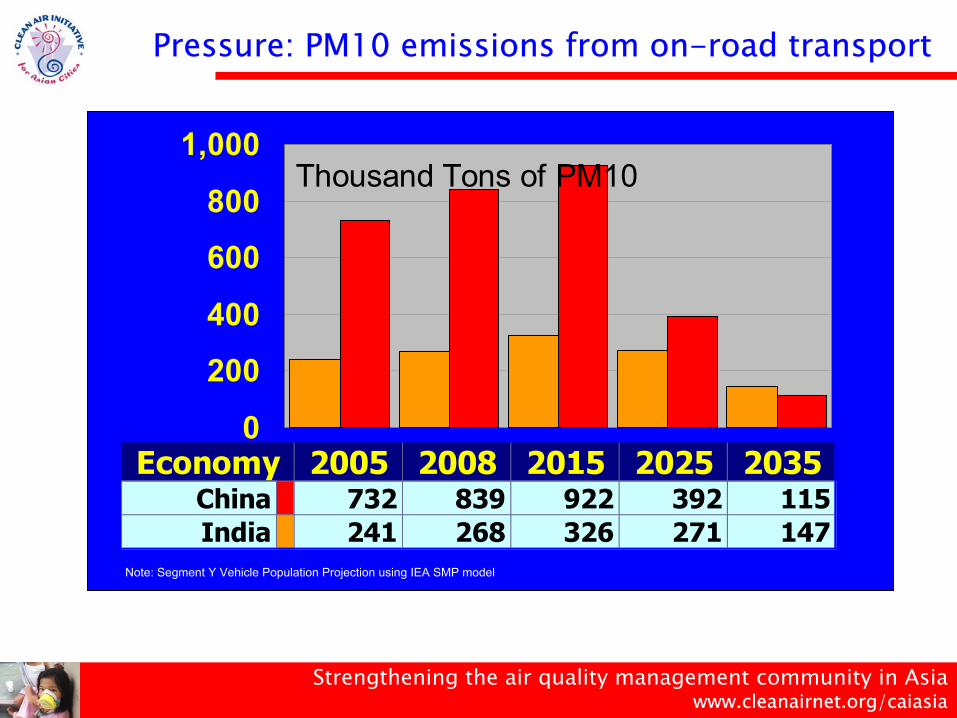
Pressure: PM10 emissions from on-road transport
2005 2008 2015 2025 2035China 732 839 922 392 115India 241 268 326 271 147
Economy0
200
400
600
800
1,000Thousand Tons of PM10
Note: Segment Y Vehicle Population Projection using IEA SMP model
Strengthening the air quality management community in Asiawww.cleanairnet.org/caiasia
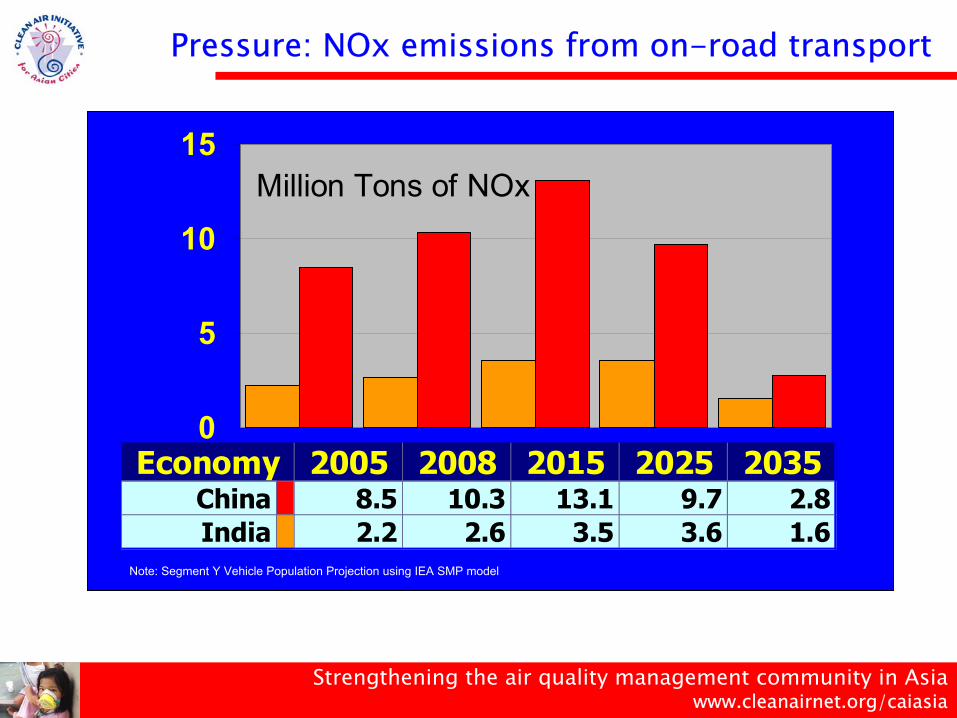
Pressure: NOx emissions from on-road transport
2005 2008 2015 2025 2035China 8.5 10.3 13.1 9.7 2.8India 2.2 2.6 3.5 3.6 1.6
Economy0
5
10
15Million Tons of NOx
Note: Segment Y Vehicle Population Projection using IEA SMP model
Strengthening the air quality management community in Asiawww.cleanairnet.org/caiasia
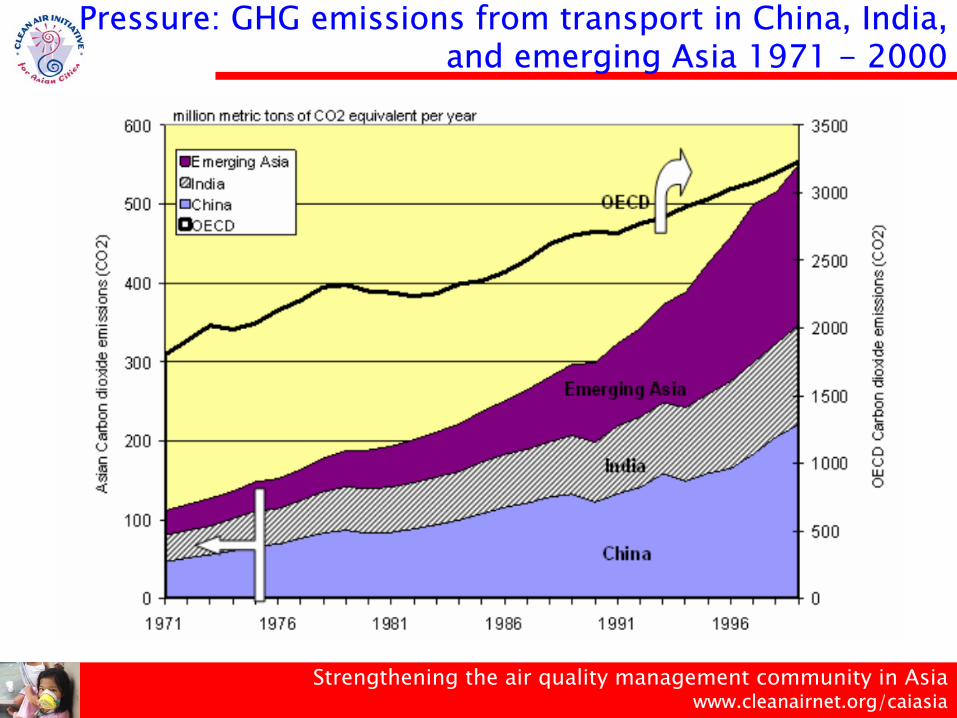
Pressure: GHG emissions from transport in China, India, and emerging Asia 1971 - 2000
Strengthening the air quality management community in Asiawww.cleanairnet.org/caiasia
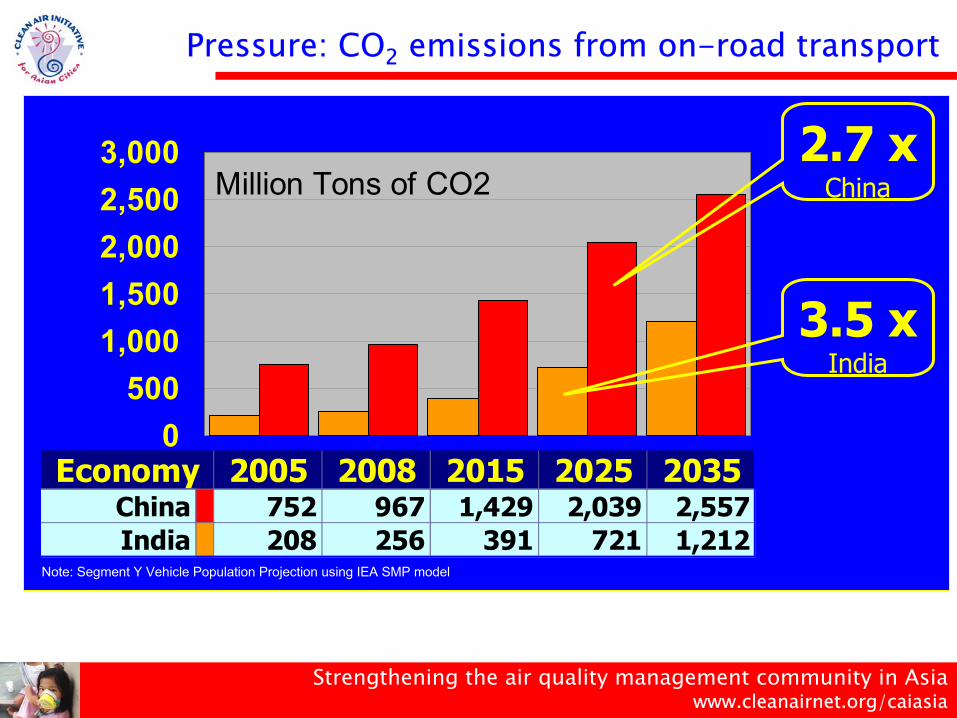
Pressure: CO2 emissions from on-road transport
2005 2008 2015 2025 2035China 752 967 1,429 2,039 2,557India 208 256 391 721 1,212
Economy0
5001,0001,5002,0002,5003,000
Million Tons of CO2
3.5 xIndia
2.7 xChina
Note: Segment Y Vehicle Population Projection using IEA SMP model
Strengthening the air quality management community in Asiawww.cleanairnet.org/caiasia
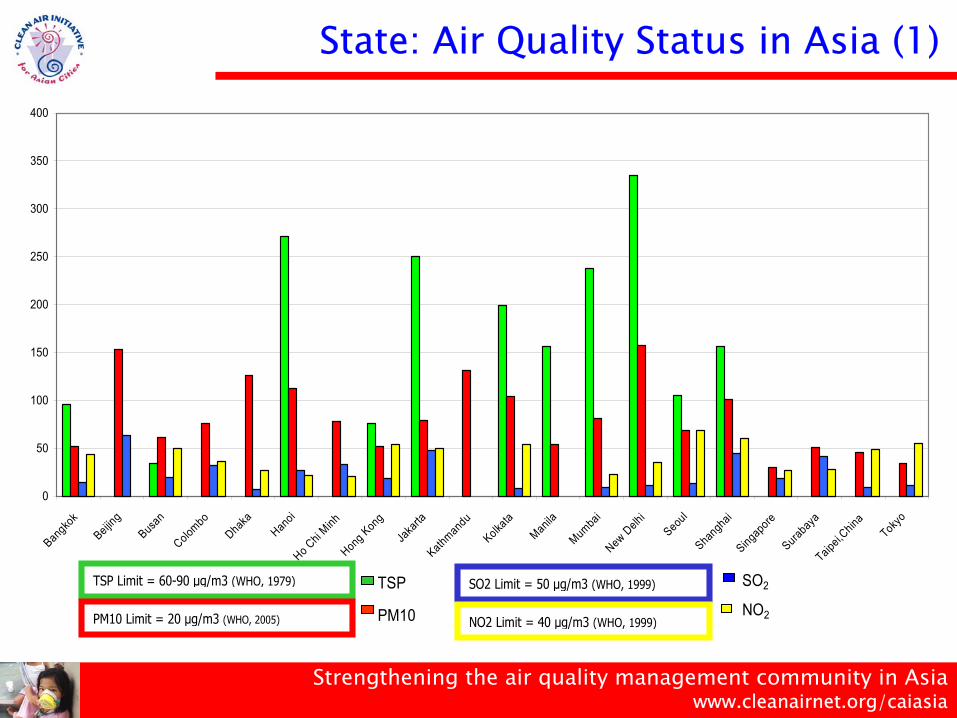
State: Air Quality Status in Asia (1)
0
50
100
150
200
250
300
350
400
Bangko
k
Beijing
Busan
Colombo
Dhaka
Hanoi
Ho Chi Minh
Hong Kon
g
Jaka
rtaKathm
andu
Kolkata
Manila
Mumbai
New Delhi
Seoul
Shangh
aiSingapo
reSurab
ayaTaipe
i,China
Tokyo
SO2
NO2
TSP
PM10
TSP Limit = 60-90 µg/m3 (WHO, 1979)
PM10 Limit = 20 µg/m3 (WHO, 2005)
SO2 Limit = 50 µg/m3 (WHO, 1999)
NO2 Limit = 40 µg/m3 (WHO, 1999)
Strengthening the air quality management community in Asiawww.cleanairnet.org/caiasia
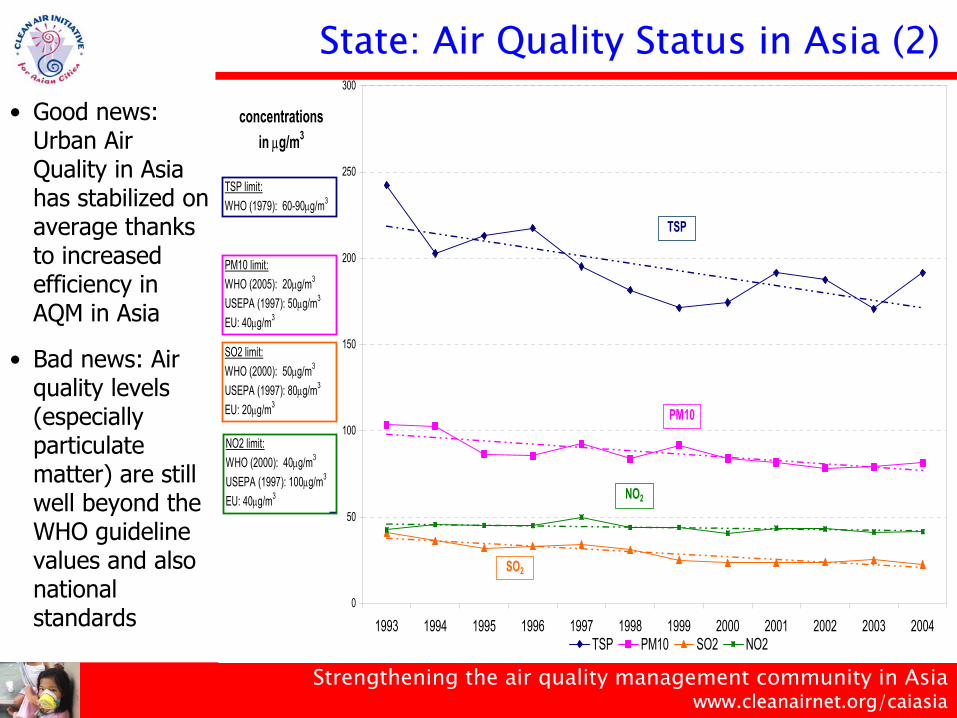
• Good news: Urban Air Quality in Asia has stabilized on average thanks to increased efficiency in AQM in Asia
• Bad news: Air quality levels (especially particulate matter) are still well beyond the WHO guideline values and also national standards
0
50
100
150
200
250
300
1993 1994 1995 1996 1997 1998 1999 2000 2001 2002 2003 2004
concentrations in µg/m3
TSP PM10 SO2 NO2
TSP limit:WHO (1979): 60-90µg/m3
PM10 limit:WHO (2005): 20µg/m3
USEPA (1997): 50µg/m3
EU: 40µg/m3
SO2 limit:WHO (2000): 50µg/m3
USEPA (1997): 80µg/m3
EU: 20µg/m3
NO2 limit:WHO (2000): 40µg/m3
USEPA (1997): 100µg/m3
EU: 40µg/m3
TSP
PM10
NO2
SO2
State: Air Quality Status in Asia (2)
Strengthening the air quality management community in Asiawww.cleanairnet.org/caiasia
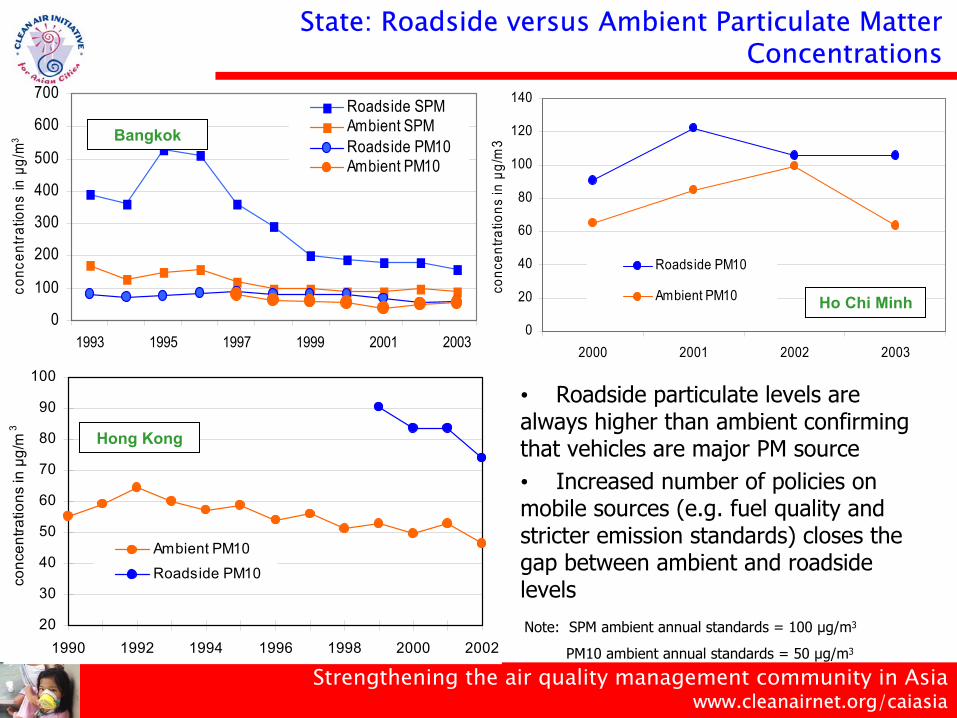
Note: SPM ambient annual standards = 100 µg/m3
PM10 ambient annual standards = 50 µg/m3
0
100
200
300
400
500
600
700
1993 1995 1997 1999 2001 2003
conc
entra
tions
in µ
g/m
3
Roadside SPMAmbient SPMRoadside PM10Ambient PM10
20
30
40
50
60
70
80
90
100
1990 1992 1994 1996 1998 2000 2002
conc
entra
tions
in µ
g/m
3
Ambient PM10
Roadside PM10
0
20
40
60
80
100
120
140
2000 2001 2002 2003
conc
entra
tions
in µ
g/m
3
Roadside PM10
Ambient PM10
Hong Kong
Bangkok
Ho Chi Minh
• Roadside particulate levels are always higher than ambient confirming that vehicles are major PM source• Increased number of policies on mobile sources (e.g. fuel quality and stricter emission standards) closes the gap between ambient and roadside levels
State: Roadside versus Ambient Particulate Matter Concentrations
Strengthening the air quality management community in Asiawww.cleanairnet.org/caiasia
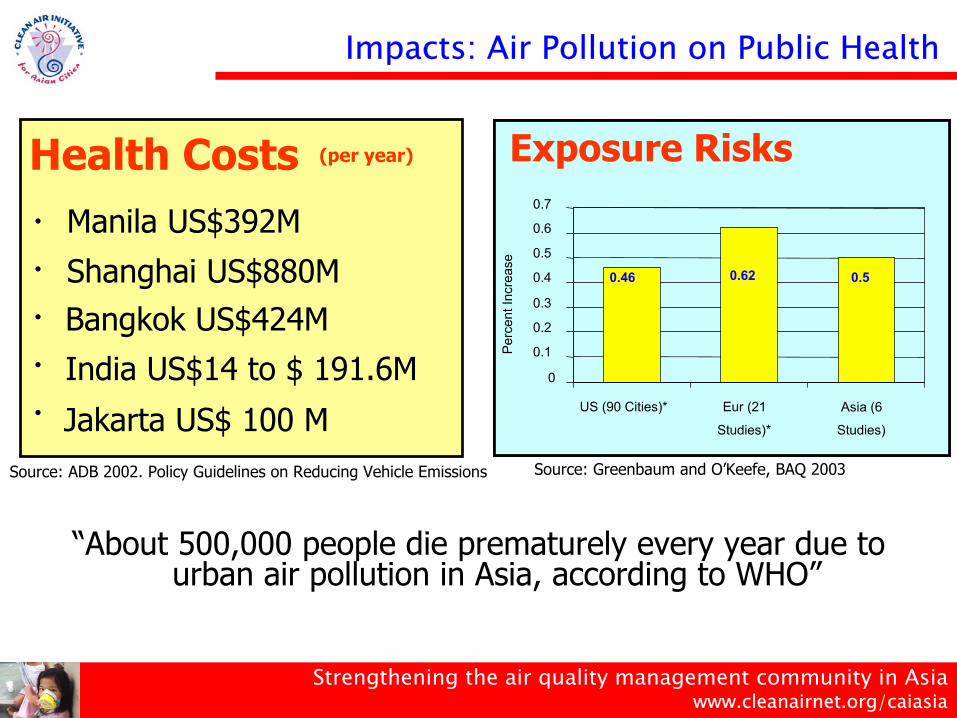
Impacts: Air Pollution on Public Health
“About 500,000 people die prematurely every year due to urban air pollution in Asia, according to WHO”
Exposure Risks
0.46 0.62 0.5
00.10.20.30.40.50.60.7
US (90 Cities)* Eur (21Studies)*
Asia (6Studies)
Perc
ent I
ncre
ase
Exposure Risks
0.46 0.62 0.5
0
0.1
0.2
0.3
0.4
0.5
0.6
0.7
US (90 Cities)* Eur (21
Studies)*
Asia (6
Studies)
Perc
ent I
ncre
ase
Source: Greenbaum and O’Keefe, BAQ 2003
•Manila US$392M
•Shanghai US$880M
•Bangkok US$424M
•India US$14 to $ 191.6M
•Jakarta US$ 100 M
Health Costs (per year)• Manila US$392M
• Shanghai US$880M• Bangkok US$424M• India US$14 to $ 191.6M• Jakarta US$ 100 M
Health Costs (per year)
Source: ADB 2002. Policy Guidelines on Reducing Vehicle Emissions
Strengthening the air quality management community in Asiawww.cleanairnet.org/caiasia
Impacts: Air Pollution on Agriculture
• Globally soybean is the 4th most important crop and is adversely affected by ozone at 40ppb
• A change from 30 ppb to 60 ppb decreases yield by 16%
• Ozone concentrations (1990 levels) in China, Japan and Korea caused the loss of 1% to 9% in annual yield of wheat, rice and corn and 23% to 27% annual yield loss of soybeans
• In 2020, grain loss due to ozone is projected as 2% to 16% for wheat, rice and corn and 28-35% for soybeans

Strengthening the air quality management community in Asiawww.cleanairnet.org/caiasia
Impacts: Air Pollution on Economy
• Economic evaluation of air pollution in Dhaka City (2003) states that cost totals to about Taka 124 billion = 3-4 % of national GDP
• 2002 Pakistan study estimated that approximately 16.28 million people which could be directly associated with economic cost of Rs.25.7 billion a year on account of health
• Average property damage due to urban air pollution in Colombo is Rs.12677 (US$ 126) per household per year (2004 estimate)
• Associated agriculture loss due to air pollution in 1990 -US$3.5 billion in China, $1.2B in Japan and $0.24B for Korea.
• Compliance with ozone standards would increase annual grain revenues by US$2.6-27 billion in China
Strengthening the air quality management community in Asiawww.cleanairnet.org/caiasia
Impacts: Air Pollution on Climate (1)
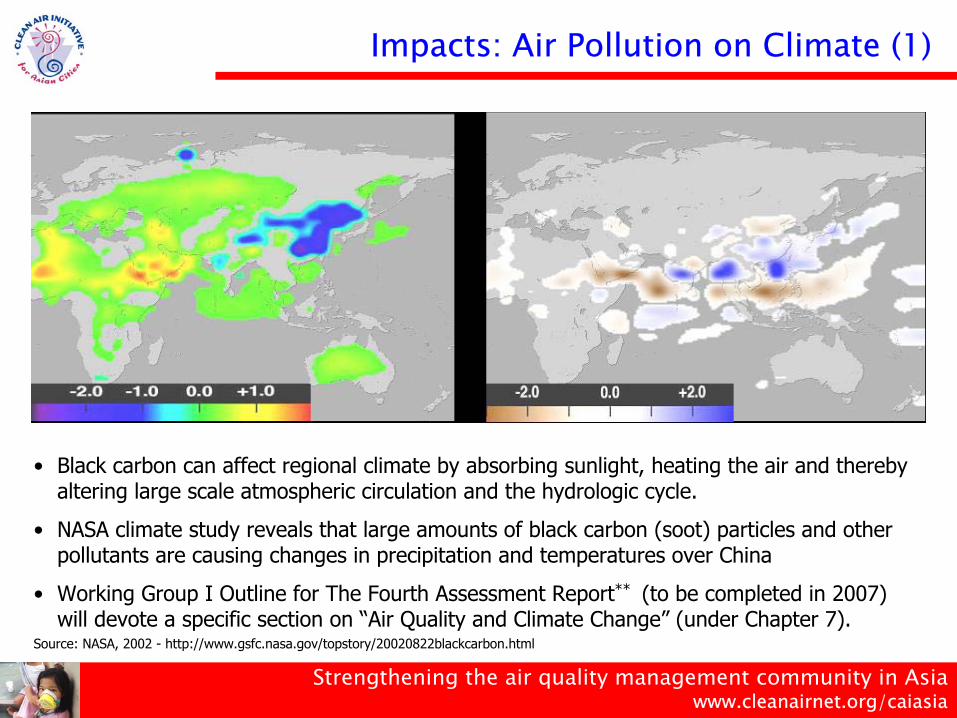
Soot changes ground temperatures in Asia(in degrees Celsius)
Soot intensifies floods and droughts in Asia(in inches rainfall)
Source: NASA, 2002 - http://www.gsfc.nasa.gov/topstory/20020822blackcarbon.html
• Black carbon can affect regional climate by absorbing sunlight, heating the air and thereby altering large scale atmospheric circulation and the hydrologic cycle.
• NASA climate study reveals that large amounts of black carbon (soot) particles and other pollutants are causing changes in precipitation and temperatures over China
• Working Group I Outline for The Fourth Assessment Report** (to be completed in 2007) will devote a specific section on “Air Quality and Climate Change” (under Chapter 7).
Strengthening the air quality management community in Asiawww.cleanairnet.org/caiasia
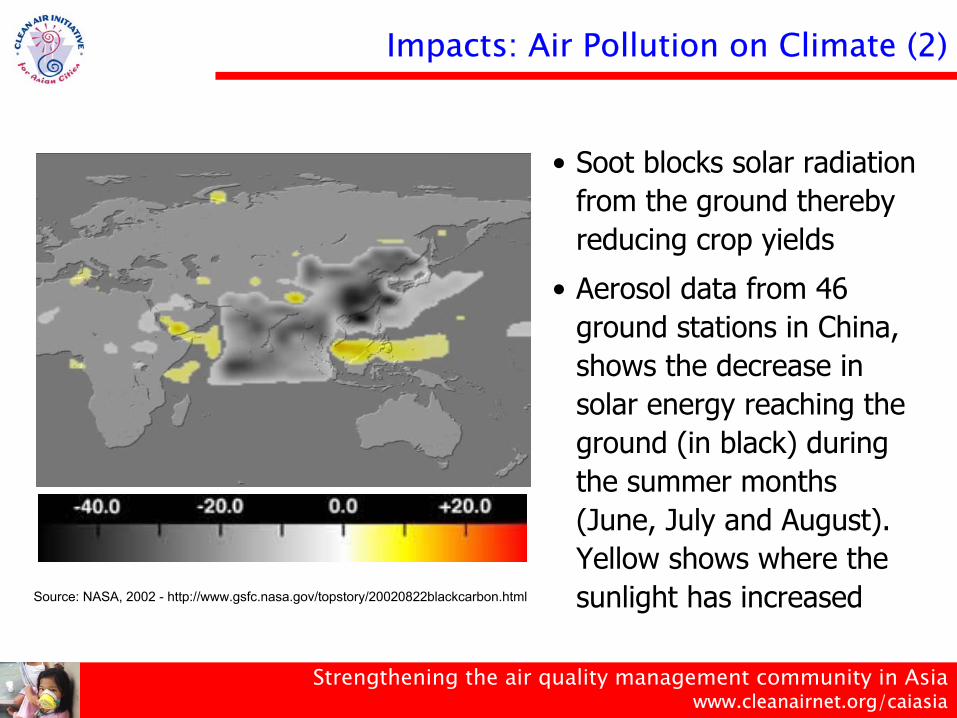
Source: NASA, 2002 - http://www.gsfc.nasa.gov/topstory/20020822blackcarbon.html
Impacts: Air Pollution on Climate (2)
• Soot blocks solar radiation from the ground thereby reducing crop yields
• Aerosol data from 46 ground stations in China, shows the decrease in solar energy reaching the ground (in black) during the summer months (June, July and August). Yellow shows where the sunlight has increased
Strengthening the air quality management community in Asiawww.cleanairnet.org/caiasia
Response: Ambient Air Quality Standards in AsiaRemarksPollutantsCountry
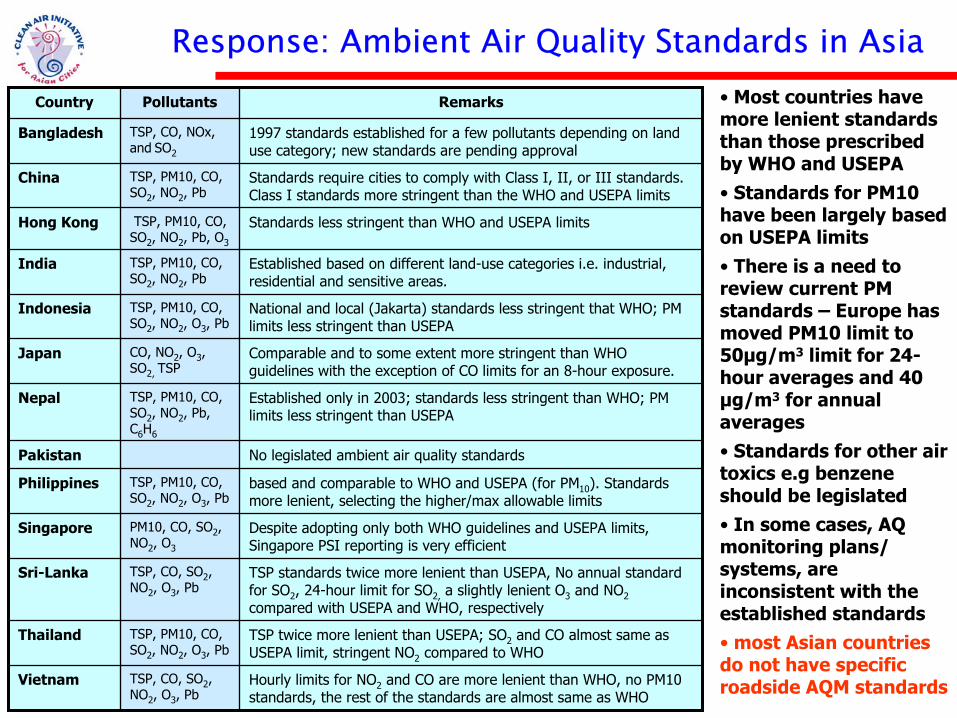
Hourly limits for NO2 and CO are more lenient than WHO, no PM10 standards, the rest of the standards are almost same as WHO
TSP, CO, SO2, NO2, O3, Pb
Vietnam
TSP twice more lenient than USEPA; SO2 and CO almost same as USEPA limit, stringent NO2 compared to WHO
TSP, PM10, CO, SO2, NO2, O3, Pb
Thailand
TSP standards twice more lenient than USEPA, No annual standard for SO2, 24-hour limit for SO2, a slightly lenient O3 and NO2compared with USEPA and WHO, respectively
TSP, CO, SO2, NO2, O3, Pb
Sri-Lanka
Despite adopting only both WHO guidelines and USEPA limits, Singapore PSI reporting is very efficient
PM10, CO, SO2, NO2, O3
Singapore
based and comparable to WHO and USEPA (for PM10). Standards more lenient, selecting the higher/max allowable limits
TSP, PM10, CO, SO2, NO2, O3, Pb
Philippines
No legislated ambient air quality standardsPakistan
Established only in 2003; standards less stringent than WHO; PM limits less stringent than USEPA
TSP, PM10, CO, SO2, NO2, Pb, C6H6
Nepal
Comparable and to some extent more stringent than WHO guidelines with the exception of CO limits for an 8-hour exposure.
CO, NO2, O3, SO2, TSP
Japan
National and local (Jakarta) standards less stringent that WHO; PM limits less stringent than USEPA
TSP, PM10, CO, SO2, NO2, O3, Pb
Indonesia
Established based on different land-use categories i.e. industrial, residential and sensitive areas.
TSP, PM10, CO, SO2, NO2, Pb
India
Standards less stringent than WHO and USEPA limitsTSP, PM10, CO, SO2, NO2, Pb, O3
Hong Kong
Standards require cities to comply with Class I, II, or III standards. Class I standards more stringent than the WHO and USEPA limits
TSP, PM10, CO, SO2, NO2, Pb
China
1997 standards established for a few pollutants depending on land use category; new standards are pending approval
TSP, CO, NOx, and SO2
Bangladesh
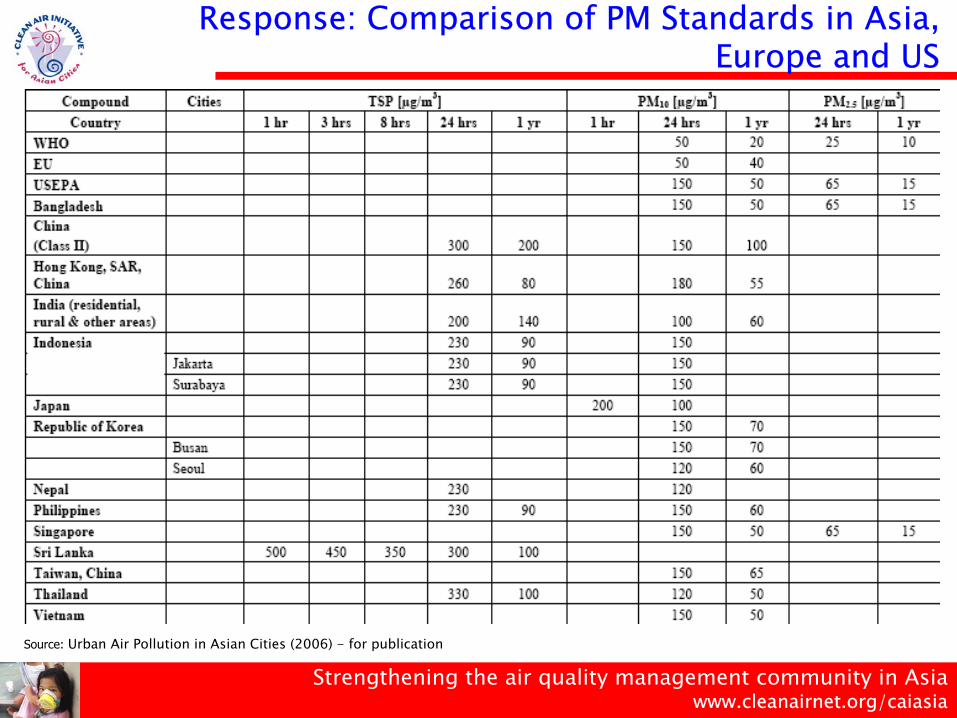
• Most countries have more lenient standards than those prescribed by WHO and USEPA • Standards for PM10 have been largely based on USEPA limits • There is a need to review current PM standards – Europe has moved PM10 limit to 50µg/m3 limit for 24-hour averages and 40 µg/m3 for annual averages• Standards for other air toxics e.g benzene should be legislated• In some cases, AQ monitoring plans/ systems, are inconsistent with the established standards • most Asian countries do not have specific roadside AQM standards
Strengthening the air quality management community in Asiawww.cleanairnet.org/caiasia
Response: Comparison of PM Standards in Asia, Europe and US
Source: Urban Air Pollution in Asian Cities (2006) - for publication

Strengthening the air quality management community in Asiawww.cleanairnet.org/caiasia
Status of AQ
monitoring
in Asia
Source: Urban Air Pollution in Asian Cities (2006) - for publication
AQ Monitoring Capacity in AsiaResponse: Air Quality Monitoring Stations
6Kathmandu
51Jakarta
14Hong Kong
9Ho Chi Minh
7Hanoi
1Dhaka
210Delhi
1Colombo
14Busan
24Beijing
21Bangkok
ContinuousManualCity
6Yogyakarta
82Tokyo
19Taipei
5Surabaya
16Singapore
2123Shanghai
27Seoul
14Osaka
22Mumbai
512Manila
512Kolkata
ContinuousManualCity
Strengthening the air quality management community in Asiawww.cleanairnet.org/caiasia
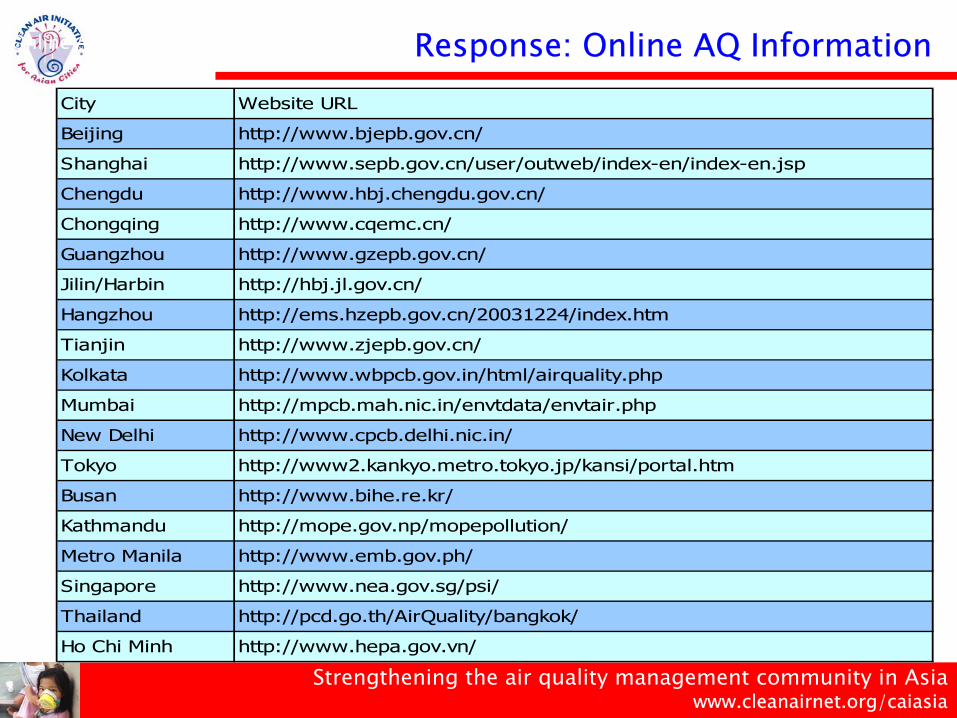
Online Ambient Air Quality Data of Selected Asian Cities
City Website URL
Beijing http://www.bjepb.gov.cn/
Shanghai http://www.sepb.gov.cn/user/outweb/index-en/index-en.jsp
Chengdu http://www.hbj.chengdu.gov.cn/
Chongqing http://www.cqemc.cn/
Guangzhou http://www.gzepb.gov.cn/
Jilin/Harbin http://hbj.jl.gov.cn/
Hangzhou http://ems.hzepb.gov.cn/20031224/index.htm
Tianjin http://www.zjepb.gov.cn/
Kolkata http://www.wbpcb.gov.in/html/airquality.php
Mumbai http://mpcb.mah.nic.in/envtdata/envtair.php
New Delhi http://www.cpcb.delhi.nic.in/
Tokyo http://www2.kankyo.metro.tokyo.jp/kansi/portal.htm
Busan http://www.bihe.re.kr/
Kathmandu http://mope.gov.np/mopepollution/
Metro Manila http://www.emb.gov.ph/
Singapore http://www.nea.gov.sg/psi/
Thailand http://pcd.go.th/AirQuality/bangkok/
Ho Chi Minh http://www.hepa.gov.vn/
Response: Online AQ Information
Strengthening the air quality management community in Asiawww.cleanairnet.org/caiasia
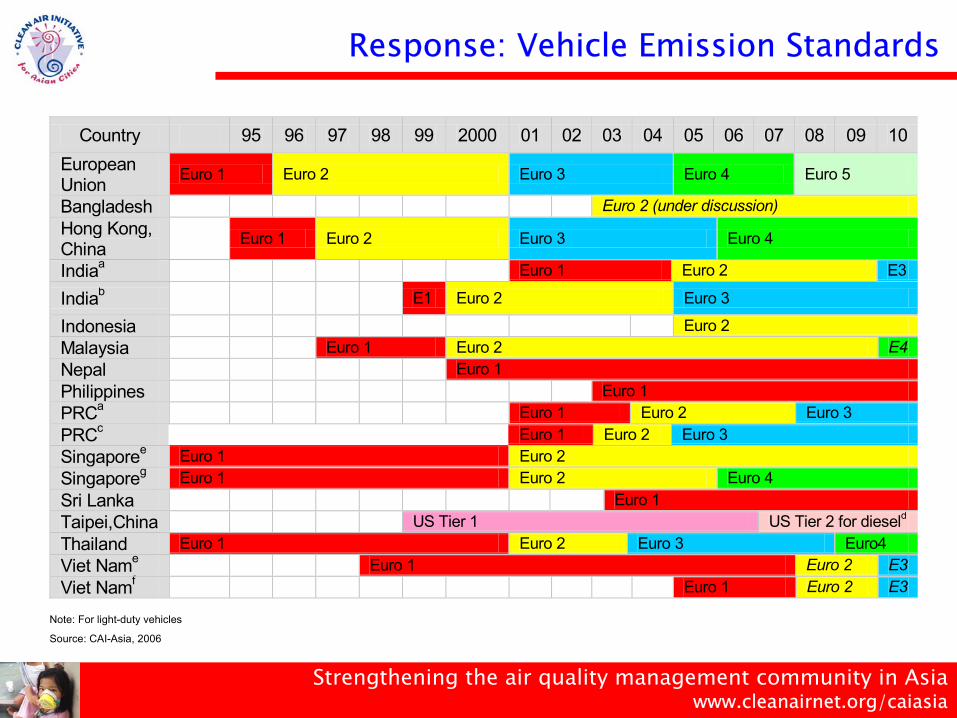
Response: Vehicle Emission Standards
Country 95 96 97 98 99 2000 01 02 03 04 05 06 07 08 09 10 European Union Euro 1 Euro 2 Euro 3 Euro 4 Euro 5
Bangladesh Euro 2 (under discussion) Hong Kong, China Euro 1 Euro 2 Euro 3 Euro 4
Indiaa Euro 1 Euro 2 E3
Indiab E1 Euro 2 Euro 3
Indonesia Euro 2 Malaysia Euro 1 Euro 2 E4 Nepal Euro 1 Philippines Euro 1 PRCa Euro 1 Euro 2 Euro 3 PRCc Euro 1 Euro 2 Euro 3 Singaporee Euro 1 Euro 2 Singaporeg Euro 1 Euro 2 Euro 4 Sri Lanka Euro 1 Taipei,China US Tier 1 US Tier 2 for dieseld Thailand Euro 1 Euro 2 Euro 3 Euro4 Viet Name Euro 1 Euro 2 E3 Viet Namf Euro 1 Euro 2 E3
Note: For light-duty vehicles
Source: CAI-Asia, 2006
Strengthening the air quality management community in Asiawww.cleanairnet.org/caiasia
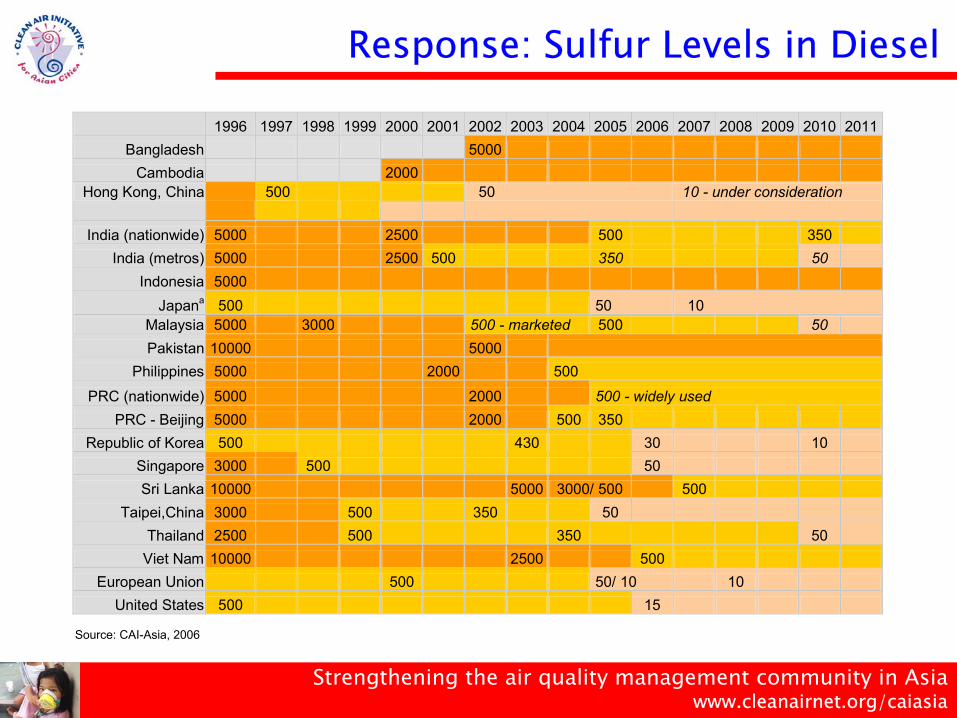
Response: Sulfur Levels in Diesel
1996 1997 1998 1999 2000 2001 2002 2003 2004 2005 2006 2007 2008 2009 2010 2011Bangladesh 5000
Cambodia 2000 Hong Kong, China
500
50 10 - under consideration
India (nationwide) 5000 2500 500 350 India (metros) 5000 2500 500 350 50
Indonesia 5000 Japana 500 50 10
Malaysia 5000 3000 500 - marketed 500 50 Pakistan 10000 5000
Philippines 5000 2000 500
PRC (nationwide) 5000 2000 500 - widely used PRC - Beijing 5000 2000 500 350
Republic of Korea 500 430 30 10 Singapore 3000 500 50 Sri Lanka 10000 5000 3000/ 500 500
Taipei,China 3000 500 350 50 Thailand 2500 500 350 50
Viet Nam 10000 2500 500 European Union 500 50/ 10 10
United States 500 15 Source: CAI-Asia, 2006
Strengthening the air quality management community in Asiawww.cleanairnet.org/caiasia
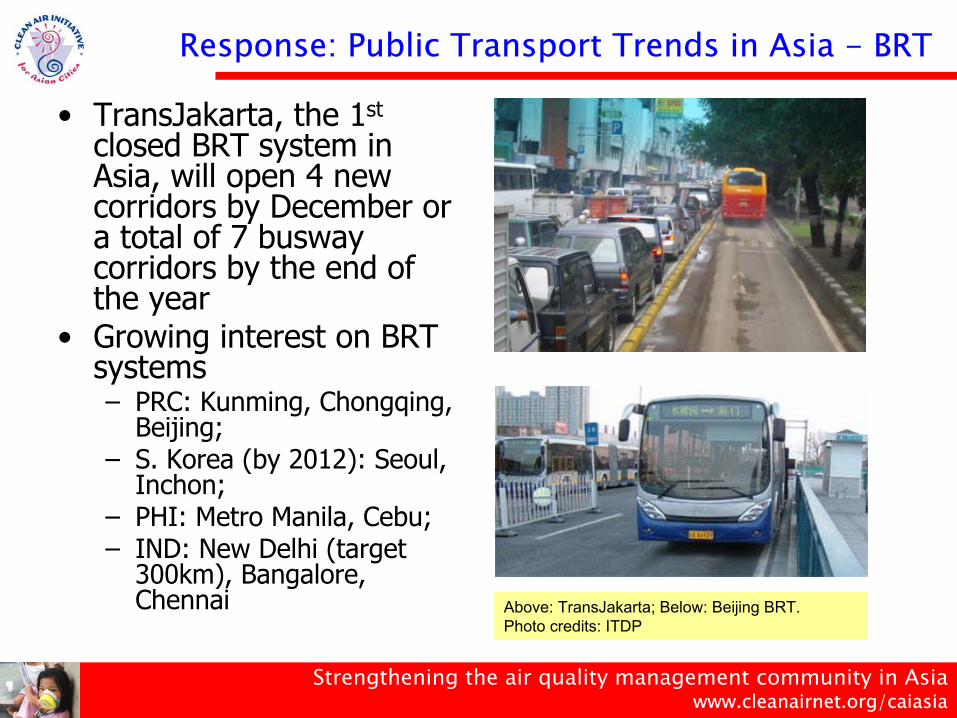
Response: Public Transport Trends in Asia - BRT
• TransJakarta, the 1st
closed BRT system in Asia, will open 4 new corridors by December or a total of 7 buswaycorridors by the end of the year
• Growing interest on BRT systems – PRC: Kunming, Chongqing,
Beijing; – S. Korea (by 2012): Seoul,
Inchon; – PHI: Metro Manila, Cebu; – IND: New Delhi (target
300km), Bangalore, Chennai Above: TransJakarta; Below: Beijing BRT.
Photo credits: ITDP

Strengthening the air quality management community in Asiawww.cleanairnet.org/caiasia
Bus Rapid Transit in Asia
Jakarta, Indonesia Kanazuwa, JapanKunming, China Miyazaki, JapanNagaoka, Japan
Nagoya, JapanNigata, JapanSeoul, South KoreaShijiazhuang, China Taipei,China
Akita, JapanAnkara, TurkeyBeijing, ChinaFukuoka, JapanGifu, Japan
Systems in operation (15):
Systems in planning or under construction (24):Hangzhou, ChinaHuai’an, ChinaHyderabad, IndiaIncheon, South KoreaJinan, ChinaKarachi, PakistanMetro Manila, PhilippinesPune, India Shanghai, China
Shengyan, ChinaSurabaya, IndonesiaT’aichung, ChinaT’ainan, China Tienjing, ChinaWuhan, ChinaXi’an, ChinaXiamen, China
Ahmedabad, India Bangalore, IndiaBangkok, ThailandChengdu, China Chongqing, ChinaDelhi, IndiaGuangzhou, China
Strengthening the air quality management community in Asiawww.cleanairnet.org/caiasia
Response: Stationary Sources• Generally, countries in Asia have Industrial Emission Standards in
place however strengthened implementation and monitoring is needed
• Efforts to reduce industrial pollution in Asia often focus on developing environmental institutions and legal frameworks either through command-and-control regulations or through economic instruments– command and control - guidelines/standards, enforcement and
monitoring – economic instruments - environmental charges, environmental incentives
(subsidies and tax credits), emissions trading• Reduction of air pollution from stationary sources in Asia are still
mostly "end-of-pipe" treatments, while economic incentives are not optimized
• Most Asian countries have adopted cleaner production strategies calling for substituting cleaner fuel sources and using fuels more efficiently– China and India are taking steps to limit the use of coal high in sulfur,
substituting other energy sources such as hydroelectric power

Strengthening the air quality management community in Asiawww.cleanairnet.org/caiasia
Benchmarking UAQM Capability of Asian Cities
• In collaboration with Stockholm Environment Institute in their Air Pollution in the Megacities of Asia Project and the CAI-Asia Network
City Profiles and AQ Data AQM Capability Questionnaire
Compilation of information on current policy and practice for key
components of AQM
Questionnaire to assess AQM capability sent to city
authorities
Benchmarking Study Approach
Strengthening the air quality management community in Asiawww.cleanairnet.org/caiasia
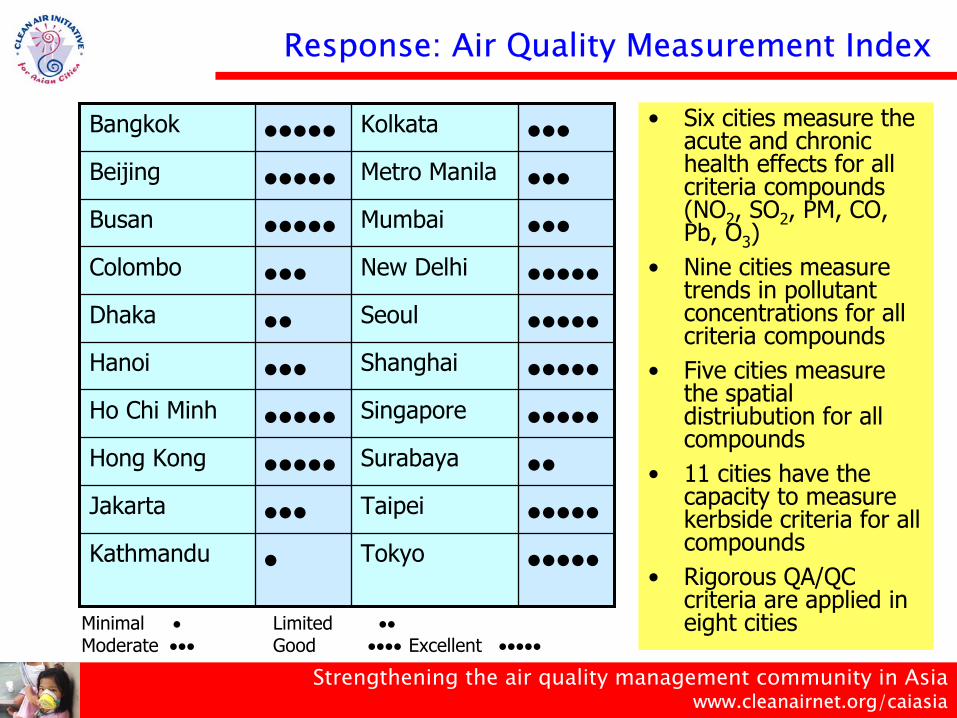
• Six cities measure the acute and chronic health effects for all criteria compounds (NO2, SO2, PM, CO, Pb, O3)
• Nine cities measure trends in pollutant concentrations for all criteria compounds
• Five cities measure the spatial distriubution for all compounds
• 11 cities have the capacity to measure kerbside criteria for all compounds
• Rigorous QA/QC criteria are applied in eight cities
•••••Tokyo•Kathmandu
•••••Taipei•••Jakarta
••Surabaya•••••Hong Kong
•••••Singapore•••••Ho Chi Minh
•••••Shanghai•••Hanoi
•••••Seoul••Dhaka
•••••New Delhi•••Colombo
•••Mumbai•••••Busan
•••Metro Manila•••••Beijing
•••Kolkata•••••Bangkok
Minimal • Limited ••Moderate ••• Good •••• Excellent •••••
Response: Air Quality Measurement Index
Strengthening the air quality management community in Asiawww.cleanairnet.org/caiasia
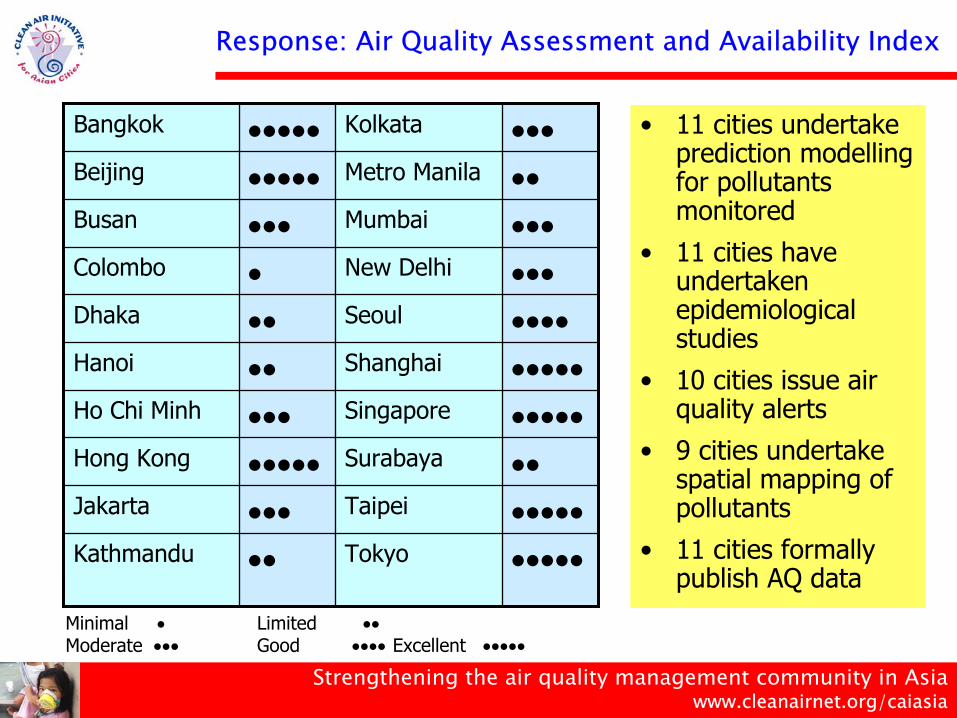
• 11 cities undertake prediction modelling for pollutants monitored
• 11 cities have undertaken epidemiological studies
• 10 cities issue air quality alerts
• 9 cities undertakespatial mapping of pollutants
• 11 cities formally publish AQ data
•••••Tokyo••Kathmandu
•••••Taipei•••Jakarta
••Surabaya•••••Hong Kong
•••••Singapore•••Ho Chi Minh
•••••Shanghai••Hanoi
••••Seoul••Dhaka
•••New Delhi•Colombo
•••Mumbai•••Busan
••Metro Manila•••••Beijing
•••Kolkata•••••Bangkok
Minimal • Limited ••Moderate ••• Good •••• Excellent •••••
Response: Air Quality Assessment and Availability Index
Strengthening the air quality management community in Asiawww.cleanairnet.org/caiasia
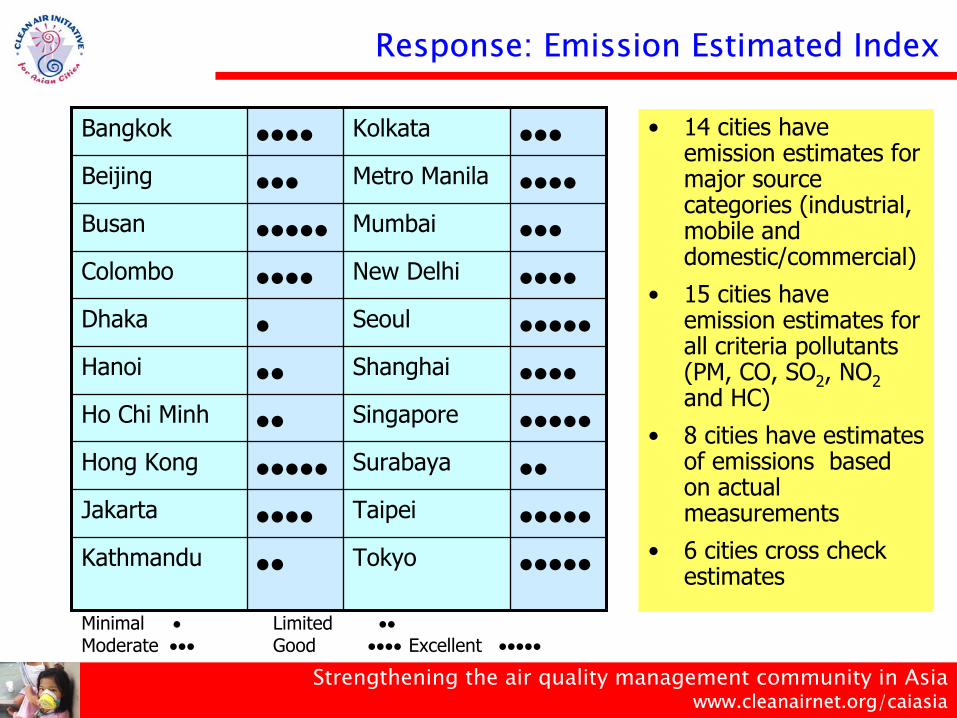
• 14 cities have emission estimates for major source categories (industrial, mobile and domestic/commercial)
• 15 cities have emission estimates for all criteria pollutants (PM, CO, SO2, NO2and HC)
• 8 cities have estimates of emissions based on actual measurements
• 6 cities cross check estimates•••••Tokyo••Kathmandu
•••••Taipei••••Jakarta
••Surabaya•••••Hong Kong
•••••Singapore••Ho Chi Minh
••••Shanghai••Hanoi
•••••Seoul•Dhaka
••••New Delhi••••Colombo
•••Mumbai•••••Busan
••••Metro Manila•••Beijing
•••Kolkata••••Bangkok
Minimal • Limited ••Moderate ••• Good •••• Excellent •••••
Response: Emission Estimated Index
Strengthening the air quality management community in Asiawww.cleanairnet.org/caiasia
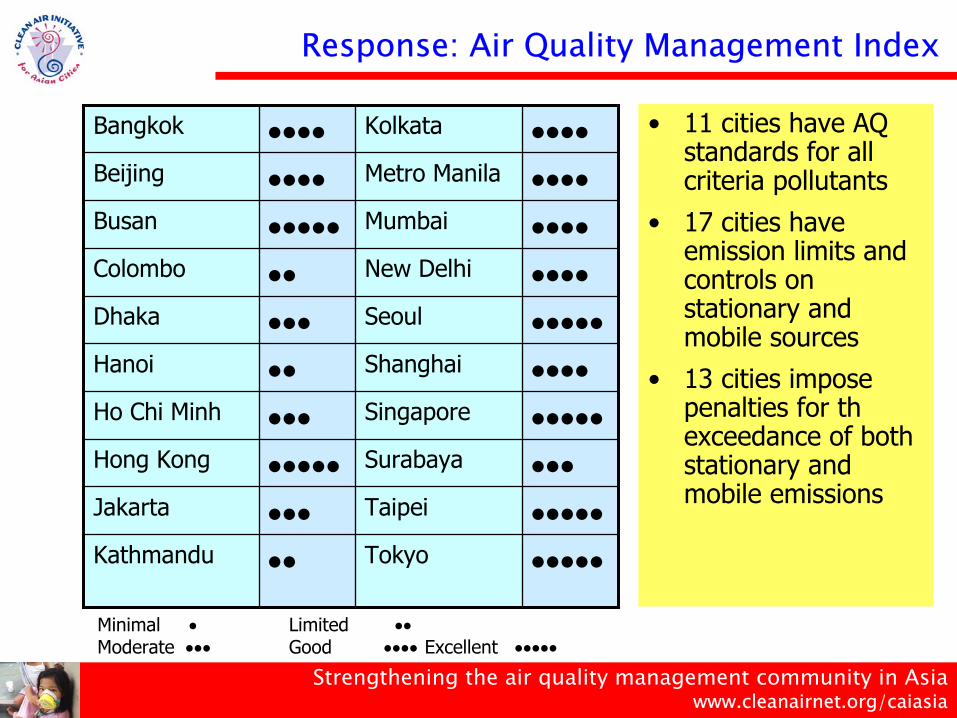
• 11 cities have AQ standards for all criteria pollutants
• 17 cities have emission limits and controls on stationary and mobile sources
• 13 cities impose penalties for th exceedance of both stationary and mobile emissions
•••••Tokyo••Kathmandu
•••••Taipei•••Jakarta
•••Surabaya•••••Hong Kong
•••••Singapore•••Ho Chi Minh
••••Shanghai••Hanoi
•••••Seoul•••Dhaka
••••New Delhi••Colombo
••••Mumbai•••••Busan
••••Metro Manila••••Beijing
••••Kolkata••••Bangkok
Minimal • Limited ••Moderate ••• Good •••• Excellent •••••
Response: Air Quality Management Index
Strengthening the air quality management community in Asiawww.cleanairnet.org/caiasia
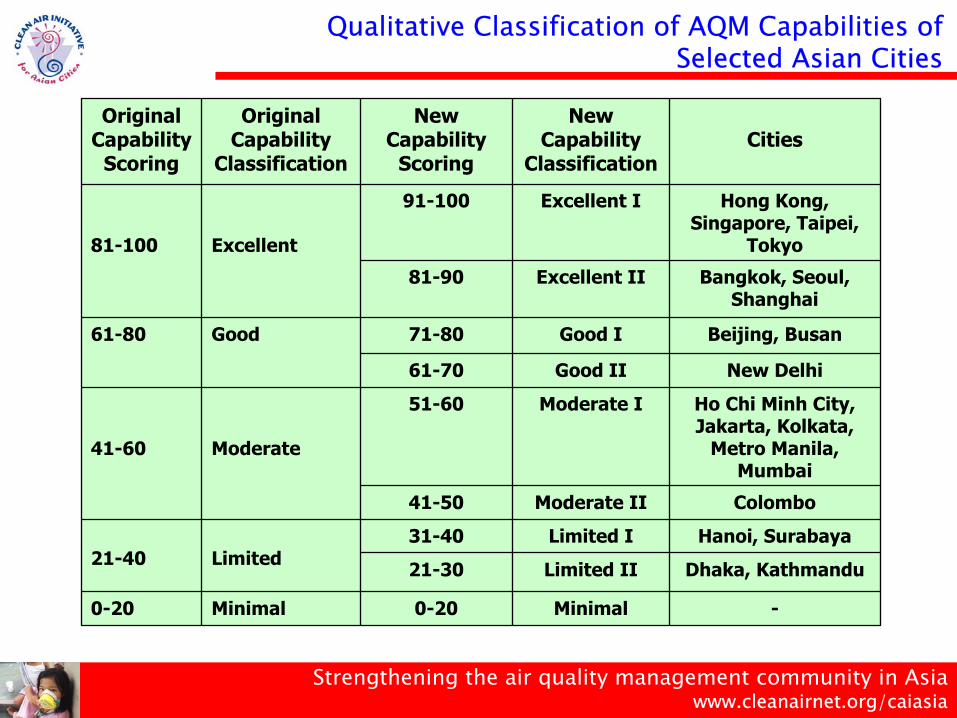
-Minimal0-20Minimal0-20
Dhaka, KathmanduLimited II21-30
Hanoi, SurabayaLimited I31-40Limited21-40
ColomboModerate II41-50
Ho Chi Minh City, Jakarta, Kolkata,
Metro Manila, Mumbai
Moderate I51-60
Moderate41-60
New DelhiGood II61-70
Beijing, BusanGood I71-80Good61-80
Bangkok, Seoul, Shanghai
Excellent II81-90
Hong Kong, Singapore, Taipei,
Tokyo
Excellent I91-100
Excellent81-100
CitiesNew
Capability Classification
New Capability
Scoring
Original Capability
Classification
Original Capability
Scoring
Qualitative Classification of AQM Capabilities of Selected Asian Cities
Strengthening the air quality management community in Asiawww.cleanairnet.org/caiasia
Part 2: Introduction to CAI-Asia
Strengthening the air quality management community in Asiawww.cleanairnet.org/caiasia
• In 2000 and 2001 there was a growing internal awareness on the need for a regional movement on air quality in Asia
• Emerging consensus that air pollution was a growing developmental problem and that it was not being addressed by any of the multilateral organizations such as UNEP, UN-ESCAP or ASEAN
• CAI-Asia benefited from the experience of the Clean Air Initiative for Latin American Cities which was established about 2 years before CAI-Asia
Rationale for CAI-Asia
Strengthening the air quality management community in Asiawww.cleanairnet.org/caiasia
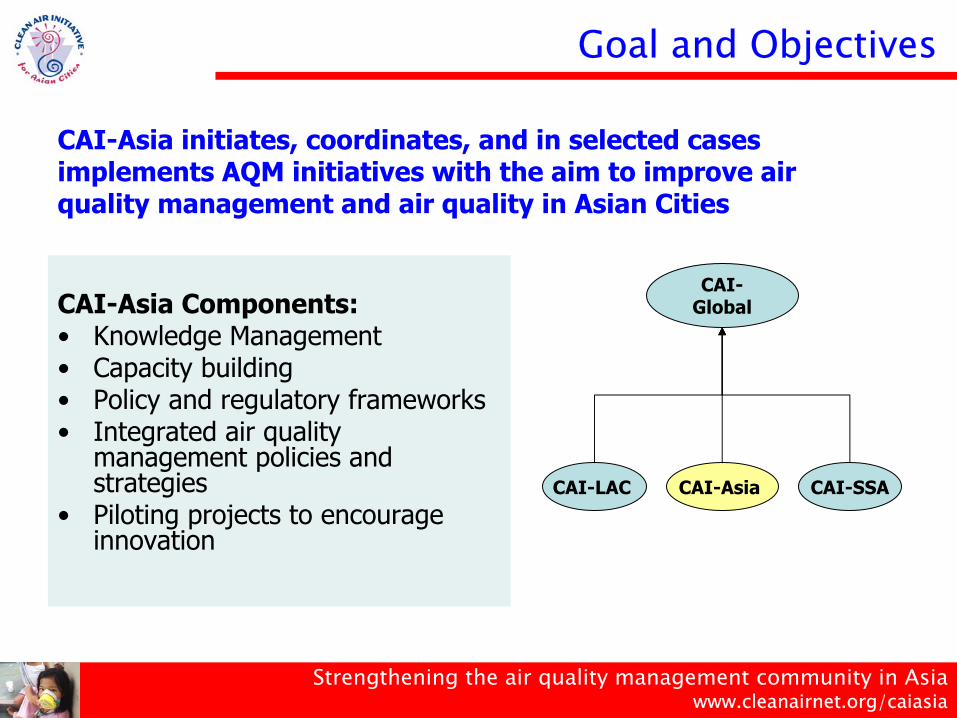
CAI-Asia Components:• Knowledge Management • Capacity building• Policy and regulatory frameworks• Integrated air quality
management policies and strategies
• Piloting projects to encourage innovation
CAI-Asia initiates, coordinates, and in selected cases implements AQM initiatives with the aim to improve air quality management and air quality in Asian Cities
CAI-Global
CAI-LAC CAI-Asia CAI-SSA
Goal and Objectives
Strengthening the air quality management community in Asiawww.cleanairnet.org/caiasia
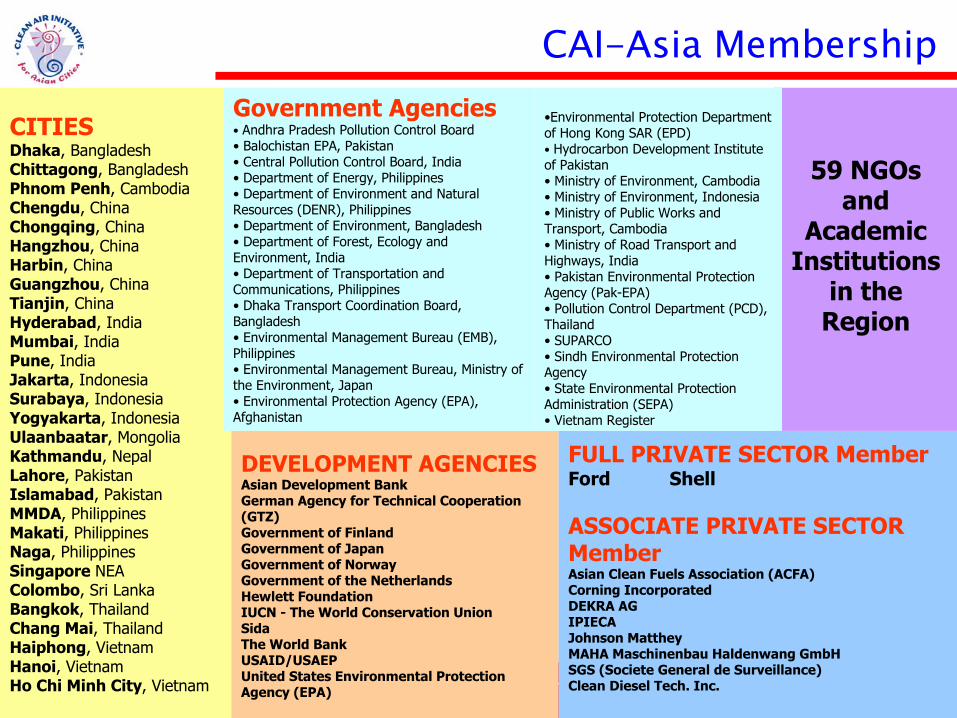
CITIESDhaka, BangladeshChittagong, BangladeshPhnom Penh, CambodiaChengdu, ChinaChongqing, ChinaHangzhou, ChinaHarbin, ChinaGuangzhou, ChinaTianjin, ChinaHyderabad, IndiaMumbai, IndiaPune, IndiaJakarta, IndonesiaSurabaya, IndonesiaYogyakarta, IndonesiaUlaanbaatar, MongoliaKathmandu, NepalLahore, PakistanIslamabad, PakistanMMDA, PhilippinesMakati, PhilippinesNaga, PhilippinesSingapore NEAColombo, Sri LankaBangkok, ThailandChang Mai, ThailandHaiphong, VietnamHanoi, VietnamHo Chi Minh City, Vietnam
DEVELOPMENT AGENCIESAsian Development BankGerman Agency for Technical Cooperation (GTZ)Government of FinlandGovernment of JapanGovernment of NorwayGovernment of the NetherlandsHewlett FoundationIUCN - The World Conservation UnionSidaThe World BankUSAID/USAEPUnited States Environmental Protection Agency (EPA)
FULL PRIVATE SECTOR MemberFord Shell
ASSOCIATE PRIVATE SECTOR MemberAsian Clean Fuels Association (ACFA) Corning Incorporated DEKRA AG IPIECA Johnson Matthey MAHA Maschinenbau Haldenwang GmbH SGS (Societe General de Surveillance)Clean Diesel Tech. Inc.
59 NGOs and
Academic Institutions
in the Region
Government Agencies• Andhra Pradesh Pollution Control Board• Balochistan EPA, Pakistan• Central Pollution Control Board, India• Department of Energy, Philippines• Department of Environment and Natural Resources (DENR), Philippines• Department of Environment, Bangladesh• Department of Forest, Ecology and Environment, India• Department of Transportation and Communications, Philippines• Dhaka Transport Coordination Board, Bangladesh• Environmental Management Bureau (EMB), Philippines• Environmental Management Bureau, Ministry of the Environment, Japan• Environmental Protection Agency (EPA), Afghanistan
•Environmental Protection Department of Hong Kong SAR (EPD)• Hydrocarbon Development Institute of Pakistan• Ministry of Environment, Cambodia• Ministry of Environment, Indonesia• Ministry of Public Works and Transport, Cambodia• Ministry of Road Transport and Highways, India• Pakistan Environmental Protection Agency (Pak-EPA)• Pollution Control Department (PCD), Thailand• SUPARCO• Sindh Environmental Protection Agency• State Environmental Protection Administration (SEPA)• Vietnam Register
CAI-Asia Membership
Strengthening the air quality management community in Asiawww.cleanairnet.org/caiasia
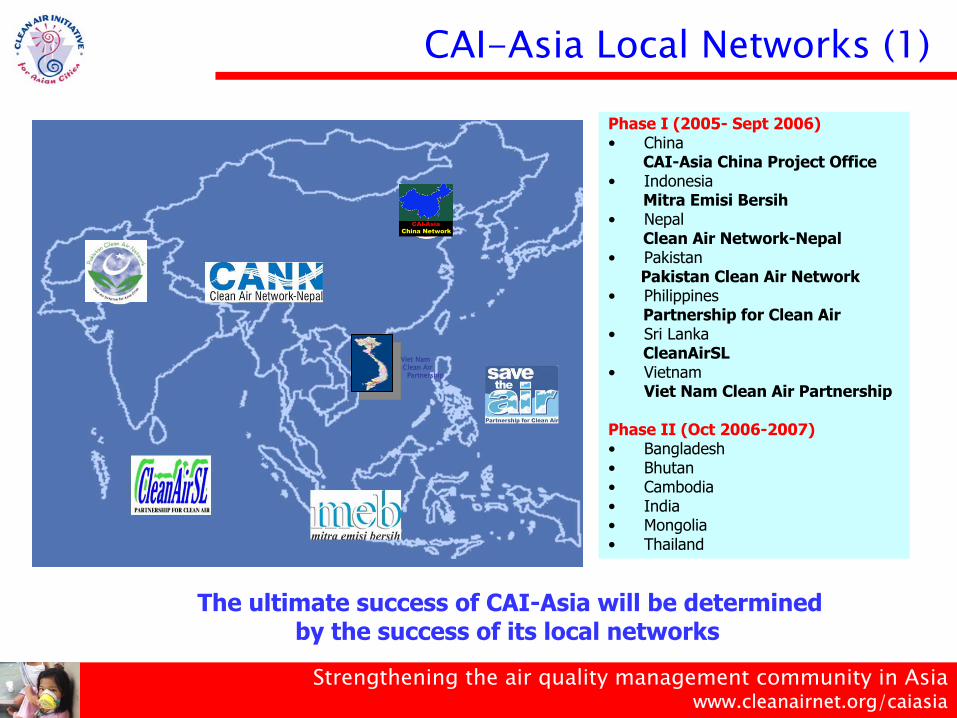
Phase I (2005- Sept 2006)• China
CAI-Asia China Project Office• Indonesia
Mitra Emisi Bersih• Nepal
Clean Air Network-Nepal• Pakistan
Pakistan Clean Air Network• Philippines
Partnership for Clean Air• Sri Lanka
CleanAirSL• Vietnam
Viet Nam Clean Air Partnership
Phase II (Oct 2006-2007)• Bangladesh• Bhutan• Cambodia• India• Mongolia • Thailand
CAI-Asia Local Networks (1)
The ultimate success of CAI-Asia will be determinedby the success of its local networks
Viet NamClean Air
Partnership
CAI-Asia China Network
CAI-Asia China Network
CAI-Asia China Network
CAI-Asia China Network
Strengthening the air quality management community in Asiawww.cleanairnet.org/caiasia
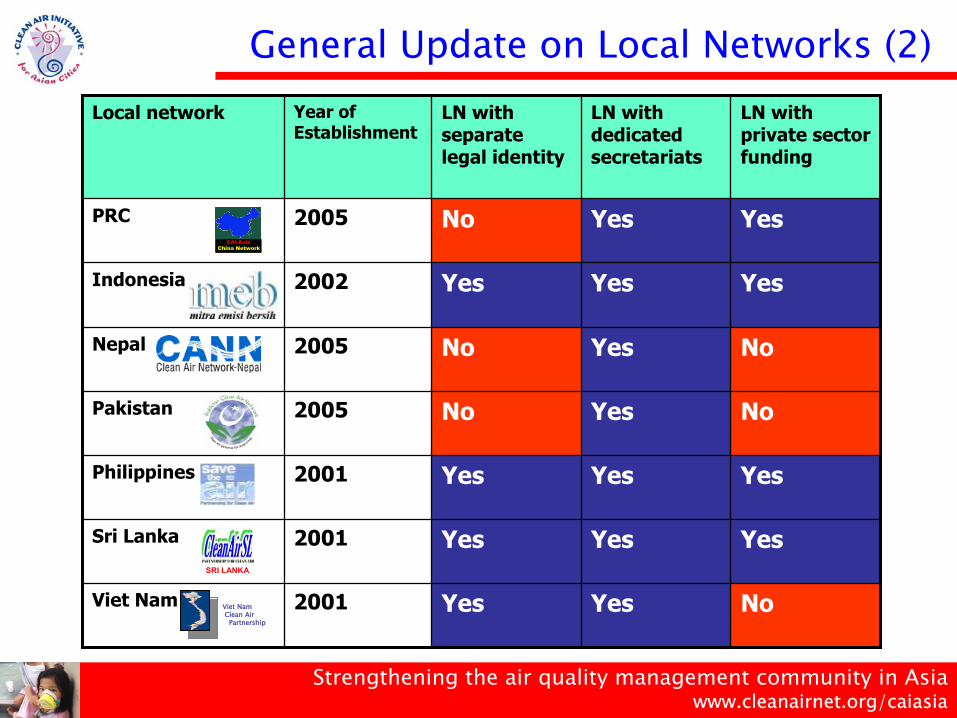
General Update on Local Networks (2)
NoYesYes2001Viet Nam
YesYesYes2001Sri Lanka
YesYesYes2001Philippines
NoYesNo2005Pakistan
NoYesNo2005Nepal
YesYesYes2002Indonesia
YesYesNo2005PRC
LN with private sector funding
LN with dedicated secretariats
LN with separate legal identity
Year of Establishment
Local network
SRI LANKA
CAI-Asia China Network
CAI-Asia China Network
CAI-Asia China Network
CAI-Asia China Network
Viet NamClean Air
Partnership
Strengthening the air quality management community in Asiawww.cleanairnet.org/caiasia
Part 3: Short History and Main Components of CAI-Asia
Strengthening the air quality management community in Asiawww.cleanairnet.org/caiasia
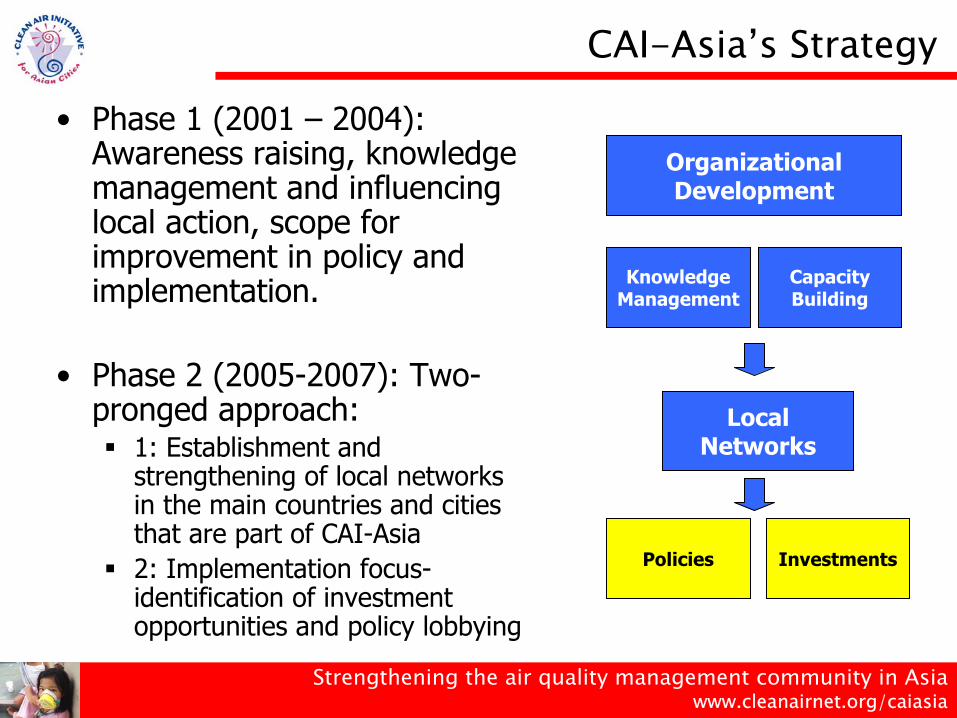
• Phase 1 (2001 – 2004): Awareness raising, knowledge management and influencing local action, scope for improvement in policy and implementation.
• Phase 2 (2005-2007): Two-pronged approach:
1: Establishment and strengthening of local networks in the main countries and cities that are part of CAI-Asia2: Implementation focus-identification of investment opportunities and policy lobbying
Organizational Development
Knowledge Management
Capacity Building
Local Networks
Policies Investments
CAI-Asia’s Strategy

Strengthening the air quality management community in Asiawww.cleanairnet.org/caiasia
• Being Effective in improving air quality requires mainstreaming of AQM:
Policies and Investments of developing country governments and citiesMainstream Air Quality in development agencies including ADB by identifying Investment Opportunities on AQ related topics including Sustainable Urban TransportMainstreaming is best conducted by developing specific areas of expertise such as sustainable urban transport
• Successful Mainstreaming requires a critical mass of awareness:
Air Quality needs to be made “sexy”Understanding of the importance of the problem and emphasizing the assurance of successTarget masses as well as specific target groupsPrivate sector is an essential ally Link AQ message to other “supportive” messages such as climate change or road safety and promote co-benefit concept
Mainstreaming AQM and SUT
Strengthening the air quality management community in Asiawww.cleanairnet.org/caiasia
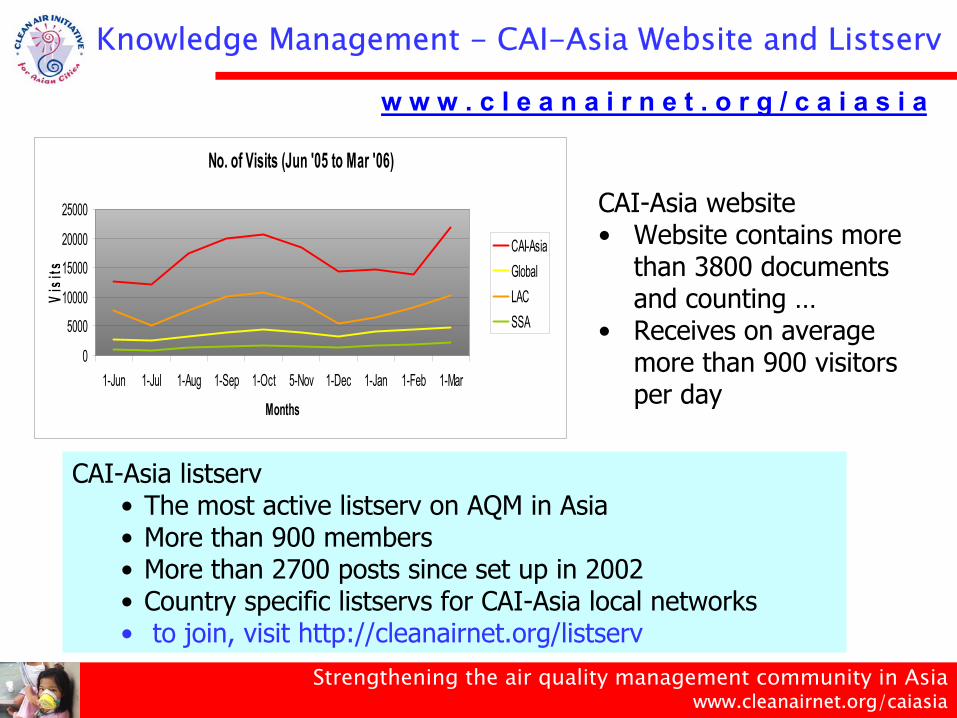
Knowledge Management - CAI-Asia Website and Listserv
CAI-Asia website• Website contains more
than 3800 documents and counting …
• Receives on average more than 900 visitors per day
No. of Visits (Jun '05 to Mar '06)
0
5000
10000
15000
20000
25000
1-Jun 1-Jul 1-Aug 1-Sep 1-Oct 5-Nov 1-Dec 1-Jan 1-Feb 1-Mar
Months
Visi
ts
CAI-AsiaGlobalLACSSA
w w w . c l e a n a i r n e t . o r g / c a i a s i a
CAI-Asia listserv • The most active listserv on AQM in Asia• More than 900 members • More than 2700 posts since set up in 2002• Country specific listservs for CAI-Asia local networks• to join, visit http://cleanairnet.org/listserv
Strengthening the air quality management community in Asiawww.cleanairnet.org/caiasia
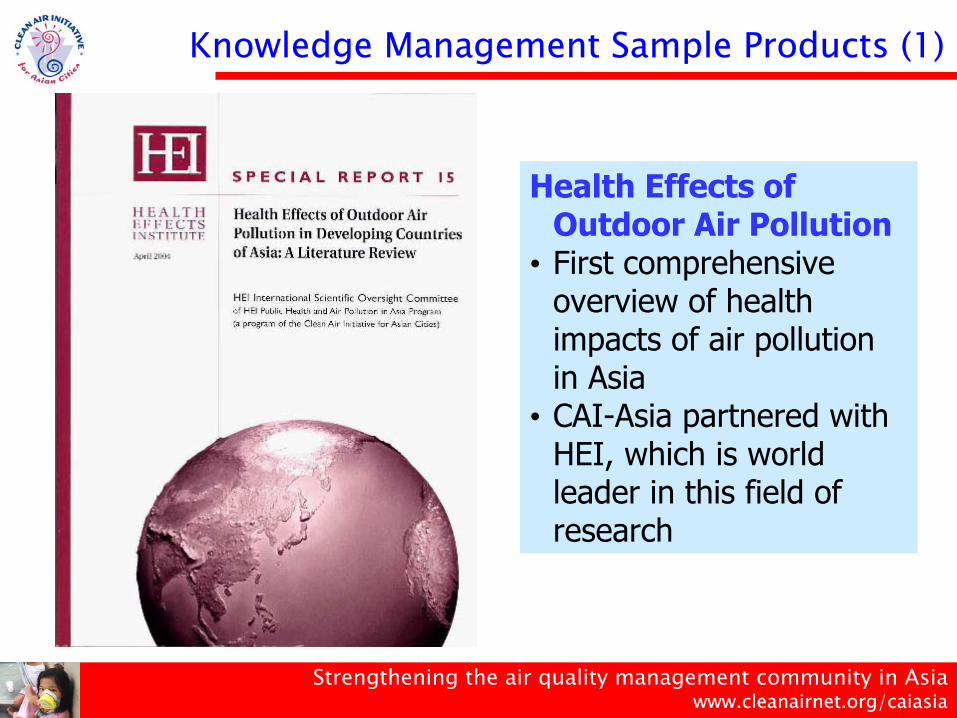
Health Effects of Outdoor Air Pollution• First comprehensive
overview of health impacts of air pollution in Asia• CAI-Asia partnered with
HEI, which is world leader in this field of research
Knowledge Management Sample Products (1)
Strengthening the air quality management community in Asiawww.cleanairnet.org/caiasia
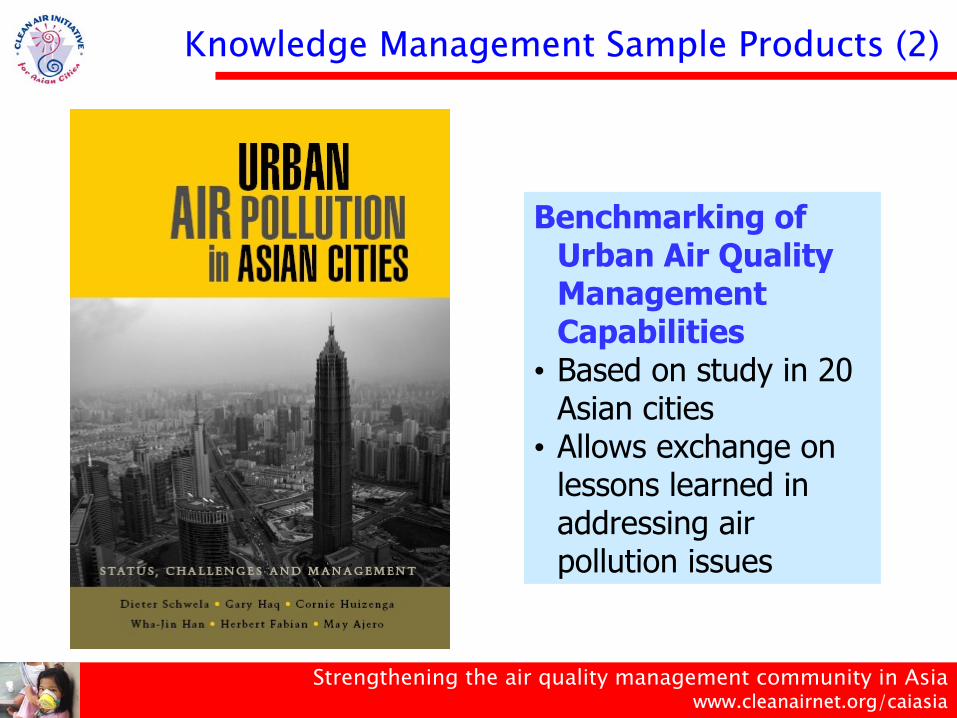
Benchmarking of Urban Air Quality Management Capabilities • Based on study in 20
Asian cities • Allows exchange on
lessons learned in addressing air pollution issues
Knowledge Management Sample Products (2)

Strengthening the air quality management community in Asiawww.cleanairnet.org/caiasia
Compendium• Annual Report
documenting all AQM program and projects in Asia • Basis for annual CAI-
Asia/UNEP donor coordination forum on AQM
Knowledge Management Sample Products (3)

Strengthening the air quality management community in Asiawww.cleanairnet.org/caiasia
• Effective AQM that will make a difference in Asia will require a massive capacity building on AQM
• Current training programs will need to be improved in quantity and quality:
– Get more training institutions involved
– Develop more training courses
– Train more trainers– Conduct more trainings
• Develop CATNet Asia as a separate program in CAI-Asia to enhance its sustainability and its impact
Capacity Building – CATNet Asia
South AsiaSRI
PAK
IND
NEP
East AsiaW. PRC
N. PRC
S. PRC
E. PRC
Southeast AsiaVIE
THA
INO
PHI
CAT-Net AsiaCoordinator
Strengthening the air quality management community in Asiawww.cleanairnet.org/caiasia
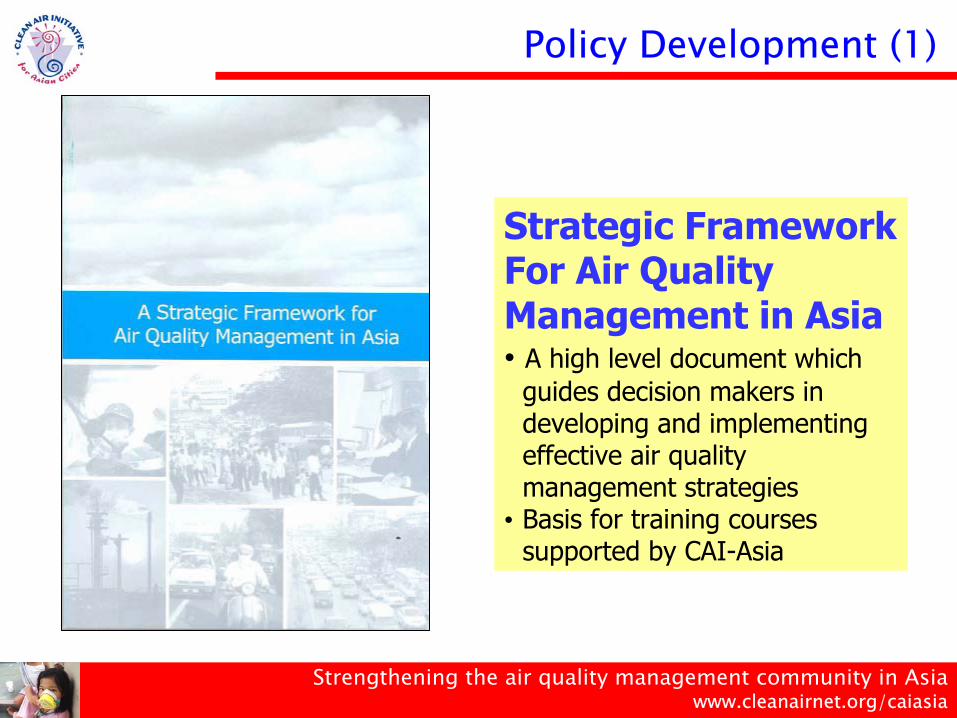
Strategic Framework For Air Quality Management in Asia• A high level document which
guides decision makers in developing and implementing effective air quality management strategies• Basis for training courses
supported by CAI-Asia
Policy Development (1)
Strengthening the air quality management community in Asiawww.cleanairnet.org/caiasia
• CAI-Asia has created a series of policy forums in Asia to discuss urban air quality management and sustainable urban transport:
Annual Dialogue of Air Quality Initiatives (co-hosted with UNEP)Governmental Meeting on Urban Air Quality (co-hosted with UNEP, MoE Indonesia, UNCRD)Annual development partners meetings in CAI-Asia member countries (First quarter 2006)Informal coordination of Emission factor development programs in AsiaRegional Forum on Environment and Health (CAI-Asia as AQ focal point) UNEP - WHO
Policy Development (2)
Strengthening the air quality management community in Asiawww.cleanairnet.org/caiasia
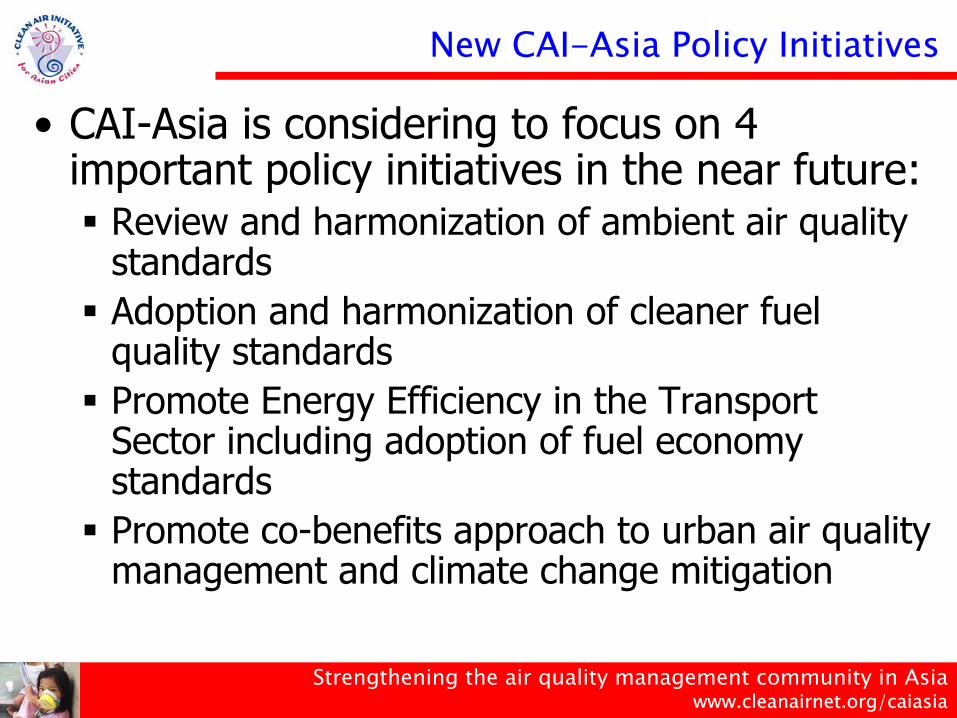
New CAI-Asia Policy Initiatives
• CAI-Asia is considering to focus on 4 important policy initiatives in the near future:
Review and harmonization of ambient air quality standardsAdoption and harmonization of cleaner fuel quality standardsPromote Energy Efficiency in the Transport Sector including adoption of fuel economy standardsPromote co-benefits approach to urban air quality management and climate change mitigation
Strengthening the air quality management community in Asiawww.cleanairnet.org/caiasia
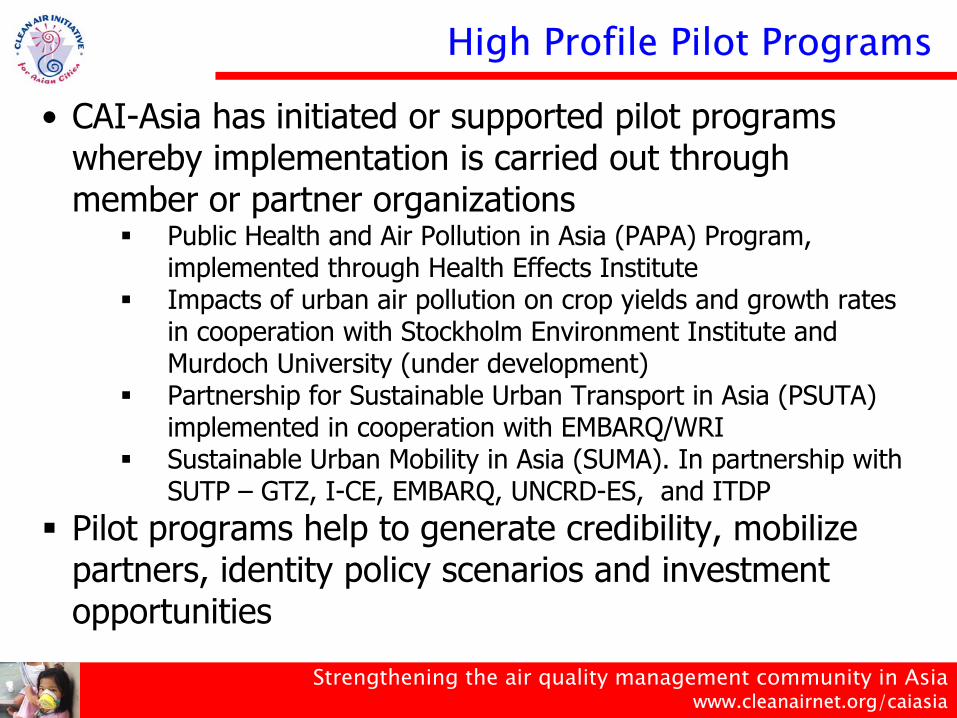
• CAI-Asia has initiated or supported pilot programs whereby implementation is carried out through member or partner organizations
Public Health and Air Pollution in Asia (PAPA) Program, implemented through Health Effects InstituteImpacts of urban air pollution on crop yields and growth rates in cooperation with Stockholm Environment Institute and Murdoch University (under development)Partnership for Sustainable Urban Transport in Asia (PSUTA) implemented in cooperation with EMBARQ/WRISustainable Urban Mobility in Asia (SUMA). In partnership with SUTP – GTZ, I-CE, EMBARQ, UNCRD-ES, and ITDP
Pilot programs help to generate credibility, mobilize partners, identity policy scenarios and investment opportunities
High Profile Pilot Programs
Strengthening the air quality management community in Asiawww.cleanairnet.org/caiasia
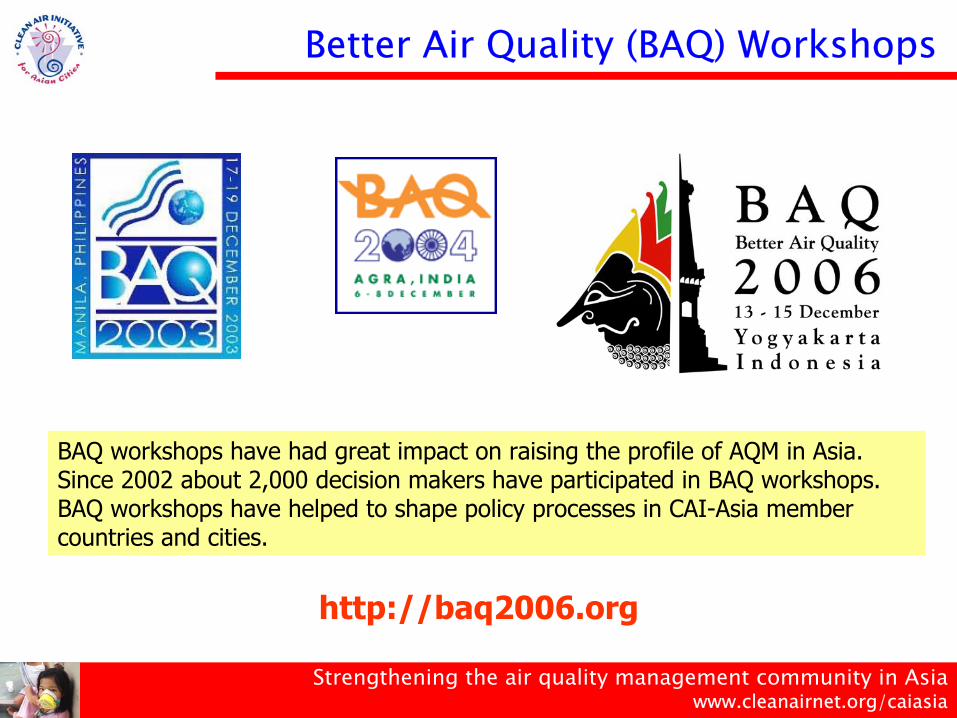
BAQ workshops have had great impact on raising the profile of AQM in Asia. Since 2002 about 2,000 decision makers have participated in BAQ workshops. BAQ workshops have helped to shape policy processes in CAI-Asia member countries and cities.
http://baq2006.org
Better Air Quality (BAQ) Workshops
Strengthening the air quality management community in Asiawww.cleanairnet.org/caiasia
49
14
14
29
44
61
36
54
6
23
39
15
1
10
11
1
1
0% 20% 40% 60% 80% 100%
Strongly agree Agree Neither agree nor disagree DisagreeStrongly disagree
CAI-Asia contributed to development of AQM policies in area/country
CAI-Asia activities resulted in more Asian cities/countries undertake concrete AQM
activities
My participation in CAI-Asia activities helped improve personal understanding on
AQ problems and solutions
CAI-Asia successfully brought together various institutions/individuals to share
information on AQ problems and solutions
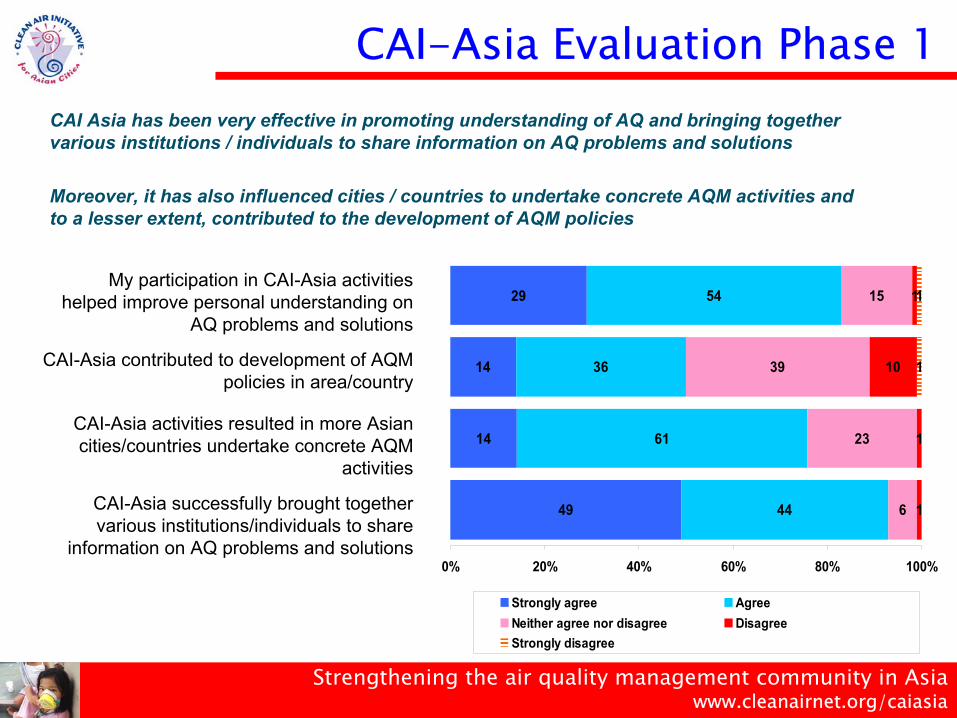
CAI Asia has been very effective in promoting understanding of AQ and bringing together various institutions / individuals to share information on AQ problems and solutions
Moreover, it has also influenced cities / countries to undertake concrete AQM activities and to a lesser extent, contributed to the development of AQM policies
CAI-Asia Evaluation Phase 1
Strengthening the air quality management community in Asiawww.cleanairnet.org/caiasia
For more information
Cornie [email protected]
www.cleanairnet.org/caiasia
www.baq2006.org