building blocks of datawarehouse g.lakshmi … mart(1).pdf · • identify subjects of the data...
TRANSCRIPT

1
BUILDING BLOCKS OF DATAWAREHOUSE
G.Lakshmi Priya & Razia Sultana.AAssistant Professor/IT

2
Data Warehouse—Subject‐Oriented
• Organized around major subjects, such as customer, product, sales.
• Focusing on the modeling and analysis of data for decision makers, not on daily operations or transaction processing.
• Provide a simple and concise view around particular subject issues by excluding data that are not useful in the decision support process.

3
Data Warehouse—Subject‐Oriented
• Organized around major subjects, such as customer, product, sales.
• Focusing on the modeling and analysis of data for decision makers, not on daily operations or transaction processing.
• Provide a simple and concise view around particular subject issues by excluding data that are not useful in the decision support process.
4
Data Warehouse—Subject‐Oriented
• Organized around major subjects, such as customer, product, sales.
• Focusing on the modeling and analysis of data for decision makers, not on daily operations or transaction processing.
• Provide a simple and concise view around particular subject issues by excluding data that are not useful in the decision support process.

5
Data Warehouse ‐ Integrated
• Constructed by integrating multiple, heterogeneous data sources– relational databases, flat files, on‐line transaction records
• Data cleaning and data integration techniques are applied.– Ensure consistency in naming conventions, encoding structures, attribute measures, etc. among different data sources
• E.g., Hotel price: currency, tax, breakfast covered, etc.
– When data is moved to the warehouse, it is converted.

6
Data Warehouse ‐Time Variant
• The time horizon for the data warehouse is significantly longer than that of operational systems.– Operational database: current value data.
– Data warehouse data: provide information from a historical perspective (e.g., past 5‐10 years)
• Every key structure in the data warehouse– Contains an element of time, explicitly or implicitly
– But the key of operational data may or may not contain “time element”.

7
Data Warehouse ‐ Non Updatable
• A physically separate store of data transformed from the operational environment.
• Operational update of data does not occur in the data warehouse environment.– Does not require transaction processing, recovery, and concurrency control mechanisms.
– Requires only two operations in data accessing: • initial loading of data and access of data.

8
Need for Data Warehousing• Integrated, company‐wide view of high‐quality
information (from disparate databases)
• Separation of operational and informational systems and data (for improved performance)
Table 11‐1: comparison of operational and informational systems

9
Need to separate operational and information systems
Three primary factors:– A data warehouse centralizes data that are scattered throughout disparate operational systems and makes them available for DS.
– A well‐designed data warehouse adds value to data by improving their quality and consistency.
– A separate data warehouse eliminates much of the contention for resources that results when information applications are mixed with operational processing.

10
Data Warehouse Architectures
• 1.Generic Two‐Level Architecture
• 2.Independent Data Mart
• 3.Dependent Data Mart and Operational Data Store
• 4.Logical Data Mart and @ctive Warehouse
• 5.Three‐Layer architecture
All involve some form of extraction, transformation and loading (ETL)

11
Generic two‐level architecture
E
T
LOne, company‐wide warehouse
Periodic extraction data is not completely current in warehouse

12
Independent Data MartData marts:Mini‐warehouses, limited in scope
E
T
L
Separate ETL for each independent data mart
Data access complexity due to multiple data marts
13
Independent Data mart
• Independent data mart: a data mart filled with data extracted from the operational environment without benefits of a data warehouse.

14
Dependent data mart with operational data store
E
T
L
Single ETL for enterprise data warehouse(EDW)
Simpler data access
ODS provides option for obtaining current data
Dependent data marts loaded from EDW

15
Dependent data mart‐Operational data store
• Dependent data mart: A data mart filled exclusively from the enterprise data warehouse and its reconciled data.
• Operational data store (ODS): An integrated, subject‐oriented, updatable, current‐valued, enterprisewise, detailed database designed to serve operational users as they do decision support processing.

16
Logical data mart
E
T
L
Near real‐time ETL for @active Data Warehouse
ODS and data warehouseare one and the same
Data marts are NOT separate databases, but logical views of the data warehouse
Easier to create new data marts
17
@ctive data warehouse
• @active data warehouse: An enterprise data warehouse that accepts near‐real‐time feeds of transactional data from the systems of record, analyzes warehouse data, and in near‐real‐time relays business rules to the data warehouse and systems of record so that immediate actions can be taken in repsonse to business events.

18
Data Warehouse vs. Data Mart

19
Three-layer architecture

20
Three‐layer architectureReconciled and derived data
• Reconciled data: detailed, current data intended to be the single, authoritative source for all decision support.
• Derived data: Data that have been selected, formatted, and aggregated for end‐user decision support application.
• Metadata: technical and business data that describe the properties or characteristics of other data.

21
Data Characteristics
Status vs. Event DataExample of DBMS log entry
Status
Status
Event = a database action (create/update/delete) that results from a transaction

22
Data CharacteristicsTransient vs. Periodic Data
Figure 11‐8: Transient operational data
Changes to existing records are written over previous records, thus destroying the previous
data content

23
Data CharacteristicsTransient vs. Periodic Data
Figure 11‐9: Periodic warehouse data
Data are never physically altered or deleted once they have been added
to the store

24
Other data warehouse changes
• New descriptive attributes
• New business activity attributes
• New classes of descriptive attributes
• Descriptive attributes become more refined
• Descriptive data are related to one another
• New source of data

25
Data Reconciliation
• Typical operational data is:– Transient – not historical– Not normalized (perhaps due to denormalization for
performance)– Restricted in scope – not comprehensive– Sometimes poor quality – inconsistencies and errors
• After ETL, data should be:– Detailed – not summarized yet– Historical – periodic– Normalized – 3rd normal form or higher– Comprehensive – enterprise‐wide perspective– Quality controlled – accurate with full integrity

26
Record‐level functions & Field‐level functions
• Record‐level functions– Selection: data partitioning– Joining: data combining– Normalization– Aggregation: data summarization
• Field‐level functions– Single‐field transformation: from one field to one field
– Multi‐field transformation: from many fields to one, or one field to many

27
Single-field transformation
In general – some transformation function translates data from old form to new form
Algorithmic transformation uses a formula or logical expression
Table lookup –another approach

28
Multifield transformation
M:1 –from many source fields to one target field
1:M –from one source field to many target fields

29
Derived Data
• Objectives– Ease of use for decision support applications– Fast response to predefined user queries– Customized data for particular target audiences– Ad‐hoc query support– Data mining capabilities
• Characteristics– Detailed (mostly periodic) data– Aggregate (for summary)– Distributed (to departmental servers)
Most common data model = star schema(also called “dimensional model”)

30
The Star Schema
• Star schema: is a simple database design in which dimensional (describing how data are commonly aggregated) are separated from fact or event data.
• A star schema consists of two types of tables: fact tables and dimension table.

31
Components of a star schemaFact tables contain factual or quantitative data
Dimension tables contain descriptions about the subjects of the business
1:N relationship between dimension tables and fact tables
Excellent for ad‐hoc queries, but bad for online transaction processing
Dimension tables are denormalized to maximize performance

32
Star schema example
Fact table provides statistics for sales broken down by product, period and store dimensions

33
Star schema with sample data

34
Issues Regarding Star Schema
• Dimension table keys must be surrogate (non‐intelligent and non‐business related), because:– Keys may change over time– Length/format consistency
• Granularity of Fact Table – what level of detail do you want? – Transactional grain – finest level– Aggregated grain – more summarized– Finer grains better market basket analysis capability– Finer grain more dimension tables, more rows in fact table

35
• Duration of the database• Ex: 13 months or 5 quarters
• Some businesses need for a longer durations.
• Size of the fact table– Estimate the number of possible values for each dimension associated with the fact table.
– Multiply the values obtained in the first step after making any necessary adjustments.

36
Modeling dates
Fact tables contain time‐period dataDate dimensions are important
37
Variations of the Star Schema
• 1. Multiple fact tables
• 2. Factless fact tables
• 3. Normalizing Dimension Tables
• 4. Snowflake schema

38
Multiple Fact tables
• More than one fact table in a given star schema.
• Ex: There are 2 fact tables, one at the center of each star:– Sales – facts about the sale of a product to a customer in a store on a date.
– Receipts ‐ facts about the receipt of a product from a vendor to a warehouse on a date.
– Two separate product dimension tables have been created.
– One date dimension table is used.

39

40
Factless Fact Tables
• There are applications in which fact tables do not have nonkey data but that do have foreign keys for the associated dimensions.
• The two situations:– To track events
– To inventory the set of possible occurrences (called coverage)

41
Factless fact table showing occurrence of an event.

42
Factless fact table showing coverage

43
Normalizing dimension tables
• Dimension tables may not be normalized. Most data warehouse experts find this acceptable.
• In some situations in which it makes sense to further normalize dimension tables.
• Multivalued dimensions: – Ex: Hospital charge/payment for a patient on a date is associated with one or more diagnosis.
– N:M relationship between the Diagnosis and Finances fact table.
– Solution: create an associative entity (helper table) between Diagnosis and Finances.

44Multivalued dimension

45
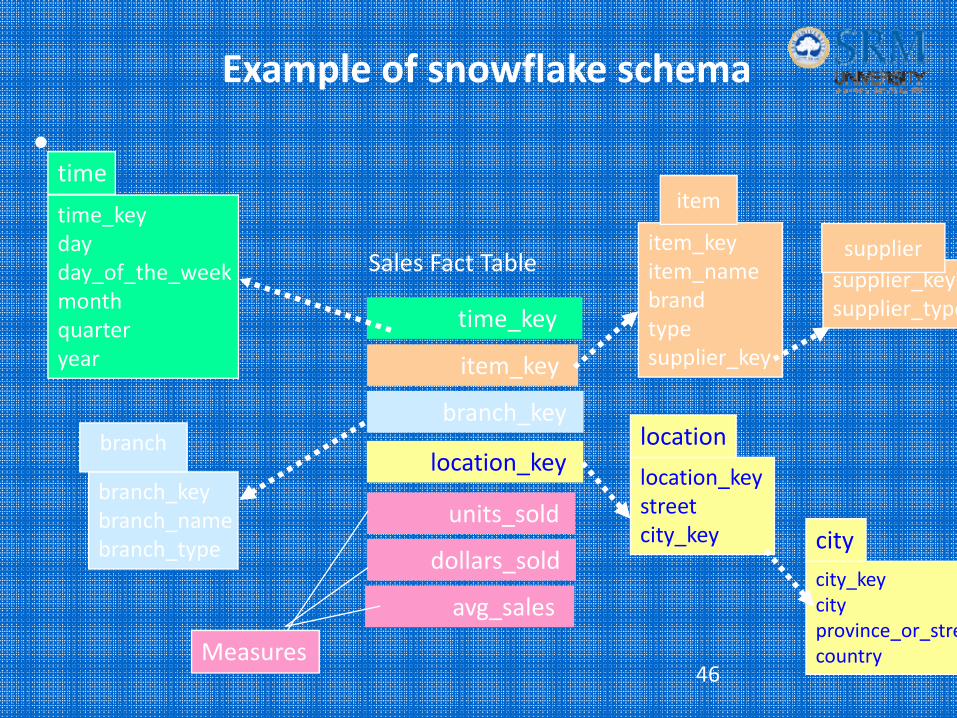
Snowflake schema
• Snowflake schema is an expanded version of a star schema in which dimension tables are normalized into several related tables.
• Advantages– Small saving in storage space– Normalized structures are easier to update and maintain
• Disadvantages– Schema less intuitive – Ability to browse through the content difficult– Degraded query performance because of additional joins.
46
Example of snowflake schema
•time_keydayday_of_the_weekmonthquarteryear
time
location_keystreetcity_key
location
Sales Fact Table
time_key
item_key
branch_key
location_key
units_sold
dollars_sold
avg_sales
Measures
item_keyitem_namebrandtypesupplier_key
item
branch_keybranch_namebranch_type
branch
supplier_keysupplier_type
supplier
city_keycityprovince_or_strecountry
city

47
The User Interface
• A variety of tools are available to query and analyze data stored in data warehouses.– 1. Querying tools
– 2. On‐line Analytical processing (OLAP, MOLAP, ROLAP) tools
– 3. Data Mining tools
– 4. Data Visualization tools
48
Role of Metadata (data catalog)
• Identify subjects of the data mart• Identify dimensions and facts• Indicate how data is derived from enterprise data warehouses, including derivation rules
• Indicate how data is derived from operational data store, including derivation rules
• Identify available reports and predefined queries• Identify data analysis techniques (e.g. drill‐down)• Identify responsible people

49
Querying Tools
• SQL is not an analytical language
• SQL‐99 includes some data warehousing extensions
• SQL‐99 still is not a full‐featured data warehouse querying and analysis tool.
• Different DBMS vendors will implement some or all of the SQL‐99 OLAP extension commands and possibly others.

50
On‐Line Analytical Processing (OLAP)
• OLAP is the use of a set of graphical tools that provides users with multidimensional views of their data and allows them to analyze the data using simple windowing techniques
• Relational OLAP (ROLAP)– OLAP tools that view the database as a traditional relational
database in either a star schema or other normalized or denormalized set of tables.
• Multidimensional OLAP (MOLAP)– OLAP tools that load data into an intermediate structure,
usually a three or higher dimensional array. (Cubestructure)

51
From tables to data cubes
• A data warehouse is based on a multidimensional data model which views data in the form of a data cube
• A data cube, such as sales, allows data to be modeled and viewed in multiple dimensions– Dimension tables, such as item (item_name, brand, type), or time (day, week, month, quarter, year)
– Fact table contains measures (such as dollars_sold) and keys to each of the related dimension tables
52
MOLAP Operations
• Roll up (drill‐up): summarize data– by climbing up hierarchy or by dimension reduction
• Drill down (roll down): reverse of roll‐up– from higher level summary to lower level summary or detailed data, or introducing new dimensions
• Slice and dice:
– project and select
53
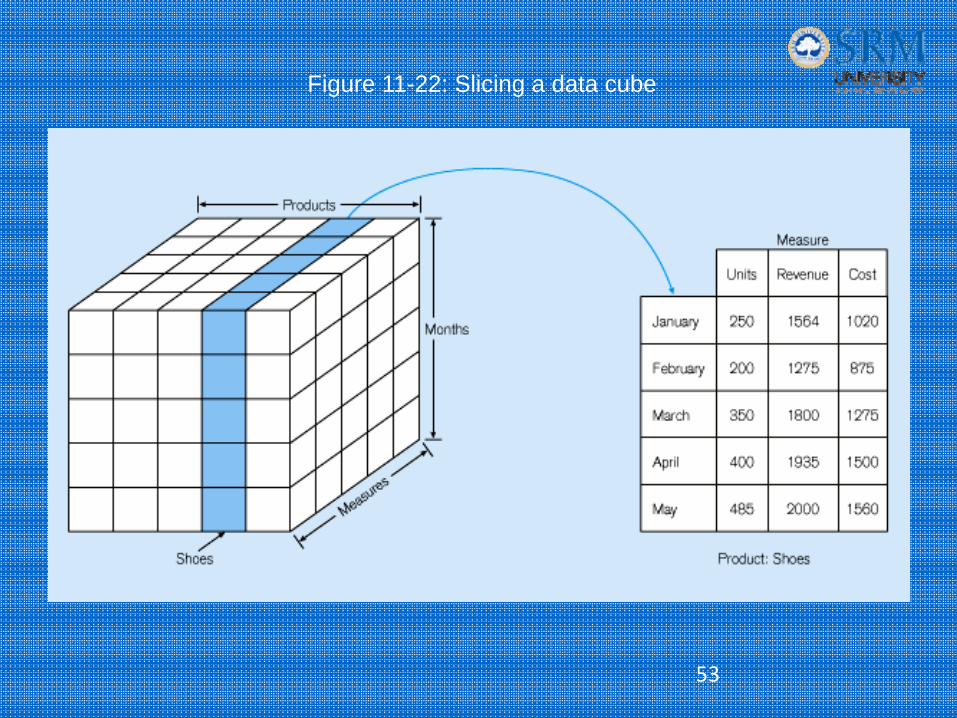
Figure 11-22: Slicing a data cube

54
Figure 11-23: Example of drill-down
Summary report
Drill‐down with color added

55
Data Mining
• Data mining is knowledge discovery using a blend of statistical, AI, and computer graphics techniques
• Goals:– Explain observed events or conditions– Confirm hypotheses– Explore data for new or unexpected relationships
• Techniques– Case‐based reasoning– Rule discovery– Signal processing– Neural nets– Fractals

56
Data Visualization
• Data visualization is the representation of data in graphical/multimedia formats for human analysis

57
OLAP tool Vendors
• IBM• Informix• Cartelon• NCR• Oracle (Oracle Warehouse builder, Oracle OLAP)• Red Brick• Sybase• SAS• Microsoft (SQL Server OLAP)• Microstrategy Corporation

December 26, 2012Data Mining: Concepts and Techniques
58
Data Warehouse vs. Operational DBMS
• OLTP (on‐line transaction processing)
– Major task of traditional relational DBMS
– Day‐to‐day operations: purchasing, inventory, banking, manufacturing, payroll, registration, accounting, etc.
• OLAP (on‐line analytical processing)
– Major task of data warehouse system
– Data analysis and decision making
• Distinct features (OLTP vs. OLAP):
– User and system orientation: customer vs. market
– Data contents: current, detailed vs. historical, consolidated
– Database design: ER + application vs. star + subject
– View: current, local vs. evolutionary, integrated
– Access patterns: update vs. read‐only but complex queries

December 26, 2012
Data Mining: Concepts and Techniques
59
OLTP vs. OLAP
OLTP OLAP users clerk, IT professional knowledge worker function day to day operations decision support DB design application-oriented subject-oriented data current, up-to-date
detailed, flat relational isolated
historical, summarized, multidimensional integrated, consolidated
usage repetitive ad-hoc access read/write
index/hash on prim. key lots of scans
unit of work short, simple transaction complex query # records accessed tens millions #users thousands hundreds DB size 100MB-GB 100GB-TB metric transaction throughput query throughput, response