building audit victorian public libraries
DESCRIPTION
TRANSCRIPT

- 1 -
BUILDING AUDIT OF VICTORIAN PUBLIC LIBRARIES
An independent report for the State Library of Victoria and Victorian public library network
By BBC Consulting Planners
May 2008
55 MOUNTAIN STREET BROADWAY NSW ~ PO BOX 438 BROADWAY NSW 2007 TELEPHONE [02] 9211 4099 ~ FAX [02] 9211 2740
EMAIL [email protected] ~ WEBSITE www.bbcplanners.com.au ABN 061 868 942

- 2 -
Table of contents EXECUTIVE SUMMARY....................................................................... 12 Project aim ............................................................................................... 12 The contribution of public libraries ........................................................... 12 The challenges facing public library buildings ........................................... 13 Are Victorian libraries equipped to face these challenges? ......................... 13
Fit for purpose: Physical condition of public library buildings in Victoria 13 Fit for purpose: Social role of library buildings in their communities ...... 16 Fit for purpose: Is the floorspace of public library buildings adequate? ... 16
Where are libraries located?...................................................................... 18 How are library assets managed?.............................................................. 18 Are there ‘enough’ public libraries in Victoria? .......................................... 19 Recommended strategies .......................................................................... 20
1. Building Area Factor.......................................................................... 20 2. Capacity building .............................................................................. 21 3. Community hubs and learning centres .............................................. 21 4. Annual and bi-annual building audits ............................................... 21
1. INTRODUCTION.............................................................................. 22 1.1 Background........................................................................................ 22 1.2 Aims and research objectives .............................................................. 22 1.3 Study context and policy framework ................................................... 25
1.3.1 The changing role and nature of the public library building........... 25 1.3.2 Framework for Collaborative Action .............................................. 27 1.3.3 Libraries Building Communities.................................................... 27 1.3.4 People places ................................................................................ 28 1.3.5 Snapshot of the Victorian public library network........................... 30
1.4 Previous audits of public library buildings........................................... 30 1.4.1 Audit of Public Library Buildings in New South Wales ................... 30 1.4.2 Previous audits in Victoria ............................................................ 33
1.5 Structure of the report ........................................................................ 34 2. STUDY APPROACH ......................................................................... 36 2.1 Methodology ....................................................................................... 36 2.2 Response rate ..................................................................................... 37 2.3 Study limitations ................................................................................ 38

- 3 -
3. THE ROLE OF PUBLIC LIBRARY BUILDINGS IN VICTORIA.............. 39 3.1 Administration arrangements ............................................................. 39 3.2 The value of public library buildings ................................................... 39
3.2.1 Value of buildings......................................................................... 40 3.2.2 Capital expenditure ...................................................................... 42 3.2.3 Library expenditure as a proportion of total Local Government Authority budget ................................................................................... 45 3.2.4 Summary of future planned expenditure ....................................... 46
3.3 Utilisation of public library buildings .................................................. 47 3.3.1 Size of buildings ........................................................................... 47 3.3.2 Number of visitors ........................................................................ 53 3.3.3 Total operating hours ................................................................... 54 3.3.4 Overview of functional areas ......................................................... 55 3.3.5 Specialist uses of space ................................................................ 59
3.4 The social role of library buildings in their communities...................... 62 3.4.1 Collocation ................................................................................... 66 3.4.2 Joint-use...................................................................................... 68
4. PHYSICAL ASSESSMENT OF BUILDINGS......................................... 71 4.1 Context .............................................................................................. 71 4.2 Respondent views on quality ............................................................... 72
4.2.1 Survey respondents’ perception of library quality .......................... 72 4.2.2 Finest and worst features ............................................................. 77
4.3 Physical condition of public library buildings in Victoria...................... 79 4.3.1 Age of library buildings ................................................................. 79 4.3.2 Design for purpose ....................................................................... 79 4.3.3 Refurbishment.............................................................................. 81
4.4 Flexible and multifunctional buildings ................................................ 84 4.5 Internal accessibility and mobility....................................................... 85
4.5.1 Wheelchair-accessible car parking ................................................ 86 4.5.2 Wheelchair-accessible main entrances .......................................... 87 4.5.3 Wheelchair-accessible levels ......................................................... 87 4.5.4 Wheelchair-accessible aisles ......................................................... 87 4.5.5 Wheelchair-accessible toilets......................................................... 87 4.5.6 Building characteristics connected to compliance.......................... 88
4.6 Lighting .............................................................................................. 89 4.7 Signage .............................................................................................. 90
4.7.1 External signage ........................................................................... 91 4.7.2 Internal signage............................................................................ 91
4.8 Patron comfort.................................................................................... 93 4.9 Compliance with codes and regulations............................................... 93
4.9.1 Building Code of Australia ............................................................ 95 4.9.2 Fire rating .................................................................................... 96 4.9.3 Disability access ........................................................................... 98 4.9.4 Occupational health and safety..................................................... 98
4.10 Community safety........................................................................... 100

- 4 -
4.11 Tenure............................................................................................ 102 4.12 Future proofing............................................................................... 105
4.12.1 Technology ............................................................................... 105 4.12.2 Environmental sustainability .................................................... 105
5. LOCATIONAL CHARACTERISTICS................................................. 108 5.1 Proximity to other community facilities ............................................. 108 5.2 Way finding/street presence ............................................................. 109 5.3 External accessibility ........................................................................ 109
5.3.1 Car parking ................................................................................ 110 5.3.2 Public transport.......................................................................... 111
6. ASSET MANAGEMENT .................................................................. 114 6.1 Planning........................................................................................... 114 6.2 Assessment ...................................................................................... 118 6.3 Maintenance..................................................................................... 118 6.4 Utilities spend .................................................................................. 121 7. PLANNING AND DEVELOPMENT.................................................... 125 7.1 Perceived need for redevelopment...................................................... 125 7.2 Overview of planned library development .......................................... 125 7.3 Timeframe ........................................................................................ 134 7.4 Budget ............................................................................................. 134 7.5 Planned scope of alterations.............................................................. 136
7.5.1 Floorspace .................................................................................. 136 7.5.2 Internal reconfiguration .............................................................. 138
7.6 Delivery ............................................................................................ 140 7.7 Locational characteristics ................................................................. 141 8. LIBRARY SERVICE AUDITS........................................................... 143 8.1 Introduction ..................................................................................... 143 8.2 Observations .................................................................................... 144 9. BENCHMARKING LIBRARY SERVICE PROVISION ......................... 146 9.1 Overview........................................................................................... 146 9.2 People places benchmarks ................................................................ 146 9.3 Testing People places functional area size guide ................................ 146 9.4 Testing People places space standards .............................................. 149 10. CONCLUSION.............................................................................. 152 10.1 A planning benchmark for Victoria.................................................. 152 10.2 Recommended strategies................................................................. 152 REFERENCES................................................................................... 154

- 5 -
APPENDICES .................................................................................... 157 Appendix 1: Survey tool Appendix 2: List of survey respondents Appendix 3: Tabulated data – LGA survey Appendix 4: Tabulated data – Branch survey List of tables Table 3.1: Total insurance value of building (Q.37) .................................... 40 Table 3.2: Value of buildings in an LGA by LGA population (Q.37)............. 41 Table 3.3: Year of valuation (Q.37) ............................................................ 41 Table 3.4: Capital expenditure on branch libraries (Q.40) .......................... 42 Table 3.5: Overall LGA capital expenditure: 2006/07 to 2009/10 (Q.8)...... 45 Table 3.6: Future planned expenditure over next five years (Q.44d) ........... 46 Table 3.7: Gross Floor Area of branch libraries (Q.11) ............................... 48 Table 3.8: LGAs with central operations floorspace (Q.6a) ......................... 48 Table 3.9: Size of LGA central operations floorspace (Q.6b)........................ 49 Table 3.10: Number of levels utilised by library branches (Q.13a) .............. 49 Table 3.11: Publicly accessible levels of library branches (Q.13b)............... 50 Table 3.12: Lift access from street (Q.13d)................................................. 50 Table 3.13: Lift access – within building (Q.13b)*(Q.13d) ........................... 50 Table 3.14: Visitors per week (Q.10) .......................................................... 53 Table 3.15: Number of visitors by library size (Q.10)*(Q.11) ....................... 54 Table 3.16: Operating hours per week (Q.9) .............................................. 54 Table 3.17: Number of visitors by hours of operation (Q.9)*(Q.10).............. 55 Table 3.18: Functional area – Collections (Q.12a) ...................................... 56 Table 3.19: Functional area – Reading and study (Q.12b) .......................... 56 Table 3.20: Functional area – Resource (Q.12c) ......................................... 57 Table 3.21: Functional area – Staff (Q.12d) ............................................... 58 Table 3.22: Functional area – Amenities (Q.12e) ........................................ 58 Table 3.23: Functional area – Other (Q.12f)............................................... 59 Table 3.24: Provision of specialist floorspace (Q.14)................................... 60 Table 3.25: Collocated or joint-use libraries (Q.16a) .................................. 63 Table 3.26: Forms of collocation (Q.16b) ................................................... 66 Table 3.27: Collocated area dedicated to library functions (Q.16c) ............. 67 Table 4.1: Survey respondents’ perceptions of quality (Q.33a–c) ................ 73 Table 4.2: Period of library building construction (Q.19) ............................ 79 Table 4.3: Previous uses of library buildings (Q.21c).................................. 80 Table 4.4: Requirement for major refurbishment/extension in next five years (Q.43a) ............................................................................................ 82

- 6 -
Table 4.5: Most recent major refurbishment by age (year built) of library (Q.19) ....................................................................................................... 82 Table 4.6: Cost of most recent major refurbishment (Q.22a) ...................... 83 Table 4.7: Year access audit undertaken (Q.25b)....................................... 85 Table 4.8: Accessible parking nearby (Q.25e)............................................. 86 Table 4.9: Survey respondents’ rating of level of lighting in library buildings (Q.26)........................................................................................ 89 Table 4.10: Survey respondents’ rating of public information signage (Q.27a–b).................................................................................................. 90 Table 4.11: Compliance with relevant building codes and regulations (Q.25) ....................................................................................................... 94 Table 4.12: Year Building Code of Australia compliance audit undertaken (Q.23) ....................................................................................................... 95 Table 4.13: Year Occupational Health and Safety audit undertaken (Q.32b) ..................................................................................................... 99 Table 4.14: Types of security measures within library branch buildings (Q.30) ..................................................................................................... 100 Table 4.15: Survey respondents’ rating of safety and security measures (Q.31) ..................................................................................................... 101 Table 4.16: Owner of library buildings (Q.18a) ........................................ 102 Table 4.17: Lessor of library building (Q.18b) .......................................... 103 Table 4.18: Cost of lease (Q.18c) ............................................................. 103 Table 4.19: Owner of centralised buildings (Q.6Ca) ................................. 104 Table 4.20: Lessor of centralised buildings (Q.6Ca) ................................. 104 Table 4.21: Energy audit undertaken (Q.28b).......................................... 105 Table 4.22: Energy-saving measures (Q.28a) ........................................... 106 Table 5.1: Proximity to community facilities (Q.34) .................................. 109 Table 5.2: Car parking (Q.35a/c/e) ......................................................... 110 Table 5.3: Wheelchair-accessible parking (Q.25e) .................................... 111 Table 5.4: Proximity to transport (Q.34) .................................................. 111 Table 6.1: Duration of asset management plan (Q.36b) ........................... 114 Table 6.2: Scope of asset management plan (Q.36b) ................................ 115 Table 6.3: Timeframe of asset management plan actions (Q.36b) ............. 115 Table 6.4: Building condition surveys (Q.42) ........................................... 118 Table 6.5: Annual maintenance costs (Q.38) ........................................... 119 Table 6.6: Breakdown of maintenance expenses (Q.38)............................ 120 Table 6.7: Estimated backlog of planned maintenance (Q.39) .................. 121 Table 6.8: Summary of utilities expenditure (Q.29).................................. 121 Table 6.9: Quarterly expenditure on electricity (Q.29).............................. 122 Table 6.10: Quarterly expenditure on gas and water (Q.29) ..................... 122

- 7 -
Table 7.1: Planned library development in Victoria (Q.7).......................... 126 Table 7.2: Location of planned library development (Q.7)......................... 127 Table 7.3: Timeframe of library development (Q.7) ................................... 134 Table 7.4: Capital budget (Q.7)................................................................ 135 Table 7.5: Internal fit-out budget (Q.7) .................................................... 136 Table 7.6: Proposed additional floorspace (Q.7) ....................................... 137 Table 7.7: Change in Gross Floor Area after redevelopment (Q.7)............. 138 Table 7.8: Type of alterations planned (Q.7) ............................................ 139 Table 7.9: Collocated or joint-use facilities planned (Q.7)......................... 140 Table 7.10: Locational characteristics of new buildings planned .............. 142 Table 9.1: Comparison of core functional areas ....................................... 147 Table 9.2: Victorian Target Collection Factor (TCF) .................................. 148 Table 9.3: Relationship between floorspace provision and benchmarks – library services ....................................................................................... 149 Table 9.4: Testing the People places Building Area Factor........................ 151 List of figures Figure 4.1: Survey respondents’ perceptions of quality (Q.33a–c) ............... 73 Figure 4.2: Survey respondents’ perceived finest attributes of library buildings (Q.33d) ...................................................................................... 77 Figure 4.3: Survey respondents’ perceived worst attributes of library buildings (Q.33e) ...................................................................................... 78 Figure 4.4: Type of work undertaken at last major refurbishment (Q.22b).. 84 Figure 4.5: Survey respondents’ satisfaction with lighting and signage (Q.26, Q.27a–b) ........................................................................................ 90 Figure 4.6: Compliance with relevant building codes and regulations (Q.25) ....................................................................................................... 94 Figure 4.7: Compliance with relevant codes and regulations by building age (Q.25)*(Q.19) ............................................................................................ 95

- 8 -
List of case studies Case study 1: Caroline Springs Library, Melton Library and Information Service ..................................................................................................... 23 Case study 2: Kerang Library, Gannawarra Library Service ....................... 31 Case study 3: Sydenham Library, Brimbank Libraries............................... 43 Case study 4: Drouin Library, West Gippsland Regional Library Corporation .............................................................................................. 51 Case study 5: West Footscray Library, Maribyrnong Library Service .......... 64 Case study 6: Wheelers Hill Library, Monash Public Library Service .......... 69 Case study 7: Wangaratta Library, High Country Library Corporation ....... 75 Case study 8: Goroke Library, Wimmera Regional Library Corporation ...... 92 Case study 9: Nathalia Library, Goulburn Valley Regional Library Corporation ............................................................................................ 107 Case study 10: The Age (Broadmeadows) Library, Hume Global Village Library Service ....................................................................................... 112 Case study 11: East Melbourne Library, Melbourne Library Service......... 116 Case study 12: Carnegie Library, Glen Eira Library Service ..................... 123

- 9 -
Abbreviations/definitions
ABS Australian Bureau of Statistics
Amenities areas foyer; lobby; corridors/circulation space; public, staff and accessible toilets; restrooms; plant equipment; storage (for maintenance equipment); and maintenance areas
BCA Building Code of Australia
Collection areas books on shelves; periodicals; non-print materials; toy library; virtual and digital resources
Collocation multiple services sharing a building, with separate areas for each service These areas need not be physically separated by walls. Collocated libraries typically bring together other Council-related services such as Council Chambers/offices, community centres, arts centres, youth facilities, and/or one-stop-shop services. More recently, collocated libraries have been developed with other government services such as community health centres, home and community care centres, employment services or community technology centres.
ERP Estimated Resident Population
Functional floorspace
six broad types of core functional areas are identified by People places – collection areas, reading and study areas, resource areas, staff areas, amenities and storage areas, and additional service areas
GFA Gross Floor Area The sum of the floor area of each storey of a building, measured from the internal face of external walls, or from the internal face of walls separating the building from any other building, and includes (a) the area of a mezzanine within the storey but EXCLUDES: (b) any area for common vertical circulation, such as lifts and stairs, and (c) vehicular access, loading areas, garbage and services, and (d) plant rooms, lift towers and other areas used exclusively for mechanical services or ducting, and (e) car parking (including access to that car parking), and (f) any space used for the loading or unloading of goods (including access to it), and (g) terraces and balconies, and (h) void spaces. It includes both public and staff spaces and, for this survey, excludes Library Service Level administration space (both on and off-site).

- 10 -
Joint-use two or more distinct library service providers serve their client group in the same building, the governance of which is cooperatively arranged between the separate authorities For example, a joint-use library may be developed between a Library Service and a School to operate a library serving both high school students and the broader community. The service is shared with pooled funding provided by both agencies to cover the capital and recurrent costs of the service.
LGA Local Government Authority
RAF Relative Area Factor The People places guidance identifying the relative allocation of floorspace between the core functional areas
Reading areas
meeting areas; study areas; browsing, display and information areas/exhibition space; young adult area; multi-purpose rooms (training, AV); children’s storytelling area; specialist genre collection area; specialist rooms (e.g. local and family history)
Resource areas returns and enquiries desk; service desk; internet terminals; catalogues; printers; photocopiers; vending machines; telephones
SLV State Library of Victoria
Staff areas back of house (e.g. back workrooms, lunch rooms, offices), including staff work areas, office space and storage (for archival materials)
TCF Target Collection Factor The People places guidance identifying space required to house a library’s materials collection

- 11 -
Acknowledgements The project was undertaken for the State Library of Victoria, in partnership with the Victorian public library network, and under the auspices of the Library Board of Victoria. The project was undertaken by James Lette with the assistance of Kathryn Henry. The project was reviewed by Sharyn Briggs of Briggs and Mortar. The team thanks Sharyn wholeheartedly for her valuable contribution. The authors would like to extend their thanks to the following: State Library of Victoria Viclink – Victorian Public Library and Information Network Municipal Association of Victoria Local Government Victoria, Department of Planning and Community
Development Libraries which participated in the pilot supported by their Councils:
− Eastern Regional Libraries: Ferntree Gully Library and Knox City Council
− Hobsons Bay Libraries: Altona Meadows Library and Hobson Bay City Council
− Goldfields Library Corporation: Kangaroo Flat Library and Greater Bendigo City Council
− Gannawarra Library Service: Kerang Library and Gannawarra Shire Council
− West Gippsland Regional Library Corporation: Warragul Library and Baw Baw Shire Council
Local government staff from Banyule City Council: Arun Chopra and Paul Bruhn who reviewed the survey questions
And an especial thanks to all of the public library staff who contributed their valuable time and effort into completing the extensive surveys. A complete list of all libraries which participated in the survey is included in Appendix 2.

- 12 -
EXECUTIVE SUMMARY
Project aim This report documents the findings of the 2007 Building Audit of Victorian public libraries undertaken for the Advisory Committee on Public Libraries, a committee of the Library Board of Victoria; the Victorian public library network; and the State Library of Victoria. It is one of a suite of statewide projects conducted under the auspices of the Library Board of Victoria to assist in the development of the Victorian public library network. The Audit of Victorian public library buildings was undertaken to identify the current state of Victorian public library buildings and provide a tool for library service managers to assess their suitability to meet community needs. The project utilises People places: A guide for public library buildings in New South Wales (Library Council of New South Wales 2005), a best practice, comprehensive guide to designing and building suitable structures for libraries to enable maximum usage by residents and the general public. This report covers the five key areas of floorspace and functions; building design; locational factors; building management and maintenance; and information on planning and development procedures. The Audit was undertaken via an online survey. A response rate of 94.9% of Local Government Authorities (LGAs) and 96.5% of branch libraries was achieved. In total, 75 LGAs and 244 branch libraries responded.
The contribution of public libraries Libraries make a fundamental contribution to our communities. The Audit information identifies1 that: The total value of library buildings in Victoria is $522 million –
approximately $104 per person. The median value of library buildings is $1.5 million, with values spanning a wide range – two-thirds are worth over $1 million and 10% are valued at less than $250,000.
The 45 Victorian library services receive funding of $144,932,834 per annum, or $29 per capita (NSLA 2007:11). We understand that this makes Victoria the lowest funded State in Australia.
There was a total capital expenditure of $14,437,881 on 89 branch libraries in 2006/07. The median value per branch was $10,500, and the average was $162,223. If it was assumed that the balance of branches made similar levels of capital expenditure, up to $40 million per annum could be spent on library buildings in Victoria. Limited confidence is held with the accuracy of this estimate given the variations in the data underlying such an assumption, and fluctuations year on year.
In the year ending 30 June 2004, there were approximately 24,407,000 visits to public libraries in Victoria, with 2,538,812 registered borrowers (51.5% of the 4,932,422 persons usually resident in Victoria) (ABS 2005:14).
Victorian libraries lend 48,743,783 items per annum (or approximately 19 per member), and deal with 2,580,862 enquiries (NSLA 2007:8).
1 with some limitations as noted in the body of the report

- 13 -
On average, every day every Victorian public library will lend about 500 items, receive nearly 270 visits and respond to nearly 30 reference enquiries (Library Board of Victoria, Executive Summary, 2005:5).
The challenges facing public library buildings However, libraries are facing new challenges, as the demographic character of the community changes and social trends alter, including: ‘population and demographic mix changing more rapidly than ever
before; Information and Communications Technology (ICT) reconfiguring the
nature of physical space, communications and movement; education moving out of the institutions to affect the whole of society;
and leisure, recreation and personal development increasingly fuse in a more
individualistic culture’ (CABE & Resource 2003:4). User needs have changed dramatically over the past decade, whereby local and larger public libraries are no longer a facility to solely borrow books or study. In response, libraries need to change physically, as well as changing the manner in which they operate. The changing needs of the community have meant many library buildings no longer meet contemporary needs or current standards. A modern ‘public library needs accessible, generous and attractive buildings containing different but connected spaces’ (Bundy 2006:1).
Are Victorian libraries equipped to face these challenges? The relevance of libraries to today’s community is unquestionable, evident in their high levels of usage and attraction to a broad range of users from all ages and backgrounds. A key question to be answered by the Audit was whether existing library buildings are ‘fit for purpose’ and able to meet these challenges.
Fit for purpose: Physical condition of public library buildings in Victoria Many commentators have identified a ‘renaissance’ in which public libraries have reinvented themselves in the past decade, revising their role as beacons for civic pride, social and economic regeneration (Worpole 2005:5). At the same time, this has resulted in a resurgence of building activity in the recognition that ‘old, tired, outdated buildings are the worst advertisement for our profession; well maintained, vibrant, relevant buildings the best’ (Mackenzie cited in Bundy 2004:16). Consistent with international trends, in 2006 Bundy identified that local government across Australia was endeavouring to replace and rebuild libraries, with about 200 new library buildings and rebuilds having been constructed between 2000 and 2006 – many of them excellent and of world standard (Bundy 2006:2). Victoria reflects this global trend, with a number of buildings built recently, and a number more planned for construction over the next five years.

- 14 -
The Audit identified that: 19 new branch libraries are planned; 25 existing libraries are to be completely replaced (either at the same site
or a new site); and 27 branch libraries are to be refurbished.
However, the scope of the task is large. The majority of Victorian building stock is old, with just 12.7% constructed after the year 2000. The largest proportion was built in the period 1960–1979 (33.3%). The Audit confirms that the local government landscape in which public libraries operate is constrained by infrastructure backlogs, and competition between public libraries and a plethora of other local services which require funding. The ongoing development of public libraries in Victoria is constrained by available funding. The Audit further identifies that: More than one-third of Victorian library branches have not been
refurbished since being built; 58.6% of all branches have undergone major refurbishment. Approximately two-thirds (63.9%) of these refurbishments took place in the past seven years.
The majority of public libraries in Victoria were purpose built (60.5%). However, this does not appear to be the trend with new buildings, as many of the more recently established libraries in Victoria have not been purpose built. Approximately one-quarter (25.1%) of all non-purpose built libraries were established in the past seven years. It is probable that this is due to the limited availability of capital funding for new buildings. Many newer library buildings have been converted from Council Chambers/Council offices or from existing commercial and retail spaces.
This has an affect on floorspace, as library buildings which are purpose built tend to have a larger gross floor area (GFA) than those that were not originally built to contain a library.
Disabled accessibility in all respects is generally the exception rather than the rule. Disabled accessibility (particularly wheelchair accessible toilets and adequate aisle widths between shelving) is less compliant in older libraries. In an LGA there is often not one library branch that is wheelchair accessible in all respects. This has important ramifications for both patrons and the employment of people with a physical disability in Victorian libraries.
There are quite a large number of libraries where compliance with fire rating, disability and OH&S is not known or not achieved. The purpose of the Building Code of Australia (BCA) audit does not always appear to be understood.
Older libraries, particularly those built pre-1940, are least likely to comply with codes and regulations; the newest libraries are most likely to comply with codes and regulations. Compliance with codes and regulations is generally higher among those LGAs with relatively high maintenance expenditure.

- 15 -
It is apparent that some libraries are ‘working harder’ than others. The number of people visiting libraries in Victoria ranged from 0.67 to 196.7 people per hour. The median was 1,636 visitors per week. The number of visitors per week on average correlates strongly with the GFA of public libraries.
The Audit informed the above quantitative data with a range of qualitative questions assessing the opinions of branch librarians about the physical building: its internal layout and design; the overall standard of their library branches; and the finest and worst attributes of their building. These views may or may not reflect the views of other stakeholders, such as the library service manager who has responsibility for management of the building and strategic decisions about its future. However, they add to the overall understanding of the state of Victoria’s public library buildings. This is borne out by the Audit’s finding that a respondent’s perception of the quality of the library building is a key factor in their perception of the overall standard of their library branch. The results of these qualitative questions were largely positive: Almost one-third (31.8%) of respondents perceived the overall standard of
their branch as being excellent, and more than half (57.9%) gave an overall rating of satisfactory.
One-quarter (25.4%) of respondents perceived the quality of their physical building to be excellent and more than half (54.9%) rated their building as satisfactory.
One-quarter (24.2%) perceived their library’s internal layout and design to be excellent, and approximately half (55.3%) rated as satisfactory.
In order of importance, the following are important features of a library building: location, natural light, internal layout, adequate size/space, and accessibility. In order of importance, the following design features affect negative views of a library building: inadequate size/space, poor internal layout, aged/poor building condition, and the quality of its facilities.
Almost nine out of ten branches (88.1%) described the level of lighting within the library as either satisfactory or excellent. A number noted that lighting improvements were a key consideration of their recent refurbishments.
Almost two-thirds (65.4%) of respondents rated their library’s external signage as either Satisfactory or Excellent. More than three-quarters of respondents (77.4%) described the internal signage within their library branch as either satisfactory or excellent, a higher proportion than ratings for external signage. The vast majority of libraries that gave a rating of poor and provided additional comments indicated that new or improved internal signage was either planned, or was currently being undertaken.
The link between a library’s community value and its physical design and layout is well established in the literature. If it’s not appropriately designed for need, it won’t be as utilised.

- 16 -
Fit for purpose: Social role of library buildings in their communities A concept gaining increasing favour is a library being developed as a key element in community hubs and learning centres. The Libraries Building Communities project (Library Board of Victoria, Report 2, 2005:46) envisages that communities could build hubs that house a range of services such as library services, children’s services, medical centres, maternal support groups, drop-in centres, and other learning and community activities. There are significant advantages emerging in collocation: ‘a single large building can be easier to construct, to keep secure and to maintain than several smaller buildings. Sharing car parks, foyers and other common spaces can make economic sense. Collocated facilities may be more convenient for the community.’ Some local authorities are able to include revenue generating components in a development, such as a cafe, bookshop or gymnasium. ‘More and more libraries are being constructed in shopping centres, often as a result of the deal between the local authority and the developer’ (Jones 2004). The Victorian experience revealed by the Audit does not generally reflect this trend. Joint-use libraries are as uncommon in Victoria as they are in Australia generally (just 9.8% of branches). Collocated libraries are much more common, comprising a significant proportion of libraries (52.3%). In reality, however, of those libraries that are collocated, about half are collocated with other local government uses and could not be described as hubs. Only 17.3% were collocated with a community centre, and just 4.7% with a community health centre. Only two were collocated with some form of learning centre/adult education service. While 93.9% provided a children’s storytelling area or young adult area, none were associated with a broader youth service. Collocated libraries do appear more likely to have access to community meeting space. This is not to say that libraries are not making the most of their existing assets in this regard, providing a range of specialist services within their remit as described in Section 3.3.5. Collocation of newer libraries is very common, and this trend is appearing with new library buildings. It is a trend which will only be met over time with the redevelopment of existing building stock.
Fit for purpose: Is the floorspace of public library buildings adequate? There is nearly 145,000 sq m of library floorspace in Victoria, in 247 branch buildings. The average size of a library is 595 sq m (median size of 400 sq m). Libraries are generally sized between 250 and 1,000 sq m (44%). 84% of branches are located on a single level of a building, predominately the ground floor. There is vast variation in the proportional space allocation of functional areas, even in newer libraries. Some of the older (and particularly smaller) libraries have virtually all of their proportional functional floorspace dedicated to collection areas. Many older libraries have low proportions of floorspace for staff areas compared to the Victorian average, and some have none. There is a tendency in newer areas to much larger libraries, generally over 1,000 sq m, and up to 3,500 sq m. Currently, only five libraries (2.1%) are over 2,000 sq m in size.

- 17 -
Thirty-three branches (13.8%) are less than the 139 sq m GFA minimum size recommended by People places for a public library building. All but one of these branches is in rural or regional LGAs; this is related to the very high numbers of smaller libraries still serving rural areas. Despite perceptions that less space is needed in libraries, there is no evidence that this is true. Library buildings need to provide different types of spaces to meet the diverse needs of a variety of different users. The literature suggests that the number of functions preformed by the modern library, and consequently the number of spaces within it, is increasing. This is further confirmed by the Audit, which identifies that libraries provide floorspace regularly used for a large variety of specialist services (either exclusively or on a shared basis). Just under half of branch libraries (45.2%) contain specialist multi-purpose areas. Most frequently this included: a children’s storytelling area (93.9% of branches); computer labs/internet areas (78.6%); an area for young adults (70.8%); and office space (77.8%).
No other type of specialist space was provided by more than half of library branches. Despite community demands for a wide range of functions, few branch libraries (15.2%) have the ability to subdivide multi-purpose areas within their building, such as through the use of wall partitions. People places identified six broad types of core functional areas in public libraries. There is vast variation in the proportional space allocation of floorspace for functional areas, even in newer libraries. Newer libraries are better planned in terms of functional areas. The median values for each type of functional area are identified in the following table:
Collection
areas
Reading and study
areas Resource
areas Staff areas Amenities
areas
Median sq m 170 50 35 44 50
Distribution of GFA mean 42% 18.2% 9.9% 14.7% 15.2%
The most significant observation arising from an analysis of the distribution of functional areas within Victorian libraries is that some spaces are over-represented relative to the area of collection areas (or conversely, it could be said that collection areas are under-represented relative to other types of functional areas). This over-representation occurs in all areas other than staff areas, which sit at the recommended 35% of the collection areas space. Reading and study areas have 43% of the recommended space compared to 30% in People places; resource areas have 23% compared to a recommended 15%; and amenities areas have 36% compared to a recommended 20%. Accordingly, the report further considered whether collection areas are under-represented in Victoria, or whether the other functional areas are relatively over-represented. It was concluded that the size of collection areas in Victoria is substantially smaller (72.3%) than what is provided for by the space standard for collections in People places. This can be attributed to

- 18 -
People places being developed for application to new libraries, which have more open designs, and a vertically reduced number of shelving bays.
Where are libraries located? People places identifies a number of key locational criteria to be considered in determining the most appropriate site for a public library, which have been examined in the Audit. In respect to these, the Audit reveals: The connection between local government and public libraries clearly
translates into locational choice. As expected, a high proportion of libraries were located with or near other Council-provided services (such as administration) and spaces (such as other cultural, recreational or sporting facilities).
Surprisingly, Audit responses do not clearly support the growing trend identified in literature of public libraries in both Australia and overseas locating in shopping centres. However, 13.9% of branches are located adjacent to one, and a further 26.6% are within walking distance. About half were located on a main street (shopping/business precinct).
Accessibility to schools is lower than expected, with just less than half being located within walking distance (400 metres) of a school. A small number (5.7%) were located within or adjacent to a school. Nine libraries indicated that they were facilities jointly used by a school.
Libraries collocating with schools appear to be less accessible to traditional foci such as main streets and shopping precincts.
Almost all libraries (95%) are located within walking distance of car parking (86.5% being adjacent). This car parking was provided free of charge at almost all libraries (96.3%).
Libraries in traditional main street foci often have inadequate parking, and good accessibility to community foci and facilities could be considered a trade-off against this. Approximately one-quarter (27.9%) indicated that the current provision of car parking available near the library was inadequate.
The proportion of libraries located within close proximity to public transport (61.1% within 400 metres), while still significant, was notably less than those libraries accessible by car. Libraries are significantly more likely to be located near a bus stop than a train station.
Libraries are generally located on the ground floor with street frontage (94.3%).
Newer libraries are better planned in terms of accessibility of location.
How are library assets managed? In Victoria, public libraries are largely the responsibility of local government, which must undertake the construction and maintenance of these buildings from their annual budgets, with the assistance of statewide public library grant funding. Approximately half (55.7%) of libraries have some form of asset management plan for their building. A number of Councils operated a generic asset management plan for all buildings, in which the library was included.

- 19 -
Building condition surveys are undertaken by library services or local authorities for almost four-fifths (79.1%) of Victorian library branches. In terms of planning and maintenance, the Audit identified: With rare exception, there is substantial ongoing effort and expenditure
being put into the maintenance and upgrading of the standard and provision of libraries to communities.
At least $5.7 million is spent each year on maintaining public library buildings in Victoria. This figure is expected to be notably higher, as 34 libraries did not provide their annual maintenance expenditure.
On average, approximately $27,232 is spent on the maintenance of each public library branch. On average, $43.50 is spent on maintenance per sq m of library floorspace.
Some older libraries (even those built in the 1980s) are incurring high maintenance costs.
Existing and planned investment in library infrastructure, and in many cases maintenance, is often lower than average in rural areas.
There is vast variation in the cost of utilities to libraries. Many libraries have not undertaken energy audits. On average, libraries spend about $4,600 on electricity, $1,100 on gas, and $500 on water (approximately $5,500 per quarter in total). Utilities expenditure is correlated with floorspace, and, on average, $8 per sq m on utilities.
Victorian libraries were planning to undertake expenditure on capital building of nearly $46 million over the next five years and expenditure on internal assets (excluding book stock and other resources) of approximately $5.7 million. The anticipated average capital building budget (where provided) for those libraries planning to undertake work was approximately $1.53 million and the internal works $249,000; however, these ranged from $7.5 million to $100 in the case of capital building works and $1.75 million to $200 in the case of internal assets.
The average cost of library refurbishment was approximately $520,000; however, this average is skewed by a number of large refurbishments. More than half (55.5%) of library branches whose buildings had been refurbished indicated that the total cost of refurbishments was less than $500,000.
Are there ‘enough’ public libraries in Victoria? A range of planning benchmarks, such as those in People places, have been discussed and applied in this report. While notable variation within the State makes it difficult to generalise, in comparison to these planning benchmarks it is clear that the current level of floorspace provision in Victoria is less than adequate. Nearly half of library services do not meet the People places suggested minimum standard of provision. Overall, the current provision of floorspace in Victoria is 28 sq m per 1,000 people, which is less than the minimum required, which has been estimated to currently be 30 sq m per 1,000 people. The Audit has broadly confirmed the accuracy of the planning benchmarks utilised by People places and has not revealed any information which suggests that they should be altered. A number of discrepancies do exist, and have been noted in the analysis.

- 20 -
We have, however, paid less attention to service-based and population-based benchmarks outlined in People places in recommending a State benchmark, as the testing undertaken suggests that they are more appropriate for assessing and designing new buildings, rather than retrospectively assessing existing buildings. For example, a number of the design standards upon which the service-based benchmark is predicated are not appropriate when applied to a building designed 20 years previously.
Recommended strategies
1. Building Area Factor We recommend that planning standards based upon the Building Area Factor in People places be relied upon. It is recommended that these be adopted for use in Victoria, namely: Less than 20,000 – provide 42 sq m per 1,000 population Between 20,001–35,000 – provide 39 sq m per 1,000 population Between 35,001–65,000 – provide 35 sq m per 1,000 population Between 65,001–100,000 – provide 31 sq m per 1,000 population More than 100,000 – provide 28 sq m per 1,000 population
These rates have been analysed in the Victorian context, and it is concluded that: Provision in small LGAs (i.e. those with less than 10,000 population) and
LGAs with between 65,001–100,000 population exceeds the benchmark. Provision in LGAs between 20,001–35,000 population matches the
benchmark. All other LGA sizes fall short of the benchmark.
We also recommend that a State benchmark of 30 sq m per 1,000 population be adopted as a target. It may also prove appropriate to develop a rural and a metropolitan benchmark, and it is further suggested that consideration be given to this at a later date. These standards should form the starting point for determining what need might be present in a community. They must be informed by other factors about local need. Strategies for improving provision in Victoria should initially aim for parity with the current State average of 28 sq m per 1,000 population in those LGAs which fall short of this target. We regard this as an equitable approach. This will involve the provision of an additional 19,039 sq m of gross floorspace. In the longer term, strategies should seek to achieve a target of 30 sq m per 1,000 population, and meeting the People places BAF as relevant to an LGA’s population size. This will involve the provision of an additional 24,184 sq m of gross floorspace (or 5,145 sq m more than the initial target). These figures do not include an allowance for projected population growth.

- 21 -
2. Capacity building The Audit results also point to a need for a range of capacity building activities to be undertaken. Topics identified by the Audit include education on: Internal library planning, e.g. internal layout and design, and functional
space allocation. We suggest that this involve activities which propagate the concepts established within People places.
The purpose of the Building Code of Australia and other applicable building codes and regulations. Priority attention should be given to improving disability access compliance, especially given the critical role of libraries in community building and fostering social inclusion. An early target is for each LGA to have one branch which is fully accessible in all respects. This is not currently the case in a number of LGAs.
The value of energy audits, their process, and the savings which can be achieved in utility costs.
Further detailed guidance could be provided to library services either through documentation or seminars. Documentation developed need not be a formal report, but could be in the form of a circular or an article in a magazine.
3. Community hubs and learning centres The move towards the concept of libraries as community hubs and learning centres should be further promoted and facilitated. A useful starting point would be to undertake a more detailed review of existing collocated libraries which act as hubs, to identify their advantages and disadvantages, any barriers to their development, implementation and management, and seek successful ways to promote their implementation. This would examine not just how hubs can be achieved in new libraries, but more importantly given the sector funding constraints, how existing infrastructure can be adapted to the task. Initial guidance may be found in some of the case studies contained in this report.
4. Annual and bi-annual building audits It is further recommended that, at a State level, this Audit be undertaken every two years in order to monitor progress and change in Victoria’s library building stock. Internal updates of the individual LGA audit reports should be prepared by each library service annually.
- 22 -
1. INTRODUCTION
1.1 Background This report documents the findings of the 2007 Building Audit of Victorian public libraries undertaken for the Advisory Committee on Public Libraries, a committee of the Library Board of Victoria; the Victorian public library network; and the State Library of Victoria. It is one of a suite of statewide projects conducted under the auspices of the Library Board of Victoria to assist in the development of the Victorian public library network. The project utilises People places: A guide for public library buildings in New South Wales (Library Council of New South Wales 2005), a best practice, comprehensive guide to designing and building suitable structures for libraries to enable maximum usage by residents and the general public. This report covers the five key areas of floorspace and functions; building design; locational factors; building management and maintenance; and information on planning and development procedures.
1.2 Aims and research objectives The aim of the project was to conduct a comprehensive Audit of Victorian public library buildings to identify the current state of Victorian public library buildings and provide a tool for library service managers to assess their suitability to meet community needs. The outcomes of the Audit are: A statewide report to provide:
− an overview and trend analysis of Victorian public library service buildings with conclusions about the current state of Victorian public library service buildings;
− a current ‘snapshot’ of library floorspace functions and building structure by library service branch against the informally accepted industry standards outlined in the key document People places: A guide for public library buildings in New South Wales;
− current planning and development, and the estimated value of Victorian public library buildings; and
− case studies of Victorian public library buildings, as selected by a representative selection panel.
Individual Local Government Authority (LGA) audit reports to provide library service and branch level data as well as benchmarking against the informally accepted industry standards outlined in People places. These audit reports enable public libraries in Victoria to compare their library buildings with published standards.
It is intended that this report will provide a basis for improvements to Victorian public library buildings in terms of floorspace, capacity, safety regulations, and services provisions of the future.

- 23 -
Case study 1: Caroline Springs Library, Melton Library and Information Service
(Photographer: Emma Cross)
Gross floor area: 2,500 sq m
User catchment: Melton East Corridor At present approaching 40,000 people with growth expected to 60,000 within the next 10 years
Cost: Approx $12 million including fit-out and establishment collection of 35,000 items
Architect: Suters Prior Cheney Architects 26 Liddiard Street Hawthorn VIC 3122 Principal design architect: Mark van den Enden
Date completed: January 2008
Usage: 500–600 visitors per day
Caroline Springs Library is an outstanding example of the modern trend for public libraries to be community hubs, collocated with other community services and offering users excellent facilities and resources in a pleasant and relaxing environment. The library is an iconic structure inspired by local geographic features and presenting a unique frontage to the street, set in an integrated landscape and incorporating excellent access from two entry points. The building uses natural light extensively and its interior form and fittings reinforce and complement the external design features to create a space that is light-filled, bright, airy; comfortable and visually interesting.

- 24 -
Caroline Springs Library continued The building also serves as the school library for the adjacent senior campus of the Caroline Springs Secondary College; houses the Caroline Springs College Director; Council’s customer service centre, which is open at all times when the library is open; seven community meeting spaces with capacity from 5–70 people; a computer training facility for up to 50 people; an audiovisual studio and a cafe.
(Photographer: Emma Cross)
It also incorporates the latest in ICT equipment into its spaces and functions, including the latest in self-serve RFID technology; a teen lounge that has three Playstation3 consoles; audiovisual suites for use by the public to enable production of audio and video works; built-in projection and sound capacity into the community spaces; public wireless internet connectivity; and an integrated booking and print management system for all public PC facilities. In addition, all shelving within the library is moveable and modular to enable maximum flexibility for use of the library spaces.
(Photographer: Emma Cross)

- 25 -
1.3 Study context and policy framework
1.3.1 The changing role and nature of the public library building Reports of the death of the library have been greatly exaggerated… The technological revolution of the 1980s and 1990s was widely seen as sounding the death knell for the public library as we knew it… These predictions have proved unfounded… Imaginatively designed and responsive public library services can play a pivotal role in promoting greater social cohesion and a stronger sense of civic pride and local identity (Worpole 2005:5). Libraries are facing new challenges; as the demographic character of the community changes and social trends alter, so do the requirements for public library buildings. The United Kingdom’s Council for Museums, Archives and Libraries noted in 2003 that population and demographic mix was changing more rapidly than ever before; information and communications technology was reconfiguring the nature of physical space, communications and movement; education was moving out of the institutions to alter the whole of society; and leisure, recreation and personal development were increasingly fusing in a more individualistic culture (CABE & Resource 2003:4). Regardless of these changes, there is no consideration that the physical library building is a thing of the past. Indeed the modern public library has been fairly described as the anchor of the community, and by Australian social commentator Hugh McKay, as the ‘new village green’ (Bundy 2006:1). There have been many recent attempts to identify the value of the public library. Cox (2000) undertook a landmark study in 2000 which showed that libraries contribute to social capital in many ways. The United Kingdom’s Department for Culture, Media and Sport, among many others, noted in 2003 that libraries are acknowledged as safe, welcoming, neutral spaces open to all in the community. Various studies are also finding ways to measure the economic contribution of libraries, including McCallum and Quinn (2001) and dmA Planning, Research and Management Services (2007). In 2005, the State Library of Victoria undertook the Libraries Building Communities (LBC) project, the first comprehensive Australian study of the value the public libraries add to their communities (Library Board of Victoria 2005). This project noted that ‘public libraries hold an important place in people’s hearts’ and make a fundamental contribution to our communities (Audit Commission UK cited in Library Board of Victoria, Report 1, 2005:5). In line with community building as one of the key strategic directions of the Victorian Government, libraries provide space where citizens can gather and work on personal and community problems. They also ‘provide a wide range of innovative, creative programs that bring citizens together and break down the barriers of age, ethnicity, culture, socio-economic status, language and geography’ (Kranich cited in Library Board of Victoria, Report 1, 2005:16). In the words of People places (Library Council of New South Wales 2005:7), ‘public libraries are one of the most well used educational, cultural and social facilities available within our community. The relevance of libraries to today’s community is considered to be evident in their high levels of usage and attraction to a broad range of users from all ages and backgrounds’, as

- 26 -
evidenced in Victoria by the LBC project which identified that ‘on average, every day every Victorian public library will lend about 500 items; … receive nearly 270 visits from a total of 2.5 million registered users (over half the Victorian population) and respond to nearly 30 reference enquiries’ (Library Board of Victoria, Executive Summary, 2005:5). Consequently, it is not surprising that many commentators have identified a ‘renaissance’ in which public libraries have reinvented themselves in the past decade, revising their role as beacons for civic pride, social and economic regeneration (Worpole 2005:5). At the same time, this has resulted in a resurgence of building activity in the recognition that ‘old, tired, outdated buildings are the worst advertisement for our profession; well maintained, vibrant, relevant buildings the best’ (Mackenzie cited in Bundy 2004:16). Consistent with international trends, in 2006 Bundy identified that local government across Australia was endeavouring to replace and rebuild libraries; with about 200 new library buildings and rebuilds having been constructed between 2000 and 2006 – many of them excellent and of world standard (Bundy 2006:2). However, he also identified at least 400 libraries waiting to be replaced or rebuilt. In Victoria, public libraries are largely the responsibility of local government, which must undertake the construction and maintenance of these buildings from their annual budgets, with the assistance of statewide public library grant funding. The changing needs of the community have meant many library buildings no longer meet contemporary needs or current standards. A modern ‘public library needs accessible, generous and attractive buildings containing different but connected spaces’ (Bundy 2006:1). Recurring themes throughout the literature regarding the necessities of modern public library buildings include user needs, space and costs (Jones 2004). The local government landscape in which public libraries operate is constrained by infrastructure backlogs, and competition between public libraries and a plethora of other local services which require funding. ‘With changing demographic and social trends, ever-increasing financial constraints for government and rapidly changing information technology, the design and function of libraries must change to meet these and new other challenges’ (Library Council of New South Wales 2005:7). User needs have changed dramatically over the past decade, whereby local and larger public libraries are no longer a facility to solely borrow books or study. Libraries are now more people focused, with extra services and facilities for the local community. They are, in a way, becoming a hub for community life. Jones (2004) identifies the differences between ‘user needs’ and ‘user wants’ within local libraries, and asserts it is a mistake to compare local libraries without assessing the real needs of the people who utilise the library. There is no longer a one-size-fits-all approach to library planning, and this had been recognised over the past few years. Space requirements are usually limited by the location of the current or proposed library and perhaps the city it is in. Space for development in metropolitan areas is no longer available at reasonable prices as it was in the past. However, with library services changing, there are now greater demands for space within local libraries. Scarcity of land has encouraged local authorities to collocate more than one facility on the same site, often with other State or municipal services or community activities (Jones 2004). There are significant advantages emerging in collocation: ‘a single large building can be easier to construct, to keep secure and to maintain than

- 27 -
several smaller buildings. Sharing car parks, foyers and other common spaces can make economic sense. Collocated facilities may be more convenient for the community.’ Some local authorities are able to include revenue generating components in a development, such as a cafe, bookshop or gymnasium. ‘More and more libraries are being constructed in shopping centres, often as a result of the deal between the local authority and the developer’ (Jones 2004). The United Kingdom’s Department for Culture, Media and Sport (2003:6) claims that the best libraries are showing the way forward. ‘Eye-catching new library buildings have opened in a number of cities and other places which are seeking to radically redefine the ways in which library services are delivered.’ Whichever way this is, it seems clear that ‘buildings will always play an important role, whether as adaptations or refurbishments of existing building stock, joint ventures with other public or commercial services in shared or collocated premises, or in dedicated new library buildings which speak to the changing needs of the 21st century’ (Worpole 2005:6).
1.3.2 Framework for Collaborative Action The Framework for Collaborative Action (Library Board of Victoria and Victorian Public Library Network 2006:3) defines the way in which the Library Board of Victoria, through the State Library of Victoria, works with the public library network to deliver improved library services to Victoria’s communities. The undertaking of the Building Audit of Victorian public libraries responds to the top three goals and priorities of the Framework for Collaborative Action (2006:6), namely: enhanced collections; improved access options; and seamless service to users.
1.3.3 Libraries Building Communities A collaborative research project of the Library Board of Victoria and the Victorian public library network, the Libraries Building Communities (LBC) project is aimed at meeting the challenges facing libraries today. The LBC project was the first comprehensive Australian study that examined the value that public libraries add to their communities. Through extensive surveys with Victorian public library services and the Victorian public, the study found that libraries and librarians make a fundamental contribution to communities in four key areas. They: provide free public access to computer and information technology
resources; create better informed communities by helping people locate information; promote life long learning and literacy in the community through the
programs they run; and build connections between individuals, groups and government (Library
Board of Victoria, Executive Summary, 2005:5). There are four main reports and an Executive Summary in the initial LBC (Library Board of Victoria 2005) series: Report 1: Setting the Scene covers the concept of community building, the
Victorian Government’s policy agenda, the Victorian public library network, project methodology, and relevant research.

- 28 -
Report 2: Logging the Benefits outlines the community views on the role and benefits of public libraries.
Report 3: Bridging the Gaps provides socio-economic demographic profiles of library users and non-users, as well as strategies for bridging the perceived gaps in public library service delivery.
Report 4: Showcasing the Best gives over 30 examples of innovation and excellence in Victorian public libraries.
In 2006, further research was undertaken resulting in the Libraries Building Communities Library User Census and Survey Project, which produced two additional reports: Report 1: Statewide Analysis and Comparisons. Report 2: Library Services Data and Reports.
Together, these reports provide a systematic evidence base at both the statewide and library service level concerning the users, uses and benefits of library services (Library Board of Victoria 2006:4), and are integral to the development of benchmarks of library provision in Section 9 of this report.
1.3.4 People places People places: A guide for public library buildings in New South Wales (hereinafter referred to as People places), researched and prepared by Heather Nesbitt Planning and Bligh Voller Nield, was commissioned by the Library Council of New South Wales in 2000 to promote planning techniques and practical guidelines for the development of library buildings. It sets out information not only on the design of buildings but also the processes required to develop successful library development projects. In 2005, it was felt that an update to People places would be useful as it would be possible to include an evaluation of libraries which had used the original edition in the planning of their buildings. Its success as a planning framework and benchmark has encouraged other States in Australia to tackle the changing trends and needs of the community with respect to public libraries (Library Council of New South Wales 2005). People places identifies the key objectives for future public libraries as being buildings which: ‘Provide a cultural hub and focal point for the community Are functional and multipurpose accommodating a range of activities and
uses Enable access to the latest in technology in a user-friendly manner Attract a wide range of users providing areas for relaxation, research,
leisure and learning Are effective and efficient in the delivery of services Develop from a co-operative approach between all stakeholders to ensure
that the changing needs of the community are met’ (Library Council of New South Wales 2005:7).

- 29 -
The second edition identified emerging trends impacting on the design and function of public libraries in New South Wales (and equally relevant in Victoria) including: Public libraries as places of social capital, where people from a range of
backgrounds can meet, network and potentially develop relationships with other members of the community.
Ageing of the community, as the number of older residents with significant leisure time increases and also the increase in the level of disability in our community, specific consideration of physical design issues and specific services for older residents and people with a disability is required.
Development of a youth culture, with young people as major consumers of information technology who hold social attitudes that are often different from other groups in the community can mean different services and spaces are required.
The expanding role of information technology in our society. The increasing library needs of our multicultural society, particularly on
multilingual collections. Recognition and celebration of our indigenous community, with a need to
ensure public libraries located in communities with large indigenous populations are attractive, welcoming and relevant to all members of the community.
Growing competition from other sources of information, education and entertainment in a rapidly changing world.
Increasing cultural development in our communities. A growing regionalisation of settlement patterns in coastal communities,
and declining populations and a changing economic base in rural areas. The NSW policy of compact cities and the impacts of urban consolidation
(Library Council of New South Wales 2005:7–14). A key element of People places has been the provision of a planning process for the development of public libraries, and, in particular, a process of identifying needs which can be translated into the design and functional floor areas required in a new/expanded library facility. People places provides a suite of four different tools for assessing need, including: Identified need, expressed by stakeholders such as library staff,
community groups and Council officers. Normative need, based on socio-demographic information and
recognised statistical indicators about library usage, provision per capita, etc.
Comparative need, based on comparing service provision with other communities with similar socio-demographic characteristics.
Benchmark-based need, using specific tools related to the services provided by public libraries and the population served by a library, this tool provides two different approaches to determining the actual floor area of public library (Library Council of New South Wales 2005:17).
The first of the latter tools, a service-based benchmark, is related to Victorian public library buildings in Section 9.4. The second, a population-
- 30 -
based benchmark, is also discussed in Section 9.4. Both are integral in developing a benchmark for library service provision in Victoria.
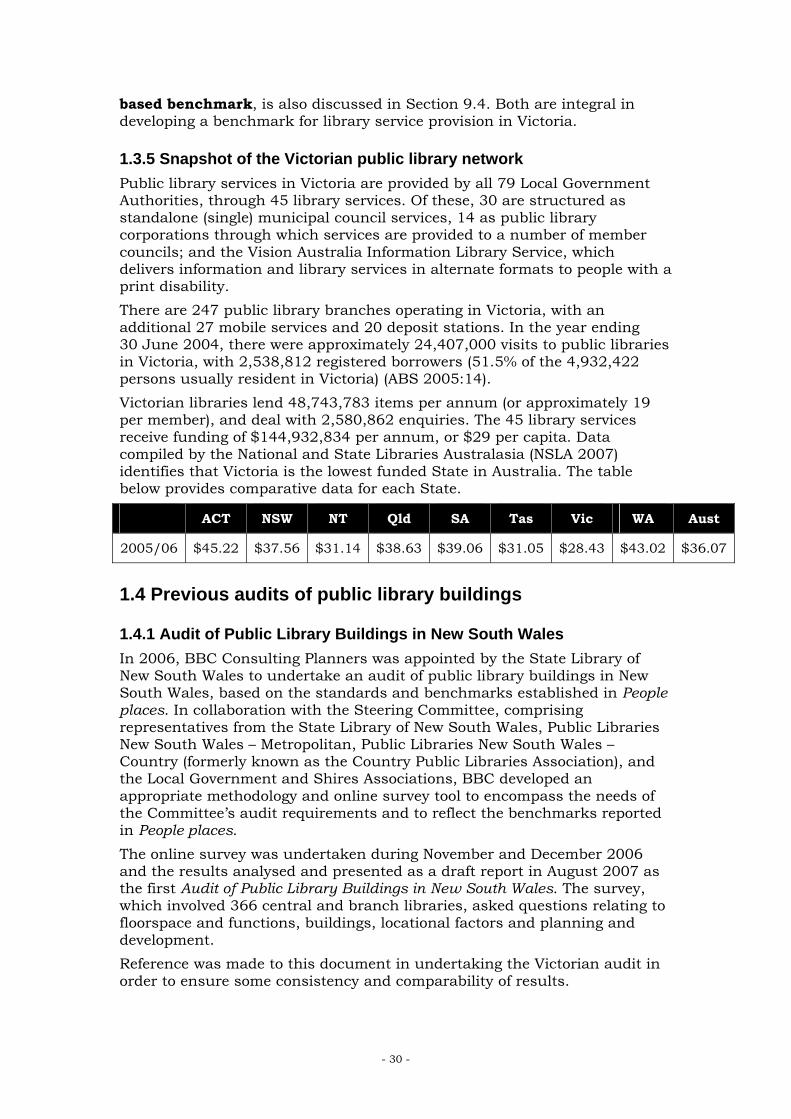
1.3.5 Snapshot of the Victorian public library network Public library services in Victoria are provided by all 79 Local Government Authorities, through 45 library services. Of these, 30 are structured as standalone (single) municipal council services, 14 as public library corporations through which services are provided to a number of member councils; and the Vision Australia Information Library Service, which delivers information and library services in alternate formats to people with a print disability. There are 247 public library branches operating in Victoria, with an additional 27 mobile services and 20 deposit stations. In the year ending 30 June 2004, there were approximately 24,407,000 visits to public libraries in Victoria, with 2,538,812 registered borrowers (51.5% of the 4,932,422 persons usually resident in Victoria) (ABS 2005:14). Victorian libraries lend 48,743,783 items per annum (or approximately 19 per member), and deal with 2,580,862 enquiries. The 45 library services receive funding of $144,932,834 per annum, or $29 per capita. Data compiled by the National and State Libraries Australasia (NSLA 2007) identifies that Victoria is the lowest funded State in Australia. The table below provides comparative data for each State.
ACT NSW NT Qld SA Tas Vic WA Aust
2005/06 $45.22 $37.56 $31.14 $38.63 $39.06 $31.05 $28.43 $43.02 $36.07
1.4 Previous audits of public library buildings
1.4.1 Audit of Public Library Buildings in New South Wales In 2006, BBC Consulting Planners was appointed by the State Library of New South Wales to undertake an audit of public library buildings in New South Wales, based on the standards and benchmarks established in People places. In collaboration with the Steering Committee, comprising representatives from the State Library of New South Wales, Public Libraries New South Wales – Metropolitan, Public Libraries New South Wales – Country (formerly known as the Country Public Libraries Association), and the Local Government and Shires Associations, BBC developed an appropriate methodology and online survey tool to encompass the needs of the Committee’s audit requirements and to reflect the benchmarks reported in People places. The online survey was undertaken during November and December 2006 and the results analysed and presented as a draft report in August 2007 as the first Audit of Public Library Buildings in New South Wales. The survey, which involved 366 central and branch libraries, asked questions relating to floorspace and functions, buildings, locational factors and planning and development. Reference was made to this document in undertaking the Victorian audit in order to ensure some consistency and comparability of results.

- 31 -
Case study 2: Kerang Library, Gannawarra Library Service
Gross floor area: 682.6 sq m
User catchment: Kerang and the shire of Gannawarra is a remote rural community whose economy revolves around primary industry. Shire of Gannawarra pop. 12,500
Cost: $1.5 million
Architect: Greenway Hirst and Page
Date completed: August 2003
Usage: 85,700 annually (2005/06)
Early stages of planning identified community needs which, if met by the library design, would deliver reciprocal benefits to the library as a vital and dynamic presence in the community. The architect’s brief was for a design which would complement the historic water tower existing on the site and, in addition to library facilities, provide areas which would benefit and support the wider community. At no time did the library actively seek donations from the community but there has been a great deal of community contribution to the building in the creation and donation of a number of unique features. This library was achieved through State Government funding, total commitment by the Shire Council, time and dedication by library staff, and strong community support.
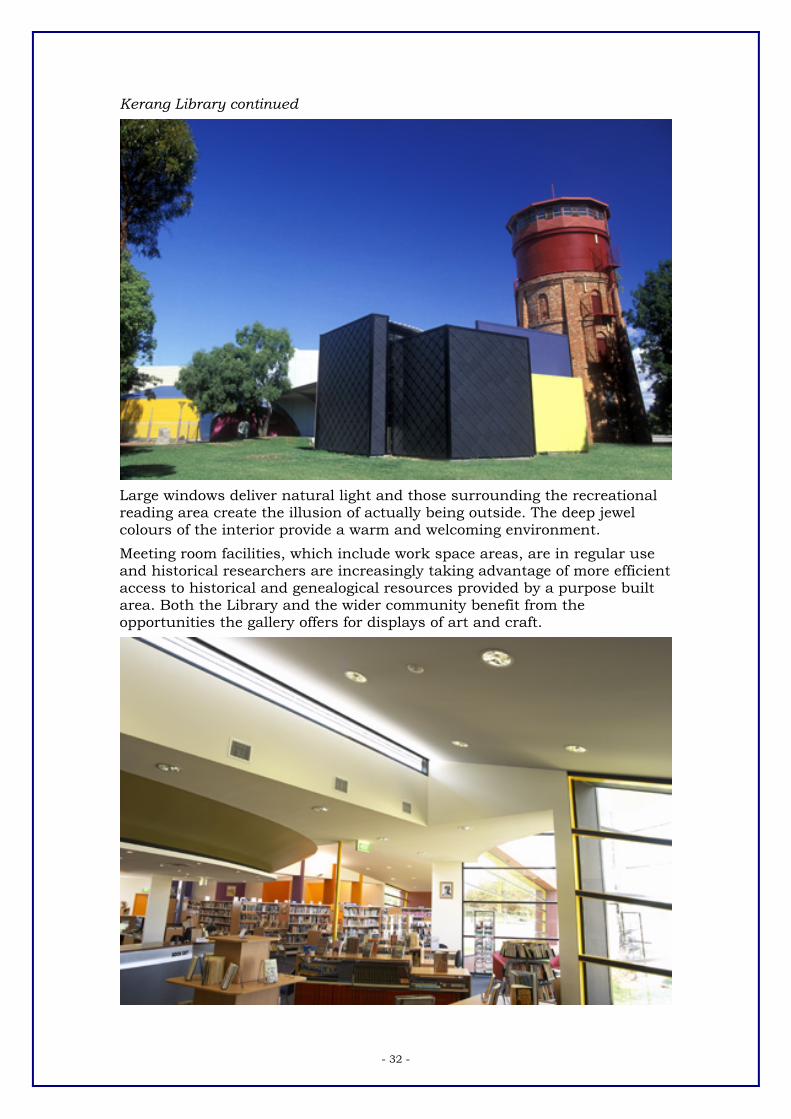
- 32 -
Kerang Library continued
Large windows deliver natural light and those surrounding the recreational reading area create the illusion of actually being outside. The deep jewel colours of the interior provide a warm and welcoming environment. Meeting room facilities, which include work space areas, are in regular use and historical researchers are increasingly taking advantage of more efficient access to historical and genealogical resources provided by a purpose built area. Both the Library and the wider community benefit from the opportunities the gallery offers for displays of art and craft.

- 33 -
1.4.2 Previous audits in Victoria In 2001, the Victorian Department of Infrastructure undertook a survey of public library buildings. This identified basic information and a summary of key issues relating to age and condition, including: the size of existing library branches; their age; whether they are heritage listed; a summary of their problems; and the approximate cost of repairs required to bring the property to
reasonable condition. The survey identified significant problems with the age and condition of many Victorian libraries. In response, the Victorian Government initiated a Living Libraries Public Library Infrastructure Program which recognised that many of the State’s current library buildings were inappropriate for delivering library services that the community requires in the 21st century. This funding program has contributed to the renewal of public library infrastructure in many of Victoria’s public libraries. Grants under the Living Libraries Program are ‘designed to assist Victorian councils and regional libraries in the provision of high quality and accessible public library facilities that support the role of public libraries in strengthening communities’, and ‘aim to: provide new or improved public library infrastructure; and support the role of the public library in strengthening communities as a
meeting place, facilitator of life long learning and provider of free access to information and reading resources’ (Department of Planning and Community Development 2008:3).
‘Examples of the types of projects that will be considered for funding include: The construction of a new library for a community that does not have a
public library building. The construction of a library building to replace an existing library. The conversion of an existing non library building for use as a library. The renovation/refurbishment or extension of an existing library
building. The incorporation of a public library space as an element of a broader
community facility. A new mobile library. Interior refurbishment of an existing mobile library. Partial replacement of the mobile library (e.g. replacement of engine,
prime mover, trailer). Projects that demonstrate flexibility and innovation in meeting the longer term needs of the community are particularly sought, as are proposals for libraries that are part of a larger community facility or retail complex’ (Department of Planning and Community Development 2008:4).

- 34 -
1.5 Structure of the report This report is structured as follows: Section 1: provides an introduction to the project, including its Terms of Reference, context and background. It identifies the key policy framework within which the project is being undertaken, and several key documents which provide a point of reference and source of information. Section 2: details the approach undertaken to the Audit, including its methodology, response rate and limitations. Section 3: discusses the role of public library buildings in Victoria, including current value of buildings; past and ongoing capital expenditure; the amount spent on libraries as a proportion of total LGA budget; and planned future expenditure. It identifies how buildings are currently utilised, including their size, and includes an overview of functional areas and specialist uses of space. The report then tests the Functional Area Size Guide contained in People places. Finally, it reviews the role of library buildings in their communities, including comparison to trends evident in the literature. The section also reviews administration arrangements for public libraries, including on-site or off-site administration and storage. Section 4: provides a physical assessment of buildings, including user views on quality, condition and type of building; accessibility and mobility issues; facilities such as lighting, signage and user comfort; compliance with Codes and Regulations such as the Building Code of Australia, fire rating, disability and Occupational health and safety requirements; and tenure. It reviews whether buildings are future proof in terms of technology, the changing role of libraries in the community, and environmental sustainability. Finally, it concludes on the basis of the above whether buildings are in fact ‘fit for purpose’. Section 5: reviews locational characteristics of public libraries, including proximity to other community facilities; street frontage; and accessibility both by car, public transport and disability access. It draws conclusions about whether buildings are in fact in the ‘right’ place in relation to generally accepted location criteria. Section 6: provides information on asset management, specifically asset management planning and maintenance. Section 7: reviews current planning and development processes, including planned refurbishment; new buildings planned; and planned replacement other on the same or a new site. Details provided include the types of works planned; timeframe; Gross Floor Area; budget; and locational attributes of new sites where relevant. Section 8: provides an overview of the results of individual Local Government Authority audit reports. Section 9: develops a benchmark of library service provision for Victoria. It overviews the limitations of the audit methodology in this regard; applies both service-based and population-based benchmarks, overall and by library service/LGA; and derives a suggested planning benchmark for Victoria. Section 10: is the conclusion to the statewide report. It draws implications from the above and identifies appropriate strategies. Interspersed in the report are case studies of Victorian public library buildings as selected by an independent selection panel.

- 35 -
Individual Local Government Authority audit reports were distributed electronically to each relevant library service manager/CEO in May/June 2008. The survey tool; a complete list of survey respondents; and tabulated data at the Local Government Authority and branch library level, is appended.

- 36 -
2. STUDY APPROACH
2.1 Methodology The Audit was undertaken via an online survey undertaken from 28 May to 1 August 2007. The Audit was conducted in consultation with the Collections and Access – Standards Workgroup and State Library of Victoria project staff. The project was developed over a number of phases: Initial consultation and literature review. Development of survey themes. Pilot survey. Final online survey. Data analysis and output report.
Initially, survey themes were drawn from a workshop with the Workgroup, a literature review of building audit methodologies and the ideas in People places (Library Council of New South Wales 2005), and experiences in New South Wales with a similar audit. Following this, a draft survey was developed and reviewed by the Workgroup. A pilot survey was undertaken from 4 to 11 May 2007, comprising five library services: Eastern Regional Libraries: Ferntree Gully Library and Knox City
Council. Hobsons Bay Libraries: Altona Meadows Library and Hobson Bay City
Council. Goldfields Library Corporation: Kangaroo Flat Library and Greater
Bendigo City Council. Gannawarra Library Service: Kerang Library and Gannawarra Shire
Council. West Gippsland Regional Library Corporation: Warragul Library and Baw
Baw Shire Council. Feedback about the content and ease-of-use of the survey was elicited from the participating branches and a number of improvements made. The final survey comprised two parts: Information relating to each Local Government Authority (LGA) in
Victoria. Information relating to each branch library within each library service in
Victoria. A separate survey was completed for each LGA and for each library branch premises. Some of the LGA level information was available from other sources, and was, therefore, not sought again.

- 37 -
The LGA survey was divided into four parts: Part A. Assessment of Population-based Benchmark of Library Provision. Part B. Assessment of Service-based Benchmark of Library Provision. Part C. Audit of Administration Buildings. Part D. Planning and Development.
The branch survey was divided into five parts: Part A. Floorspace and Function, intended to obtain information on the
floorspace of the library premises and the various functions provided at the premises.
Part B. Design of the Building, intended to obtain information on the age and condition of the building within which the library is located as well as the extent to which the library premises complies with current building design principles.
Part C. Location of the Building, intended to obtain information on the location of the library premises.
Part D. Building Management and Maintenance, intended to obtain information on the management and maintenance of the library premises.
Part E. Planning and Development, intended to obtain information on library development planning.
Explanatory notes were provided where necessary to explain questions and assist information collection. Survey respondents’ were required to collaborate with Council’s building or asset manager, or their library service manager to source some information.
2.2 Response rate The survey went online from 28 May 2007. The survey was initially to be completed over four weeks, by Tuesday 26 June 2007. However, in order to ensure as high a response rate as possible, this was extended to 1 August 2007. The State Library of Victoria invested considerable time and effort in several rounds of follow-up telephone calls and emails encouraging the completion of outstanding responses from all libraries. A final response rate of 94.9% of LGAs and 96.5% of branch libraries was achieved. In total, 75 Local Government Authorities and 244 branch libraries responded. Due to extenuating circumstances, Corangamite Regional Library Corporation was unable to complete both the LGA and branch level surveys in the timeframe allocated. As a result, four LGAs and ten branches are not included. Surveys were returned for ‘branches’ at Churchill (Latrobe City Council, Latrobe City Library Service) and Goldfields Mobile (City of Greater Bendigo, Goldfields Library Corporation). Following data analysis, it was determined that these branches should not be defined as buildings in the terms of this Audit; their inclusion within the dataset has a negligible effect on the analysis.

- 38 -
2.3 Study limitations The analysis of the survey responses has revealed a number of limitations to the study which are important to note: Responses were non-compulsory, allowing respondents to skip some
questions, accidentally or otherwise, which may have affected the response rate for some questions.
Some questions, particularly those related to financial information, had low response rates. Feedback from respondents identified that this was either because the information was not available, or could not be obtained from other Council departments within the survey timeframes.
Analysis suggests that a small number of questions are likely to exhibit a degree of data entry error. For example, estimates of functional floorspace areas (sq m) exceeding the total GFA of the branch, and the frequency of non-resident membership at abnormally high levels.
The content of some questions, particularly with regards to areas such as building design, were beyond the scope of knowledge of many library managers.
Other limitations relate largely to possible misinterpretation of questions which may have affected some responses. These have been noted, where relevant, in the textual analysis in the following sections.

- 39 -
3. THE ROLE OF PUBLIC LIBRARY BUILDINGS IN VICTORIA
This section discusses the role of public library buildings in Victoria, including current value of buildings; past and ongoing capital expenditure; the amount spent on libraries as a proportion of total LGA budget; and planned future expenditure. It identifies how buildings are currently utilised, including their size, and includes an overview of functional areas and specialist uses of space. The report then tests the Functional Area Size Guide contained in People places. Finally, it reviews the role of library buildings in their communities including comparison to trends evident the literature. This section also reviews administration arrangements for public libraries, including on-site or off-site administration and storage.
3.1 Administration arrangements Public library services in Victoria are provided by all 79 Local Government Authorities, through 45 library services. Of these, 30 are structured as standalone (single) municipal council services; 14 as public library corporations through which services are provided to a number of member councils; and the Vision Australia Information Library Service, which delivers information and library services in alternate formats to people with a print disability. The Audit identified that 28% of LGAs operate some form of on- or off-site floorspace distinct from branch operations (Table 3.8). This included administration space (21.3%), storage space (17.3%) as well as other forms of space (12%). Other forms of space included: mobile library parking; Rural Transaction Centres; technical services; and outreach services. The distribution of floorspaces for these centralised uses is identified in Table 3.9. These spaces have been described as appropriate within relevant sections of the report.
3.2 The value of public library buildings The current local and state investment in Australian public libraries is only about $600 million per annum, representing approximately seven cents per Australian per day or the cost of one book/CD/DVD per annum (Bundy 2006b:4). Research has shown that the return on public investment in public libraries is likely to be between $2.50 and $5.50 for every dollar invested. ‘No public investment demonstrably returns a higher dividend’ (Bundy 2003:3). It has been estimated that individual local government annual investment in public libraries ranges from less than 1% per annum of rate revenue to over 7%. Generally, percentages of rate revenue allocated to libraries by country authorities are smaller than in urban areas (Bundy 2003:3). Libraries are more than a financial consideration. As discussed in Section 0, libraries are increasingly being recognised as an essential place for building social capital. Libraries are places which also provide intangible and indirect benefits to the communities in which they are located. Libraries: are public anchors for neighbourhoods and communities;

- 40 -
are acknowledged as safe, welcoming, neutral spaces open to all in the community;
are relevant to the needs of the communities they serve; draw people to town centres and so contribute to economic activity; provide people with personal space which is an alternative to shopping
and commercial entertainment; and support important early cognitive development through early learning
activities (Department for Culture, Media and Sport 2003:9).
3.2.1 Value of buildings The financial value of buildings was established by asking the total insurance value of library buildings, excluding building contents. The year of the assessment was also asked. The value of internal assets was not assessed, having recently canvassed by the Strategic Asset Audit of Victorian Public Libraries (J.L. Management Services 2006).
Table 3.1: Total insurance value of building (Q.37)
Building value Branches* %
<$250,000 17 10.1%
$250,000–$499,999 15 8.9%
$500,000–$749,999 14 8.3%
$750,000–$999,999 10 5.9%
$1,000,000–$1,499,999 25 14.8%
$1,500,000–$1,999,999 19 11.2%
$2,000,000–$2,999,999 23 13.6%
$3,000,000> 46 27.2%
Total 169 100%
* 75 branches (30.7%) did not complete this question
Library building values spanned a wide range of values, from library buildings which were under $250,000 to those over $3 million. The most common frequency was those over $3 million, comprising 27.2% of library buildings. There was also a cluster of library buildings between $1 million and under $3 million; in total two-thirds (66.8%) of all library buildings were worth $1 million or more. At the other end of the scale, 10.1% of library buildings were valued at less than $250,000. While not entirely accurate, given the variation in library investment between LGAs, application of this average across the entire population of Victoria would suggest a total value of library buildings in the State of $522 million. The variation in library investment by size of LGA is apparent from the following table.

- 41 -
Table 3.2: Value of buildings in an LGA by LGA population (Q.37)
LGA Population
LGA Total Building Value <10,000 10,000–
49,999 50,000–99,999
100,000–149,999 150,000> No. of
LGAs*
<$250,000 50.0% 50.0% 0.0% 0.0% 0.0% 2 (5.0%)
$250,000–$499,999 100.0% 0.0% 0.0% 0.0% 0.0% 3 (7.5%)
$500,000–$749,999 0.0% 0.0% 0.0% 0.0% 0.0% 0 (0%)
$750,000–$999,999 0.0% 100.0% 0.0% 0.0% 0.0% 1 (2.5%)
$1,000,000–$1,499,999 40.0% 60.0% 0.0% 0.0% 0.0% 5 (12.5%)
$1,500,000–$1,999,999 0.0% 0.0% 0.0% 0.0% 0.0% 0 (0%)
$2,000,000–$2,999,999 0.0% 66.7% 33.3% 0.0% 0.0% 3 (7.5%)
$3,000,000> 0.0% 19.2% 34.6% 26.9% 19.2% 26 (65.0%)
Total 6 12 10 7 5 40
* 40 LGAs provided complete valuation data (53.3%); 35 LGAs did not complete all relevant questions
The date of the insurance assessment at which this financial value was measured also varied considerably. However, in two-thirds of cases (68.1%), valuations were undertaken in either 2006 or 2007; 23.1% of libraries did not complete the date of their insurance assessment.
Table 3.3: Year of valuation (Q.37)
Year Branches* %
Unknown 39 23.1%
2004 4 2.4%
2005 11 6.5%
2006 52 30.8%
2007 63 37.3%
Total 169 100%
* 75 branches (30.7%) did not complete this question
While there may be a correlation between a buildings’ valuation and whether or not it was collocated, it cannot be established from the audit data.

- 42 -
3.2.2 Capital expenditure Respondents were asked to state the capital expenditure on each branch library building in the 2006/07 financial year. This information is shown in Table 3.4 below.
Table 3.4: Capital expenditure on branch libraries (Q.40)
2006/07 2007/08 Capital expenditure
Branches* % Branches* %
<$500 0 0% 1 1.3%
$500–$999 3 3.4% 1 1.3%
$1,000–$2,499 10 11.2% 7 9.2%
$2,500–$4,999 6 6.7% 5 6.6%
$5,000–$7,499 11 12.4% 9 11.8%
$7,500–$9,999 6 6.7% 4 5.3%
$10,000–$49,999 34 38.2% 28 36.8%
$50,000–$99,999 9 10.1% 8 10.5%
$100,000–$249,999 3 3.4% 6 7.9%
$250,000 7 7.9% 7 9.2%
Total 89 100% 76 100%
* 155 branches for 2006/07 (63.5%) and 158 branches for 2007/08 (68.9%) did not complete this question
There was a total capital expenditure on libraries in 2006/07 of $14,437,881 (however, only 89 branches (36.5%) supplied data). The median value was $10,500 and the average was $162,223. If it was assumed that the balance of branches made similar levels of capital expenditure, up to $40 million per annum could be spent on library buildings. Limited confidence is held with the accuracy of this estimate, given the variations in the data underlying such an assumption, and fluctuations year on year. The majority of branches (59.6%) had received capital expenditure of over $10,000 in the preceding financial year; 30.3% received between $1,000 and under $5,000. Only 3.4% received less than $1,000. The projected capital expenditure on library branches in the 2007/08 financial year is also shown in Table 3.4. This showed that an even higher proportion (64.5% of branch libraries) anticipated receiving more than $10,000 in the next financial year. The distribution was similar to the 2006/07 financial year.

- 43 -
Case study 3: Sydenham Library, Brimbank Libraries
Gross floor area: 1,000 sq m
User catchment: Taylors Ward, Brimbank City Council: Calder Park, Delahey, Hillside, Keilor Lodge, Keilor North, Sydenham, Taylors Lakes. Population: 53,425 (2006)
Cost: $5.5 million
Architect: Scott Jennings A2 Architects Scott is now with Freeform Architects
Date completed: November 2006
Usage: December 2006–April 2007 New memberships: 3,614 Loans: 134,725 Door count: 61,422 Internet sessions booked: 24,669
Sydenham Library is a key part of the designated Transit City around Sydenham railway station. The local community wanted a ‘significant’ building, internally and externally, which would engender community pride. The multilingual graphic on the unique external skin makes a strong statement of welcome and inclusion to all at Brimbank’s northern gateway.

- 44 -
Sydenham Library continued
The community wanted a contemporary space, with a dynamic feel, including display spaces and a meeting room. The library’s internal space is open and welcoming with minimal internal barriers. The core of the space is the IT area with 40 IT pods, which buzzes with children and teenagers doing homework or playing games and adult patrons making the most of the comfortable, private working spaces. All spaces are reconfigurable so the library can change to meet changing community needs. They also wanted comfortable seating in welcoming spaces with signage and lighting that ‘makes a statement’. The library has a spacious, warm appearance with contemporary colours and furniture arranged in social groupings. It is already a local landmark and the focus of community learning and recreation.

- 45 -
3.2.3 Library expenditure as a proportion of total Local Government Authority budget Library services were asked the total capital expenditure budget of their LGA for the 2006/07 financial year and for the next three years; the proportion of the LGA budget spent on libraries was then calculated. This is shown in Tables 3.5 and 3.6. It should be noted that increasing proportions of respondents were unable to provide this information over time, ranging from one-third (33.3%) of library services in 2006/07 to more than half (53.3%) in 2009/10.
Table 3.5: Overall LGA capital expenditure: 2006/07 to 2009/10 (Q.8)
2006/07 2007/08 2008/09 2009/10 LGA capital expenditure budget LGAs* % LGAs* % LGAs* % LGAs* %
<$500,000 13 26.0% 11 22.4% 8 20.0% 7 20.0%
$500,000–$999,999 2 4.0% 2 4.1% 1 2.5% 0 0.0%
$1,000,000–$1,499,999 0 0.0% 2 4.1% 1 2.5% 2 5.7%
$1,500,000–$9,999,999 14 28.0% 10 20.4% 8 20.0% 4 11.4%
$10,000,000–$19,999,999 4 8.0% 8 16.3% 9 22.5% 9 25.7%
$20,000,000–$29,999,999 12 24.0% 10 20.4% 10 25.0% 9 25.7%
$30,000,000> 5 10.0% 6 12.2% 3 7.5% 4 11.4%
Total 50 100% 49 100% 40 100% 35 100%
* LGAs not completing this question: 2006/07 – 25; 2007/08 – 26; 2008/09 – 35; 2009/10 – 40
The data shows that among libraries services that were able to provide the relevant data: In 2006/07, approximately one-quarter of library services (26%) were in
LGAs where the total capital expenditure budget of the LGA was under $500,000; one-quarter (28%) were in LGAs where the budget was between $1.5 million and under $10 million; one-quarter (24%) were in LGAs with budgets between $20 million and under $30 million; and the remainder were distributed across other categories. Ten percent (10%) of library services were in LGAs with a total capital expenditure budget of $30 million and over.
In 2007/08, the distribution was similar, but with a doubling of the proportion of LGAs with capital expenditure budgets in the $10 million to under $20 million range to 16.3% and a consequent reduction of the above proportions from one-quarter to around one-fifth; 12.2% of LGAs had budgets of $30 million and over.

- 46 -
In 2008/09, the proportion of LGAs with capital expenditure budgets of $30 million and over declined to 7.5%, and the above proportions slightly increased again in all but the category of LGAs under $500,000, which remained at 20%. The category of LGAs with budgets in the $10 million to under $20 million range continued to increase to 22.5%.
By 2009/10, the proportion of LGAs with capital expenditure budgets over $30 million was expected to again have risen to 11.4%, and one-quarter of LGAs to have budgets between $10 and under $20 million, and between $20 million and under $30 million. The proportion of LGAs in the lowest category, with budgets of under $500,000, again remained at 20%.
It should be recognised that the above data suffers from the large number of Not Stated replies and should consequently be treated with caution. In general, it can be interpreted as showing a decline in the number of LGAs with very low capital expenditure budgets (under $500,000) and a gradual, although inconsistent, increase in those with budgets above $10 million for capital expenditure.
3.2.4 Summary of future planned expenditure Library branches were asked their likely budget for capital building and internal assets such as shelving, etc. within the next five years (to the nearest $100,000). The information provided is summarised in Table 3.6.
Table 3.6: Future planned expenditure over next five years (Q.44d)
Future planned expenditure
Anticipated capital building
expenditure
Anticipated internal assets
expenditure
Number of branches responding 301 232
Total amount (responding) $45,897,900 $5,726,200
Average planned expenditure per branch $1,529,930
$248,965
1 18 branches (62.5%) undertaking works did not complete this question 2 25 branches (47.9%) undertaking works did not complete this question
Table 3.6 indicates that libraries are planning to undertake expenditure on capital building of nearly $46 million over the next five years; anticipated expenditure on internal assets (excluding book stock and other resources) is approximately $5.7 million. The anticipated average capital building budget (where provided) for those libraries planning to undertake work is approximately $1.53 million, with $249,000 on internal works; however, these ranged from $7.5 million to $100 in the case of capital building works and $1.75 million to $200 in the case of internal assets. Ten libraries were undertaking capital building over $1 million, and three were undertaking internal asset refurbishment over the same amount. Further information on proposed planning and development of libraries is provided in Section 7.

- 47 -
3.3 Utilisation of public library buildings A series of questions were asked to ascertain standard floorspace and function details of each library. These questions were drawn from the benchmarks set out in People places (Library Council of New South Wales 2005). They also reflect the questions included in the New South Wales Audit of Public Library Buildings (BBC Consulting Planners 2007). Despite perceptions that less space is needed in libraries, there is no evidence that this is true. In fact, the variety of new functions expected in libraries is contributing to demands for even more space. Several projects underway across Australia are tripling the floorspace areas of the 1970s and 1980s buildings they are replacing (Jones 2004). Library users, like shoppers, need 60% of the library’s floorspace to browse comfortably, leaving 40% of space for shelving and other fittings (Bundy 2006). However, too many libraries reverse this ratio due to lack of space.
3.3.1 Size of buildings Respondents were asked the Gross Floor Area (GFA) of branch library premises. GFA was defined as:
the sum of the floor area of each storey of a building measured from the internal face of external walls, or from the internal face of walls separating the building from any other building and includes: (a) the area of a mezzanine within the storey, but EXCLUDES (b) any area for common vertical circulation, such as lifts and stairs,
and (c) vehicular access, loading areas, garbage and services, and (d) plant rooms, lift towers and other areas used exclusively for
mechanical services or ducting, and (e) car parking (including access to that car parking), and (f) any space used for the loading or unloading of goods (including
access to it), and (g) terraces and balconies, and (h) void spaces.
Additionally, for the purposes of the branch library survey, it was deemed to include both public and staff spaces and exclude library service level administration space (both on- and off-site). The GFA of any such spaces used by the library service was separately measured in the LGA survey. The results for branches are shown in Table 3.7 and for centralised services in Table 3.9.

- 48 -
Table 3.7: Gross Floor Area of branch libraries (Q.11)
GFA Branches* %
<150 sq m 35 14.6%
150–249 sq m 44 18.4%
250–499 sq m 54 22.6%
500–999 sq m 51 21.3%
1,000–1,499 sq m 36 15.1%
1,500–1,999 sq m 14 5.9%
2,000> sq m 5 2.1%
Total 239 100%
*Five branches did not complete this question
The highest proportion of branch libraries is between 250–499 sq m (22.6% of respondents) and 500–999 sq m (21.3%). Only 2.1%, or five libraries, were over 2,000 sq m; 14.6% were less than 150 sq m. This can be compared with the recommended minimum size for a public library of 139 sq m GFA (State Library of New South Wales 1995:24). Thirty-three of the 240 branches (13.8%) that supplied floorspace information are less than the 139 sq m GFA minimum recommended size for a public library building. All but one of these branches are in rural or regional LGAs. Twenty-eight percent of LGAs separately operated some form of on- or off-site floorspace distinct from branch operations (Table 3.8). This included administration space (21.3%), storage space (17.3%), as well as other forms of space (12%). Other forms of space included mobile library parking, Rural Transaction Centres, technical services and outreach services. The distribution of floorspaces for these centralised uses is identified in Table 3.9. Central administration areas are generally small, with 45.5% of those areas for which sizes were identified being between 50–99 sq m in size. A few (three, or 27.3% of those areas for which sizes were identified) central administration areas were substantial, being between 500–999 sq m in size.
Table 3.8: LGAs with central operations floorspace (Q.6a)
Overall Administration Storage Other Areas Central operations with floorspace LGAs* % LGAs* % LGAs* % LGAs* %
Yes 21 28.0% 16 21.3% 13 17.3% 9 12.0%
No 54 72.0% 59 78.7% 62 82.7% 66 88.0%
Total 75 100% 75 100% 75 100% 75 100%
* Four LGAs did not respond to this survey

- 49 -
Table 3.9: Size of LGA central operations floorspace (Q.6b)
Administration Storage Other Areas Size of
floorspace LGAs % LGAs % LGAs %
<5 sq m 0 0.0% 2 22.2% 0 0.0%
5–9 sq m 0 0.0% 1 11.1% 0 0.0%
10–24 sq m 0 0.0% 1 11.1% 0 0.0%
<25 sq m 1 6.3% 4 44.4% 2 22.2%
25–49 sq m 0 0.0% 4 44.4% 0 0.0%
50–99 sq m 5 31.3% 1 11.1% 0 0.0%
100–199 sq m 0 0.0% 0 0.0% 0 0.0%
200–499 sq m 2 12.5% 0 0.0% 4 44.4%
500–999 sq m 3 18.8% 0 0.0% 1 11.1%
Total 16* 100% 9 100% 7** 100%
* Of the 21 LGAs who answered yes as identified in Table 3.8, five (31.3%) LGAs did not complete this question
** Of the 21 LGAs who answered yes as identified in Table 3.8, two (22.2%) LGAs did not complete this question
Libraries were asked about the number of storeys their floorspace area was situated over. A total of 205 libraries, representing 84%, are located on a single level of a building, while 12.7% of libraries contained two levels and 2.9% contained three levels (the maximum number of levels indicated) (Table 3.10).
Table 3.10: Number of levels utilised by library branches (Q.13a)
Levels Branches* %
One 205 84.0%
Two 31 12.7%
Three 7 2.9%
Total 243 100%
* One branch did not complete this question
However, a number of library branches which operated over two or three storeys indicated that not all of these levels admitted public access2. Fifteen (39.5%) of libraries which operate over more than one storey did not allow public access to one or more levels (Table 3.11).
2 This does not refer to disabled access, which is addressed in Section 4.5.

- 50 -
Table 3.11: Publicly accessible levels of library branches (Q.13b)
Number of Publicly Accessible Levels
One Two Three Total
Levels Branches % Branches % Branches % Branches %
Two 12 38.7% 19 61.3% 0 0.0% 31 100%
Three 1 14.3% 2 28.6% 4 57.1% 7 100%
Total 13 34.2% 21 55.3% 4 10.5% 38 100%
Libraries were also asked to indicate whether at least part of their library was located on the ground floor with street frontage, which was found to be the case in 230 (94.3%) of all Victorian libraries. Overall, only 14.8% of libraries contained a lift (either passenger or goods). Of those libraries not located on the ground floor (nine libraries), only one had a passenger lift somewhere within the building to facilitate access (Table 3.12). Of those libraries which contained a lift, three (8.3%) indicated that the lift did not service all levels of the library; these are important accessibility shortcomings. Further details of lift access within buildings are provided in Table 3.13.
Table 3.12: Lift access from street (Q.13d)
Availability of lift
Yes, patrons Yes, goods Yes, patrons &
goods No lift* Total
At least part of library located on ground floor with street frontage Branches % Branches % Branches % Branches % Branches %
Yes 3 1.3% 9 3.9% 23 10.0% 195 84.8% 230 100%
No 0 0.0% 0 0.0% 1 11.1% 8 88.9% 9 100%
* Four branches did not complete this question
Table 3.13: Lift access – within building (Q.13b)*(Q.13d)
No lift Lift, patrons Lift, goods Lift, patrons &
goods Total Publicly accessible levels Branches % Branches % Branches % Branches % Branches %
One 199 93.4% 1 0.5% 7 3.3% 6 2.8% 213 100%
Two 4 18.2% 2 9.1% 1 4.5% 15 68.2% 22 100%
Three 0 0.0% 0 0.0% 1 25.0% 3 75.0% 4 100%
* Four branches did not complete this question

- 51 -
Case study 4: Drouin Library, West Gippsland Regional Library Corporation
Gross floor area: 562.63m2
User catchment: The catchment area is defined by the Drouin zone.
Cost: $175,000
Architect: Caba Design
Date completed: 19 April 2007
Usage: Loans: 49,612 Visits: 25,464 (June 2005–July 2006)
The Drouin Library is an example of a transformational refurbishment making best use of available resources. The library is collocated with the Drouin RSL, Drouin Toy Library, and Drouin Historical Society in a building that was opened in 1922. Before the current refurbishment, the space was tired, old-fashioned and drab with poor lighting. Access to the building was poor. Underutilised floorspace and shelving height was also a problem. The library had no air-conditioning and an inefficient heating system. In 2006, Baw Baw Shire Council was awarded a Living Libraries grant to refurbish the library. The refurbishment was completed in nine weeks and has transformed the library into a modern, attractive community space. It features a dedicated youth space with ottomans and custom-made tables for group study.

- 52 -
Drouin Library continued The children’s area now includes a dedicated story time area with modern children’s furniture. This area will also feature a large mural on the wall with an Australian animals theme which is not yet completed.
The implementation of automatic doors has improved disabled access. There is also a relaxing reading area with comfortable furniture. Use of colour, improved lighting and comfortable furniture has created an inviting and welcoming environment.

- 53 -
3.3.2 Number of visitors Libraries were asked how many people, on average, visited each branch per week. These results are shown in Table 3.14.
Table 3.14: Visitors per week (Q.10)
Visitors per week Branches* %
0 2 0.8%
<500 56 23.0%
500–999 33 13.6%
1,000–2,499 61 25.1%
2,500–4,999 65 26.7%
5,000–7,499 20 8.2%
7,500–8,999 5 2.1%
9,000> 1 0.4%
Total 243 100%
* One branch did not complete this question
Table 3.14 shows that the highest proportions of libraries have either 1,000-2,499 visitors each week (25.1%) or 2,500–4,999 visitors per week (26.7%). Significantly smaller proportions have 5,000 visitors per week or more (10.7%), with one library having over 9,000 visitors per week. Fifty-eight (23.8%) libraries had less than 500 visitors per week, including two which had no visitors. As expected, the number of visitors per week on average correlates strongly with the GFA of public libraries (Table 3.15); that is, generally speaking, the larger a library, the more people visit it. This is not to say that the size of a library creates its demand. It is apparent, however, that some branches are ‘working harder’ than others. The number of visitors per square metre of floorspace ranges from 0.44 to 24.39.
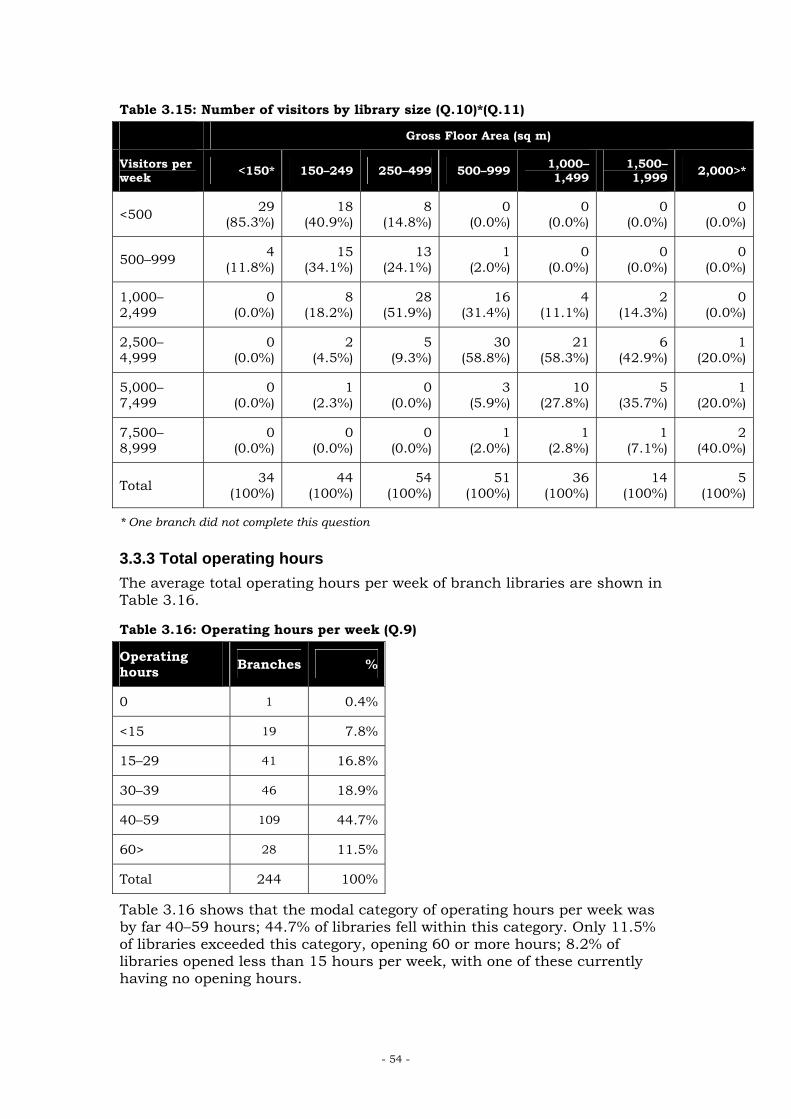
- 54 -
Table 3.15: Number of visitors by library size (Q.10)*(Q.11)
Gross Floor Area (sq m)
Visitors per week <150* 150–249 250–499 500–999 1,000–
1,499 1,500–1,999 2,000>*
<500 29 (85.3%)
18 (40.9%)
8 (14.8%)
0 (0.0%)
0 (0.0%)
0 (0.0%)
0 (0.0%)
500–999 4 (11.8%)
15 (34.1%)
13 (24.1%)
1 (2.0%)
0 (0.0%)
0 (0.0%)
0 (0.0%)
1,000–2,499
0 (0.0%)
8 (18.2%)
28 (51.9%)
16 (31.4%)
4 (11.1%)
2 (14.3%)
0 (0.0%)
2,500–4,999
0 (0.0%)
2 (4.5%)
5 (9.3%)
30 (58.8%)
21 (58.3%)
6 (42.9%)
1 (20.0%)
5,000–7,499
0 (0.0%)
1 (2.3%)
0 (0.0%)
3 (5.9%)
10 (27.8%)
5 (35.7%)
1 (20.0%)
7,500–8,999
0 (0.0%)
0 (0.0%)
0 (0.0%)
1 (2.0%)
1 (2.8%)
1 (7.1%)
2 (40.0%)
Total 34 (100%)
44 (100%)
54 (100%)
51 (100%)
36 (100%)
14 (100%)
5 (100%)
* One branch did not complete this question
3.3.3 Total operating hours The average total operating hours per week of branch libraries are shown in Table 3.16.
Table 3.16: Operating hours per week (Q.9)
Operating hours Branches %
0 1 0.4%
<15 19 7.8%
15–29 41 16.8%
30–39 46 18.9%
40–59 109 44.7%
60> 28 11.5%
Total 244 100%
Table 3.16 shows that the modal category of operating hours per week was by far 40–59 hours; 44.7% of libraries fell within this category. Only 11.5% of libraries exceeded this category, opening 60 or more hours; 8.2% of libraries opened less than 15 hours per week, with one of these currently having no opening hours.

- 55 -
As expected, the number of visitors per week positively correlated with the average number of opening hours of libraries (Table 3.17). Again, it is apparent that some libraries are ‘working harder’ than others. The number of people visiting libraries in Victoria ranged from 0.67 to 196.7 people per hour.
Table 3.17: Number of visitors by hours of operation (Q.9)*(Q.10)
Visitors each week Operating hours per week <500 500–
999 1,000–2,499
2,500–4,999
5,000–7,499
7,500–8,999 9,000> Total
<15 19 (100%)
0 (0.0%)
0 (0.0%)
0 (0.0%)
0 (0.0%)
0 (0.0%)
0 (0.0%)
19 (100%)
15–29 24 (58.5%)
12 (29.3%)
5 (12.2%)
0 (0.0%)
0 (0.0%)
0 (0.0%)
0 (0.0%)
41 (100%)
30–39 10 (21.7%)
16 (34.8%)
17 (37.0%)
2 (4.3%)
1 (2.2%)
0 (0.0%)
0 (0.0%)
46 (100%)
40–59 3 (2.8%)
5 (4.6%)
37 (34.3%)
48 (44.4%)
12 (11.1%)
2 (1.9%)
0 (0.0%)
108 (100%)
60> 0 (0.0%)
0 (0.0%)
2 (7.1%)
15 (53.6%)
7 (25.0%)
3 (10.7%)
1 (3.6%)
28 (100%)
Total* 56 (23.0%)
33 (13.6%)
61 (25.1%)
65 (26.7%)
20 (8.2%)
5 (2.1%)
1 (0.4%)
243 (100%)
* One branch did not complete this question
3.3.4 Overview of functional areas The literature suggests that the number of functions preformed by the modern library, and consequently the number of spaces within it, is increasing. Bundy provides examples of attractive and welcoming libraries in Australia and New Zealand often complete with facilities such as learning centres, homework centres, youth zones, electronic training suites, generous display areas, local studies rooms, comfortable lounge areas, Friends of the Library rooms, Justice of the Peace rooms, coffee shops and meeting rooms (2006:1). Respondents to the Audit were asked to identify the GFA of the main functional areas of their libraries. Six broad types of core functional areas are identified by People places: collection areas, reading and study areas, resource areas, staff areas, amenities and storage areas, and additional service areas. Each of these functional areas required the identification of separate floorspace data in the Audit. It was acknowledged that there may be some crossover of area usage; the instructions asked for areas to be allocated to their dominant use. Some libraries did not have specific functional areas in each category; these are indicated as ‘0’. Preparation of the LGA reports suggests that the functional areas GFA data appears, in a number of cases, to have been entered in error, as the sum of all functional areas exceeds the total GFA of the branch. It is likely that such errors have arisen due to manual room measurement and

- 56 -
approximations being made. Tables 3.18–3.23 present this data. The following analysis should be considered in this respect.
Collection areas Collection areas include: books on shelves, periodicals, non-print materials, toy libraries, and digital and virtual resources. The provision of these is shown in Table 3.18.
Table 3.18: Functional area – Collections (Q.12a)
Collections areas (sq m) Branches* %
0 1 0.4%
1–49 35 15.5%
50–149 62 27.4%
150–299 54 23.9%
300–449 43 19.0%
450–599 11 4.9%
600> 20 8.8%
Total 226 100%
* 18 branches (7.4%) did not complete this question
The highest proportion of libraries (27.4%) had between 50–149 sq m of floorspace used for collections. Another 23.9% of libraries had between 150–299 sq m and 19% between 300–449 sq m. A much lower proportion of libraries (15.5%) had less than 49 sq m of floorspace for collections, and 13.7% of libraries had over 450 sq m, with 20 of these having over 600 sq m.
Reading and study areas Reading and study areas include: meeting areas, study areas, browsing, display and information areas/exhibition space, young adult area, multi-purpose rooms (training, AV), children’s storytelling area, specialist genre collection area, and specialist rooms (e.g. local and family history). Table 3.19 shows the floor areas used for these.
Table 3.19: Functional area – Reading and study (Q.12b)
Reading and study areas (sq m) Branches* %
0 17 7.6%
1–24 47 21.1%
25–49 45 20.2%
50–199 73 32.7%
200–349 28 12.6%

- 57 -
Reading and study areas (sq m) Branches* %
350–499 9 4.0%
500> 4 1.8%
Total 223 100%
* 21 branches (8.6%) did not complete this question
The modal frequency for provision of reading and study areas was in the category of 50–199 sq m of floorspace. Nearly one-third of libraries (32.7%) fell into this category; 20.2% of libraries had between 25–49 sq m for reading and study areas, and another 21.1% had between 1–24 sq m. Seventeen libraries indicated they had no space mainly for this purpose; 18.4% of libraries had 200 sq m used for reading and study areas, with four of these libraries having over 500 sq m.
Resource areas Resources areas include: returns and enquiries desk, service desk, internet terminals, catalogues, printers, photocopiers, vending machines, and telephones. The floor area used for these is shown in Table 3.20.
Table 3.20: Functional area – Resource (Q.12c)
Resource areas (sq m) Branches* %
0 9 4.0%
1–9 25 11.1%
10–49 100 44.4%
50–99 50 22.2%
100–199 31 13.8%
200–299 8 3.6%
300> 2 0.9%
Total 225 100%
* 19 branches (7.8%) did not complete this question
A large proportion of libraries (44.4%) provided between 10–49 sq m of floorspace for resource areas. The next highest category was 50–99 sq m, which was provided by another 22.2 % of libraries; 18.3% of libraries provided over 100 sq m, with two libraries providing over 300 sq m. Thirty-four (15.1%) libraries provided less than 10 sq m with nine of those libraries having no space for resource areas.
Staff areas Staff areas include: all back-of-house areas (e.g. back workrooms, lunch rooms, offices), as well as staff work areas, office space and storage (for archival materials). Table 3.21 shows the area used for these.

- 58 -
Table 3.21: Functional area – Staff (Q.12d)
Staff areas (sq m) Branches* %
0 8 3.6%
1–24 65 29.5%
25–49 46 20.9%
50–299 92 41.8%
300–499 5 2.3%
500–799 3 1.4%
800> 1 0.5%
Total 220 100%
* 24 branches (9.8%) did not complete this question
By far the highest proportion of libraries (41.8%) used between 50–299 sq m of floorspace for staff areas. However, 29.5% of libraries used between 1–24 sq m for staff areas, another 20.9% used between 25–49 sq m, and eight had no staff areas, totalling 54% of libraries with functional areas for staff of less than 50 sq m. Very few libraries (4.2%) had more than 300 sq m for staff areas.
Amenities areas Amenities areas include: foyer, lobby, corridors/circulation space, public, staff and accessible toilets, restrooms, plant equipment, storage (for maintenance equipment), and maintenance areas. Areas used for these functions are shown in Table 3.22.
Table 3.22: Functional area – Amenities (Q.12e)
Amenities areas (sq m) Branches* %
0 10 4.7%
1–19 50 23.6%
20–49 46 21.7%
50–149 72 34.0%
150–299 19 9.0%
300–449 10 4.7%
450> 5 2.4%
Total 212 100%
* 32 branches (13.1%) did not complete this question
The modal category for provision of amenities areas was between 50–149 sq m; however, 23.6% of libraries used between 1–19 sq m and another 20.9% between 25–49 sq m. Ten libraries had no area for amenities.

- 59 -
A small number of libraries had very large areas for amenities, including 9% between 150–299 sq m, 4.7% with between 300–449 sq m, and 2.4% with over 450 sq m; the latter does not appear to be reliable data.
Other areas Other areas include: bookshops, coffee shops, community services, bank services, Council customer services, etc. These are shown in Table 3.23.
Table 3.23: Functional area – Other (Q.12f)
Other areas (sq m) Branches* %
0 90 62.1%
1–14 8 5.5%
15–49 14 9.7%
50–99 7 4.8%
100–199 10 6.9%
200> 16 11.0%
Total 145 100%
* 99 branches (40.6%) did not complete this question
Nearly two-thirds of libraries did not have other areas (62.1%). Of those that did, in 11% (16 libraries) had areas 200 sq m and more; 6.9% (10 libraries) had areas between 100–199 sq m. Other libraries were distributed between the two extremes; there appears some polarisation in regard to different types of libraries in this respect. Other functional areas identified by branch libraries predominately included: space for collocated services, e.g. Council services, visitor information centre, professional office suites, consulting rooms, and English language and literacy. Other areas included: space for community groups, coffee shops, and community halls. Further information on such uses is discussed in the following Section 3.3.5.
3.3.5 Specialist uses of space Libraries were asked whether they provided floorspace regularly used for a number of other types of services identified in People places. Respondents were asked to indicate whether they provided that area exclusively (i.e. not shared), shared with other uses, or not at all. These responses are tabulated in Table 3.24.

- 60 -
Table 3.24: Provision of specialist floorspace (Q.14)
Specialist floorspace No
Yes, exclusive
Yes, shared Total*
Young adult area 71 (29.2%)
67 (27.6%)
105 (43.2%)
243 (100%)
Children’s storytelling area
15 (6.2%)
93 (38.3%)
135 (55.6%)
243 (100%)
Toy library 235 (96.7%)
5 (2.1%)
3 (1.2%)
243 (100%)
Specialist genre collection
134 (55.1%)
54 (22.2%)
55 (22.6%)
243 (100%)
Specialist rooms (e.g. local & family history)
187 (77.0%)
38 (15.6%)
18 (7.4%)
243 (100%)
Multi-purpose room 133 (54.7%)
55 (22.6%)
55 (22.6%)
243 (100%)
Mobile library services area
225 (92.6%)
5 (2.1%)
13 (5.3%)
243 (100%)
Community services, bank services, Council customer service
208 (85.6%)
12 (4.9%)
23 (9.5%)
243 (100%)
Exhibition space 144 (59.3%)
22 (9.1%)
77 (31.7%)
243 (100%)
Bookshop, coffee shop, gift shop
240 (98.8%)
2 (0.8%)
1 (0.4%)
243 (100%)
Computer lab/ internet area
52 (21.4%)
90 (37.0%)
101 (41.6%)
243 (100%)
Wireless internet 220 (90.5%)
6 (2.5%)
17 (7.0%)
243 (100%)
Staff lunchroom 48 (19.8%)
137 (56.4%)
58 (23.9%)
243 (100%)
Office space 54 (22.2%)
164 (67.5%)
25 (10.3%)
243 (100%)
Storage area (for archival materials)
175 (72.0%)
43 (17.7%)
25 (10.3%)
243 (100%)
* One branch did not complete this question
A children’s storytelling area was the most common type of other specialist use of space with 93.9% of libraries providing the service. A relatively large proportion of libraries (55.6%) provided it in a shared space; 38.3% provided it as an exclusive space.

- 61 -
The second most common type of other specialist space provided was staff lunchrooms (80.2% of libraries); 56.4% of these were for exclusive use, and 23.9% were shared. Office space was provided in a further 77.8% of libraries, with 67.5% of these being exclusive and only 10.3% shared, the highest proportion of exclusive space provided for specialist purposes. Computer labs/Internet areas were the third most commonly provided type of other specialist space; 78.6% of libraries provided space for this purpose. However, this space was shared in 41.6% of cases and exclusive in 37%. Provision of a young adult area was the next most common type of other specialist space provided; 70.8% of libraries provided an area for young adults. Like internet areas, in a relatively large number of libraries (43.2%) this was shared, while it was exclusive in 27.6% of libraries. No other type of specialist space was provided by more than half of the libraries. A multi-purpose room was provided by 45.3% of libraries; this was shared in half of the cases (22.6% of libraries), and exclusive in the other half (another 22.6%). An area for specialist genre collections was provided in 44.9% of libraries. Floorspace provided for this purpose was similarly almost equally either shared or exclusive. Exhibition space was provided in 40.7% of libraries. This was also commonly shared (31.7% of libraries), with only 9.1% of libraries having an exclusive space. Storage areas (for archival materials) were provided by a 28% of libraries. In 17.7% of libraries, these were exclusive areas; 10.3% were shared. A specialist room for local and family history was provided by 23% of libraries; 15.6% of libraries provided this space on an exclusive basis; and 7.4% were shared. Some libraries (14.4%) also provide space for community services, bank services or Council customer service areas; 9.5% of libraries provided this space shared, and 4.9% exclusively. Small proportions of libraries provided space for other purposes: 9.5% for a wireless internet area; 7.4% for a mobile library services area; 3.3% for a toy library; and 1.2% (only three libraries) for a bookshop, coffee shop or gift shop. Libraries (9.5%) provided space for a variety of other purposes. The types of space provided included: Study space/group or individual study rooms (seven libraries). Workrooms or particular kinds of offices (seven). Special areas, such as volunteer areas, or programs and events areas
(e.g. English language and literacy program) (two). Kitchens or kitchenettes, e.g. for community groups (two). Internal courtyard (one). Electronic games room (one).

- 62 -
3.4 The social role of library buildings in their communities The Libraries Building Communities research undertaken by the State Library of Victoria and the Victorian public library network demonstrated that libraries make a fundamental contribution to our communities in four key areas, by: providing free public access to computer and information technology
resources; creating better informed communities by helping people locate
information; running programs that promote life long learning and literacy in the
community; and building connections between individuals, groups and government
(Library Board of Victoria, Executive Summary, 2005:5). Furthermore, the facilities and services which public libraries provide are changing to meet new cultural needs and interests, particularly in response to the development of new media. These services may be offered in buildings alongside other public services (Worpole 2005:7). The literature identifies that both joint-use libraries and, more commonly, collocation of libraries with other Local Government or State Government services is an increasing trend both in Australia and overseas. Models of joint-use libraries and collocation can be distinguished as follows: A joint-use library (e.g. a combined public library and school library) is
defined as libraries where two or more distinct library service providers serve their client group in the same premises, the governance of which is cooperatively arranged between the separate authorities.
Collocated libraries are defined as multiple services (e.g. a library and other Council-related services) sharing a building, with separate areas for each service. These areas need not be physically separated by walls.
Objectives of any multi-function building/site, joint venture or partnership were identified in People places (Library Council of New South Wales 2005:35) as being to: provide an integrated and improved level of service, both collectively and
as individual services, than would occur through standalone facilities; meet the individual performance standards required by the governing
bodies and authorities involved; and where possible, provide a more economic use of services and resources.
Collocation, in particular, is seen to have many perceived advantages, although the potential disadvantages also need to be addressed. Potential benefits were identified as including: sharing of resources such as staff, space and equipment; encouraging wider public use by providing access to a range of services at
one facility, i.e. the one-stop shop concept; improving the cost effectiveness of the service provided while also
enhancing service quality;

- 63 -
reducing duplication of resources and rationalisation of property portfolios; and
providing specialist facilities and services, e.g. specialist expertise in technology together with equipment (Library Council of New South Wales 2005:35).
Bundy (2003b) noted that joint-use libraries, particularly school/community libraries, are widespread in Sweden, Canada and in South Australia. They are less common elsewhere in Australia, and, as evidenced by the Audit, Victoria (see Table 3.25). The Australian Library and Information Association (ALIA) (2002) has issued a policy statement that supports the establishment of joint-use of library functions if they equal or better the level of service which would be given in separate facilities.
Table 3.25: Collocated or joint-use libraries (Q.16a)
Collocated Joint-use
Joint-use Branches* % Branches %
Yes 127 52.3% 24 9.8%
No, freestanding 116 47.7% 220 90.2%
Total 243 100% 244 100%
* One branch did not complete this question
Collocated libraries are much more common in Australia. This is supported by the results of this Audit (Table 3.25). They typically bring together other Council-related services such as the Council chambers/offices, community centres, arts centres, youth facilities, and/or one-stop-shop services. More recently, collocated libraries have been developed with other government services such as community health centres, home and community care centres, employment services, or community technology centres. Collocated uses overseas vary as widely as police stations, Registry of Births, Deaths and Marriages, and a marriage suite (Worpole 2005:8). A concept gaining increasing favour is a library being developed as a key element in community hubs and learning centres. Libraries Building Communities (Library Board of Victoria, Report 2, 2005:46) envisages that communities could build hubs that house a range of services such as library services, children’s services, medical centres, maternal support groups, drop-in centres, and other learning and community activities. Collocation with arts centres, local halls, and the display of local arts and crafts were also envisaged as an opportunity to provide a more significant meeting place for the local community. The ‘library centre’ could provide a café style atmosphere for key groups, and house a community development worker, thus enabling libraries to focus more on being an effective connector to other community resources. This is in line with the concept of the library as an anchor of the community (discussed in Section 1.3.1).

- 64 -
Case study 5: West Footscray Library, Maribyrnong Library Service
Gross floor area: 960 sq m
User catchment: Specifically West Footscray, Braybrook and Maidstone suburbs; generally City of Maribyrnong
Cost: $2.31 million
Architect: Whitefield McQueen Architects
Date completed: 19 October 2007
Usage: Library visits have increased by 125%, and new members by 43% in the first six months of operation.
The West Footscray Community Learning Centre is a new facility built on the site of the former West Footscray Library, originally established in 1974 in a hall donated by the West Footscray Progress Society. The new centre is a two-story facility, collocating a library and neighbourhood house, and incorporating innovative and environmentally sensitive design reflecting the physical characteristics and heritage of the West Footscray area. The built form and materials of the centre successfully incorporate the characteristics of the local area, particularly the identity of Footscray as a transport and industry hub. The use of decoratively arranged railway sleepers encircling the lower level and perforated metal encasing the upper level not only recall the local heritage of rail and shipping industries, but also serve as natural insulation and light filtering to ensure a comfortable and environmentally friendly interior. Local artists have also contributed to the unique design with specially commissioned interior fittings and a magnificent gateway entrance to the centre.

- 65 -
West Footscray Library continued Environmentally responsible design has also been addressed through passive solar design, the use of solar efficient ‘low-e’ glass, and the use of recycled natural materials to key areas.
Central to the successful implementation and ongoing operation of the West Footscray Learning Centre has been the strong partnership and cooperation developed between the library service and the West Footscray Neighbourhood House. With the library occupying the ground floor, and the Neighbourhood House the upper floor of the facility, the Centre has enabled the dove-tailing of services and the sharing of resources, greatly benefiting users of both services. Community education programs at the Neighbourhood House are enhanced by supporting resources and facilities within the library, particularly extensive IT facilities. The innovative ‘hot office’ IT section of the library not only provides the public with internet, but also a range of image editing and desktop publishing applications, and scanning and printing facilities. The occasional childcare operated by the Neighbourhood House likewise benefits from the Library’s children’s services, storytimes, programs and resources. Three meeting rooms for use by Neighbourhood House and library also greatly benefit the local community.

- 66 -
3.4.1 Collocation Libraries were asked whether they were collocated or integrated with other facilities or services. Table 3.25 shows the results of this question. A significant 52.3% (127) of libraries said that they were collocated or integrated with other types of facilities or services. The types of other uses with which they were collocated are shown in Table 3.26
Table 3.26: Forms of collocation (Q.16b)
Yes No Total*
Collocation Branches % Branches % Branches %
Private sector businesses (e.g. shops)
13 10.2% 114 89.8% 127 100%
Childcare 6 4.7% 121 95.3% 127 100%
Community centre 22 17.3% 105 82.7% 127 100%
Youth centre 0 0% 127 100% 127 100%
Community health centre 6 4.7% 121 95.3% 127 100%
Council one-stop-shop services
42 33.1% 85 66.9% 127 100%
Other Local Government service
55 43.3% 72 56.7% 127 100%
State Government service
14 11.0% 113 89.0% 127 100%
Federal Government service
1 0.8% 126 99.2% 127 100%
Other service 43 33.9% 84 66.1% 127 100%
* Of those 127 branches which are collocated/integrated
The most common type of facility which libraries were collocated with was Local Government services. Of those that were collocated, one-third (33.1%) were collocated with a Council one-stop-shop (17.2% of all libraries); 43.3% (22.5% of all libraries) were collocated with other types of Local Government services. Hence, in total two-fifths (39.7%) of all libraries were collocated with other Council uses. A further 17.3% of those that were collocated (another 9% of all libraries) were integrated with a community centre, also sometimes a Local Government function, taking the overall proportion to just on half. None were collocated with youth centres; another 4.7% of collocated libraries were integrated with childcare centres (2.5% of all libraries).

- 67 -
Fourteen (11%) collocated libraries were integrated with State Government services and another 4.7% with community health centres, usually a State Government function. One library was collocated with a Federal Government function. Hence, in all, around 60% of libraries were collocated with either Local, State or Federal Government services. Thirteen (10.2%) collocated libraries were collocated with private-sector businesses such as shops; this equated to 5.3% of all libraries. One-third of collocated libraries (17.6% of all libraries) identified services other than the above with which they were collocated. These included: Community services or space for community groups (nine libraries). Halls (three), meeting rooms (four), neighbourhood houses (two) or
theatrettes (one). Art galleries (three), exhibition space (one) or museums (two)/local
historical society (three). Schools/school functions (two), a college of advanced education (one),
learning centre/adult education (two). Private-sector businesses, including:
− Professional offices including rooms for health professionals/doctors (three), and banks or banking facilities (three); and
− Cafes (four). Churches (two). Clubs, such as bowling clubs or RSLs (two), and a Senior Citizens Club. Recreation and sporting functions, such as a recreation centre (one) and
aquatic centre (one). Council Chambers (one) or Town Hall (one). Radio station (one).
Collocated libraries were asked the percentage of the overall complex dedicated to library functions. More than one-third (34.6%) of collocated libraries had between 25–49% of the overall complex dedicated to library functions; the next most frequent category was 23.6% which had 50–74% dedicated to library functions. Another 17.3% had under 25%. Fewer proportions had more than 75% of their space dedicated to library functions. This is shown in Table 3.27.
Table 3.27: Collocated area dedicated to library functions (Q.16c)
Collocation Branches %
<25% 22 17.3%
25–49% 44 34.6%
50–74% 30 23.6%
75–89% 16 12.6%
90%> 15 11.8%
Total 127 100%

- 68 -
There is no correlation3 between whether a library is or isn’t collocated and the number of visitors it attracts each week.
3.4.2 Joint-use Only 9.8% of Victorian library branches indicated they operated within a joint-use or multi-use facility, representing 24 branches (Table 3.25). However, this question may have been misinterpreted by up to 13 branches, as the arrangements described appeared to be better classified as collocated rather than joint-use facilities (e.g. Council services, such as customer service). This report has, however, treated these responses as they have been self-reported by the branches concerned. In Victoria, joint-use arrangements currently exist with a number of primary (three) and secondary (seven) schools, as well as TAFE and CAE users (two). Other users include art galleries (two), as well as health and welfare services (two).
3 The correlation coefficient = 0.0268.

- 69 -
Case study 6: Wheelers Hill Library, Monash Public Library Service
Gross floor area: 874 sq m
User catchment: Wheelers Hill Library services the eastern sector of the municipality, while the centre attracts visitors from across Melbourne
Cost: $1,701,068
Architect: Cox Sanderson Ness
Date completed: April 2002
Usage: Loans: 374,605. Loans have increased from 18,000 per month in early 2002 to 30,000 per month in mid 2005. Visits: 148,035. Visits have increased by approx. 3,000 people per month during the same period. (2005/2006)
The Wheelers Hill Library and Monash Gallery of Art project has been a significant success for the City of Monash community since opening in 2002. The complex comprises Wheelers Hill Library, Cafe and Gallery extension, integrated into a residential estate design plan. The innovative integration of residential development with public open space, great landscape design and high quality civic buildings has ensured a harmonious and environmentally sustainable development for future generations to enjoy.

- 70 -
Wheelers Hill Library continued
Wheelers Hill Library features include an 80-seat meeting room, quiet study room, junior literacy and multimedia collections, an expanded Chinese language collection, and the MGA book collection. Artist talks, public programs and activities support the exhibition program. Cafe @ MGA is a local cafe and community meeting place; patrons can also bring coffee and a snack into the library to read and relax. Collocation initiatives have included library booklists supporting gallery exhibitions, library services storytimes in the gallery and literary talks themed to exhibitions. With views over an ornamental pond to the Dandenongs, the library is a peaceful space for study and a vibrant location for thriving book clubs, community groups, workshops and literary events.

- 71 -
4. PHYSICAL ASSESSMENT OF BUILDINGS
This section provides a physical assessment of buildings, including user views on quality; condition and type of building; accessibility and mobility issues; facilities such as lighting, signage and user comfort; compliance with Codes and Regulations such as the Building Code of Australia, fire rating, disability and Occupational health and safety requirements; community safety; and tenure. It also reviews whether buildings are future proof in terms of technology, the changing role of libraries in the community, and environmental sustainability. Finally, it concludes on the basis of the above whether buildings are, in fact, ‘fit for purpose’.
4.1 Context A number of challenges are facing library managers and planners in designing successful libraries for the future. These include: Population and demographic mix changing more rapidly than ever before. Information and Communications Technology (ICT) reconfiguring the
nature of physical space, communications and movement. Education moving out of institutions to inflect the whole of society. Leisure, recreation and personal development increasingly fuse in a more
individualistic culture (CABE & Resource 2003:4) Essentially, changes in services and functions such as those discussed in the preceding sections obviously mean changes in design and plan. ‘Traditional library design has to be adapted or superseded’ (Worpole 2005:8) to meet changing needs for the 21st century. The Museums, Libraries and Archives Council in the United Kingdom has undertaken a series of studies in recent years, examining the design requirements for future libraries. Key design elements include: Establishing the appropriate ethos –reflect the priority services for its
particular set of users. The library as a second home. A window on the world. Time-tabling access and circulation. The library is a public space (and place). Finding a way through the labyrinth. Designing in (and out) technology. Handling conflicting needs and interests. Family-friendly design. Security issues (Worpole 2005:12–15).
New design trends which are emerging include: Modern free style. Open-plan design and circulation. Good disability access. Street level, retail entrances.

- 72 -
Contemporary cultural market-place. Each library will develop its own bespoke program and service priorities. Future libraries will be developed in partnership with other services. Adaptability of internal design, circulation, access and hours of services
will be a key factor in building layout and design. Reading development and literacy are likely to become even more central
to what libraries offer communities. Libraries will become key communications centres for mobile
populations. Long stay use of libraries for study purposes requires friendly and
efficient support services such as toilets, catering and recreational quiet zones.
Electronic links between homes and libraries will increase. Children’s services will grow in importance as the library becomes a
secure, electronic safe haven in the city. Virtual library services will be provided 24 hours a day. Librarians will change their role from custodians of culture to knowledge
navigators (CABE & Resource 2003:4–5).
4.2 Respondent views on quality
4.2.1 Survey respondents’ perception of library quality The link between a library’s community value and its physical design and layout is well-established in the literature. A library can be busy, but still underused or difficult to use because of factors such as ‘poor signage, poor location, poor parking and transport access, unattractive and crowded buildings, poor disability access, weak and out-of-date resources, poor hours and poor staffing levels’ (Bundy 2006b:2). CABE and Resource (2003:3) noted that ‘quality design will have a major role in delivering a twenty-first century library service; drawing in the diverse communities they serve’. Research has indicated that the principal reasons for not using libraries are to do with lifestyle issues. Current public library designs can create barriers, ‘intimidating for some and simply off-putting for others, with dull official looking facades, imposing issue desks, formal layouts and uncomfortable furniture’ (CABE & Resource 2003:14). This was explored by a number of questions in the Audit gauging the survey respondents’ assessment of: the physical building; the library’s internal layout and design; the overall standard of their library branches (i.e. more than the
building); and the finest and worst attributes of their building.
When interpreting these responses, it is important to keep in mind that the survey respondents are most likely to be branch librarians, and they have answered these questions from their perspective; they are neither public library users nor the library service manager, who has responsibility for

- 73 -
management of the building and strategic decisions about its future. Accordingly, their views may or may not reflect the views of these other stakeholder groups. The Audit undertook to measure librarians’ views about the quality of their buildings as they are daily users of their building and have a useful qualitative perspective to add to the technical assessment of quality and standards of provision. A survey of library users would be impractical for this study.
Figure 4.1: Survey respondents’ perceptions of quality (Q.33a–c)
10.3%
57.9%
31.8%
19.3%
55.1%
25.5%
19.8%
55.8%
24.4%
0%
10%
20%
30%
40%
50%
60%
70%
80%
90%
100%
Overall standard of library Building Internal layout and design
ExcellentSatisfactoryUnsatisfactory
Table 4.1: Survey respondents’ perceptions of quality (Q.33a–c)
Rating standard
Overall standard of
library Building Internal layout
and design
Excellent 31.8% 25.5% 24.4%
Satisfactory 57.9% 55.1% 55.8%
Unsatisfactory 10.3% 19.3% 19.8%
Respondents were asked to rate their perception of the overall standard of their library branches. This was an assessment of more than the building fabric, and includes stock, service, satisfaction of user needs, etc. Almost one-third (31.8%) of respondents rated their branch as being of an excellent standard overall, more than half (57.9%) gave an overall rating of satisfactory, and 10.3% rated their overall standard of their library branch as unsatisfactory (Figure 4.1). When asked to rate their perception of the quality of their branch’s physical building, one-quarter (25.4%) of respondents rated the quality of their library building as excellent, and more than half (54.9%) rated their building as satisfactory.

- 74 -
Similar results were also received from respondents when asked to rate the quality of their library’s internal layout and design, with one-quarter (24.2%) rating it as excellent, just over half (55.3%) as satisfactory, and one-fifth (19.7%) as unsatisfactory. Closer examination of these perceptions shows that: Of the 77 libraries that gave their branch an overall rating of excellent,
61% also described the standard of their library building as excellent and the remaining 39% described it as satisfactory.
Twenty-two of the 25 libraries that described the overall standard of their library branch as unsatisfactory also gave their library building a rating of unsatisfactory.
This suggests that, as expected, respondents’ views of the quality of the library building are a key factor in their perception of the overall standard of their library branch. Similar findings were also found when respondents’ overall views of library branch quality were compared to their ratings for the library building’s internal layout and design: Of the 77 libraries that gave their branch an overall rating of excellent,
65% also described their library’s internal layout and design as excellent and the remaining 35% described it as satisfactory.
Twenty-two of the 25 libraries that described the overall standard of their library branch as unsatisfactory also described the internal layout and design of the library as unsatisfactory.
It is apparent that both the physical library building and its internal layout and design are given similar levels of importance in determining the overall standard of a library branch. As identified elsewhere, some public libraries in Victoria are ‘working harder’ than others; this is linked to respondent perception, and is explored in more detail in the next section.

- 75 -
Case study 7: Wangaratta Library, High Country Library Corporation
Gross floor area: 1,902 sq m (including 180 sq m HCLC Headquarters)
User catchment: Rural City of Wangaratta (26,959 population) and Goulburn Ovens Institute of TAFE staff and students, Wangaratta campus
Cost: $3,373,083 excl GST
Architect: John Brand
Date completed: 13 December 2006; opened 5 February 2007
Usage: Opening hours increased from 47.5 to 51.75 per week Visits up 38% Loans up 30% Internet usage up 38%
The Wangaratta Library is a joint venture between the Rural City of Wangaratta and Goulburn Ovens Institute of TAFE. High Country Library Corporation is the partner responsible for providing a seamless service to the broad community, including TAFE staff and students. The response to our new library is pure nostalgia, pride and excitement. The development makes creative and stylish use of the original Wangaratta Technical School, a heritage building constructed in 1927. A circular drive means vehicles, including local buses, can stop right at the front door for easy access.

- 76 -
Wangaratta Library continued
While the facade remains unchanged, the interior is transformed. The original quadrangle has been enclosed, creating a large, light-filled space that houses the integrated collections of the Wangaratta Library and GOTAFE. Clever design has created a unique blend of the historic and modern, with original classrooms recycled to provide special spaces for everyone. There are private corners for quiet reading, fully equipped meeting and seminar rooms, computer labs, exhibition space for artwork, display areas, and a local history room. The Gen Y group helped design the Teen Lounge area with its Nintendo games and chill-out furniture. Adults rarely invade this space, which allows us to truly engage with an age group notoriously difficult to attract to the library. In the opposite corner is the cheerful Kids’ Corner which is separated from the magazine and coffee area by an artistic glass wall. Parents can still supervise their children while enjoying a coffee and reading a magazine. Electronic notice boards, bookshop style shelving and ample face-out display are simple marketing tools in use throughout the building. The practical allocation of space allows the library to fully exploit its shared resources, services and programs in a wonderful, welcoming community hub.

- 77 -
4.2.2 Finest and worst features Library branch respondents were asked to rank what they perceived to be the three finest and three worst attributes of their library buildings. Figure 4.2 shows the proportion of libraries that listed each feature as their finest quality, as well as the proportion of respondents who ranked the item as being among their library’s three finest attributes.
Figure 4.2: Survey respondents’ perceived finest attributes of library buildings (Q.33d)
0.4%
0.4%
0.4%
0.9%
0.9%
1.3%
1.3%
1.8%
1.8%
1.8%
2.2%
2.6%
2.6%
4.4%
5.3%
6.2%
9.7%
10.1%
12.8%
33.0%
1.7%
0.5%
0.2%
2.5%
0.5%
3.4%
3.1%
1.9%
1.7%
0.9%
2.9%
6.8%
1.9%
4.3%
4.5%
6.5%
7.1%
13.0%
11.8%
20.0%
0.0% 5.0% 10.0% 15.0% 20.0% 25.0% 30.0% 35.0%
Not applicable/not known
External signage
Inter-branch borrowing
Heating/cooling system
Ergonomic ‘shute to shelf’ returns system
Collocation
Excellence in a particular service
Parking
Community benefit
Staff
Light
Accessibility
Heritage elements
Architectural design
Modernity
Ambience
Size/space
Layout
Natural light
Location
Among three finest qualitiesFinest quality
Location was viewed as the best feature of one-third (33%) of Victorian public libraries, making it the highest ranking positive attribute. It was also the highest ranked response when the first, second and third finest qualities were combined, mentioned as a positive feature by one-fifth (20%) of all library branches. Natural light and layout received the second and third highest proportion of responses, ranked as the finest feature by 12.8% (11.8% of all responses) and 10.1% of branches respectively. The order of these last two items are reversed when the three finest attributes mentioned by all libraries are taken into consideration, with 13% and 11.8% of branches listing layout and natural light respectively among their libraries’ three finest features. The availability of adequate size and space within buildings (7.1% of all responses), accessibility (6.8% of all responses) and general ambience (6.5% of all responses) were also highly rated characteristics of public libraries.

- 78 -
Figure 4.3: Survey respondents’ perceived worst attributes of library buildings (Q.33e)
2.6%
0.2%
0.2%
0.3%
0.5%
0.8%
1.0%
1.1%
1.5%
1.6%
1.8%
1.9%
2.1%
2.7%
3.1%
3.7%
3.9%
4.5%
5.2%
6.0%
6.5%
7.9%
8.1%
10.5%
22.5%
1.3%
0.0%
0.0%
0.0%
0.4%
0.0%
0.0%
0.4%
0.9%
1.8%
1.3%
1.8%
1.8%
2.2%
1.8%
2.2%
0.4%
4.4%
5.3%
7.1%
7.5%
10.6%
8.0%
10.2%
30.5%
0.0% 5.0% 10.0% 15.0% 20.0% 25.0% 30.0% 35.0%
Not applicable/not known
Need for further staff training
Under-utilised
Limited opening hours
Ambience
Technology limitations
Energy efficiency
External security (building)
External security (personal)
Accessibility
External appearance (building/grounds)
Exterior signage
Lack of/limited amenities
Disabled access
Lighting
Internal assets (e.g. shelving, furniture, signage)
Collocation
Parking
Entrance (e.g. orientation, presence)
Location
Heating/cooling/ventilation
Condition of building (age/dated)
Quality of staff areas/facilities
Layout
Size/space
Among three worst qualitiesWorst quality
Figure 4.3 outlines what respondents perceived to be the worst features of their library buildings, including the proportion which ranked each item as the worst feature, as well as the proportion of respondents who perceived the items as being among their library building’s three worst features. The worst features tend to reflect the absence of those features valued highly as positive attributes discussed above. The size of the library building, including the space within it, is clearly the most common challenge faced by branches, perceived by almost one-third (30.5%) of respondents to be the building’s worst feature. It was also ranked as being among the building’s three worst features by more than one-fifth (22.5%) of respondents, the highest response overall. After size/space, the condition or age of the building was ranked by 10.6% of respondents as the worst feature (7.9% overall). The layout of the building was ranked by 10.2% of respondents as the worst feature (the third most popular response), rated poor by 10.5% overall, which interestingly received almost the same proportion of responses (10.1%) for being the finest attribute. The quality of staff areas received the third highest number of responses when first, second and third worst features of library buildings were taken into consideration (8.1% overall). Other features which rated poorly overall included poor climate control (6.5%) and poor location (6%).
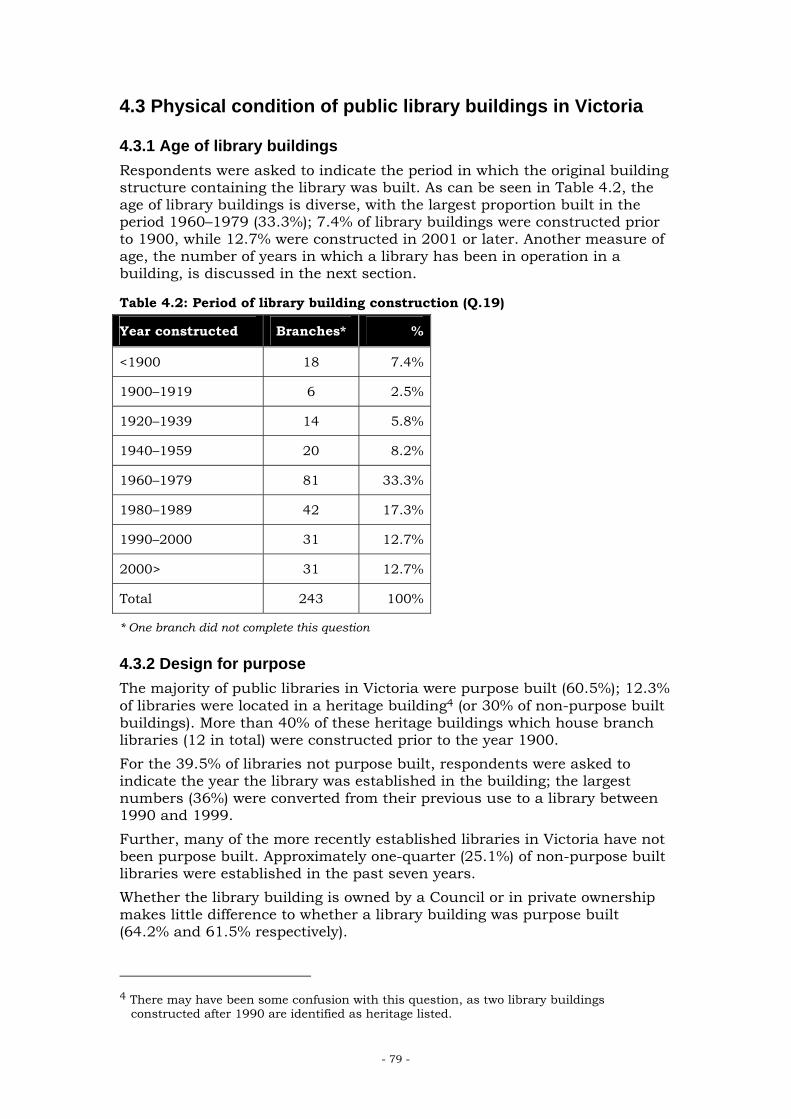
- 79 -
4.3 Physical condition of public library buildings in Victoria
4.3.1 Age of library buildings Respondents were asked to indicate the period in which the original building structure containing the library was built. As can be seen in Table 4.2, the age of library buildings is diverse, with the largest proportion built in the period 1960–1979 (33.3%); 7.4% of library buildings were constructed prior to 1900, while 12.7% were constructed in 2001 or later. Another measure of age, the number of years in which a library has been in operation in a building, is discussed in the next section.
Table 4.2: Period of library building construction (Q.19)
Year constructed Branches* %
<1900 18 7.4%
1900–1919 6 2.5%
1920–1939 14 5.8%
1940–1959 20 8.2%
1960–1979 81 33.3%
1980–1989 42 17.3%
1990–2000 31 12.7%
2000> 31 12.7%
Total 243 100%
* One branch did not complete this question
4.3.2 Design for purpose The majority of public libraries in Victoria were purpose built (60.5%); 12.3% of libraries were located in a heritage building4 (or 30% of non-purpose built buildings). More than 40% of these heritage buildings which house branch libraries (12 in total) were constructed prior to the year 1900. For the 39.5% of libraries not purpose built, respondents were asked to indicate the year the library was established in the building; the largest numbers (36%) were converted from their previous use to a library between 1990 and 1999. Further, many of the more recently established libraries in Victoria have not been purpose built. Approximately one-quarter (25.1%) of non-purpose built libraries were established in the past seven years. Whether the library building is owned by a Council or in private ownership makes little difference to whether a library building was purpose built (64.2% and 61.5% respectively).
4 There may have been some confusion with this question, as two library buildings
constructed after 1990 are identified as heritage listed.
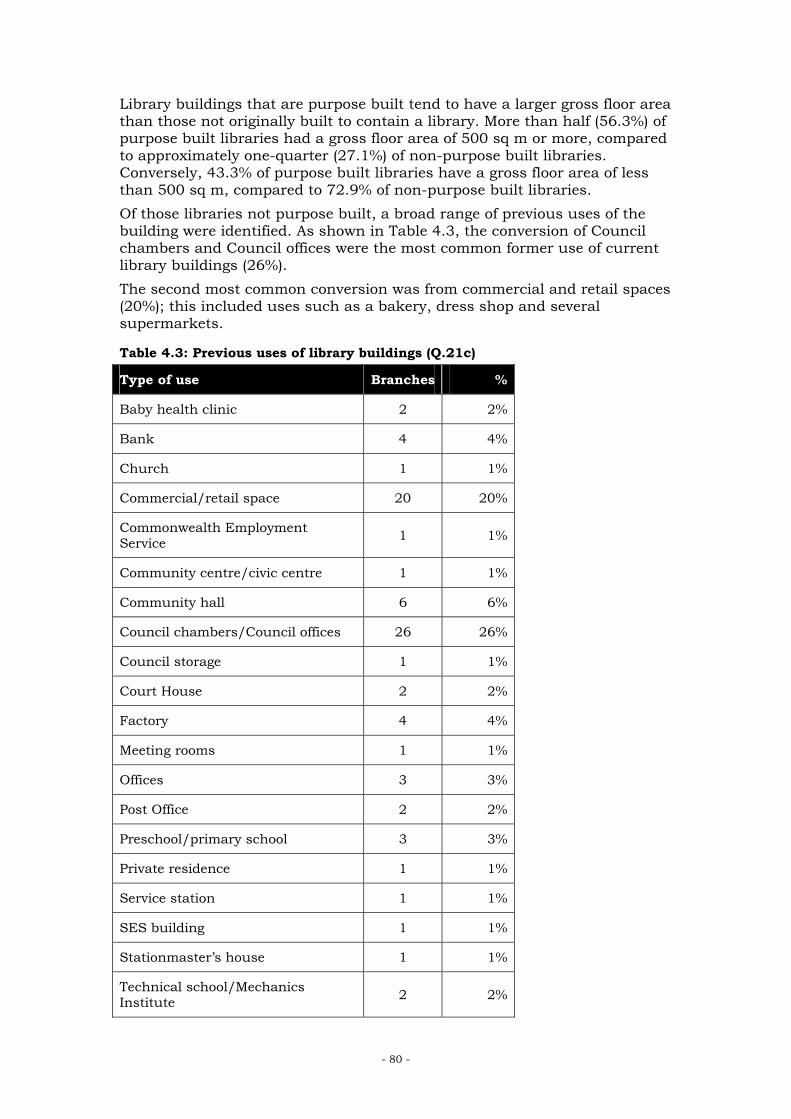
- 80 -
Library buildings that are purpose built tend to have a larger gross floor area than those not originally built to contain a library. More than half (56.3%) of purpose built libraries had a gross floor area of 500 sq m or more, compared to approximately one-quarter (27.1%) of non-purpose built libraries. Conversely, 43.3% of purpose built libraries have a gross floor area of less than 500 sq m, compared to 72.9% of non-purpose built libraries. Of those libraries not purpose built, a broad range of previous uses of the building were identified. As shown in Table 4.3, the conversion of Council chambers and Council offices were the most common former use of current library buildings (26%). The second most common conversion was from commercial and retail spaces (20%); this included uses such as a bakery, dress shop and several supermarkets.
Table 4.3: Previous uses of library buildings (Q.21c)
Type of use Branches %
Baby health clinic 2 2%
Bank 4 4%
Church 1 1%
Commercial/retail space 20 20%
Commonwealth Employment Service 1 1%
Community centre/civic centre 1 1%
Community hall 6 6%
Council chambers/Council offices 26 26%
Council storage 1 1%
Court House 2 2%
Factory 4 4%
Meeting rooms 1 1%
Offices 3 3%
Post Office 2 2%
Preschool/primary school 3 3%
Private residence 1 1%
Service station 1 1%
SES building 1 1%
Stationmaster’s house 1 1%
Technical school/Mechanics Institute 2 2%

- 81 -
Type of use Branches %
Undercover car park within shopping centre 2 2%
Town Hall 10 10%
Original purpose unknown 5 5%
Some buildings identified multiple previous uses, and each has been included. There were 96 branch libraries identified as being non-purpose built (Q21c).
4.3.3 Refurbishment Respondents were asked about any refurbishments undertaken of branch library premises. Major refurbishment was defined to include, but not be restricted to, changes to internal partitions, the size and shape of rooms, as well as alterations to entry and exits. Major works was defined to exclude painting or replacement of carpets, but these could be included as a component of larger works. If the building had received several minor works over the past five years, which if built together would constitute major works, the respondent was requested to treat all works as the one refurbishment. The number of years over which the works were undertaken was also indicated. In total, more than one-third of Victorian library branches (39.3%, representing 96 libraries) indicated they had not received any refurbishment since being built. A further 12 libraries (4.9%) did not know whether they had been refurbished or not; included within these 12 libraries are a large number constructed more recently, which are less likely to need refurbishing. These figures do not necessarily indicate that refurbishment is required, but it is considered to be more likely. The perceived need for future refurbishment within the next five years is identified in Table 4.4. Overall, more than two-thirds of respondents (73.9%) indicated that such works were not required over the next five-years to their branch library. It is noted that the condition of the library building was the second highest response (10.6%) for what was perceived to be the worst features of individual library branch buildings (Section 4.2.2), and the fourth highest response (7.9%) when all ‘worst’ responses are combined. These results suggest that although the aged or dated nature of the building is not perceived to be the most negative feature of the building, it is still viewed as one of the most common features which presently detracts from the library building as a whole. Further details on planned refurbishments are discussed in Section 7 of this report.

- 82 -
Table 4.4: Requirement for major refurbishment/extension in next five years (Q.43a)
Overall Requirement for major refurbishment Branches* %
Yes 60 26.1%
No 170 73.9%
Total 230 100%
* 14 branches did not complete this question
A total of 136 library buildings, representing 58.6% of all branches, have undergone major refurbishment. Of these, approximately two-thirds (63.9%) of the most recent refurbishments had taken place in the past seven years (Table 4.5). Detailed analysis of the year of the most recent refurbishment compared to the year that the library building was originally constructed revealed the relatively slow progress of refurbishment, even on older buildings (Table 4.5).
Table 4.5: Most recent major refurbishment by age (year built) of library (Q.19)
Most recent major library refurbishment Year library building constructed
1970–1979
1980–1989
1990–1999
2000– 2004 2005>
Not known Total
<1900 1 1 2 6 1 1 12
1900–1919 0 0 0 1 2 0 3
1920–1939 1 1 5 0 5 2 14
1940–1959 0 0 5 3 4 0 12
1960–1979 0 1 17 26 14 1 59
1980–1989 0 2 7 7 4 0 20
1990–2000 0 0 1 5 2 0 8
2000> 0 0 0 3 4 1 8
Total 2 5 37 51 36 5 136
Overall, at least $56.8 million was spent on the last major refurbishment undertaken of all public library buildings in Victoria. However, the actual cost is likely to be significantly higher, as 27 branches, or 19.9% of refurbished branches, did not indicate the cost of their refurbishments. It is also noted that these costs do not account for changes in the Consumer Price Index (CPI) between the years measured. Acknowledging these limitations, the average cost of library refurbishment was approximately $520,000.

- 83 -
However, this average is skewed by a number of large refurbishments. More than half (55.5%) of library branches whose buildings had been refurbished indicated that the total cost of refurbishments was less than $500,000 (Table 4.6); 14% of libraries estimated the total cost of refurbishments to be $1 million dollars or more.
Table 4.6: Cost of most recent major refurbishment (Q.22a)
Cost of most recent major refurbishment Branches %
<$50,000 20 14.7%
$50,000–$99,999 11 8.1%
$100,000–$249,000 26 19.1%
$250,000–$499,999 19 14.0%
$500,000–$999,000 15 11.0%
$1,000,000–$1,999,999 13 9.6%
$2,000,000> 6 4.4%
Total* 110 100%
* 26 refurbished branches did not complete question. Cost provided to nearest $100,000.
It is evident from Figure 4.4 that libraries undertake a wide range of works as part of major refurbishments. The most common types of refurbishment works undertaken in Victorian libraries were internal reorganisation of space and painting (both 77.4% of refurbished libraries), followed by carpeting or other floor covering as part of major works (73.7%), and internal structural alterations (68.6%). Interestingly, 4.4% of refurbished libraries stated that refurbishment involved a decrease in floorspace. Other works undertaken (by 25 libraries) involved environmental sustainability improvements, the construction of new external doors, windows and rooves, landscaping, and the development of collocated facilities (such as a Customer Service Centre). In a few cases, a complete rebuild of the library at the same site was undertaken.

- 84 -
Figure 4.4: Type of work undertaken at last major refurbishment (Q.22b)
0.0% 10.0% 20.0% 30.0% 40.0% 50.0% 60.0% 70.0% 80.0% 90.0%
Other works
Wireless internet
Decreased floorspace
Improvements to other functional areas
Energy consumption improvements
Building services upgrade
Building materials – external cladding
Fire safety improvements
Improved amenities areas
Heating
Additional floorspace
Air conditioning
Improved staff areas
Improved computer access
Improved disabled access
Improved reading and study areas
Improved resource areas
Improved shelving
Improved collection areas
Internal structure alterations
Carpeting or other floor covering
Internal reorganisation of space
Painting
4.4 Flexible and multifunctional buildings Library buildings need to provide different types of spaces to meet the diverse needs of a variety of different users. As noted in People places (Library Council of New South Wales 2000:50), ‘Design, layout and service requirements change so rapidly that flexibility must be designed and built into a new building’. These spaces also need to be designed so that they are separate, yet do so without segregating or causing ‘no go zones’ e.g. children only in children’s spaces (Cox 2000). However, just under half of branch libraries (110 or 45.2%) contain specialist multi-purpose areas (Table 3.24, Q.14e). Only 37 libraries (15.2%, Q.15) stated they had the ability to subdivide multi-purpose areas within their building, such as through the use of wall partitions. A further 56 libraries (23%, Q15) stated they had no space which could be considered as multi-purpose. Less than one-quarter (23.4%) of branch libraries (57 in total) indicated they possessed the ability to adapt existing spaces within their building for new uses, as an alternative to major alterations.

- 85 -
The existence of joint-use and collocated libraries in Victoria is discussed in Section 3.4.
4.5 Internal accessibility and mobility Accessibility is an important aspect of any public facility. As noted in People places (Library Council of New South Wales 2005:51), ‘a library must be open and accessible to the whole community. This means designing a building that promotes equality for young and old, people with prams and people with a disability’. In addition to meeting the disability access requirements, ‘the best library buildings also provide for other dimensions of access including psychological, sensory, financial as well as provision for socially excluded groups such as ethnic minorities and the mentally disabled’ (Bryson et al 2003:9). Such broad measures could not easily be measured through the Audit. A series of questions were asked throughout the Audit to ascertain the current level of internal accessibility of Victorian public library buildings. External accessibility to the building is discussed in Section 5.3. Access Audits are formal assessments used to determine whether a building meets the design requirements specific to the needs of people with a disability, as outlined in the Australian Standards Design for Access and Mobility (AS 1428) (Standards Australia 2003) and the Building Code of Australia (BCA). Almost two-thirds (63.4%) of branches indicated they had undertaken an access audit of their library building, approximately one-quarter (27.6%) indicated one had not been undertaken, and a further 9.1% were not aware of whether such an audit had been undertaken. The majority of these access audits had been undertaken recently. Of those libraries that had undertaken an access audit, more than one-third (36.1%) had been carried out during 2006/07. Just 7.1% had completed their last audit prior to the year 2000 (Table 4.7). A notable proportion of branches could not identify which year an audit had been undertaken, despite being sure that one had been completed. This suggests that the outcomes of audits are not widely publicised for action.
Table 4.7: Year access audit undertaken (Q.25b)
Period Branches %
<2000 11 7.1%
2000–2002 16 10.3%
2003–2005 52 33.5%
2006 45 29.0%
2007 11 7.1%
Year not provided 20 12.9%
Total 155 100%

- 86 -
Additionally, libraries were asked their opinion of whether their building complied with the accessibility requirements outlined in AS1428 and BCA. Two-thirds of library branches (66% or 161 branches) indicated they complied with these standards, while 12.7% did not comply. One-fifth (50 branches or 20.5%) did not know if their library buildings met the standards. Surprisingly, given the number of heritage buildings identified in Section 4.3.1), just one library stated there was no requirement for their branch to comply. However, 39 of the 121 libraries (24.2%) that indicated they complied with the AS1428 and BCA access and mobility standards also stated that a formal access audit had not been undertaken. These libraries have responded based on their practical knowledge of the library’s operation. Of the 31 libraries that indicated they did not meet access and mobility standards, only eight indicated that the situation was to be improved by planned refurbishments. Four of these indicated this would be achieved by their library relocating to another site, while the other four indicated improved disabled access was among planned refurbishments of the existing library building. Interestingly, these non-complying libraries which planned to be refurbished represented only 20% of all of the libraries that indicated their branches had planned to improve disabled access during future refurbishments. The remainder of those libraries undertaking such improvements include those that already comply (55%), or where compliance status was unknown (25%). This may suggest that, while some libraries achieve minimum standards, they seek to improve the inclusiveness of their facilities. This is confirmed by further analysis of the accessibility of different areas of library buildings and their immediate vicinities, which indicates that some libraries that indicated they comply with the BCA and AS1428 are lacking in some key facets. This is outlined further below. Branches were also asked a series of questions to determine which areas of their library buildings were accessible to people who use mobility or adaptive equipment.
4.5.1 Wheelchair-accessible car parking Close to one-third (31.1%) of branch libraries did not have wheelchair-accessible car parking near their main entrance (Table 4.8). Just over one-quarter (28%) of libraries that stated they were accessible to people in wheelchairs do not have wheelchair-accessible parking nearby. Almost half (45.2%) of nearby wheelchair-accessible parking supplied only one car space. Approximately the same proportion (43.5%) provided two to four spaces. Two libraries had access to 10 or more accessible spaces.
Table 4.8: Accessible parking nearby (Q.25e)
Accessible car parks Branches %
1 76 31.1%
2–4 73 29.9%
5–9 8 3.3%
10> 2 0.8%

- 87 -
Accessible car parks Branches %
All accessible parking 168 68.9%
No accessible parking 76 31.1%
Total 244 100%
* 9 branches did not complete this question
4.5.2 Wheelchair-accessible main entrances Nineteen libraries (7.8% of all branches) did not have a main entrance that was wheelchair accessible. However, eight of these libraries (42.1%) stated they complied with the relevant access standards. Therefore, 5% of all libraries that indicated their library building complied with BCA and AS requirements do not have wheelchair accessible main entrances. Please note: information was not requested regarding whether an alternative entrance was available. Ninety-eight percent of the 50 libraries that did not know whether they complied with the relevant access standards had wheelchair-accessible main entrances.
4.5.3 Wheelchair-accessible levels Seven of the 37 libraries (18.9%) that are located over more than one level indicated that not all levels are wheelchair accessible. Four of these seven libraries (57.1%) indicated they still complied with accessibility standards. Only one of the nine library branches that are not at least partly located on the ground floor has a lift.
4.5.4 Wheelchair-accessible aisles The aisle space in 39 libraries (16%) is not wheelchair accessible. However, 17 of these libraries (43.6%) indicated their building was accessibility and mobility compliant. Therefore, 10.6% of all libraries that stated they complied with the relevant access standards do not have aisles with sufficient space for wheelchair access. More than one-quarter (28.2%) of the libraries that did not know whether they met the necessary standards (11 libraries) did not have wheelchair accessible aisles.
4.5.5 Wheelchair-accessible toilets More than one-quarter (27.6%) of library buildings, representing 67 libraries in total, do not have a wheelchair accessible toilet. Twenty-nine of the 161 libraries that stated they complied with both the BCA and AS requirements (18%) did not contain a wheelchair accessible toilet. Eighteen of the 50 libraries that did not know if they complied with accessibility standards (26.9%) did not have a wheelchair accessible toilet.

- 88 -
4.5.6 Building characteristics connected to compliance Based on further analysis of results, the following can be observed about the compliance of Victorian library buildings with the relevant access standards: Compliance is related to intensity of use. Libraries that operated fewer
hours per week tended to have lower levels of compliance with access and mobility standards than those libraries that operated longer hours. Only 33% of libraries that operated less than 15 hours per week indicated compliance, compared to 66.3% for libraries open 15–59 hours per week and 89.3% for those open 60 or more hours per week.
In general, those libraries that had a higher number of visitors each week also had a higher rate of accessibility compliance than those libraries with fewer visitors. Libraries that had less than 500 visitors per week had a compliance rate of 56.4%, lower than those libraries with 500–4,999 visitors per week (which averaged a 66.7% compliance rate), and libraries with 5,000 or more visitors per week (84.6%).
Libraries with a larger gross floorspace tended to have notably better accessibility than smaller libraries. Libraries that were less than 150 sq m had a 37.1% compliance rate, lower than libraries that were 150–999 sq m and 1,000 sq m or more, which had compliance rates of 66.4% and 85.4% respectively. However, it is noted that one of the five libraries with a GFA of 2,000 sq m or more did not comply with accessibility standards.
Compliance appears related to public ownership. Council-owned library buildings had a higher proportion of access and mobility standards compliance than privately owned library buildings (68.3% versus 50.0%).
Compliance is generally related to building age. Nine of the 18 library buildings constructed prior 1900 conformed with accessibility standards (50%), while 30 of the 31 library buildings constructed after the year 2000 complied (96.8%). However, overall the age of library buildings was not always indicative of their compliance with access and mobility standards. For example, 71.6% of the library buildings constructed between 1960–1979 complied, whereas only 47.6% built from 1980–1989 complied.
Purpose built library buildings had slightly higher rates of accessibility compliance than those not purpose built (69.9% versus 61.5%). However, non-purpose built libraries had a notably higher proportion of non-compliance compared with those that were purpose built (18.8% compared to 8.9%).
Compliance during refurbishments was not a priority until recently as legislative changes took affect. Interestingly, library buildings that had undergone some form of refurbishment had the same reported level of access and mobility compliance as library buildings that had not been refurbished (both 68.4%). Library buildings refurbished between 1970–1999 actually had a lower compliance rate (59.5%) than un-refurbished libraries. Libraries refurbished from 2000–2004 and 2005 onwards had compliance rates of 70.6% and 83.3% respectively.
Of those respondents that gave their library building a rating of excellent, 83.9% indicated their library buildings complied with access and mobility standards, 3.2% did not comply, and 12.9% did not know. However, less

- 89 -
than one-third (32.3%) of library branches that complied with these standards rated the overall quality of their library as excellent.
As seen from the results presented above, there are still a notable proportion of library branches in Victoria that contain one or more areas of the building which are not accessible to people in a wheelchair. This has important ramifications for both patrons and the employment of people with a physical disability in Victorian public libraries.
4.6 Lighting People places tells us that the quality and appropriate level of lighting in a public library has an impact on both the functionality, as well as the ambience of the library (Library Council of New South Wales 2005:56). Good quality lighting is essential for the health, safety and wellbeing of library staff. It is also necessary to create a visual environment in which hazards are visible, and adverse factors such as glare and reflections are excluded or minimised. Natural light and ambience were rated as some of the best characteristics of public libraries (Section 4.2.2). Natural light received the second highest proportion of responses for the finest characteristic (11.8% of all responses) and general ambience was also highly rated (6.5% of all responses). On the other hand, a lack of natural light was not mentioned by any libraries as being among the three worst features of their building. However, lighting in general (primarily artificial) was identified by 1.8% of respondents as being their library building’s worst feature and by 3.1% when the three worst features are combined, making it the equal eleventh most common response in both categories. Libraries were asked to rate the level of lighting in their building. In formulating their response, libraries were advised that a ‘Satisfactory’ response would indicate, for example, that lighting illuminates all shelf areas evenly, with no variations of light and dark areas. A ‘Poor’ response would indicate, for example, that you cannot read the Dewey Decimal Classification codes on all books. Standards in lighting are covered under Australian Standard 1680. As shown by Table 4.9, almost nine out of 10 branches (88.5%) described the level of lighting within the library as either satisfactory or excellent.
Table 4.9: Survey respondents’ rating of level of lighting in library buildings (Q.26)
Rating Branches* %
Excellent 78 32.1%
Satisfactory 137 56.4%
Poor 28 11.5%
Total 243 100%
* One branch did not complete this question
Libraries were afforded the opportunity to make additional comments regarding their building’s lighting. Many comments related to the identification of specific locations within a building where lighting was

- 90 -
considered to be poor or inconsistent. A number noted that lighting improvements were a key consideration of their recent refurbishments. For some buildings, it was not a consideration during the original design. Some libraries plan to improve their existing lighting to make it environmentally sustainable.
Figure 4.5: Survey respondents’ satisfaction with lighting and signage (Q.26, Q.27a–b)
11.5%
56.4%
32.1%
33.3%
52.7%
14.0%
22.2%
63.4%
14.4%
0%
10%
20%
30%
40%
50%
60%
70%
80%
90%
100%
Lighting External signage Internal signage
ExcellentSatisfactoryPoor
4.7 Signage Library signage, both internal and external to the library building, is an important aspect of libraries, particularly for larger ones (Library Council of New South Wales 2005:61). Respondents’ perceptions relating to both the internal and external signage in Victorian libraries are outlined in the sections below and summarised in Table 4.10.
Table 4.10: Survey respondents’ rating of public information signage (Q.27a–b)
External Internal
Rating Branches* % Branches* %
Excellent 34 14.0% 35 14.4%
Satisfactory 128 52.7% 154 63.4%
Poor 81 33.3% 54 22.2%
Total 243 100% 243 100%
* One branch did not complete this question

- 91 -
4.7.1 External signage Libraries were asked to rate their branch’s external public information signage, which includes directional signs (indicating the library’s location from neighbouring streets), as well as identification on the building exterior near the entrance. Two-thirds (66.7%) of respondents rated their library’s external signage as either satisfactory or excellent, while one-third (33.3%) rated it as poor (Table 4.10). Libraries were also invited to make additional comments relating to their external signage. From those comments, common reasons for a rating their external signage as poor included: A lack of directional signage from nearby streets and roads. The location of libraries within a shopping centre not being clearly
identified within the centre. Identification signage on the exterior of the library building not
prominent, either from being placed in a poor position, or being obscured by objects such as a verandah or foliage.
The hours of library operation not being clearly displayed, or not displayed at all.
The difficulty in obtaining signage both on the building and in surrounding streets due to the library’s location in a heritage area.
No, or only temporary (such as a sandwich board), external signs on the building to identify it as a library.
Seven of those libraries that rated their external signage as poor indicated that there was an intention to implement or update external signage soon. External signage was also cited by a few libraries as one of their best (three libraries) and worst (12 libraries) features (Section 4.2.2).
4.7.2 Internal signage Internal public information signage within a library building should provide basic directional information to library users. Respondents completing the survey were advised that a rating of ‘Satisfactory’ indicates that their internal signage complies with AS 2899 (withdrawn) requirements, while a rating of ‘Poor’ indicates that numerous requests are received for assistance in physically locating information. More than three-quarters of respondents (77.4%) described the internal signage within their library branch as either satisfactory or excellent. This is a higher proportion than ratings for external signage (65.4%) (Table 4.10). Libraries were invited to make additional comments relating to their internal signage. The vast majority of libraries, that gave a rating of poor and provided additional comments, indicated that new or improved internal signage was either planned, or was currently being undertaken. Others noted that signage was satisfactory in terms of identification; however, their appearance was dated or unprofessional. Internal signage was identified as a finest feature by one library, and as a worst feature by 18 libraries.

- 92 -
Case study 8: Goroke Library, Wimmera Regional Library Corporation
Gross floor area: 35 sq m
User catchment: Between 300-400, township and surrounds of Goroke
Cost: $48,552.60
Date completed: March 2007
The Goroke Library renovation took a former retail building and turned it into a light, bright and friendly multi-purpose space for a small community. Through the use of limited funds, the library has increased its visibility and public profile and is recognised as a welcoming space for the Goroke community to use. The library has expanded the collection to better suit community needs and now includes a separate public access internet PC, a community meeting space, and relaxing lounge chairs. These new features, as well as air-conditioning – essential in the hot summers – have helped encourage library visitors to stay longer and visit more often. The staff are very happy with the larger space which has more than quadrupled and the community appreciates the natural light and welcoming atmosphere.

- 93 -
4.8 Patron comfort People places identifies the importance of controlling the internal climate of libraries for both the comfort of users, as well as maintaining ‘optimum temperature and humidity levels for the material collection’ (Library Council of New South Wales 2005:57). The heating, cooling and ventilation system was identified by a small number of respondents (2.5%) as being among their branch’s three finest features, the twelfth most common response. On the other hand, heating, cooling and ventilation system also received the fourth highest number of responses (7.5%) when library branches indicated what they perceived to be the worst feature of their library building, and fifth highest (6.5%) when the worst three features were combined. While the internal climate and its impact on user comfort is not considered by libraries to be the most important aspect of their branch, it still received a notable number of responses identifying it as one aspect which detracts from the quality of the library branch building.
4.9 Compliance with codes and regulations A series of questions were asked to ascertain compliance with various building design codes and regulations. This included an indication of whether a formal audit of compliance had been undertaken. These were: Building Code of Australia, including AS 1428.1, 1428.2, 1428.3 and
1428.4. Fire codes. Disability access, AS 1428 Design for access and mobility. Occupational health and safety.
Table 4.11 reports the proportion of libraries that have undertaken each of these audits. The validity of any analysis is limited by the low level of knowledge about the various audits and their results, ranging from 10.7% for the BCA audit to 22.6 for the OH&S audit. One conclusion which can be drawn is that library staff are not involved in, or informed of, the undertaking of these audit or their results.

- 94 -
Table 4.11: Compliance with relevant building codes and regulations (Q.25)
Building Code of Australia (BCA)
Fire Rating Assessments
Access and Mobility Standards OH&S Standards
Branches* % Branches* % Branches* % Branches* %
Yes 137 56.4% 183 75.3% 161 66.3% 165 67.9%
No 80 32.9% 7 2.9% 31 12.7% 6 2.5%
Don't know 26 10.7% 18 7.4% 50 20.6% 55 22.6%
Haven't undertaken assessment
0 0.0% 35 14.4% 0 0.0% 17 7.0%
Not required 0 0.0% 0 0.0% 1 0.4% 0 0.0%
Total 243 100% 243 100% 243 100% 243 100%
* One branch did not complete this question
Figure 4.6: Compliance with relevant building codes and regulations (Q.25)
26
80
137
18
7
183
50
31
161
55
6
165
0 20 40 60 80 100 120 140 160 180 200
Don't know
No
Yes
OH&S StandardsAccess and Mobility StandardsFire Rating AssessmentsBuilding Code of Australia (BCA)
The level of compliance with fire rating assessments, disability access and occupational health and safety standards is summarised in Figure 4.6. Each of the audits and respective level of compliance with each are discussed in the following sections.

- 95 -
Figure 4.7: Compliance with relevant codes and regulations by building age (Q.25)*(Q.19)
50.0%
83.3%
83.3%
50.0%
57.1%
64.3%
71.4%
50.0%
55.0%
60.0%
71.6%
84.0%
71.6%
47.6%
61.9%
57.1%
70.0%
70.0%
76.7%
96.8%
100.0%
80.6%
27.8%
16.7%
16.7%
7.1%
7.1%
7.1%
15.0%
5.0%
16.0%
3.7%
16.7%
4.8%
2.4%
3.3%
22.2%
50.0%
35.7%
28.6%
21.4%
35.0%
40.0%
40.0%
12.3%
16.0%
24.7%
35.7%
33.3%
40.5%
26.7%
30.0%
23.3%
3.2%
19.4%
0% 10% 20% 30% 40% 50% 60% 70% 80% 90% 100%
AccessFire
OH&SAccess
FireOH&S
AccessFire
OH&SAccess
FireOH&S
AccessFire
OH&SAccess
FireOH&S
AccessFire
OH&SAccess
FireOH&S
<190
019
00–1
919
1920
–193
919
40–1
959
1960
–197
919
80–1
989
1999
–200
020
00>
Yes No Don't know/not done
4.9.1 Building Code of Australia A total of 56.1% of libraries indicated that a building audit had been undertaken to identify compliance with the Building Code of Australia (BCA), including AS 1428.1–1428.4 (Table 4.11). Almost one-third (32.9%) indicated that an audit had not been undertaken. A further 10.7% of respondents did not know whether a building audit had been undertaken. The majority of audits have been prepared in the past few years; 92.7% of those that knew the year of the audit had been undertaken from 2003 onwards. A small proportion (7.2% of known audits were prior to 2003) of audits are quite dated, and buildings may no longer comply with any standards altered or brought into affect in the past five years.
Table 4.12: Year Building Code of Australia compliance audit undertaken (Q.23)
Year Branches %
Year not provided 26 19.0%
<2000 5 3.6%
2000–2002 3 2.2%

- 96 -
Year Branches %
2003–2005 54 39.4%
2006 24 17.5%
2007 25 18.2%
Total 137 100%
4.9.2 Fire rating Three-quarters (75.3%) of libraries identified their buildings complied with fire rating assessments (Table 4.11). Seven libraries (2.9%) indicated they did not comply. In addition 18 libraries (7.8% of all branches) did not know whether their library building complied, and a further 35 (14.4%) stated they had not undertaken an assessment. However, responses to a number of other questions in the audit cloud this finding. Libraries were also asked questions (e.g. Q.30) which asked for further detail on their building’s fire safety mechanisms. These are detailed below:
Fire exits Fifteen (6.2% of all libraries) considered that they did not have a clearly marked fire exit. However, six of these libraries stated they complied with a fire rating assessment. Six out of the 35 libraries (17.1%) that had not undertaken a fire rating assessment did not have clearly marked fire exits.
Fire extinguishers Nine (3.7%) libraries did not have fire extinguishers available within their library branches. Six out of the nine libraries without fire extinguishers stated they complied with fire safety assessments.
Fire alarms Just over one-half of libraries have fire alarms (56.4% or 137 branches). The reason for such a low proportion is unknown. Some caution must be taken in interpreting this finding. It is noted that almost two-thirds (64.2%) of libraries that indicated they did not have a fire alarm indicated they complied with fire rating assessments. It is possible that, for at least some of the libraries which indicated they did not have these or a number of other facilities, the negative response may have been due to the fire alarm systems being part of the whole building and not specifically for the library. It is also possible there may have been some misinterpretation of the term ‘fire alarm’ rather than ‘smoke alarm’ or ‘smoke detector’. However, if true, it is of concern.
Sprinkler systems Just one-fifth (20.6%) of libraries indicated that a fire sprinkler system was installed within their building.

- 97 -
Building characteristics connected to fire safety Based on further analysis of results, the following can be observed about the compliance of Victorian public library buildings with fire safety requirements: There was a lower degree of fire rating compliance among library
branches that operated for fewer hours each week; that is, 66.7% of libraries that operated for 1–15 hours per week complied with fire rating assessments compared to 74.2% of those operating for 15–59 hours and 92.9% of those operating 60 or more hours per week.
Those libraries which had a higher number of visitors each week generally had a higher rate of fire safety compliance than those with fewer visitors. For example, libraries that received fewer than 1,000 visitors per week had a compliance level of 70.5%, while libraries with 5,000 or more visitors per week had an 88.5% compliance level.
Larger libraries tended to have better fire safety compliance than smaller libraries. Libraries less than 150 sq m had a 57.1% compliance rate, lower than libraries that were 150–999 sq m and 1,000 sq m or more, which had compliance rates of 73.8% and 89% respectively. The five libraries that were 2,000 sq m or more all indicated they complied with fire rating assessments.
Council-owned library buildings had a higher proportion of fire rating assessment compliance than privately owned library buildings (77.2% versus 65.4%); 3.5% of Council-owned library buildings did not comply, but no privately owned libraries fell into this category. However, a higher proportion of library branches located within privately owned buildings had not undertaken an assessment (26.9%) compared to Council-owned library buildings (11.9%).
Eleven (61.1%) of the 18 library buildings constructed prior to the year 1900 conformed with safety rating assessments, while all of the 31 library buildings constructed after the year 2000 complied. However, overall the age of library buildings was not always indicative of their compliance with fire rating assessments. For example, 84% (or 68) of the 81 library buildings constructed between 1960–1979 complied, whereas only 67.7% (or 21) of the 31 that were built from 1990–2000 complied.
Purpose built library buildings had a slightly higher than average fire safety compliance (77.4% as opposed to the average of 75%). Non-purpose built library buildings had compliance levels slightly below the average (71.9%).
Although the most recently refurbished (2005 or later) library buildings had a compliance rate of 91.7%, the date of refurbishment, or any form of refurbishment, was not always indicative of compliance. Seventy-five of the 96 (78.1%) un-refurbished library buildings complied with fire rating assessments, compared to 69 of the 93 (74.2%) library buildings that had undergone major refurbishment between 1980 and 2004.

- 98 -
Of those libraries that rated their building as excellent, 87% complied with fire ratings, while the remaining 13% either had not undertaken such an assessment or did not know if one had been undertaken. However, less than one-third (29.5%) of library branches that complied with fire safety standards rated the overall quality of their building as excellent, indicating compliance is not a factor which influences survey respondents’ perceptions.
Of those seven libraries that indicated they did not comply with fire ratings, only two indicated improvements were planned. One of these indicated their library was to be relocated to another site, while the other indicated improvements to fire safety were among planned refurbishments. A number of libraries which planned to improve fire safety during future refurbishments already comply with fire rating (81.3%).
4.9.3 Disability access Library compliance with access and mobility standards is discussed in Section 4.5, where it was noted two-thirds of library branches (66% or 161 branches) indicated they complied with the accessibility requirements outlined in AS1428 and the BCA, while 12.7% did not comply. The following observations were also made: Nineteen (7.8%) library main entrances are not wheelchair accessible;
however, an alternative entrance may be available. Of those libraries that contained more than one level, one-fifth (20.6%)
indicated not all levels were wheelchair accessible. Close to one-third (31%) of branch libraries did not have wheelchair-
accessible parking near their main entrance. Thirty-nine (16%) indicated that library aisles could not be accessed by a
wheelchair. More than one-quarter (27.6%) did not have a wheelchair-accessible toilet
in the library building. Compliance with accessibility standards has been analysed by the age of the building. As expected, most new buildings (86.8% since the year 2000) complied with requirements; compliance generally declined with building age. However, the rate of compliance of buildings constructed between 1980–1989 (47.6%) was notably lower than the decades preceding and following.
4.9.4 Occupational health and safety Two-thirds (67.9%) of libraries indicated that they had undertaken an Occupational health and safety (OH&S) audit. A small proportion (7%) indicated no such audit had been undertaken, and one-quarter (22.6%) did not know. Of those libraries that had undertaken an audit, all had been done in the past seven years, with almost four out of five (79.7%) done in 2006/07.

- 99 -
Table 4.13: Year Occupational Health and Safety audit undertaken (Q.32b)
Year Branches %
Year not provided 3 1.8%
2000–2002 2 1.2%
2003–2005 28 17.2%
2006 62 38.0%
2007 68 41.7%
Total* 163 100%
* 16 branches (6.6% of all branches) haven’t undertaken an OH&S audit and 65 branches (26.6% of all branches) don’t know if they have undertaken an OH&S audit.
Additionally, libraries were asked whether they complied with OH&S requirements. Two-thirds of libraries indicated they complied (67.6%); slightly more libraries indicated their compliance than had undertaken an audit. A small proportion of branches (2.2%) indicated their building did not comply with these standards, while approximately one-fifth (22.5%) did not know. Of the six libraries that indicated they did not meet OH&S standards, only one indicated the situation was to be improved, such as through refurbishment of the existing building. Based on further analysis of results, the following can be observed about compliance of Victorian library buildings with occupational health and safety standards: Libraries that operated fewer hours per week tended to report lower levels
of compliance with OH&S standards. Less than one-half (44.4%) of libraries that operated less than 15 hours per week indicated compliance, compared to 68.4% for libraries that were open 15–59 hours per week, and 82.1% for those open 60 or more hours per week.
In general, those libraries with a higher number of visitors each week tended to have a higher rate of compliance with OH&S standards. Libraries with less than 500 visitors per week had a compliance rate of 56.4%, lower than those libraries with 500–4,999 visitors per week (which averaged a 69.8% compliance rate), and libraries with 5,000 or more visitors per week (84.6%).
Larger libraries tended to have a higher rate of OH&S compliance. Libraries less than 150 sq m had a 42.9% compliance rate, lower than libraries between 50–999 sq m and those 1,000 sq m or more, which had compliance rates of 64.4% and 90.9% respectively.
Council-owned library buildings reported a higher rate of OH&S compliance than privately owned buildings (71.3% versus 53.8%). However, the difference was most likely due to a significantly higher proportion of ‘don’t know’ responses among private owners (38.5%) compared to respondents of Council–owned (19.8%) library buildings. The reason for this result is not clear, as there should be no relationship between ownership and OH&S compliance.

- 100 -
Ten of the 18 library buildings constructed prior to the year 1900 conformed to OH&S standards (55.6%), while 25 of the 31 library buildings constructed after the year 2000 complied (80.6%). Overall, the age of library buildings was not always indicative of compliance, which may be due to the mixed ranges of ‘don’t know’ responses for each period. However, older buildings tended to have a higher non-compliance rate.
Purpose-built library buildings had higher rates of OH&S compliance (71.9% versus 62.5%). However, both purpose and non-purpose built buildings had a similar proportion of non-complying buildings (2.1% and 3.1% respectively). Again, the difference in compliance is attributable to the proportion of ‘don’t know’ responses (18.5% purpose built compared to 28.1% non-purpose built).
Libraries that had undergone some form of refurbishment had the same level of OH&S compliance as library buildings that had not been refurbished (both 69%). Refurbished libraries had a slightly lower level of non compliance (2.2%) compared to those that were un-refurbished (3.2%).
Of those libraries that gave their library building’s safety and security measures a rating of ‘excellent’, 78.8% indicated their building complied with OH&S standards. None of these libraries indicated their building did not comply.
4.10 Community safety Libraries were asked whether their building utilised certain types of security measures to increase the safety of staff and patrons, as well as the resources within the library buildings. The proportion of buildings that have various security measures installed is shown in Table 4.14.
Table 4.14: Types of security measures within library branch buildings (Q.30)
Yes No
Security measure Branches % Branches %
Security alarm 168 69.1% 75 30.9%
Access control 42 17.3% 201 82.7%
Management plan/ procedures manual 183 75.3% 60 24.7%
Staff training 192 79.0% 51 21.0%
External lighting 209 86.0% 34 14.0%
Clearly marked fire exits 228 93.8% 15 6.2%
Fire extinguishers 234 96.3% 9 3.7%
Parking close to entry 197 81.1% 46 18.9%
Well-lit book return chutes 124 51.0% 119 49.0%
Fire alarms 137 56.4% 106 43.6%

- 101 -
Yes No
Security measure Branches % Branches %
Sprinkler systems 50 20.6% 193 79.4%
Fireproof book return chutes 51 21.0% 192 79.0%
* One branch did not complete this question
Two-thirds (69.1%) of libraries indicated that a security system was installed. One-half of library buildings (56.4%) possessed fire alarms. Such a low proportion suggests some caution must be taken in interpreting these figures, as it is possible that (for at least some of the libraries) a negative response may be due to particular security (or fire) measures being part of the whole building and not specifically for the library. Notably, only a small proportion of library buildings, one-fifth (20.6%), had sprinkler systems in place in case of fire; 3.7% did not have fire extinguishers available within their library. A small proportion of branches (6.1%) indicated fire exits were not clearly marked. Measures related to fire safety are discussed in further detail in Section 4.9.2. In terms of OH&S, three-quarters of libraries had a management plan dealing with safety and undertook staff training to promote safety. A notable proportion of libraries lacked features which promote the safety of staff using the building after hours, for example, external lighting (14%) and parking close to the entry (18.9%). Fifteen libraries indicated they had other safety and security measures installed, including: CCTV/video surveillance. Security patrols, including by shopping centre security (six). Smoke detectors (one). Personal alarms (one). Hearing Loop, whole library (one).
It is probable that a higher proportion of libraries employ at least some of these other measures but did not provide these details unprompted. Respondents were also asked to rate their perception of the overall standard of safety and security of their library. As shown by Table 4.15, the overwhelming majority (92.5%) gave a rating of ‘satisfactory’ or ‘excellent’. Respondents completing the survey were advised that a rating of ‘satisfactory’ indicated they felt safe at work.
Table 4.15: Survey respondents’ rating of safety and security measures (Q.31)
Rating Branches* %
Excellent 33 13.6%
Satisfactory 191 78.9%
Poor 18 7.4%
Total 242 100%
* Two branches did not complete this question

- 102 -
Analysis has been undertaken of the relationship between the overall rating of library security and the types of measures in place within buildings. Of those libraries that gave their overall branch safety a rating of ‘excellent’: 81.8% complied with fire rating assessments, although 15.2% had not
undertaken such an assessment. 78.8% possessed a security alarm, more than twice the proportion of
those branches that rated their overall measures as poor (38.9%). A significantly higher proportion undertook staff training (84.8%)
compared to those branches that gave a rating of poor (50%). Similar results existed among branches that possessed management plans or procedures manuals compared to those that did not (81.8% and 55.6% respectively).
Almost all (93.9%) utilised external lighting compared to less than two-thirds (61.1%) of branches with an overall rating of ‘poor’.
All possessed fire extinguishers, while 16.7% of branches with a rating of ‘poor’ did not.
A higher proportion had parking close to the library entry compared to libraries with a ‘poor’ rating (84.8% versus 72.2%).
Less than two-thirds (61.1%) of libraries with an overall branch safety rating of ‘poor’ had clearly marked fire exits, compared to 100% of libraries with an ‘excellent’ rating and almost all (96.3%) with a ‘satisfactory’ rating.
It is, however, noted that feelings of safety are influenced by factors beyond the design of a building, such as the surrounding neighbourhood. Such relationships, which may influence the above information, cannot be tested by the audit.
4.11 Tenure Library services in Victoria do not own the buildings in which they operate. Four-fifths (83.1%) of respondents indicated Council owned the building in which their library was located. A further 10.7% are located within privately owned buildings (Table 4.16). There did not appear to be any correlation between the size (GFA) of libraries situated within Council-owned buildings and those within privately owned buildings.
Table 4.16: Owner of library buildings (Q.18a)
Owner Branches* %
Council 202 83.1%
Crown land 5 2.0%
Private owner 26 10.7%
State Government body 6 2.5%
Community (e.g. via Trustee) 2 0.8%
RSL 1 0.4%

- 103 -
Owner Branches* %
Private school 1 0.4%
Total 243 100%
* One branch did not complete this question
Unfortunately, 60.6% of libraries did not provide adequate detail regarding their leasing arrangements. Of those libraries which provided information, 56.2% were not leased (Table 4.17). Of those libraries which were leased, the majority were leased by Council (80.9%). About one-half of Council-leased libraries were provided free to the library service.
Table 4.17: Lessor of library building (Q.18b)
Lessor Branches %
Council 19 45.2%
Council provides building free to library service 15 35.7%
Private owner 3 7.1%
Other 5 11.9%
Total* 42 100%
* 148 branches did not complete this question; 54 branches (22.1% of all branches) are not leased.
Table 4.18 outlines the amount that libraries pay per year to lease their library premises. One-half (50%) of leased libraries do not pay rent for their premises; 8.7% of library buildings are leased for less than $1,000 per year. It is noted there is some potential for error in these figures as the audit did not clearly indicate over what period this cost was to be assessed. Less than one-fifth (18.9%) of leased libraries (that provided data) have outgoings included in the price of their lease. Utilities costs are discussed in Section 6.4.
Table 4.18: Cost of lease (Q.18c)
Cost Branches %
$0 23 50.0%
$1–$999 4 8.7%
$2,500–$4,999 2 4.3%
$5,000–$9,999 3 6.5%
$10,000–$24,999 3 6.5%
$25,000–$49,999 4 8.7%
$50,000–$99,999 3 6.5%

- 104 -
Cost Branches %
$100,000> 4 8.7%
Total 46 100%
As discussed in Section 3.1, 28% of LGAs separately operated some form of on- or off-site floorspace distinct from branch operations. This included administration space (21.3%), storage space (17.3%) as well as other forms of space (12%). The tenure arrangements of these centralised buildings are identified in Table 4.19 and Table 4.20. As with branch libraries, the majority are owned by Councils, with the exception of ‘other’ forms of space. This reflects the nature of ‘other’ uses (such as mobile library parking). A higher proportion of buildings used by central services are leased compared to branch libraries. The majority of ‘other’ spaces are leased.
Table 4.19: Owner of centralised buildings (Q.6Ca)
Administration Storage Other
Owner LGA % LGA % LGA %
Council 13 81.3% 9 69.2% 3 33.3%
Private owner 2 12.5% 4 30.8% 2 22.2%
Crown land 0 0.0% 0 0.0% 0 0.0%
Community owned 0 0.0% 0 0.0% 1 11.1%
LGA did not complete the question
1 6.25% 0 0.0% 3 33.3%
Total 16 100% 13 100% 9 100%
Table 4.20: Lessor of centralised buildings (Q.6Ca)
Administration Storage Other
Lessor LGA % LGA % LGA %
Not leased 7 43.8% 5 38.5% 3 33.3%
Council 4 25.0% 0 0.0% 1 11.1%
Private owner 0 0.0% 0 0.0% 0 0.0%
Crown land 2 12.5% 4 30.8% 3 33.3%
Community owned 0 0.0% 0 0.0% 1 11.1%
LGA did not complete question
3 18.8% 4 30.8% 1 11.1%
Total 16 100% 13 100% 9 100%

- 105 -
4.12 Future proofing This section considers whether and how libraries in Victoria are adapting to the demands of social and technological change.
4.12.1 Technology Approximately three-quarters (78.6%) of libraries provide a computer lab/internet area (Table 3.24). Approximately one-half of these (47.1%, or 37% of all libraries) indicated that floorspace within the library is provided exclusively for this purpose, while 52.9% (41.4% of all libraries) provide computer or internet facilities within an area that is also used for other purposes. At the time of the audit, 90.5% of branches did not provide wireless internet access. Of the 23 branches that offered wireless internet, six (26.1%) provided an area exclusively for this purpose, while the remaining 17 (73.9%) offered wireless internet within an area which was shared with other library uses (Table 3.24).
4.12.2 Environmental sustainability A series of questions were asked to ascertain compliance with various building design codes. This included an indication of whether a formal energy audit had been undertaken. One-quarter (25.5) of libraries indicated they had undertaken an energy audit of their building, one-half (50.2%) indicated that no such audit had been carried out, while a further one-quarter (24.6%) did not know. Of those libraries that had undertaken an energy audit, most had done so recently (41.9% in 2006 or 2007). A further one-quarter (25.8%) had done so during the period 2003–05.
Table 4.21: Energy audit undertaken (Q.28b)
Year Branches %
Year not provided 9 14.5%
<2000 3 4.8%
2000–2002 8 12.9%
2003–2005 16 25.8%
2006 18 29.0%
2007 8 12.9%
Total* 62 100%
* 122 branches (50.2% of all branches) haven’t undertaken an energy audit and 60 branches (24.6% of all branches) don’t know if they have undertaken an energy audit.
Libraries were asked to indicate the types of energy-saving measures installed in their building (Table 4.22). In Victoria, this includes: Four-fifths (81.1%) make use of natural light. Two-thirds (67.9%) have facilities for recycling. One-half (56%) utilise dual-flush toilets.

- 106 -
Just one-quarter (27.6%) use energy-efficient light globes. There is wide scope for future improvements in environmental sustainability, including improvements to air-conditioning, and water efficiency. Fifteen libraries (6.6%) identified several other sustainability measures they implement. This included green power sources, waterless urinals, water tanks, sensor lights which activate when a patron is browsing an area, and building orientation for solar access.
Table 4.22: Energy-saving measures (Q.28a)
Yes No
Measure Branches % Branches %
Natural light 197 81.1% 46 18.9%
Energy efficient light globes 67 27.6% 176 72.4%
Solar panels 4 1.6% 239 98.4%
Water efficient taps 21 8.6% 222 91.4%
Grey water usage 1 0.4% 242 99.6%
Energy efficient air-conditioning/heating 37 15.2% 206 84.8%
Facilities for recycling 165 67.9% 78 32.1%
Dual flush toilets 136 56.0% 107 44.0%
Cycle parking or secure storage 104 42.8% 139 57.2%
* One branch did not complete this question

- 107 -
Case study 9: Nathalia Library, Goulburn Valley Regional Library Corporation
Gross floor area: 220 sq m (274 sq m including shared meeting room).
User catchment: 3,289 (based on collector district population figures for Nathalia and surrounding areas in 2001 Census)
Cost: $300,000
Date completed: 20 March 2007
Usage: Library visits in six months: 6,198 Loans in six months: 10,674
An existing older building, the core of which was constructed in 1957, was redeveloped in late 2006/early 2007 to provide the Nathalia and district community with a new library, Maternal and Child Health Centre, and toy library. The centre also includes a public meeting room, kitchenette, and toilet facilities. The collocation promotes cross-usage of these compatible services, and has provided the community with an attractive and welcoming centre. Care was taken to ensure the building was sympathetic to the existing streetscape and environment. Features such as the timber post veranda and wheaten-coloured wall bagging reflect elements in the construction of the adjoining Barmah Heritage Museum and DSE offices. Large windows provide plenty of natural light and spacious views to the main street, picturesque water tower and the adjacent bush block. Usage has risen dramatically. In the first six months of operation, public loans rose by 66% and visits to the library by 143%. The public meeting room is also very well used. The community are very appreciative of their new facility. The new library is now very visible in a high profile area of the town, well-located in the main street, close to the shopping centre and main centre of activity. The $300,000 refurbishment was funded by $170,000 contributed by Moira Shire Council, and a $130,000 State Government Living Libraries grant.

- 108 -
5. LOCATIONAL CHARACTERISTICS
Site has always been significant, and never more so than today, with so much competition for our attention and so many demands on our time (Jones 1997:397). People places identifies a number of key locational criteria to be considered in determining the most appropriate site for a public library, which have been examined in the audit. This section reviews locational characteristics of public libraries, including proximity to other community facilities; street frontage; and accessibility both by car, public transport and disability access. It draws conclusions about whether buildings are, in fact, in the ‘right’ place in relation to generally accepted location criteria.
5.1 Proximity to other community facilities The proximity of library buildings to a range of community facilities and services is identified in Table 5.1. Analysis of this data identifies: Surprisingly, no libraries were situated within a shopping centre.
However, 13.9% indicated they were located adjacent to one; a further 26.6% were located within walking distance (within 400 metres). This does not support the growing trend identified in literature of public libraries in both Australia and overseas locating in shopping centres, with many library services finding that such branches are their busiest (Johnstone 1999) as well as reciprocal flow-on benefits to the surrounding businesses.
However, about one-half of libraries were located on a main street (shopping/business precinct), and 90% were located within 400 metres (question 34).
One-quarter (25.4%) of libraries are located within a Council administration precinct. This includes 11.9% which are located within the same building; a further 16.4% are located within 400 metres of such a precinct. As expected, a high proportion of libraries were located near other Council provided spaces, such as other cultural, recreational or sporting facilities.
Almost one-half (45.9%) were located within 400 metres of a school. A small number (14, or 5.7%) were located within or adjacent to a school. Nine libraries indicated they were facilities jointly used by a school.
12.5% of libraries nominated other community facilities to which they were proximate, including childcare centres and police stations.

- 109 -
Table 5.1: Proximity to community facilities (Q.34)
Proximity to branches
Within building Adjacent
Within 400m
Not applicable
Branches did not
complete question Total
Shopping centre
0 (0.00%)
34 (13.9%)
65 (26.6%)
118 (48.4%)
27 (11.1%)
244 (100%)
Business precinct
0 (0.00%)
70 (28.7%)
130 (53.3%)
36 (14.8%)
8 (3.3%)
244 (100%)
Main street 0 (0.00%)
117 (48.0%)
103 (42.2%)
17 (7.0%)
7 (2.9%)
244 (100%)
Council administration precinct
29 (11.9%)
33 (13.5%)
40 (16.4%)
110 (45.1%)
32 (13.1%)
244 (100%)
School 4 (1.6%)
10 (4.1%)
98 (40.2%)
97 (39.8%)
35 (14.3%)
244 (100%)
Cultural facilities
13 (5.3%)
32 (13.1%)
56 (23.0%)
105 (43.0%)
38 (15.6%)
244 (100%)
Eating facilities
7 (2.9%)
49 (20.1%)
161 (66.0%)
21 (8.6%)
6 (2.5%)
244 (100%)
Recreation/ sporting facility
3 (1.2%)
25 (10.2%)
82 (33.6%)
103 (42.2%)
31 (12.7%)
244 (100%)
Parks and gardens
0 (0.0%)
49 (20.1%)
97 (39.8%)
75 (30.7%)
23 (9.4%)
244 (100%)
5.2 Way finding/street presence As identified above by Jones (1997), just as important to a library as location is ‘street presence’. Patrons must know that a library is present. A total of 94.3% of Victorian libraries have street frontage on the ground floor of a building. Almost one-half (48%) of libraries are located on a main street. External signage is discussed in detail in Section 4.7.1. Almost two-thirds (65.4%) of libraries’ external signage was rated as either ‘satisfactory’ or ‘excellent’, while one-third (33.2%) was rated as ‘poor’.
5.3 External accessibility Accessibility is an important aspect of any public facility: ‘a library must be open and accessible to the whole community’ (Library Council of New South Wales 2005:51). External accessibility to the library building was measured through the audit in terms of car parking, public transport, and access for people with a disability5.
5 Issues associated with the internal accessibility of public library buildings are discussed in
Section 4.5.

- 110 -
It is noted that external accessibility was perceived as a moderately important feature of libraries by respondents; it was the fifth most common response among the three best features of library buildings identified.
5.3.1 Car parking Almost all libraries (95%) are located within walking distance of car parking; 86.5% of libraries were located adjacent to a car park. This car parking was provided free of charge at almost all libraries (96.3%). Approximately one-quarter (27.9%) indicated the current provision of car parking available near the library was inadequate. Libraries were asked to indicate the total number of parking spaces available within close proximity to their library buildings, as well as the number of these that were available solely for use by library patrons. Just 3.7% of libraries had no car parking available nearby (Table 5.2). Most libraries had a substantial amount of parking available nearby (38.5% offered 50 or more spaces); only 10.3% had less than 10 spaces available. In terms of car parking available exclusively for library patrons, all libraries provided at least one space. Nearly one-half (41.8%) of libraries provided less than 10 exclusive parking spaces. There was, however, a high rate of non-response for this question (46.7%). Just less than one-half of libraries (44.3%) offered dedicated car parking spaces for staff use. Of those libraries with staff parking, one-half (50.9%) had less than five spaces; 19.6% provided just one car space.
Table 5.2: Car parking (Q.35a/c/e)
Total Exclusive library
patron use Staff car parks
Car spaces Branches % Branches % Branches %
None 9 3.7% 0 0.0% 136 55.7%
1–4 8 3.3% 94 38.5% 55 22.5%
5–9 17 7.0% 8 3.3% 28 11.5%
10–49 96 39.3% 22 9.0%
50–99 40 16.4% 4 1.6%
100> 54 22.1% 2 0.8%
19 7.8%
Number not stated 20 8.2% 114 46.7% 6 2.5%
Total 244 100% 244 100% 244 100%
As shown in Table 5.3, 168 libraries (68.9%) indicated they offered at least one wheelchair-accessible parking bay, and 167 of these indicated it was located near the main entrance to the library building. Most libraries offered just one such space. However, 31.1% (76 libraries) indicated they did not offer any wheelchair-accessible parking bays.

- 111 -
Table 5.3: Wheelchair-accessible parking (Q.25e)
Wheelchair-accessible parking bays Branches* %
None 76 31.1%
1 76 31.1%
2–4 73 29.9%
5–9 8 3.3%
10> 2 0.8%
Number not stated 9 3.7%
Total 244 100%
5.3.2 Public transport The proportion of libraries located within close proximity to public transport, while still significant, was notably less than those libraries accessible by car. A total of 61.1% of Victorian public libraries are located within 400 metres of public transport. Libraries are significantly more likely to be located near a bus stop than a train station. Almost three-quarters (73.8%) of Victorian libraries indicated that a bus stop was located within 400 metres of their building, including 12.7% that stated it was located adjacent to the library. Ten libraries also nominated that their building was located within 400 metres of a tram stop.
Table 5.4: Proximity to transport (Q.34)
Bus Stop Train Station Car Parking
Proximity Branches % Branches % Branches %
Within building 0 0.0% 0 0.0% 1 0.4%
Adjacent 31 12.7% 2 0.8% 211 86.5%
Within 400m 149 61.1% 64 26.2% 21 8.6%
Not applicable 44 18.0% 142 58.2% 5 2.0%
Branches did not complete question
20 8.2% 36 14.8% 6 2.5%
Total 244 100% 244 100% 244 100%

- 112 -
Case study 10: The Age (Broadmeadows) Library, Hume Global Village Library Service
Gross floor area: 1,500 sq m
User catchment: 100,000 includes Jacana, Broadmeadows, Westmeadows, Attwood, Dallas, Coolaroo, Meadow Heights, Greenvale, Roxburgh Park
Cost: $13,400,000
Architect: PeddleThorp
Date completed: May 2003
Usage: 280,000 visits annually 470,000 loans per year 31,500 internet bookings per month 283,000 collection items 14,000 attendances at programs annually 2,400 attendances monthly at outreach programs
The Age Library, situated in the Hume Global Learning Centre™, is the first public library ever to be built in Broadmeadows. The centre forms an integral part of Hume City Council’s vision of creating a learning community. The Hume Global Learning Centre™ is dedicated to being a hub for a variety of learning activities, information sharing and training for a community of diverse cultures, ages and backgrounds.

- 113 -
The Age Library continued Designed after extensive community consultation, its role is to enhance social prosperity and well-being by creating opportunities for the Hume community to participate in lifelong learning and to promote cultural understanding. The centre provides a seamless interaction between traditional library services and state-of-the-art learning facilities which are additional and complementary to modern public library services. The Age Library is situated on the first floor of the centre, providing a dynamic space for community engagement and has in excess of 280,000 visits per year, making it obvious that the community vote with their feet!

- 114 -
6. ASSET MANAGEMENT
This section provides information on asset management (planning and maintenance) undertaken by library services. A key outcome of asset management is ensuring that buildings are managed and maintained effectively and efficiently, and that they support the delivery of required services. It covers such things as the design, construction, commissioning, operations, maintenance, and decommissioning/replacement of plant, equipment and facilities. It recognises that buildings have a lifespan – they are planned, built, used and managed, and, when no longer required, prepared for disposal.
6.1 Planning A research report on public library services prepared by the Audit Commission (United Kingdom) in 2002 found that the majority of libraries in England and Wales lacked clear plans for maintaining and refurbishing buildings, with ‘few having a clear fully costed preventative maintenance program in place’ (Audit Commission (United Kingdom) 2002:40). Approximately one-half (55.7%) of libraries have some form of asset management plan for their building; a number of libraries did not know if a plan existed (9%). Of those libraries that operated an asset management plan, 43.4% had what could be regarded as a ‘medium-term’ planning horizon, i.e. covered a period of between five and up to 10 years in duration. Approximately one-fifth (22.1%) had a ‘long-term’ planning horizon, i.e. covered a period of 20 years or more (Table 6.1). A notable proportion did not identify their planning timeframe (16.9%). Two libraries identified that this was due to their asset management plan being based on component lifecycle and, as such, the year varies dependant on the component. A number of Councils operated a generic asset management plan for all buildings in which the library was included.
Table 6.1: Duration of asset management plan (Q.36b)
Duration (Years) Branches %
1 1 0.7%
3–4 8 5.9%
5–9 59 43.4%
10–19 15 11.0%
20> 30 22.1%
Year not indicated 23 16.9%
Total 136 100%
In terms of the scope of asset management plans, only two-thirds covered planned maintenance (63.2%). This was, however, the most common element of library asset management plans (Table 6.2). One-quarter (24.3%) dealt with the planned refurbishment of their building. Planned closure of their branch was identified in 3.7% of plans.

- 115 -
Other works covered by library asset management plans included the replacement of an air-conditioning unit and recarpeting.
Table 6.2: Scope of asset management plan (Q.36b)
Scope Branches* %
Maintenance 86 63.2%
Refurbishment of existing building 33 24.3%
Extensions 12 8.8%
New Building 12 8.8%
Relocation 6 4.4%
Closure 5 3.7%
Other 18 13.2%
* 136 branches responded that they have an asset management plan
Respondents were also asked to indicate the year that planned works were due to take place under the asset management plan. While the high rate of non-response for each item (on average 62%) limits the validity of any detailed analysis, these results are presented in Table 6.3.
Table 6.3: Timeframe of asset management plan actions (Q.36b)
Timeframe 2006 2007 2008–2009
2010–2014 2015>
Not stated Total
New building 2 (16.7%)
1 (8.3%)
0 (0.0%)
3 (25.0%)
1 (8.3%)
5 (41.7%)
12 (100%)
Closure 0 (0.0%)
1 (100%)
0 (0.0%)
0 (0.0%)
0 (0.0%)
0 (0.0%)
1 (100%)
Relocation 0 (0.0%)
0 (0.0%)
2 (33.3%)
0 (0.0%)
0 (0.0%)
4 (66.7%)
6 (100%)
Refurbishment 2 (6.1%)
6 (18.2%)
3 (9.1%)
0 (0.0%)
2 (6.1%)
20 (60.6%)
33 (100%)
Extensions 0 (0.0%)
1 (8.3%)
1 (8.3%)
1 (8.3%)
0 (0.0%)
9 (75.0%)
12 (100%)
Maintenance 1 (1.2%)
12 (14.0%)
5 (5.8%)
9 (10.5%)
3 (3.5%)
56 (65.1%)
86 (100%)
Other works 0 (0.0%)
6 (33.3%)
1 (5.6%)
0 (0.0%)
0 (0.0%)
11 (61.1%)
18 (100%)

- 116 -
Case study 11: East Melbourne Library, Melbourne Library Service
Gross floor area: 710 sq m
User catchment: Local and bordering neighbourhoods of East Melbourne, Jolimont, South Bank, West Richmond, South Yarra
Cost: $4.95 million
Architect: City of Melbourne, City Projects
Date completed: August 2006
Usage: 122,000 loans per annum* 79,000 visits per annum* *Estimate based on August–December 2006 usage
The new East Melbourne Library replaces a small, mid-twentieth century library located on the same site. Consistent with City of Melbourne’s strong commitment to environmental responsibility, the library has been designed in line with best practice environmental sustainability principles. Located in a relatively quiet residential area, the library has a strong physical presence while blending harmoniously with the streetscape. For an imposing and architecturally striking building it does not in any way overwhelm or subdue its surroundings. As a relatively new facility, it is quickly becoming a vibrant community hub with further opportunities to partner with Council and community stakeholders to provide a range of services and programs that meet the needs of the local and broader community.

- 117 -
East Melbourne Library continued Examples of this include use of the superb meeting space for musical performance, health and well-being programs, and talks on topics of interest such as environmental sustainability. The most striking feature of the East Melbourne Library and Community Centre is its use of leading technologies and systems to minimise environmental impact during construction and over the life of the building. These initiatives can be considered broadly from the two views of the building operation, and the furniture and fit-out, both of which combine to demonstrate that environmental design does not compromise aesthetic comfort but rather creates a healthy and exciting community facility.
The selection of loose furniture items has been guided by strict Ecologically Sustainable Development (ESD) principles to ensure congruity with the overall building fabric and operation. Significant use has been made of recycled materials, which have been used in the shelving, chairs, tables, floors, garden and outdoor seating areas, just to list a few. Water harvesting systems optimise rain water for toilets and gardens. Melbourne Library Service is developing a dynamic ESD collection and information program to support sustainability awareness in the community. Given that the East Melbourne Library continues to attract considerable attention due to its innovative design, it is only logical that the resources will be located at and programs will be run out of this facility.

- 118 -
6.2 Assessment Building condition surveys are undertaken by library services or LGAs for almost four-fifths (79.1%) of Victorian library branches (Table 6.4). This figure may be higher as there was a non-response rate of 15.6% for this question. Thirteen (5.3%) libraries indicated that no regular condition surveys are conducted of their building. Of those libraries which undertake surveys, over one-half (55.4%, 43.8% overall) of libraries indicated that condition surveys are undertaken of their buildings on at least an annual basis. A small number of libraries (nine, or 4.6%) undertook surveys at intervals of greater than five years.
Table 6.4: Building condition surveys (Q.42)
Frequency Branches %
<5 years 9 3.7%
2–5 years 56 23.0%
Every second year 21 8.6%
Yearly 94 38.5%
Several times a year 13 5.3%
Not done 13 5.3%
Branches did not complete question 38 15.6%
Total 244 100%
6.3 Maintenance At least $5.7 million is spent each year on maintaining public library buildings in Victoria. This figure is expected to be notably higher, as 34 libraries (representing 13.9% of Victorian libraries), did not provide their annual maintenance expenditure. On average, approximately $27,232 is spent on the maintenance of each public library branch. On average, $43.50 is spent on maintenance per sq m of library floorspace. Interpretation of this average should, however, be informed by the correlation between library size (floorspace) and maintenance costs6. Maintenance costs for individual libraries ranged from $70 (considered to be unfeasibly low) to $325,000 per year. On an annual basis, 30.3% spent less than $10,000, 43% spent between $10,000 and $50,000, 9% spent between $50,000 and $100,000, and 3.7% spent more than $100,000 (Table 6.5).
6 The correlation coefficient = 0.513. Maintenance costs range from $2 to $330 per sq m.

- 119 -
Table 6.5: Annual maintenance costs (Q.38)
Cost Branches %
<$1000 8 3.3%
$1,000–$2,499 13 5.3%
$2,500–$4,999 13 5.3%
$5,000–$7,499 23 9.4%
$7,500–$9,999 17 7.0%
$10,000–$14,999 19 7.8%
$15,000–$19,999 20 8.2%
$20,000–$49,999 66 27.0%
$50,000–$99,999 22 9.0%
$100,000> 9 3.7%
Branches did not complete question 34 13.9%
Total 244 100%
Libraries were also asked to provide a breakdown of maintenance expenses. However, each category (Table 6.6) had a high non-response rate (between 30% and 90%), thereby limiting any interpretation of responses. However, from the responses received, Victorian libraries spend on an annual basis between: $15 and $68,666 on cleaning. $22 and $60,000 on unplanned reactive maintenance. $200 and $85,800 on planned preventative maintenance. $200 and $60,000 on planned works programs (condition-based). $10 and $300,000 on major plant and equipment replacement. $500 and $91,000 on other maintenance expenses.
Some minimum expenditure identified is at values which question the accuracy of responses. Other maintenance costs were identified by some libraries, for expenditure on graffiti removal, security and fire services, as well as other general maintenance.

- 120 -
Table 6.6: Breakdown of maintenance expenses (Q.38)
Cost
Annual mainte-
nance Annual
cleaning
Unplanned mainte-
nance
Planned prevent-
ative mainte-
nance
Planned works
program (condition-
based)
Major plant &
equipment replace-
ment
Other mainte-
nance expenses
<$1,000 8 (3.3%)
6 (2.5%)
29 (11.9%)
6 (2.5%)
3 (1.2%)
2 (0.8%)
2 (0.8%)
$1,000–$2,499
13 (5.3%)
16 (6.6%)
29 (11.9%)
32 (13.1%)
14 (5.7%)
5 (2.0%)
3 (1.2%)
$2,500–$4,999
13 (5.3%)
19 (7.8%)
26 (10.7%)
17 (7.0%)
2 (0.8%)
4 (1.6%)
2 (0.8%)
$5,000–$7,499
23 (9.4%)
30 (12.3%)
19 (7.8%)
10 (4.1%)
8 (3.3%)
3 (1.2%)
4 (1.6%)
$7,500–$9,999
17 (7.0%)
17 (7.0%)
2 (0.8%)
6 (2.5%)
4 (1.6%)
2 (0.8%)
1 (0.4%)
$10,000–$14,999
19 (7.8%)
21 (8.6%)
8 (3.3%)
10 (4.1%)
7 (2.9%)
2 (0.8%)
2 (0.8%)
$15,000–$19,999
20 (8.2%)
22 (9.0%)
8 (3.3%)
7 (2.9%)
0 (0.0%)
8 (3.3%)
3 (1.2%)
$20,000–$49,999
66 (27.0%)
41 (16.8%)
4 (1.6%)
6 (2.5%)
7 (2.9%)
1 (0.4%)
3 (1.2%)
$50,000–$99,999
22 (9.0%)
1 (0.4%)
1 (0.4%)
1 (0.4%)
1 (0.4%)
0 (0.0%)
1 (0.4%)
$100,000>
9 (3.7%)
0 (0%)
0 (0.0%)
0 (0.0%)
0 (0.0%)
4 (1.6%)
0 (0.0%)
Sub-total 210 (86.1%)
173 (70.9%)
126 (51.6%)
95 (38.9%)
46 (18.9%)
31 (12.7%)
21 (8.6%)
Branches did not complete question
34 (13.9%)
71 (29.1%)
118 (48.4%)
149 (61.1%)
198 (81.1%)
213 (87.3%)
223 (91.4%)
Total 244 (100%)
244 (100%)
244 (100%)
244 (100%)
244 (100%)
244 (100%)
244 (100%)
Libraries were also asked to identify the extent to which any maintenance backlog existed for their building. The majority (81.6%) of libraries did not identify a maintenance backlog. It is likely, given the high non-response rate for asset management questions in general, that some of these libraries will have a backlog but have been unable to quantify it. Of the 45 branches which identified a backlog of maintenance of their buildings, 40% identified that the backlog exceeded $25,000 (Table 6.7).

- 121 -
Table 6.7: Estimated backlog of planned maintenance (Q.39)
Cost Branches* %
<$500 1 2.2%
$1,000–$1,999 3 6.7%
$2,000–$4,999 7 15.6%
$5,000–$9,999 7 15.6%
$10,000–$24,999 9 20.0%
$25,000> 18 40.0%
Total 45 100%
* 199 branches did not complete this question
6.4 Utilities spend Libraries were asked to indicate the amount spent each quarter on utilities, including gas, electricity and water. Respondents were instructed to leave the question blank if no service was present, and insert $0 if present but free of charge. Overall, electricity was the largest utility expenditure (Table 6.8). On average, libraries spend about $4,600 on electricity, $1,100 on gas, and $500 on water (approximately $5,500 per quarter in total). Utilities expenditure is correlated with floorspace, and on average $8 per sq m for utilities.
Table 6.8: Summary of utilities expenditure (Q.29)
Per quarter Electricity Gas Water Total utilities
Average expenditure per sq m* $6.95 $1.40 $0.70 $8.07
Mean expenditure $4,679.68 $1,168.46 $515.76 $5,486.16
Median expenditure $3,131.00 $958.00 $250.00 $3,812.00
* Of those libraries which provided information. Total utilities averages are not directly comparable as not all questions were answered.
The 186 branches (76.2%) that provided information for this question spend a total of approximately $809,585 on electricity each quarter. Individual expenditure on electricity ranged from nothing to $68,429 per quarter (Table 6.9). A small proportion (7%) indicated they did not have any electricity expenses, due to such expenses being covered by Council or building owner. Nearly one-half of libraries (45.7%) spend less than $2,500 per quarter on electricity; a further 39.8% spend between $2,500 and $7,500. In interpreting these statistics it is noted that almost one-quarter (23.8%) of all library branches participating in the survey did not indicate their quarterly electricity expenditure.
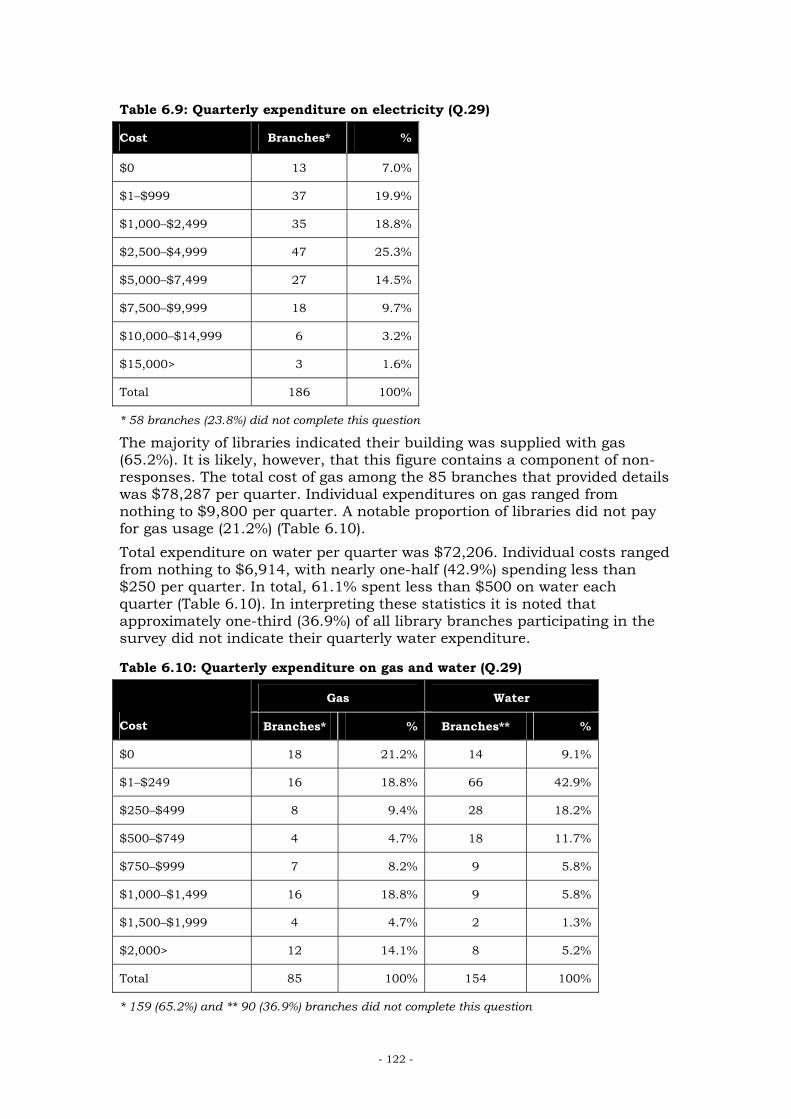
- 122 -
Table 6.9: Quarterly expenditure on electricity (Q.29)
Cost Branches* %
$0 13 7.0%
$1–$999 37 19.9%
$1,000–$2,499 35 18.8%
$2,500–$4,999 47 25.3%
$5,000–$7,499 27 14.5%
$7,500–$9,999 18 9.7%
$10,000–$14,999 6 3.2%
$15,000> 3 1.6%
Total 186 100%
* 58 branches (23.8%) did not complete this question
The majority of libraries indicated their building was supplied with gas (65.2%). It is likely, however, that this figure contains a component of non-responses. The total cost of gas among the 85 branches that provided details was $78,287 per quarter. Individual expenditures on gas ranged from nothing to $9,800 per quarter. A notable proportion of libraries did not pay for gas usage (21.2%) (Table 6.10). Total expenditure on water per quarter was $72,206. Individual costs ranged from nothing to $6,914, with nearly one-half (42.9%) spending less than $250 per quarter. In total, 61.1% spent less than $500 on water each quarter (Table 6.10). In interpreting these statistics it is noted that approximately one-third (36.9%) of all library branches participating in the survey did not indicate their quarterly water expenditure.
Table 6.10: Quarterly expenditure on gas and water (Q.29)
Gas Water
Cost Branches* % Branches** %
$0 18 21.2% 14 9.1%
$1–$249 16 18.8% 66 42.9%
$250–$499 8 9.4% 28 18.2%
$500–$749 4 4.7% 18 11.7%
$750–$999 7 8.2% 9 5.8%
$1,000–$1,499 16 18.8% 9 5.8%
$1,500–$1,999 4 4.7% 2 1.3%
$2,000> 12 14.1% 8 5.2%
Total 85 100% 154 100%
* 159 (65.2%) and ** 90 (36.9%) branches did not complete this question

- 123 -
Case study 12: Carnegie Library, Glen Eira Library Service
Gross floor area: 1,042 sq m
User catchment: 25,000 The Carnegie catchment figure includes the population of the suburbs of Carnegie, Murrumbeena and half of Glenhuntly.
Cost: $10.4 million
Architect: Perrott Lyon Mathieson
Date completed: October 2005
Usage: 2005/2006: 1,240,548 loans and 689,396 visits
The Carnegie Library and Community Centre is a brilliant illustration of a Council working in partnership with its community to create a civic hub and focal point for local people to participate in and enrich community life. The Library and Community Centre includes a state-of-the-art library, community meeting and function rooms, a multi-purpose children’s area, and a contemporary urban playground incorporating colourful ‘bookworm’ sculptures. It is linked to the local shopping strip by a landscaped pedestrian walk and the design of the Centre gives it a significant presence in the local shopping and business precinct without adversely impacting on adjoining residential streets. The centre’s success has confirmed the benefits of collocating community services in activity centres to maximise community participation, economic benefit to local business, and strengthen a sense of local identity and belonging.

- 124 -
Carnegie Library continued The centre offers a range of activities that 1,200 people per day come to the Centre to participate in: library visits, family storytime sessions, playgroups, senior citizens’ social events, and health and well-being activities such as recreation classes and immunisation sessions. Significant features of the library are the children’s area and adjacent events area which have proved extremely popular with children and families. The numbers of people attending preschool and babytime storytime sessions have grown to almost 400 per week. The pride in the Carnegie Library and Community Centre extends beyond its elegant design and stunning appearance; it has been immensely satisfying to see the extent of community ownership of the centre – evident from the opening celebrations which attracted over 8,000 people. Since its opening, library usage has grown significantly. Loans have increased by over 300% per week compared to levels at the previous shopfront library.

- 125 -
7. PLANNING AND DEVELOPMENT
This section reviews current planning and development processes, including planned refurbishment; new buildings planned; and planned replacement other on the same or a new site. Details provided include the types of works planned; timeframe; Gross Floor Area; budget; and locational attributes of new sites. Research in Australia and overseas has identified that ‘the strengths and weaknesses of a new public library building within a community are established with the initial conditions of planning and construction’ (Bryson et al 2003:8). People places identifies the recommended stages to work through in order to plan a new library building. It nominates a range of key design factors which continually emphasise the influence of the people on every stage of the planning process considering ‘how: people use buildings; they perceive them; accessible the buildings are for people of varying mobility; user needs must be respected when ecological sustainability is
incorporated; user characteristics must be considered when furniture is selected or
designed or when shelving is set out; safety and security issues will impact on people’ (Jones 2001:82).
Similar questions must also be considered by library managers when they evaluate their building for future users. Jones (2003) has commented on the flexibility of library buildings built in different eras and their suitability for renovation, with the obvious constraints of most of the older structures. One-half (50%) of libraries indicated their building was capable of accommodating expansion.
7.1 Perceived need for redevelopment Sixty libraries, representing one-quarter (24.6%) of respondents, perceived that either major refurbishments or extensions (or both) would be required to their library branches within the next five years. However, only about one-half (56.7%) of those libraries where refurbishment was perceived as required indicated that improvements of some kind were actually planned for their building.
7.2 Overview of planned library development The Audit collected details on the planned development of library buildings in Victoria. The branch library survey collected data on the refurbishment or replacement of existing branch library buildings, while the LGA survey collected data on the planned construction of new branch buildings. Many of these planned developments (46%) involve refurbishment of the existing building fabric; however, just as many libraries are to be demolished and rebuilt (48%). Seventeen libraries are to be removed to a new location following demolition, while eight are to be rebuilt at the same location. This

- 126 -
suggests that many existing libraries are constrained in a way which cannot be remedied by refurbishment. In addition, there are plans to construct 19 completely new libraries around Victoria. New buildings are planned by 14 library services (within 15 LGAs). Geelong Regional Library Corporation and Wellington Shire Library Service have plans for two new libraries. Wyndham Library Service has plans for three new libraries. Eleven library services plan the addition of only one new library. Table 7.2 identifies the form of library development planned by its location.
Table 7.1: Planned library development in Victoria (Q.7)
Development Branches %
Refurbishment of existing branch 24 9.8%
Replacement – on site 8 3.3%
Replacement – relocation to new site 17 7.0%
Unspecified works to existing building 3 1.2%
No planned works (existing building) 182 74.6%
Not stated 10 4.1%
Total 244 100%
Construction of a new branch library 19 7.8%*
* percentage of existing libraries

- 127 -
Table 7.2: Location of planned library development (Q.7)
Library Service LGA New
building Refurbishment
of existing Replacement –
on site Replacement –
new site Unspecified works
to existing Not
stated No
change
Bayside Library Service Bayside City Council 4
Brimbank Libraries Brimbank City Council 1 4
Campaspe Regional Library
Campaspe Shire Council 1 1 3
Cardinia Shire Council 1 1 1 Casey-Cardinia Library Corporation Casey City Council 3 1 1
Ararat Rural City Council 1
Ballarat City Council 3
Central Goldfields Shire Council 1
Hepburn Shire Council 3
Moorabool Shire Council 1
Pyrenees Shire Council 2
Central Highlands Regional Library
Southern Grampians Shire Council 1
City of Boroondara Library Service
Boroondara City Council 1 1 3

- 128 -
Library Service LGA New
building Refurbishment
of existing Replacement –
on site Replacement –
new site Unspecified works
to existing Not
stated No
change
Darebin Libraries Darebin City Council 4
East Gippsland Shire Library
East Gippsland Shire Council 1 1 1 3
Knox City Council 1 1 3
Maroondah City Council 1 1 Eastern Regional
Libraries
Yarra Ranges Shire Council 1 6
Frankston Library Service Frankston City Council 2
Gannawarra Library Service
Gannawarra Shire Council 1 3
Borough of Queenscliffe 1
Golden Plains Shire Council 1
Greater Geelong City Council 2 1 1 7 1
Geelong Regional Library Corporation
Surf Coast Shire Council 1 1
Glen Eira Library and Information Service
Glen Eira City Council 1 3

- 129 -
Library Service LGA New
building Refurbishment
of existing Replacement –
on site Replacement –
new site Unspecified works
to existing Not
stated No
change
Glenelg Libraries Glenelg Shire Council 3
Greater Bendigo City Council 5
Loddon Shire Council 1
Macedon Ranges Shire Council 2 1
Goldfields Library Corporation
Mount Alexander Shire Council 1
Greater Shepparton City Council 3
Moira Shire Council 1 3 Goulburn Valley Regional Library Corporation
Strathbogie Shire Council 1 2
Greater Dandenong Libraries
Greater Dandenong City Council 1 1
Alpine Shire Council 3
Benalla Rural City Council 1 1
Mansfield Shire Council 1
High Country Library Corporation
Wangaratta Rural City Council 1

- 130 -
Library Service LGA New
building Refurbishment
of existing Replacement –
on site Replacement –
new site Unspecified works
to existing Not
stated No
change
Hobsons Bay Libraries
Hobsons Bay City Council 1 2 2
Hume Global Learning Village Library Service
Hume City Council 1 1 4
Kingston Information and Library Service
Kingston City Council 1 8
Latrobe City Library Service Latrobe City Council 1 1 2
Maribyrnong Library Service
Maribyrnong City Council 1 1 2
Melbourne Library Service Melbourne City Council 2 1
Melton Library and Information Service
Melton Shire Council 1 1 1
Mildura Rural City Council Library Service
Mildura Rural City Council 1 1 2
Macedon Ranges Shire Council 1 Mitchell Shire
Library and Information Service Mitchell Shire Council 1 3
Monash Public Library Service Monash City Council 1 4
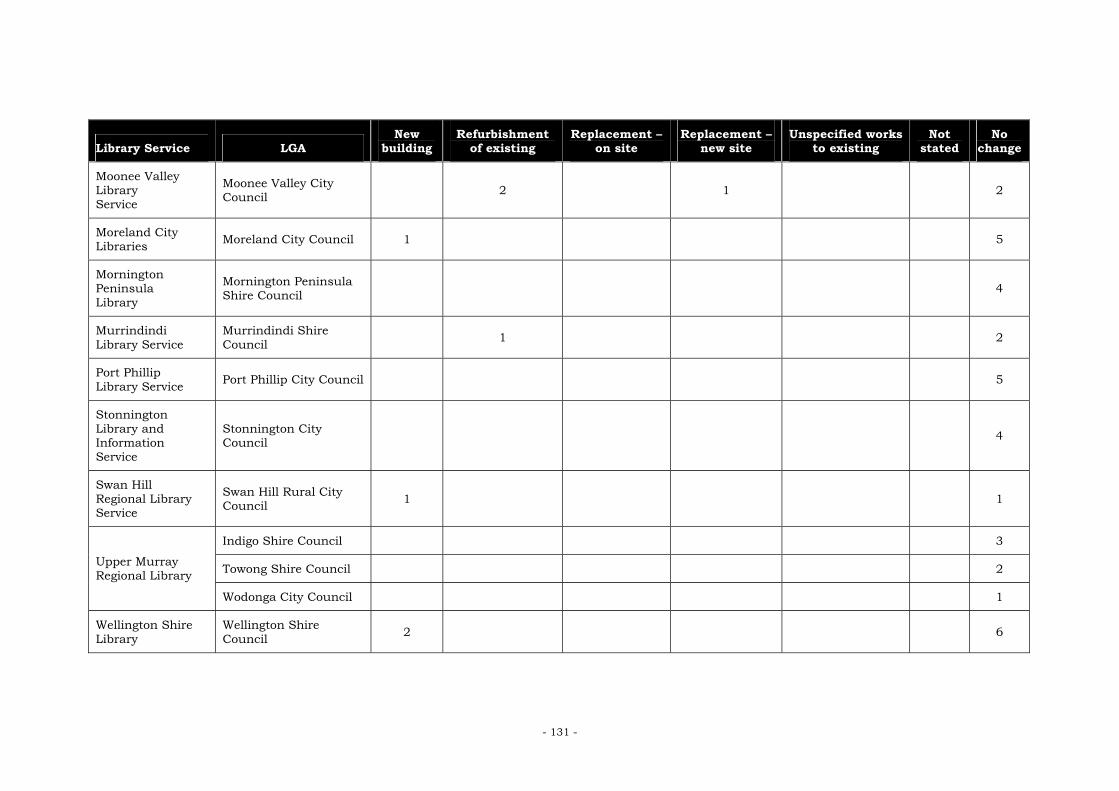
- 131 -
Library Service LGA New
building Refurbishment
of existing Replacement –
on site Replacement –
new site Unspecified works
to existing Not
stated No
change
Moonee Valley Library Service
Moonee Valley City Council 2 1 2
Moreland City Libraries Moreland City Council 1 5
Mornington Peninsula Library
Mornington Peninsula Shire Council 4
Murrindindi Library Service
Murrindindi Shire Council 1 2
Port Phillip Library Service Port Phillip City Council 5
Stonnington Library and Information Service
Stonnington City Council 4
Swan Hill Regional Library Service
Swan Hill Rural City Council 1 1
Indigo Shire Council 3
Towong Shire Council 2 Upper Murray Regional Library
Wodonga City Council 1
Wellington Shire Library
Wellington Shire Council 2 6

- 132 -
Library Service LGA New
building Refurbishment
of existing Replacement –
on site Replacement –
new site Unspecified works
to existing Not
stated No
change
Bass Coast Shire Council 1 1 2
Baw Baw Shire Council 1 3 West Gippsland Regional Library Corporation
South Gippsland Shire Council 5
Manningham City Council 1 3 Whitehorse
Manningham Regional Library Corporation Whitehorse City
Council 2 2
Buloke Shire Council 1
Hindmarsh Shire Council 2
Horsham Rural City Council 1
Northern Grampians Shire Council 2
West Wimmera Shire Council 4
Wimmera Regional Library Corporation
Yarriambiack Shire Council 1
Wyndham City Library Service Wyndham City Council 3 2
Yarra Libraries Yarra City Council 1 4

- 133 -
Library Service LGA New
building Refurbishment
of existing Replacement –
on site Replacement –
new site Unspecified works
to existing Not
stated No
change
Banyule City Council 1 2
Nillumbik Shire Council 1 1 Yarra Plenty Regional Library Service
Whittlesea City Council 3
Total 19 24 8 17 3 10 182

- 134 -
7.3 Timeframe The majority of libraries (67.6%) indicated their planned developments would be completed (and the upgraded library operational) in less than four years (Table 7.3); one-third would be completed in the next two years. The form of development planned is reflected in development timeframes. Nearly two-thirds of refurbishments (62.5%) are planned for completion in the next two years, while only 21.1% of new buildings have imminent plans for construction. Plans for the demolition and removal of libraries are longer term, with two-thirds (64.7%) to be undertaken in more than four years time.
Table 7.3: Timeframe of library development (Q.7)
Timeframe Refurbishment
of existing Replacement
– on site Replacement
– new site Yes,
unstated New
building Total
<2 years 15 (62.5%)
2 (25.0%)
4 (23.5%)
1 (33.3%)
4 (21.1%)
26 (36.6%)
2–4 years 5 (20.8%)
5 (62.5%)
2 (11.8%)
1 (33.3%)
9 (47.4%)
22 (31.0%)
4> years 4 (16.7%)
1 (12.5%)
11 (64.7%)
0 (0.0%)
6 (31.6%)
22 (31.0%)
Branch did not complete question
0 (0.0%)
0 (0.0%)
0 (0.0%)
1 (33.3%)
0 (0.0%)
1 (1.4%)
Total 24 (100%)
8 (100%)
17 (100%)
3 (100%)
19 (100%)
71 (100%)
7.4 Budget Local Government in Victoria has plans to spend $150.2 million on library building development in the next five years. A further $19.1 million is planned to be spent on internal assets (e.g. shelving, etc.). This excludes budget for book stock and other resources. While 46% of planned developments involve refurbishment of an existing building, all but $7 million of this capital budget is to be spent on new buildings. The average budget for a new building is $4.6 million. The average budget for a new building is notably lower than the average allowed for construction of a replacement building (Table 7.4). In comparison, just $350,000 is allowed on average for refurbishment of an existing library. This figure is skewed by some planned developments, as reflected by the median value of just $192,000. As identified in Table 7.4, 20.8% of planned refurbishments have a budget of less than $25,000.

- 135 -
Table 7.4: Capital budget (Q.7)
Capital budget
Refurbishment of existing
Replacement – on site
Replacement – new site
Yes, unstated
New building Total
<$25,000 5 (20.8%)
0 (0.0%)
0 (0.0%)
0 (0.0%)
0 (0.0%)
5 (7.0%)
$25,000–$49,999
1 (4.2%)
0 (0.0%)
0 (0.0%)
0 (0.0%)
0 (0.0%)
1 (1.4%)
$50,000–$99,999
2 (8.3%)
0 (0.0%)
0 (0.0%)
0 (0.0%)
0 (0.0%)
2 (2.8%)
$100,000–$249,999
4 (16.7%)
0 (0.0%)
0 (0.0%)
0 (0.0%)
1 (5.3%)
5 (7.0%)
$250,000–$499,999
1 (4.2%)
0 (0.0%)
0 (0.0%)
0 (0.0%)
2 (10.5%)
3 (4.2%)
$500,000–$999,999
6 (25.0%)
0 (0.0%)
1 (5.9%)
0 (0.0%)
1 (5.3%)
8 (11.3%)
$1,000,000– $1,999,999
1 (4.2%)
0 (0.0%)
0 (0.0%)
0 (0.0%)
2 (10.5%)
3 (4.2%)
$2,000,000–$4,999,999
0 (0.0%)
0 (0.0%)
6 (31.6%)
21 (29.6%)
$5,000,000> 0 (0.0%)
6 (75.0%)
9 (52.9%) 0
(0.0%) 3
(15.8%) 3
(4.2%)
Branch did not provide data
4 (16.7%)
2 (25.0%)
7 (41.2%)
3 (100%)
4 (21.1%)
20 (28.2%)
Total 24 (100%)
8 (100%)
17 (100%)
3 (100%)
19 (100%)
71 (100%)
Capital budget Refurbishment of existing
Replacement – on site
Replacement – new site New building Total
Total value $6,947,900 $39,400,000 $52,350,000 $51,482,000 $150,179,900
Average value $347,395 $6,566,666 $5,235,000 $3,432,133 $2,944,703
Median value $192,500 $5,500,000 $4,250,000 $1,037,500 $1,800,000

- 136 -
Table 7.5: Internal fit-out budget (Q.7)
Budget Refurbishment
of existing Replacement
– on site Replacement
– new site Yes,
unstated New
building Total
<$15,000 3 (12.5%)
1 (12.5%)
0 (0.0%)
0 (0.0%)
3 (15.8%)
7 (9.9%)
$15,000–$49,999
5 (20.8%)
0 (0.0%)
0 (0.0%)
0 (0.0%)
2 (10.5%)
7 (9.9%)
$50,000–$99,999
4 (16.7%)
0 (0.0%)
0 (0.0%)
0 (0.0%)
0 (0.0%)
4 (5.6%)
$100,000–$199,999
4 (16.7%)
1 (12.5%)
0 (0.0%)
0 (0.0%)
1 (5.3%)
6 (8.5%)
$200,000–$499,999
0 (0.0%)
2 (25.0%)
2 (11.8%)
0 (0.0%)
5 (26.3%)
9 (12.7%)
$500,000> 0 (0.0%)
1 (12.5%)
5 (29.4%)
0 (0.0%)
5 (26.3%)
11 (15.5%)
Branch did not provide data
8 (33.3%)
3 (37.5%)
10 (58.8%)
3 (100%)
3 (15.8%)
27 (38.0%)
Total 24 (100%)
8 (100%)
17 (100%)
3 (100%)
19 (100%)
71 (100%)
Budget Refurbishment of existing
Replacement – on site
Replacement – new site New building Total
Total value $826,200 $4,750,000 $7,250,000 $6,280,250 $19,106,450
Average value $51,637 $950,000 $1,035,714 $392,515 $1,194,153.13
Median value $57,000 $325,000 $1,200,000 $9,625 $100,000
7.5 Planned scope of alterations
7.5.1 Floorspace Following implementation of all planned library developments, library floorspace in Victoria will increase by 37,363 sq m. This is an average of 593 sq m per development; however, proposals greatly vary in size. Approximately one-third of library developments plan to provide substantial increases in library floorspace (greater than 500 sq m). A further one-quarter of library developments do not propose to increase the floorspace available at the library (Table 7.6). In proportional terms, just over one-quarter of libraries (26.6%) propose to more than double their existing floorspace through redevelopment (Table 7.7). Those libraries which are to be demolished and replaced at the same location generally do so to increase their floorspace, with most (50%) doing so substantially (over 1,000 sq m); a similar pattern is evident in all new buildings. As noted above, one-half of libraries indicated their building was not capable of accommodating expansion.

- 137 -
Table 7.6: Proposed additional floorspace (Q.7)
Sq m Refurbishment
of existing Replacement
– on site Replacement
– new site Yes,
unstated New
building Total
0 10 (41.7%)
0 (0.0%)
5 (29.4%)
2 (66.7%)
1 (5.3%)
18 (25.4%)
1–49 1 (4.2%)
0 (0.0%)
0 (0.0%)
0 (0.0%)
0 (0.0%)
1 (1.4%)
50–149 4 (16.7%)
0 (0.0%)
0 (0.0%)
0 (0.0%)
0 (0.0%)
4 (5.6%)
150–299 5 (20.8%)
1 (12.5%)
0 (0.0%)
0 (0.0%)
2 (10.5%)
8 (11.3%)
300–499 2 (8.3%)
0 (0.0%)
3 (17.6%)
0 (0.0%)
3 (15.8%)
8 (11.3%)
500–999 1 (4.2%)
1 (12.5%)
2 (11.8%)
0 (0.0%)
7 (36.8%)
11 (15.5%)
1,000> 0 (0.0%)
4 (50.0%)
5 (29.4%)
0 (0.0%)
4 (21.1%)
13 (18.3%)
Branch did not provide data
1 (4.2%)
2 (25.0%)
2 (11.8%)
1 (33.3%)
2 (10.5%)
8 (11.3%)
Total 24 (100%)
8 (100%)
17 (100%)
3 (100%)
19 (100%)
71 (100%)
Increase in floorspace
Refurbishment of existing
Replacement – on site
Replacement – new site New building Total
Total increase in floorspace 2,492 sq m 11,160 sq m 11,316 sq m 12,395 sq m 37,363 sq m
Average increase 108.3 sq m 1,860.0 sq m 754.4 sq m 729.1 sq m 593.1 sq m
Median increase 50 sq m 1,100 sq m 400 sq m 645 sq m 300 sq m

- 138 -
Table 7.7: Change in Gross Floor Area after redevelopment (Q.7)
GFA Increase Branches* %
0% 17 26.6%
1%–10% 1 1.6%
11%–25% 3 4.7%
26%–50% 3 4.7%
51%–100% 9 14.1%
101%–200% 11 17.2%
201%–500% 4 6.3%
501%> 2 3.1%
* 14 branches (21.9%) did not complete this question
7.5.2 Internal reconfiguration Libraries were asked to specify what types of alterations were planned to existing buildings. From Table 7.8, it can be seen that: More than one-half (60%) will create additional floorspace. No
redevelopment will lead to a decrease in floorspace. Almost four-fifths (79.2%) of refurbishments involve an internal
reorganisation of space. One-half (50%) of refurbishments will alter the internal structure of the building.
Improvements are planned to all functional library areas by approximately one-half of redevelopments. Refurbishments are most likely to make improvements to reading and study areas (66.7%) followed by collection areas (54.2%). Improvements to shelving are important, being undertaken in one-half of refurbishments.
Many refurbishments involve cosmetic improvements, with 62.5% planning new carpet, and 70.8% painting.
One-half (50%) of refurbishments will have increased computer access and more than one-quarter (29.2%) will provide wireless internet.
Close to one-half (45.8%) of refurbishments plan to improve access for people with a disability.

- 139 -
Table 7.8: Type of alterations planned (Q.7)
Refurbishment
of existing Replacement
– on site Replacement
– new site Yes,
unstated Total
Internal reorganisation of space
19 (79.2%)
3 (50.0%)
6 (35.3%)
1 (33.3%)
29 (58.0%)
Additional floorspace
14 (58.3%)
4 (66.7%)
11 (64.7%)
1 (33.3%)
30 (60.0%)
Decreased floorspace
0 (0.0%)
0 (0.0%)
0 (0.0%)
0 (0.0%)
0 (0.0%)
Internal structural alterations
12 (50.0%)
2 (33.3%)
3 (17.6%)
0 (0.0%)
17 (34.0%)
Improved collection areas
13 (54.2%)
4 (66.7%)
10 (58.8%)
1 (33.3%)
28 (56.0%)
Improved reading and study areas
16 (66.7%)
3 (50.0%)
10 (58.8%)
0 (0.0%)
29 (58.0%)
Improved resource areas
11 (45.8%)
4 (66.7%)
10 (58.8%)
0 (0.0%)
25 (50.0%)
Improved staff areas
8 (33.3%)
3 (50.0%)
10 (58.8%)
0 (0.0%)
21 (42.0%)
Improved amenities areas
7 (29.2%)
3 (50.0%)
10 (58.8%)
0 (0.0%)
20 (40.0%)
Improvements to other areas (specified)
2 (8.3%)
0 (0.0%)
6 (35.3%)
0 (0.0%)
8 (16.0%)
Improved shelving
12 (50.0%)
3 (50.0%)
10 (58.8%)
0 (0.0%)
25 (50.0%)
Building services upgrade
1 (4.2%)
2 (33.3%)
4 (23.5%)
0 (0.0%)
7 (14.0%)
Fire safety improvements
6 (25.0%)
3 (50.0%)
7 (41.2%)
0 (0.0%)
16 (32.0%)
Improved disabled access
11 (45.8%)
4 (66.7%)
5 (29.4%)
0 (0.0%)
20 (40.0%)
Energy consumption improvements
8 (33.3%)
4 (66.7%)
7 (41.2%)
0 (0.0%)
19 (38.0%)
Increased computer access
12 (50.0%)
4 (66.7%)
8 (47.1%)
0 (0.0%)
24 (48.0%)
Wireless internet
7 (29.2%)
3 (50.0%)
5 (29.4%)
0 (0.0%)
15 (30.0%)
Carpeting/other floor covering
15 (62.5%)
3 (50.0%)
9 (52.9%)
0 (0.0%)
27 (54.0%)

- 140 -
Refurbishment
of existing Replacement
– on site Replacement
– new site Yes,
unstated Total
Painting 17 (70.8%)
3 (50.0%)
8 (47.1%)
0 (0.0%)
28 (56.0%)
Building materials – external cladding
3 (12.5%)
3 (50.0%)
6 (35.3%)
0 (0.0%)
12 (24.0%)
Heating 6 (25.0%)
3 (50.0%)
6 (35.3%)
0 (0.0%)
15 (30.0%)
Air-conditioning 7 (29.2%)
3 (50.0%)
7 (41.2%)
0 (0.0%)
17 (34.0%)
Other works (specified)
0 (0.0%)
1 (16.7%)
5 (29.4%)
2 (66.7
8 (16.0%)
This table excludes wholly new buildings
Other improvements planned to libraries include the addition of: Cafes. Council customer service centre. Meeting rooms. Storage. Improvements to allow use as part of a multipurpose community centre. Improvements to provide for joint use (e.g. connection to an adjoining
school). One library was investigating a Public Private Partnership (PPP) style site redevelopment, whereby residential or commercial offices would be included in part of the site redevelopment contributing towards the cost of the library.
7.6 Delivery Local Government Authorities were asked to identify if planned new buildings would be collocated or joint use. A number of LGAs also provided this information for replacement buildings, where an existing library is to be removed to a new site (Table 7.9).
Table 7.9: Collocated or joint-use facilities planned (Q.7)
Joint-use Collocated Both joint-use
& collocated Neither Not
stated Total
New building 2 (10.5%)
11 (57.9%)
1 (5.3%)
4 (21.1%)
1 (5.3%)
19 (100%)
Replacement – new site
1 (5.9%)
13 (76.5%)
0 (0.0%)
3 (17.6%)
0 (0.0%)
17 (100%)
Total 3 (8.3%)
24 (66.7%)
1 (2.8%)
7 (19.4%)
1 (2.8%)
36 (100%)
Almost three-quarters (73.7%) of new libraries will be delivered in either collocated or joint-use form. This is a substantially higher proportion than the 52.3% of existing libraries which are collocated or integrated with other

- 141 -
types of facilities or services; 10.5% of new libraries are to be joint-use facilities, compared to 9.8% of existing library buildings. A similar pattern is evident in plans for relocated libraries, where 82.4% will be either joint-use or collocated. LGAs were also asked to indicate the type of facility or service with which the new library would be collocated or jointly used; some were yet to be determined. Joint-users identified were: Childcare Centre/Preschool. Community centre. Secondary college library. Council offices.
Collocated services identified were: Schools. Community centre, hall, meeting rooms. Medical services including Maternal and Child Health Service, consulting
rooms, State dental service. Children’s service such as kindergartens, pre-school, childcare, toy
library. Council services including community facilities, youth services, customer
service, art gallery, cultural facilities, community technology hub. Leisure centre/recreation facilities such as a swimming pool,
gymnasium. Cafe. Retail. Community groups such as historical societies.
7.7 Locational characteristics Library services were asked to indicate the proximity of new buildings to a variety of community facilities and services. The proximity of existing buildings is considered in Section 5. Analysis of this data, identified in Table 7.10, indicates: No planned libraries are to be located within a shopping centre. Around
73.7% will, however, be located adjacent to either a shopping centre, main street or shopping/business precinct.
Just 21.1% will be adjacent to public transport; 68.4% are located within 400m of either a bus stop or train station. Most (78.9%) will have adjacent car parking.
Just 10.5% would be located near Council’s administrative precinct. However, there appears to be a trend to locate libraries with or near other Council infrastructure. Almost one-half (42.1%) would be located within or adjacent to other cultural facilities, and 57.9% would be within or adjacent to cultural or recreational facilities.

- 142 -
Table 7.10: Locational characteristics of new buildings planned
Location Within
building Adjacent Within 400m
Not applicable
Branch did not
complete the
question Total
Shopping centre
0 (0.0%)
5 (26.3%)
6 (31.6%)
5 (26.3%)
3 (15.8%)
19 100%)
Shopping business/ precinct
0 (0.0%)
7 (36.8%)
7 (36.8%)
2 (10.5%)
3 (15.8%)
19 100%)
Main street 0 (0.0%)
8 (42.1%)
6 (31.6%)
2 (10.5%)
3 (15.8%)
19 100%)
Council administration precinct
2 (10.5%)
0 (0.0%)
2 (10.5%)
10 (52.6%)
5 (26.3%)
19 100%)
School 0 (0.0%)
4 (21.1%)
6 (31.6%)
4 (21.1%)
5 (26.3%)
19 100%)
Cultural facilities
5 (26.3%)
3 (15.8%)
2 (10.5%)
5 (26.3%)
4 (21.1%)
19 100%)
Eating facilities
2 (10.5%)
3 (15.8%)
8 (42.1%)
1 (5.3%)
5 (26.3%)
19 100%)
Recreation/ sporting facility
0 (0.0%)
5 (26.3%)
5 (26.3%)
3 (15.8%)
6 (31.6%)
19 100%)
Parks and gardens
0 (0.0%)
3 (15.8%)
8 (42.1%)
4 (21.1%)
4 (21.1%)
19 100%)
Bus stop 0 (0.0%)
4 (21.1%)
9 (47.4%)
2 (10.5%)
4 (21.1%)
19 100%)
Train station 0 (0.0%)
0 (0.0%)
4 (21.1%)
8 (42.1%)
7 (36.8%)
19 100%)
Car parking 0 (0.0%)
15 (78.9%)
1 (5.3%)
1 (5.3%)
2 (10.5%)
19 100%)

- 143 -
8. LIBRARY SERVICE AUDITS
8.1 Introduction One of the key outcomes of the audit is individual library service audit reports for each Local Government Authority in Victoria. A number of general observations have been made from the preparation of these reports. It is stressed that the conclusions drawn below are observations and have not been statistically tested against the audit database. In preparing the individual LGA reports: Value judgements have been avoided. Findings have only been reported
in relation to Victorian averages. Value judgements do, however, arise in determining what is ‘significantly’ high or just ‘high’, for instance. Consistency in relation to the use of these terms has been achieved through the use of a quality control process.
When interpreting the ratings of individual branches in the reports, it is important to note the ratings were prepared internally by branch librarians and represent subjective opinion only. These opinions may or may not reflect the views of the library service manager who has responsibility for management of the building and strategic decisions about its future.
Reference to Victorian and, in some cases, library service comparisons have been included where they have been felt to be relevant. Such comparisons have not been used when assessing survey respondent ratings of building quality, because of its complexity and the possible misleading interpretation arising (for instance, 66% of all libraries in an LGA being excellent compared to only 33% of those in the State (66% representing two out of three libraries)). Reference to the graphs presented in the reports is considered to provide a much clearer representation of the position of a library vis-a-vis other LGAs in the State.
We feel it is not possible to draw from the analysis any LGA-specific recommendations (such as ‘X library needs rationalisation’) due to all the unknown local factors which may impinge on this type of decision.
A number of issues have arisen with the data, as noted: The proportion of ‘non-resident membership’ in an LGA has been
reversed in some cases (where the level was extremely high, e.g. over 90%) as we have assumed this was done in error.
The ‘functional areas’ GFA data (i.e. collection areas, reading and study areas, etc.) appears in a number of cases to have been entered in error, as the sum of all functional areas exceeds the total GFA of the branch. It is likely that such errors have arisen due to manual room measurement and approximations being made. It is also acknowledged that there may be some crossover of area usage, and total GFA excluded stairs, lifts, etc. This has been noted in the analysis.
Limited use has been made of the capital expenditure data because the data supplied in the audit is often incomplete and it also varies significantly year by year.

- 144 -
Note that where the analysis refers to the ‘Victorian average’ or ‘State average’, this only represents the average of responding Victorian LGAs. While all but four LGAs completed the audit, the response rate to individual questions varies notably.
The service-based benchmarks have been compiled based on a Relative Area Factor (RAF) of 200%, to be in line with People places methodology. However, as discussed in Section 9, the actual core areas of libraries in Victoria exceed the 200% benchmark established by People places.
8.2 Observations The following observations have been made from the individual LGA library service audit reports: The surveys were nearly always well filled out by those LGAs that
responded. With rare exception, there is substantial ongoing effort and expenditure
being put into maintenance and upgrading of the standard provision of libraries to communities.
Newer libraries are better planned in terms of accessibility of location and functional space.
Older libraries, particularly those built pre-1940, are least likely to comply with codes and regulations, and the newest libraries are most likely to comply with codes and regulations.
It appears that compliance with codes and regulations is generally higher among those LGAs with relatively high maintenance expenditure.
There is vast variation in the proportional space allocation of functional areas, even in newer libraries.
Some of the older (and particularly smaller) libraries have virtually all of their space dedicated to collection areas.
Many older libraries have low proportions of floorspace for staff areas compared to the Victorian average, and some have none.
There is a tendency to much larger libraries, generally over 1,000 sq m, and up to 3,500 sq m, in newer areas.
There are very high numbers of smaller libraries still serving rural areas. Existing and planned investment in library infrastructure, and in many
cases maintenance, is often lower than average in the rural areas. Some of the older libraries (even those built in the 1980s) are incurring
high maintenance costs. There is vast variation in the cost of utilities to libraries. Many libraries
have not undertaken energy audits. There are quite a large number of libraries where compliance with fire
rating, disability and OH&S is not known or not achieved. The purpose of the BCA audit does not always appear to be understood.
Wheelchair accessibility in all respects is generally the exception rather than the rule. Wheelchair accessibility (particularly wheelchair accessible toilets and adequate aisle widths between shelving) is less compliant in older libraries. There is often no one library branch that is wheelchair accessible in all respects.

- 145 -
Libraries in traditional main street foci often have inadequate parking, and good accessibility to community foci and facilities could be considered a trade-off against inadequate parking.
There is an increasing trend in metropolitan areas towards privately owned libraries, especially collocation with private businesses, e.g. shopping centres.
Libraries collocating with schools appear to be less accessible to traditional foci such as main streets and shopping precincts.
Collocation of newer libraries is very common; it tends to be the original library buildings that are freestanding, however, these are often in Council administration precincts.
Collocated libraries appear more likely to have access to community meeting space.
A detailed data set has been made available to each LGA, from which further detailed analysis can be undertaken.

- 146 -
9. BENCHMARKING LIBRARY SERVICE PROVISION
9.1 Overview This section develops a benchmark of library provision for Victoria. It overviews the limitations of the audit methodology in this regard; applies both service-based and population-based benchmarks, overall and by library service/LGA; and suggests a planning benchmark for Victoria.
9.2 People places benchmarks People places details two methodologies for determining the need for and resultant size of a new or expanded library building: a service-based benchmark; and a population-based benchmark.
The report suggests that both measures should be used to provide a range of upper and lower gross floor area sizes. Such a range provides flexibility in meeting local needs. The service-based benchmark is based on the space required to house the branches’ collection, i.e. books, journals, electronic resources, etc., and the space needed to provide the range of services which it incorporates, i.e. reading areas. Service requirements are translated into a floor area for each functional area and used cumulatively to determine the total GFA required. The measure developed by People places is derived from their research into the relative areas within existing public libraries. The population-based benchmark is based on meeting the requirements of the number of people who have access to a library service. The benchmark was derived from the standards set out in The planning and design of public library buildings (State Library of New South Wales 1995).
9.3 Testing People places functional area size guide It was noted above that People places identified six broad types of core functional areas in public libraries. The relative area dedicated to each of these core functional areas is integral to determining the required size of a library based on the service-based benchmark approach. This process derives from a simple concept – that library space needs are based on a level of service provision requiring a range of materials and functional areas necessary to serve the community adequately; and that each space has an identifiable spatial requirement and, to a large extent, all of the services are interrelated. The range of functional areas within Victorian libraries are discussed in Section 3.3.4. People places subsequently provides a functional area comparison table which can act as a size guide for public libraries to determine the relative allocation of floorspace between the core functional areas. This is referred to in People places as the Relative Area Factor (RAF). It might be noted that floorspace provision of the above specialist service areas was not collected in the audit due to the practical difficulties faced by branches in measuring numerous small areas, and hence the analysis applies only to the six core functional areas (ore the ‘Core Relative Area Factor’ in determining library size, as identified in People places).

- 147 -
The floorspace areas derived from the audit have been tabulated and the proportional allocation of these compared with those in People places is provided in Table 9.1. The allocations in People places were derived from research carried out into the relative areas of existing public libraries in New South Wales. They are based on the overall size of the collection area as the base, which has a direct impact on the space required for the other library services.
Table 9.1: Comparison of core functional areas
Functional area People places
guide
Average floorspace by
functional area –Victorian public
libraries
Current proportional distribution –
Victorian public libraries
Collection areas Base Area 100% 239 sq m 100%
Reading and study areas 30% 103 sq m 43%
Resource areas 15% 56 sq m 23%
Staff areas 35% 84 sq m 35%
Amenities 20% 86 sq m 36%
Total (Core Relative Area Factor)
200% 568 sq m 237%
The most significant observation arising from the table is that other functional areas are over-represented relative to the area of collection areas (or conversely, it could be said that collection areas are under-represented relative to other types of functional areas). This over-representation occurs in all areas other than staff areas, which sit at the recommended 35% of the collection areas space. Reading and study areas have 43% of the recommended space compared to 30% in People places. Resource areas have 23% compared to a recommended 15%, and amenities have 36% compared to a recommended 20%. Accordingly, an issue for further consideration is whether collection areas are under-represented in Victoria, or whether the other functional areas are relatively over-represented. The average functional spaces in the above table suggest that Victorian public libraries conform to the trend outlined by Bundy (2006) (and discussed in Section 3.3), whereby libraries reverse the desired floorspace allocation ratio due to lack of space. Bundy noted that library users, like shoppers, need 60% of the library’s floorspace to browse comfortably, leaving 40% of space for shelving and other fittings. The People places standards operate on a 50% split. The space standard on which the People places benchmark is based is referred to as the Target Collection Factor (TCF). The TCF for Victoria is calculated in Table 9.2.

- 148 -
Table 9.2: Victorian Target Collection Factor (TCF)
Space
standard
Number of items in Victoria
% on loan
Items on shelf
Size (sq m) indicated by
standard
Books on shelves (number of volumes)
100 books per sq m 7,451,709 24.25% 5,644,670 56,447
‘Other’ Items (e.g. local history, reference books)
100 books per sq m
428,769 24.25% 324,793 3,248
Periodicals (number of titles)*
10 titles per sq m 122,225 0.0% 122,225 12,223
Non-print material (tapes, CDs, videos, DVDs, etc.)
100 recordings per sq m
675,134 46.36% 362,142 3,621
Virtual and digital resources (number of public terminals)
1 terminal to 5 sq m 2,694 0.0% 2,694 13,470
Total Target Collection Factor (TCF) 89,009
* Nine library services provided incomplete data
The Audit identifies the total collection floorspace which exists in libraries in Victoria equals 53,999 sq m. It is noted that this is drawn from the 39 LGAs which responded, and that the TCF for these 39 LGAs is 74,651. The size of collection areas in Victoria is substantially smaller (72.3%) than what is provided for by the space standard for collections in People places. People places is designed for new libraries, which have more open designs, and a vertically reduced number of shelving bays. In calculating TCF, People places assumes a set of shelf and aisle dimensions which provides for approximately 100 volumes per sq m of floor area7. Many existing libraries will not satisfy this standard. It is noted that the reduction of bays from five to four in height reduces potential storage space by 20%, which accounts for most of the discrepancy between the Victorian provision and the standard.
7 The space allocation for the materials collection is based on: Shelving an average of
30 volumes per shelf with a standard shelf 900 mm long; Bays of shelving spaced at 1,500 mm clear width between aisles; Bays four shelves high and ranging to six shelves long, i.e. 5,400 mm. This configuration gives a module of 14.49 sq m containing on average 1,440 volumes which equates to approximately 100 volumes per square metre of floor area. (Library Council of New South Wales 2005:65)

- 149 -
Further, it is noted that the amount of resources on loan in Victoria is lower than the rate assumed by People places. People places identifies an average of 30–35% of a collection will be on loan at any one time. The Audit identifies a rate for print resources of approximately 25%. The Strategic Asset Audit of Victorian Public Libraries (J.L. Management Services 2006) identified that the Victorian mean was 23.7%. Application of the People places loan rates to the Victorian situation would reduce the TCF to 67,260.
9.4 Testing People places space standards The People places service-based benchmark has been applied to each library service in Victoria (assuming an RAF of 200%, rather than the actual RAF rate identified above) (Table 9.3).
Table 9.3: Relationship between floorspace provision and benchmarks – library services
Service-based benchmark
Population-based benchmark
Difference (sq m) LGAs % LGAs %
-5,001> 4 9.1% 5 11.4%
-2,001 – -5,000 2 4.5% 11 25.0%
-1,001 – -2,000 8 18.2% 11 25.0%
-501 – -1,000 3 6.8% 4 9.1%
-101 – -500 4 9.1% 4 9.1%
-1 – -100 0 0.0% 0 0.0%
Equal 0 0.0% 0 0.0%
1–100 3 6.8% 0 0.0%
101–500 2 4.5% 6 13.6%
501–1,000 2 4.5% 0 0.0%
1,001–2,000 8 18.2% 1 2.3%
2,001–5,000 5 11.4% 0 0.0%
5,001> 1 2.3% 0 0.0%
Not available 2 4.5% 2 4.5%
Total 44 100% 44 100%
People places assumes that all adequately sized libraries should fall between the range provided by the service- and population-based benchmarks, i.e. all libraries should have a GFA lower than the population-based benchmark. This is generally the case, however, seven LGAs have a floorspace provision greater than the population benchmark suggests is required (i.e. they are relatively oversupplied). The provision in some LGAs is, however, significantly lower than the population benchmark.

- 150 -
In turn, the service-based benchmark can be regarded as a minimum recommended level of adequate provision. The proportion of LGAs meeting or falling short of the service-based benchmark is evenly split (both are 47.7%). It is of concern that nearly half of LGAs do not meet the People places minimum standard of provision. Information on which to compile a service-based benchmark for Victorian LGAs is not available. Alternatively, a comparison of the ratio of floorspace to population (sq m per 1,000 people) has been calculated as a further measure to gauge the extent of any shortfall of LGA floorspace. A generally accepted town planning benchmark recommends that between 28 to 43 sq m of public floorspace should be provided per 1,000 people (with a minimum amount required per building). This is referred to as the Building Area Factor (BAF) in People places. One branch library is generally planned for every 15,000 to 30,000 people. People places rates range between 28 and 42 sq m per 1,000 people, depending on the population size served: Less than 20,000 – provide 42 sq m per 1,000 population. Between 20,001–35,000 – provide 39 sq m per 1,000 population. Between 35,001–65,000 – provide 35 sq m per 1,000 population. Between 65,001–100,000 – provide 31 sq m per 1,000 population. More than 100,000 – provide 28 sq m per 1,000 population.
For comparative purposes, Queensland uses the following rates: Up to 15,000 – between 43–41 sq m per 1,000 population. 15,000–50,000 – between 41–37 sq m per 1,000 population. More than 50,000 – between 37–35 sq m per 1,000 population.
The Audit has identified that the current provision of floorspace in Victoria is 28 sq m per 1,000 people. This equates to the minimum in People places, but is less than the town planning standard. If it was assumed all LGAs exactly met their populations needs, in line with the People places BAF amounts, the average rate of floorspace provision in Victoria would be 30 sq m per 1,000 people. It is also noted that this is the status now, but does not account for ongoing population growth. Section 7.5.1 of this report identified plans for an additional 37,363 sq m of floorspace throughout Victoria. Incorporation of this additional floorspace increases the average rate of provision of floorspace in Victoria to 36 sq m per 1,000 people8. This is an encouraging sign of investment. Most LGAs (58.5%) and branches (59.1%) match or exceed the current average rate of provision in Victoria. The average rate of provision among LGAs is 35 sq m and the median value is 30 sq m per 1,000 people; 56.8% of LGAs currently provide 35 or more sq m per 1,000 of population. Further analysis reveals a somewhat more complex arrangement of library service provision. At the library service level, it is noted that while the rate of provision may in some cases appear adequate compared to the Victorian average, the level of supply at the service’s primary LGA may not be.
8 Note: some of this additional floorspace involves replacement of existing building stock, so
the figure should be regarded as an estimate only.

- 151 -
As identified in Table 9.4, the rate of floorspace provision is broadly affected by the size of the resident population. Some small LGAs have a very high rate of provision. A number of regional population centres have a lower rate of floorspace provision than would be expected, given the regional demands their services may face.
Table 9.4: Testing the People places Building Area Factor
LGA population <10,000 <20,000
20,001–35,000
35,001–65,000
65,001–100,000 100,000>
Median of LGAs 46 sq m 43 sq m 44 sq m 29 sq m 36 sq m 25 sq m
Average of LGAs 48 sq m 43 sq m 40 sq m 29 sq m 38 sq m 25 sq m
Sq m per 1,000 people
44 sq m 39 sq m 39 sq m 29 sq m 35 sq m 25 sq m
People places guide
42 sq m 42 sq m 39 sq m 35 sq m 31 sq m 28 sq m
Proportion of LGAs in State of this size
13.5% 29.7% 13.5% 12.2% 14.9% 29.7%
Proportion of LGAs not meeting BAF
20.0% 36.4% 40.0% 77.8% 27.3% 68.2%
Data within the above table reflects the general approach of the benchmarks cited, whereby the standard of provision reflects the population size served. It can be concluded that: Provision in small LGAs (<10,000 population) and LGAs between 65,000–
100,000 people exceeds the benchmark. Provision in LGAs between 20,001–35,000 people matches the
benchmark. All other LGA sizes fall short of the benchmark.

- 152 -
10. CONCLUSION
10.1 A planning benchmark for Victoria A range of planning benchmarks have been discussed and applied in the previous section. While notable variation within the State makes it difficult to generalise, in comparison to these planning benchmarks it is clear that the current level of floorspace provision in Victoria is less than adequate. Nearly half of library services do not meet the People places minimum standard of provision. Overall, the current provision of floorspace in Victoria is 28 sq m per 1,000 people, which is less than minimum required which has been estimated to currently be 30 sq m per 1,000 people. The Audit has broadly confirmed the accuracy of the planning benchmarks utilised by People places and has not revealed any information which suggests they should be altered. A number of discrepancies do exist, and have been noted in the analysis. We have, however, paid less attention to service-based and population-based benchmarks outlined in People places in recommending a State benchmark, as the testing undertaken above suggests they are more appropriate for assessing and designing new buildings, rather than retrospectively assessing existing buildings. For example, a number of the design standards upon which the service-based benchmark is predicated are not appropriate when applied to a building designed 20 years previously.
10.2 Recommended strategies We recommend instead that planning standards based upon the Building Area Factor in People places be relied upon. It is recommended that these be adopted for use in Victoria, namely: Less than 20,000 – provide 42 sq m per 1,000 population. Between 20,001–35,000 – provide 39 sq m per 1,000 population. Between 35,001–65,000 – provide 35 sq m per 1,000 population. Between 65,001–100,000 – provide 31 sq m per 1,000 population. More than 100,000 – provide 28 sq m per 1,000 population.
We also recommend that a State benchmark of 30 sq m per 1,000 population be adopted as a target. It may also prove appropriate to develop a rural and a metropolitan benchmark, and it is further suggested that consideration be given to this at a later date. These standards should form the starting point for determining what need might be present in a community. They must be informed by other factors about local need. Strategies for improving provision in Victoria should initially aim for parity with the current State average of 28 sq m per 1,000 population in those LGAs which fall short of this target. We regard this as an equitable approach. This will involve the provision of an additional 19,039 sq m of gross floorspace.

- 153 -
In the longer term, strategies should seek to achieve a target of 30 sq m per 1,000 population, and meeting the People places BAF as relevant to an LGAs population size. This will involve the provision of an additional 24,184 sq m of gross floorspace (or 5,145 sq m more than the initial target). These figures do not include an allowance for projected population growth. The Audit results also point to a need for a range of capacity building activities to be undertaken. Topics identified by the audit include education on: Internal library planning, e.g. internal layout and design and functional
space allocation. We suggest this involve activities which propagate the concepts established within People places.
The purpose of the Building Code of Australia and other applicable building codes and regulations. Priority attention should be given to improving disability access compliance, given the critical role of libraries in community building and fostering social inclusion. An early target is for each LGA to have one branch which is fully accessible in all respects. This is not currently the case in a number of LGAs.
The value in energy audits, their process, and the savings which can be achieved in utility costs.
Further detailed guidance could be provided to library services either through documentation or seminars. Documentation developed need not be a formal report, but rather be in the form of a circular or an article in a magazine should be considered. The move towards the concept of libraries as and within community hubs and learning centres should be further promoted and facilitated. A useful starting point would be to undertake a more detailed review of existing collocated libraries which act as hubs, to identify their advantages and disadvantages, any barriers to their development, implementation and management, and seek successful ways to promote their implementation. This would examine not just how hubs can be achieved in new libraries, but more importantly given the sectors funding constraints, how existing infrastructure can be adapted to the task. Initial guidance may be found in some of the case studies contained in of this report. It is further recommended that, at a State level, this audit be undertaken every two years in order to monitor progress and change in Victoria’s library building stock. Internal updates of the individual LGA audit reports should be prepared by each library service on an annual basis.

- 154 -
REFERENCES
ABS (Australian Bureau of Statistics) (2005), Public Libraries 2003–2004, Cat. No. 8561.0, Australian Bureau of Statistics, Canberra. Retrieved 14 July 2008 from www.ausstats.abs.gov.au/Ausstats/subscriber.nsf/ 0/DD3BEA2E4FA5DA11CA256FF100787DE0/$File/85610_2003-04.pdf Audit Commission (United Kingdom) (2002), AC Knowledge – Learning from Audit, Inspection and Research: Building Better Library Services, Audit Commission, London. Retrieved 14 October 2008 from www.audit-commission.gov.uk/reports/NATIONAL-REPORT.asp?CategoryID =&ProdID=9D0A0DD1-3BF9-4c52-9112-67D520E7C0AB Australian Library and Information Association (2002), Statement on joint-use libraries, Australian Library and Information Association, Canberra. Retrieved 24 July 2008 from alia.org.au/policies/joint-use.html BBC Consulting Planners (2007), New South Wales Audit of Public Library Buildings, Public Libraries, Public Libraries New South Wales – Country, State Library of New South Wales, Sydney. Bryson, J, Usherwood, B, and Proctor, R (2003), Libraries Must Also Be Buildings? New Library Impact Study, Centre for Public Libraries and Information in Society and Department of Information Studies, University of Sheffield, for re:source: The Council for Museums, Archives and Libraries, United Kingdom. Retrieved 7 October 2008 from www.sheffield.ac.uk/is/ research/centres/cplis/research/index.html Bundy, A (2003), Best investment: The modern public library as social capital, paper presented at the AGM of Friends of Libraries Australia (FOLA) Altona, Victoria, 27 August 2003. Retrieved 15 July 2008 from www.library.unisa.edu.au/about/papers/best-investment.pdf Bundy, A (2003b), Joint-use libraries – the ultimate form of cooperation, chapter contributed to ‘Planning the modern public library building’, edited by Gerard McCabe and James Kennedy and published by Libraries Unlimited, Connecticut, USA. Retrieved 24 July 2008 from www.library.unisa.edu.au/about/papers/jointuse.pdf Bundy, A (2004), Places of connection: New public and academic library buildings in Australia and New Zealand, paper for Libraries Building Conference Bournemouth UK 5–6 February 2004, University of South Australia. Retrieved 14 July 2008 from www.library.unisa.edu.au/about/papers/Places-of-connection.pdf Bundy, A (2006), A place with space: How does your library rate?, presentation to a forum of South Australian Friends of Libraries, State Library of South Australia, 6 April 2006. Retrieved 14 July 2008 from www.fola.org.au/pdfs/placewithspace.pdf Bundy, A (2006b), Public libraries: Unique, ubiquitous, undersold, underfunded, presentation to the fifth Annual Community Advisory Committee and Friends of the Library forum, West Gippsland Regional Library Corporation, Drouin, Victoria, 9 May 2006. Retrieved 15 July 2008 from www.fola.org.au/pdfs/uuuu.pdf

- 155 -
CABE (Commission for Architecture and the Built Environment) & Resource: The Council for Museums, Archives and Libraries (2003), Better Public Libraries, The Council for Museums, Archives and Libraries, United Kingdom. Retrieved 14 July 2008 from www.cabe.org.uk/default.aspx?contentitemid=527 Cox, E (2000), A safe place to go: Libraries and Social Capital, University of Technology Sydney for the Public Libraries Branch of the State Library of New South Wales, State Library of New South Wales, Sydney. Retrieved 14 July 2008 from www.sl.nsw.gov.au/services/public_libraries/docs/safe_place.pdf Department for Culture, Media and Sport (2003), Framework for the Future: Libraries, Learning and Information in the Next Decade, Department for Culture, Media and Sport, United Kingdom. Retrieved 14 July 2008 from www.culture.gov.uk/reference_library/publications/4505.aspx Department of Planning and Community Development (2008), Living Libraries Program 2008, Department of Planning and Community Development, Melbourne. Retrieved 14 July 2008 from www.grants.dvc.vic.gov.au/Web18/rwpgslib.nsf/GraphicFiles/ProgramGuidelines_LivingLibraries2008.pdf/$file/ProgramGuidelines_LivingLibraries2008.pdf dmA Planning and Management Services and Southern Ontario Library Service (2007), The Library’s Contribution to Your Community: a Resource Manual, Southern Ontario Library Service, Canada. J.L. Management Services (2006), Strategic Asset Audit of Victorian Public Libraries, Library Board of Victoria, Melbourne. Retrieved 15 July 2008 from www.slv.vic.gov.au/pdfs/aboutus/publications/strategic_audit_report.pdf Johnstone, L (1999), ‘Public libraries and shopping centres’, Australasian Public Libraries and Information Services, Vol 12 No 1, March 1999, Auslib Press, South Australia. Retrieved 17 October 2008 from search.informit.com.au/fullText;dn=984888054732316;res=IELHSS Jones, D (1997), ‘Time capsules or time machines? Challenges for public library buildings’, The Australian Library Journal, Volume 46, Issue 4, November 1997, Australian Library and Information Association, Canberra. Jones, D (2001), ‘People Places: Public library buildings for the new millennium’, Australasian Public Libraries and Information Services, Vol 14 No 3, September 2001, Auslib Press, South Australia. Jones, D (2003), ‘Is your building future-proof?’, inCITE, October 2003, Australian Library and Information Association, Canberra. Retrieved 15 October 2008 from alia.org.au/publishing/incite/2003/10/future-proof.html Jones, D (2004), ‘Critical issues in public library planning: the New South Wales experience’, The Australian Library Journal, Volume 53, Issue 4, November 2004, Australian Library and Information Association, Canberra. Retrieved 14 July 2008 from www.alia.org.au/publishing/alj/53.4/full.text/jones.html Library Board of Victoria (2005), Libraries Building Communities: Executive Summary, Library Board of Victoria, Melbourne. Retrieved 14 July 2008 from www.slv.vic.gov.au/pdfs/aboutus/publications/lbc_execsumm.pdf

- 156 -
Library Board of Victoria (2005), Libraries Building Communities: Report 1: Setting the Scene, Library Board of Victoria, Melbourne. Retrieved 14 July 2008 from www.slv.vic.gov.au/pdfs/aboutus/publications/lbc_report1.pdf Library Board of Victoria (2005), Libraries Building Communities: Report 2: Logging the Benefits, Library Board of Victoria, Melbourne. Retrieved 14 July 2008 from www.slv.vic.gov.au/pdfs/aboutus/publications/lbc_report2.pdf Library Board of Victoria (2005), Libraries Building Communities: Report 3: Bridging the Gaps, Library Board of Victoria, Melbourne. Retrieved 14 July 2008 from www.slv.vic.gov.au/pdfs/aboutus/publications/lbc_report3.pdf. Library Board of Victoria (2005), Libraries Building Communities: Report 4: Showcasing the Best, Library Board of Victoria, Melbourne. Retrieved 14 July 2008 from www.slv.vic.gov.au/pdfs/aboutus/publications/lbc_report4.pdf. Library Board of Victoria (2006), Libraries Building Communities: Library User Census and Survey Project 2006, Report 1: Statewide Analysis and Comparisons, Library Board of Victoria, Melbourne. Retrieved 14 July 2008 from www.slv.vic.gov.au/pdfs/aboutus/publications/lbcreport1_2006.pdf Library Board of Victoria (2006), Libraries Building Communities: Library User Census and Survey Project 2006, Report 2: Library Services Data and Reports, Library Board of Victoria, Melbourne. Library Board of Victoria and Victorian Public Library Network (2006), Framework for Collaborative Action, Revised April 2006, Library Board of Victoria, Melbourne. Library Council of New South Wales (2000), People places: A guide for public library buildings in New South Wales, Library Council of New South Wales, Sydney. Library Council of New South Wales (2005), People places: A guide for public library buildings in New South Wales, 2nd edition, Library Council of New South Wales, Sydney. Retrieved 14 July 2008 from www.sl.nsw.gov.au/services/public_libraries/library_mgt/lib_management_docs/peopleplaces_2ndedition.pdf McCallum I. and Quinn S. (2001), APLN: The will - or the last testament?, Final report to the Council of Australian State Libraries, Libraries Alive! Pty Ltd. Retrieved 14 July 2008 from www.pla.org.au/documents/minutes/R7nov01.pdf NSLA (National and State Libraries Australasia) (2007), Annual Public Libraries Statistical Report 2006–2007, NSLA, Queensland. Retrieved 14 July 2008 from www.nsla.org.au/publications/statistics/2006/pdf/NSLA. Statistics-20061102-Australian.Public.Library.Statistics.Report.2005. 2006.pdf Standards Australia (2003), AS 1428 Design for access and mobility, Standards Australia. Retrieved 7 October 2008 from www.saiglobal.com/shop/Script/Details.asp?DocN=AS186293820419 State Library of New South Wales (1995), The planning and design of public library buildings, Revised edition, State Library of New South Wales, Sydney. Worpole, K (2005), 21st Century Libraries: Changing Forms, Changing Futures, Building Futures, United Kingdom. Retrieved 14 July 2008 from www.buildingfutures.org.uk/assets/downloads/pdffile_31.pdf

APPENDICES
Appendix 1: Survey tool
25 May 2007 1
SURVEY OF PUBLIC LIBRARY BUILDINGS IN VICTORIA
Name of Library Service Name of Local Government Authority Name of Library Branch
Question Response Explanatory Notes
I. Local Government Authority Information
Section I. of the survey is to be completed at the LOCAL GOVERNMENT LEVEL (not at the Branch level). Survey responses will then be aggregated (if necessary) in order to provide data at the Library Service level.
A. Assessment of Population Based Benchmark of Library Provision This section is to be completed once per Local Government Authority
1 How many people live in the Local Government Authority?
Data provided from DVC Annual Survey
The population is the total number of people living within the Local Government Area. The source is the DVC Annual Survey latest Estimate Resident Population (ERP).
2a What is the total library membership in the Local Government Authority?
____________________________
2b How many of these members live in the Local Government Authority?
____________________________ The number of library service members whose residential address is not within a Local Government Area covered by the Library Service.
3 If the number of ‘non-resident members’ is significant, please briefly state any reasons for this -
____________________________ Not considered significant
For example, proximity to shops, employment nodes, etc.
B. Assessment of Service Based Benchmark of Library Provision This section is to be completed once per Local Government Authority
4 Please give the total numbers for each of the following in your Library Service (over all branches) -
a Number of books on shelves Data provided from Collections audit b Number of periodicals (titles)
Data provided from Collections audit This is the number of titles only.
c Number of non-print items Data provided from Collections audit This includes for example tapes, CD’s, CD-Roms, DVD’s etc d Number of public computer terminals Data provided from Collections audit e Other (please specify _____________) Data provided from Collections audit
5a Please estimate the percentage (%) of books on loan at any
one time Data provided from Collections audit
5b Please estimate the percentage (%) of non-print materials on loan at any one time non-print materials
Data provided from Collections audit

25 May 2007 2
C. Audit of Administration Buildings This section is to be completed once per Local Government Authority 6a Within this Local Government Authority, is there any off-site
floor space in other buildings, used for library purposes?
Yes No
6b If yes, what is this space used for and what is its’ gross floor area?
Administration: Area (m²)________ Storage: Area (m²)___________ Other, please specify_______: Area (m²)_____
Gross floor area (GFA) is defined in Question 11.
6c Is each building leased or owned?
a. Administration
Leased (please specify who from: o Not leased o Council, o Crown Land, o Private Owner, o Other, please specify ______)
Owned (please specify who by: o Council, o Crown Land, o Private Owner, o Other, please specify ______)
b. Storage
Leased (please specify who from: o Not leased o Council, o Crown Land, o Private Owner, o Other, please specify ______)
Owned (please specify who by: o Council, o Crown Land, o Private Owner, o Other, please specify ______)
c. Other type of building, please specify _________________
Leased (please specify who from: o Not leased o Council, o Crown Land, o Private Owner, o Other, please specify ______)
Owned (please specify who by: o Council, o Crown Land, o Private Owner, o Other, please specify ______)

25 May 2007 3
D. Planning and Development This section is to be completed once per Local Government Authority
7a How many new buildings are planned in the Local Government Authority?
No new buildings planned One Two Three Four Five
Please respond for any new building. Refurbishments and extensions of existing buildings are dealt with in Section E of the Branch Survey. If your LGA is the main local government funding source of a new building, but it is not located in your LGA, please provide details in this section.
7 (i)b
For the FIRST building, when is it expected to be operational?
Less than two years Between two and four years More than four years time
7 (i)c
For the FIRST building, what is the proposed additional floor space?
__________________
7 (i)d
For the FIRST building, what is the likely budget (in $) for - (Please indicate to the nearest $100,000)
Capital building: $_______ Internal fit out (eg shelving etc): $_______ Total budget: $_______
This excludes budget for book stock and other resources.
7 (i)e
For the FIRST building, what is the type of facility planned?
Joint use (please specify other services ______)
Co-located (please specify other services ______)
Neither
Co-located libraries are defined as multiple services sharing a building, with separate areas for each service. These areas need not be physically separated by walls. Co-located libraries typically bring together other Council related services such as the Council Chambers/offices, community centres, arts centres, youth facilities and/or one stop shop services. More recently, co-located libraries have been developed with other government services such as community health centres, home and community care centres, employment services or community technology centres. Joint-use libraries are defined as libraries where two or more distinct library service providers serve their client group in the same building, the governance of which is co-operatively arranged between the separate authorities. For example, a joint use library may be developed between a Library Service and a School to operate a library serving both high school students and the broader community. The service is shared with pooled funding provided by both agencies to cover the capital and recurrent costs of the service.

25 May 2007 4
7 (i)f
For the FIRST building, what are the attributes of the planned location of the new building? (please tick all applicable)
Within
library building:
Adjacent to library building:
within 400m of:
a shopping centre
a shopping or business precinct
a main street a Council administration precinct
train station bus stop cultural facilities
car parking eating facilities
school recreation/ sporting facility
parks and gardens
Other (Pls specify _____
7 (i)g
For the FIRST building, in which suburb will the new library be built? (If the building will be at an existing site, please write both the suburb, and that it is an existing site.)
__________________
7 (ii)b
For the SECOND building, when is it expected to be operational?
Less than two years Between two and four years More than four years time
7 (ii)c
For the SECOND building, what is the proposed additional floor space?
__________________
7 (ii)d
For the SECOND building, what is the likely budget (in $) for - (Please indicate to the nearest $100,000)
Capital building: $_______ Internal fit out (eg shelving etc): $_______ Total budget: $_______

25 May 2007 5
7 (ii)e
For the SECOND building, what is the type of facility planned?
Joint use (please specify other services ______)
Co-located (please specify other services ______)
Neither
7 (ii)f
For the SECOND building, what are the attributes of the planned location of the new building? (please tick all applicable)
Within
library building:
Adjacent to library building:
within 400m of:
a shopping centre
a shopping or business precinct
a main street a Council administration precinct
train station bus stop cultural facilities
car parking eating facilities
school recreation/ sporting facility
parks and gardens
Other (Pls specify _____
7 (ii)g
For the SECOND building, in which suburb will the new library be built? (If the building will be at an existing site, please write both the suburb, and that it is an existing site.)
__________________
7 (iii)b
For the THIRD building, when is it expected to be operational?
Less than two years Between two and four years More than four years time
7 (iii)c
For the THIRD building, what is the proposed additional floor space?
__________________

25 May 2007 6
7 (iii)d
For the THIRD building, what is the likely budget (in $) for - (Please indicate to the nearest $100,000)
Capital building: $_______ Internal fit out (eg shelving etc): $_______ Total budget: $_______
7 (iii)e
For the THIRD building, what is the type of facility planned?
Joint use (please specify other services ______)
Co-located (please specify other services ______)
Neither
7 (iii)f
For the THIRD building, what are the attributes of the planned location of the new building? (please tick all applicable)
Within
library building:
Adjacent to library building:
within 400m of:
a shopping centre
a shopping or business precinct
a main street a Council administration precinct
train station bus stop cultural facilities
car parking eating facilities
school recreation/ sporting facility
parks and gardens
Other (Pls specify _____
7 (iii)g
For the THIRD building, in which suburb will the new library be built? (If the building will be at an existing site, please write both the suburb, and that it is an existing site.)
__________________
7 (iv)b
For the FORTH building, when is it expected to be operational?
Less than two years Between two and four years More than four years time
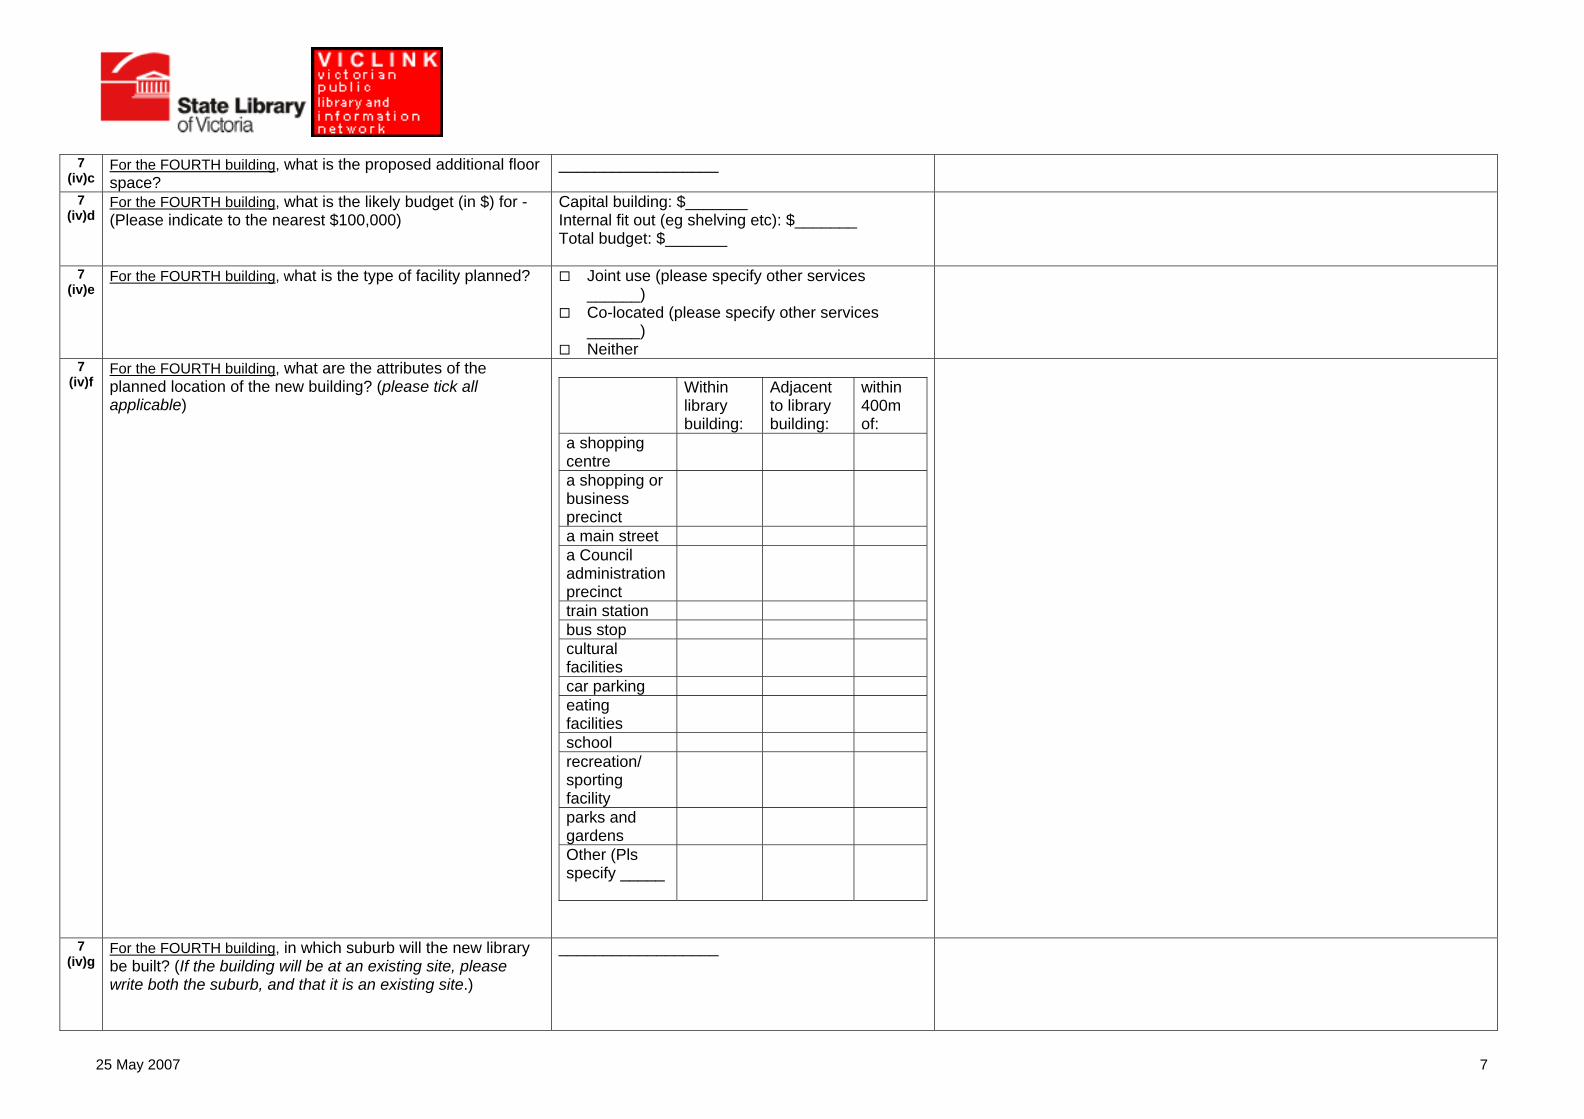
25 May 2007 7
7 (iv)c
For the FOURTH building, what is the proposed additional floor space?
__________________
7 (iv)d
For the FOURTH building, what is the likely budget (in $) for - (Please indicate to the nearest $100,000)
Capital building: $_______ Internal fit out (eg shelving etc): $_______ Total budget: $_______
7 (iv)e
For the FOURTH building, what is the type of facility planned?
Joint use (please specify other services ______)
Co-located (please specify other services ______)
Neither
7 (iv)f
For the FOURTH building, what are the attributes of the planned location of the new building? (please tick all applicable)
Within
library building:
Adjacent to library building:
within 400m of:
a shopping centre
a shopping or business precinct
a main street a Council administration precinct
train station bus stop cultural facilities
car parking eating facilities
school recreation/ sporting facility
parks and gardens
Other (Pls specify _____
7 (iv)g
For the FOURTH building, in which suburb will the new library be built? (If the building will be at an existing site, please write both the suburb, and that it is an existing site.)
__________________

25 May 2007 8
7 (v)b
For the FIFTH building, when is it expected to be operational?
Less than two years Between two and four years More than four years time
7 (v)c
For the FIFTH building, what is the proposed additional floor space?
__________________
7 (v)d
For the FIFTH building, what is the likely budget (in $) for - (Please indicate to the nearest $100,000)
Capital building: $_______ Internal fit out (eg shelving etc): $_______ Total budget: $_______
7 (v)e
For the FIFTH building, what is the type of facility planned?
Joint use (please specify other services ______)
Co-located (please specify other services ______)
Neither
7 (v)f
For the FIFTH building, what are the attributes of the planned location of the new building? (please tick all applicable)
Within
library building:
Adjacent to library building:
within 400m of:
a shopping centre
a shopping or business precinct
a main street a Council administration precinct
train station bus stop cultural facilities
car parking eating facilities
school recreation/ sporting facility
parks and gardens
Other (Pls specify _____

25 May 2007 9
7 (v)g
For the FIFTH building, in which suburb will the new library be built? (If the building will be at an existing site, please write both the suburb, and that it is an existing site.)
__________________
8 What was the total capital expenditure budget of the Local Government Area for the current (06/07) financial year and for the next three years? ($)
2006/07: $________________ 2007/08: $________________ 2008/09: $________________ 2009/10: $________________
This question is to be separately completed for each Local Government Area which comprise the Library Service Area.
Thank you for your co-operation

25 May 2007 10
SURVEY OF PUBLIC LIBRARY BUILDINGS IN VICTORIA
Name of Library Service Name of Local Government Authority Name of Library Branch
Question Response Explanatory Notes II. Building Audit This section is to be completed once per Branch Library building.
A. Floor Space and Function The questions in Part A are intended to obtain information on the floor space of the library premises and the various functions provided at the premises.
Questions one to eight are answered by the Library Service. The questions relating to your Branch building begin with question nine.
9 What are the average total operating hours per week of the Branch Library?
__________________ hours
10 On average, how many people visit the Branch library each week?
__________________ people
11 What is the gross floor area of the branch library premises? (m²)___________ gross floor area means the sum of the floor area of each storey of a building measured from the internal face of external walls, or from the internal face of walls separating the building from any other building, and includes: (a) the area of a mezzanine within the storey but EXCLUDES: (b) any area for common vertical circulation, such as lifts and stairs, and (c) vehicular access, loading areas, garbage and services, and (d) plant rooms, lift towers and other areas used exclusively for mechanical services or ducting, and (e) car parking (including access to that car parking), and (f) any space used for the loading or unloading of goods (including access to it), and (g) terraces and balconies, and (h) void spaces. It includes both public and staff spaces and for this survey excludes Library Service Level administration space (both on and off-site). If required, the conversion rate to use is: 1 square foot = 0.09290304 square meters.

25 May 2007 11
12 What is the gross floor area of the following main functions of the branch library (functional areas):
It is acknowledged that there may be some cross over of area usage. If possible, please allocate areas to their dominant use. Please be as accurate as possible. If there is no specific area, please indicate with a 0. The Gross floor area (question 11) does not have to total the areas specified in this question (as GFA includes stairs etc).
12a - collection areas (m²)___________ Collections area: books on shelves, periodicals, non-print materials, toy library, virtual and digital resources.
12b - reading and study areas (m²)___________ Reading and Study Areas: meeting areas, study areas, browsing and display and information areas/ exhibition space, young adult area, multi-purpose rooms (training, AV), children’s storytelling area, specialist genre collection area, specialist rooms (eg local and family history).
12c - resource areas (m²)___________ Resource Areas: Returns and enquiries desk, service desk, internet terminals, catalogues, printers, photocopiers, vending machines and telephones.
12d - staff areas (m²)___________ Staff areas: back of house (eg back workrooms, lunch rooms, offices), including staff work areas, office space and storage (for archival materials).
12e - amenities areas (m²)___________ Amenities areas: foyer, lobby, corridors/ circulation space, public and staff and accessible toilets, restrooms, plant equipment, storage (for maintenance equipment) and maintenance areas.
12f - other areas (please specify ___________) (m²)___________ Includes for example, bookshop, coffee shop, community services, bank services, Council customer service, etc
13a Over how many levels is the branch library constructed?
_______________ levels This includes both public and private space and excludes parking levels.
13b How many levels are publicly accessible? _______________ levels Note that this does not refer to Disabled access, which is dealt with in another question.
13c
Is at least part of the branch library located on the ground floor, with street frontage?
Yes No
13d
Does the building have lifts? No Yes, for patrons Yes, for goods Yes, for both patrons and goods
13e
If yes, do the lifts service all levels of the library? Yes No
14 Does the branch library provide floor area regularly used for the following services. Please also indicate if it is exclusive or shared floor space.
This question deals with shared USES of floor space. Shared USERS of floor space are dealt with in Questions 16 and 17.
14a - Children’s Storytelling Area No Yes, Exclusive Yes, Shared
14b - Young Adult Area No Yes, Exclusive Yes, Shared

25 May 2007 12
14c - Specialist genre collection area No Yes, Exclusive Yes, Shared
For example, a music collection, or a specific named collection.
14d - Specialist Room, Local and Family History No Yes, Exclusive Yes, Shared
14e - Multi-Purpose Room (eg Training, AV room, community meeting space)
No Yes, Exclusive Yes, Shared
14f - Bookshop, Coffee Shop, gift shop No Yes, Exclusive Yes, Shared
14g - Toy Library No Yes, Exclusive Yes, Shared
14h - Community Services, Bank Services, Council Customer Service
No Yes, Exclusive Yes, Shared
14i - Storage area for archival materials No Yes, Exclusive Yes, Shared
14j - Office space No Yes, Exclusive Yes, Shared
14k - Exhibition space No Yes, Exclusive Yes, Shared
14l - Mobile library services area No Yes, Exclusive Yes, Shared
This includes any internal office areas which are exclusively used for the mobile library services.
14m - Computer Lab/ Internet lounge or area No Yes, Exclusive Yes, Shared
14n - Wireless internet area No Yes, Exclusive Yes, Shared

25 May 2007 13
14o - Staff lunchroom No Yes, Exclusive Yes, Shared
14p - Other: Please specify _____________ No Yes, Exclusive Yes, Shared
14q - Other: Please specify _____________ No Yes, Exclusive Yes, Shared
15 Is it possible to divide (such as through wall partitions) multi-purpose areas (for example, to separate group study/meeting areas from the main library/quiet areas) within the branch library?
Yes No Don’t have any
16a Is the branch library co-located/ integrated with other facilities or services?
Yes No, the library is freestanding
Co-located libraries are defined as multiple services sharing a building, with separate areas for each service. These areas need not be physically separated by walls. Co-located libraries typically bring together other Council related services such as the Council Chambers/offices, community centres, arts centres, youth facilities and/or one stop shop services. More recently, co-located libraries have been developed with other government services such as community health centres, home and community care centres, employment services or community technology centres. Co-located services which are located in separate buildings or on separate adjacent sites are examined in question 35.
16b If yes, what other uses are in the same building? (please tick all applicable)
Private sector businesses (eg shops) Child care Community centre Youth centre Community health centre Council one stop shop services Other Local Government service (please
specify ___) Other State Government service (please specify
___) Other Federal Government service (please
specify ___) Other, please specify ________
16c If the branch library is co-located, what percentage of the overall complex do you estimate is dedicated to library functions?
_________ %

25 May 2007 14
17a Is the branch library either a joint-use library or a multi-use facility?
Yes No
Where the library has two or more distinct groups of users served by the one library Joint-use libraries are defined as libraries where two or more distinct library service providers serve their client group in the same building, the governance of which is co-operatively arranged between the separate authorities. For example, a joint use library may be developed between a Library Service and a School to operate a library serving both high school students and the broader community. The service is shared with pooled funding provided by both agencies to cover the capital and recurrent costs of the service.
17b If yes, what are the partner institutions or the other facilities? Please specify ________________________
18a Who OWNS the branch library building -
Council, Crown Land, Private Owner, Library Service Other, please specify ______)
Please provide information on both (i) who leases the building and (ii) who it is leased from. For example, a Regional Library Corporation may neither lease nor own the building in which the library operates, rather the building is owned by a Council.
18b Who is the branch library building LEASED by -
Not leased Council, Crown Land, Private Owner, Library Service Other, please specify ______)
If a more complicated leasing arrangement exists, please provide details (for example, a shopping centre owns the building, which is leased Council, which Council then leases to the library): _______________________________________
Please provide information on both (i) who leases the building and (ii) who it is leased from. For example, a Regional Library Corporation may neither lease nor own the building in which the library operates, rather the building is owned by a Council.
18c If the building is leased, what is the cost of the lease? Are outgoings included in this amount?
Cost of Lease: $ __________ Yes, Outgoings are included

25 May 2007 15
B. Design of the Building
The questions in Part B are intended to obtain information on the age and condition of the building within which the library is located as well as the extent to which the library premises complies with current building design principles.
19 When was the original building structure containing the branch library built?
pre 1900 1900-1919 1920-1939 1940-1959 1960-1979 1980-1989 1990-2000 post 2000
20 Is the building, or part of it, heritage listed? Yes No
21a Was the building purpose built to contain a library? Yes No
21b If not, when was the branch library established? Year:_____________
21c If not, what was the original purpose of the building? Please specify ___________________ Unknown
22a When was the last major refurbishment of the Branch Library building undertaken? What did it cost?
No refurbishment Refurbished, Year:_____________
Value ($): _____________ please indicate to the nearest $100,000
Major works is defined as change to internal partitions, changing room shapes and sizes, changes to entry and exits. Major works does not include only undertaking painting or replacement of carpet. If the building has received several minor works over the last 5 years, which if built together would constitute major works, please treat all works as the one refurbishment. Please indicate in the ‘year’ response column the number of years over which the works were undertaken.

25 May 2007 16
22b For that refurbishment, please identify what works were done (please tick all applicable)
Internal reorganisation of space Additional floor space Decreased floor space Internal structural alterations Improved collection areas (as defined in Q12) Improved reading and study areas (defined in
Q12) Improved resource areas (defined in Q12) Improved staff areas (defined in Q12) Improved amenities areas (defined in Q12) Improvements to other areas (defined in Q12.
eg cafes). Please specify _____________ Improved shelving Building services upgrade (eg lifts) Fire safety improvements Improved disabled access Energy consumption improvements Increased computer access Wireless internet Carpeting or other change to floor covering Painting Building materials - external cladding Heating Air conditioning Other, Please specify ______
Major works is defined as change to internal partitions, changing room shapes and sizes, changes to entry and exits. Major works does not include only undertaking painting or replacement of carpet. If the building has received several minor works over the last 5 years, which if built together would constitute major works, please treat all works as the one refurbishment. Please indicate in the ‘year’ response column the number of years over which the works were undertaken.
23 Has a building audit been undertaken of the branch library to identify compliance with the Building Code of Australia (BCA) in the last 5 years?
Yes (please specify what year _________) No
In answering this question, please liaise with Council’s Property Asset Manager or your Library Service Manager. This includes AS 1428.1, 1428.2, 1428.3 and 1428.4.
24 Does the branch library building comply with fire rating assessments?
Yes No Haven’t undertaken an assessment
In answering this question, please liaise with Council’s Property Asset Manager or your Library Service Manager.
25a Does the branch library comply with the Australian Standards - Design for Access and Mobility (AS1428) and the Building Code of Australia (BCA)?
Yes No No requirement to
In answering this question, please liaise with Council’s Property Asset Manager or your Library Service Manager.
25b Has an access audit been undertaken of the branch library building? If yes, when
Yes (please specify what year _________) No
In answering this question, please liaise with Council’s Property Asset Manager or your Library Service Manager.
25c Is the main entrance wheelchair accessible? Yes No
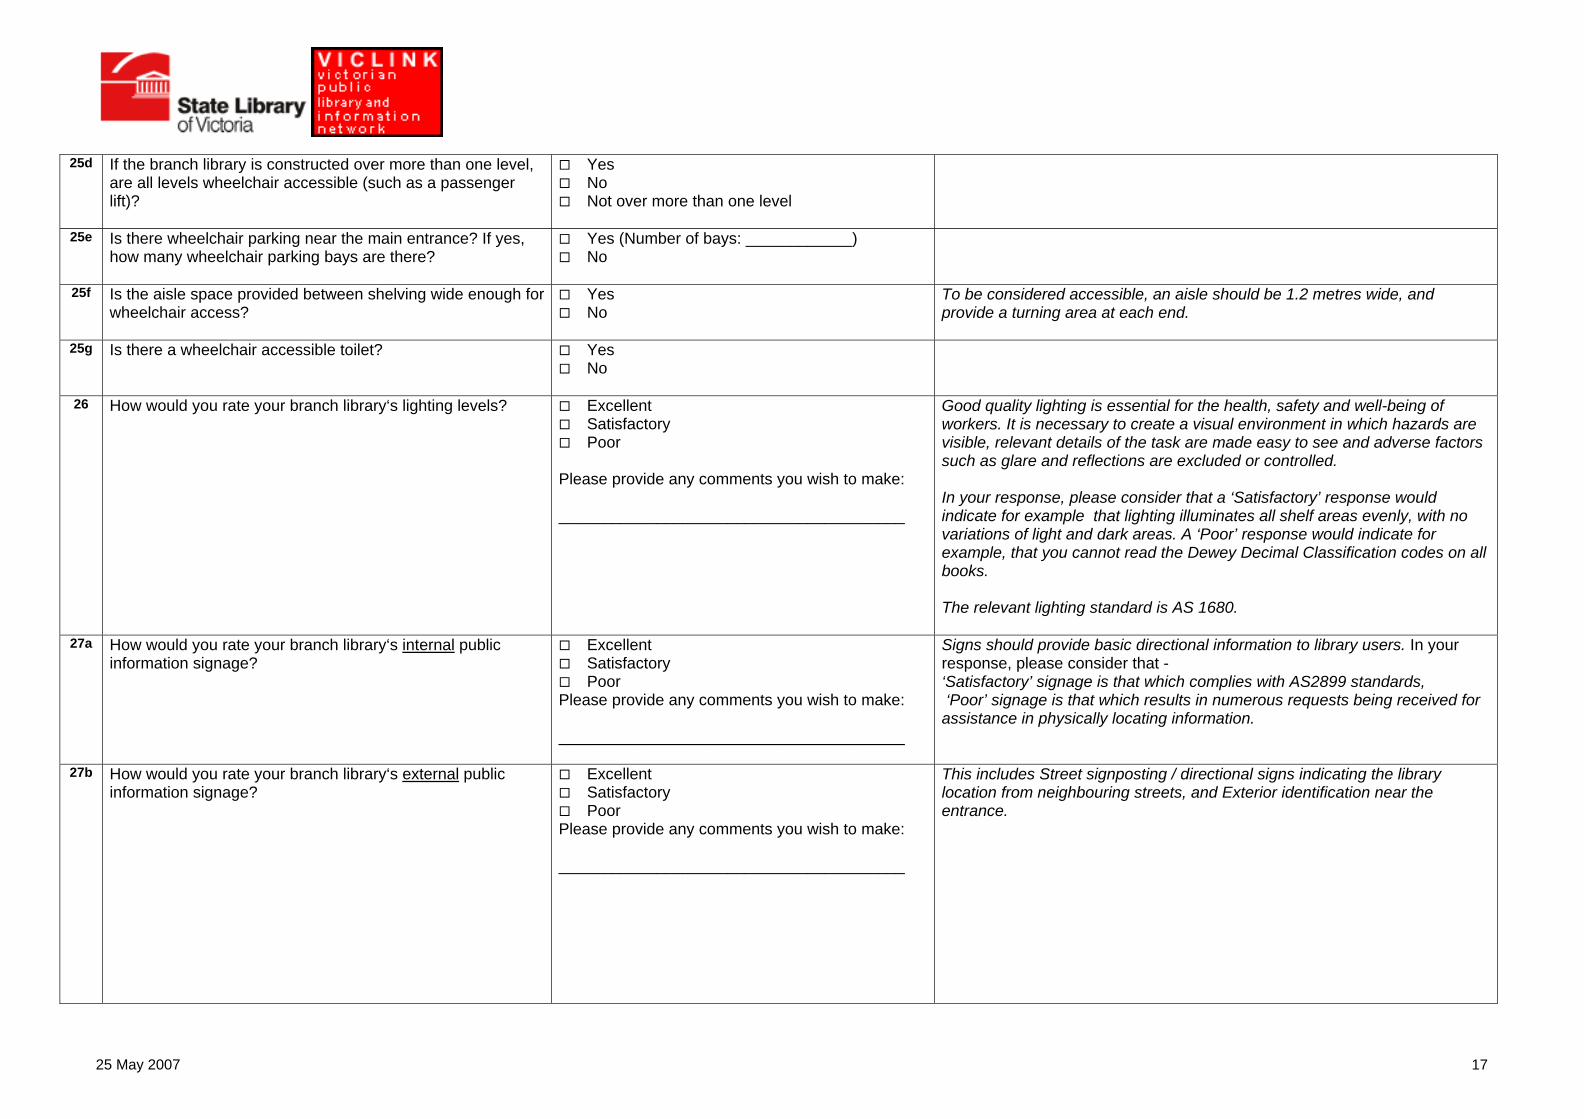
25 May 2007 17
25d If the branch library is constructed over more than one level, are all levels wheelchair accessible (such as a passenger lift)?
Yes No Not over more than one level
25e Is there wheelchair parking near the main entrance? If yes, how many wheelchair parking bays are there?
Yes (Number of bays: ____________) No
25f Is the aisle space provided between shelving wide enough for wheelchair access?
Yes No
To be considered accessible, an aisle should be 1.2 metres wide, and provide a turning area at each end.
25g Is there a wheelchair accessible toilet? Yes No
26 How would you rate your branch library‘s lighting levels? Excellent Satisfactory Poor
Please provide any comments you wish to make: _______________________________________
Good quality lighting is essential for the health, safety and well-being of workers. It is necessary to create a visual environment in which hazards are visible, relevant details of the task are made easy to see and adverse factors such as glare and reflections are excluded or controlled. In your response, please consider that a ‘Satisfactory’ response would indicate for example that lighting illuminates all shelf areas evenly, with no variations of light and dark areas. A ‘Poor’ response would indicate for example, that you cannot read the Dewey Decimal Classification codes on all books. The relevant lighting standard is AS 1680.
27a How would you rate your branch library‘s internal public information signage?
Excellent Satisfactory Poor
Please provide any comments you wish to make: _______________________________________
Signs should provide basic directional information to library users. In your response, please consider that - ‘Satisfactory’ signage is that which complies with AS2899 standards, ‘Poor’ signage is that which results in numerous requests being received for assistance in physically locating information.
27b How would you rate your branch library‘s external public information signage?
Excellent Satisfactory Poor
Please provide any comments you wish to make: _______________________________________
This includes Street signposting / directional signs indicating the library location from neighbouring streets, and Exterior identification near the entrance.
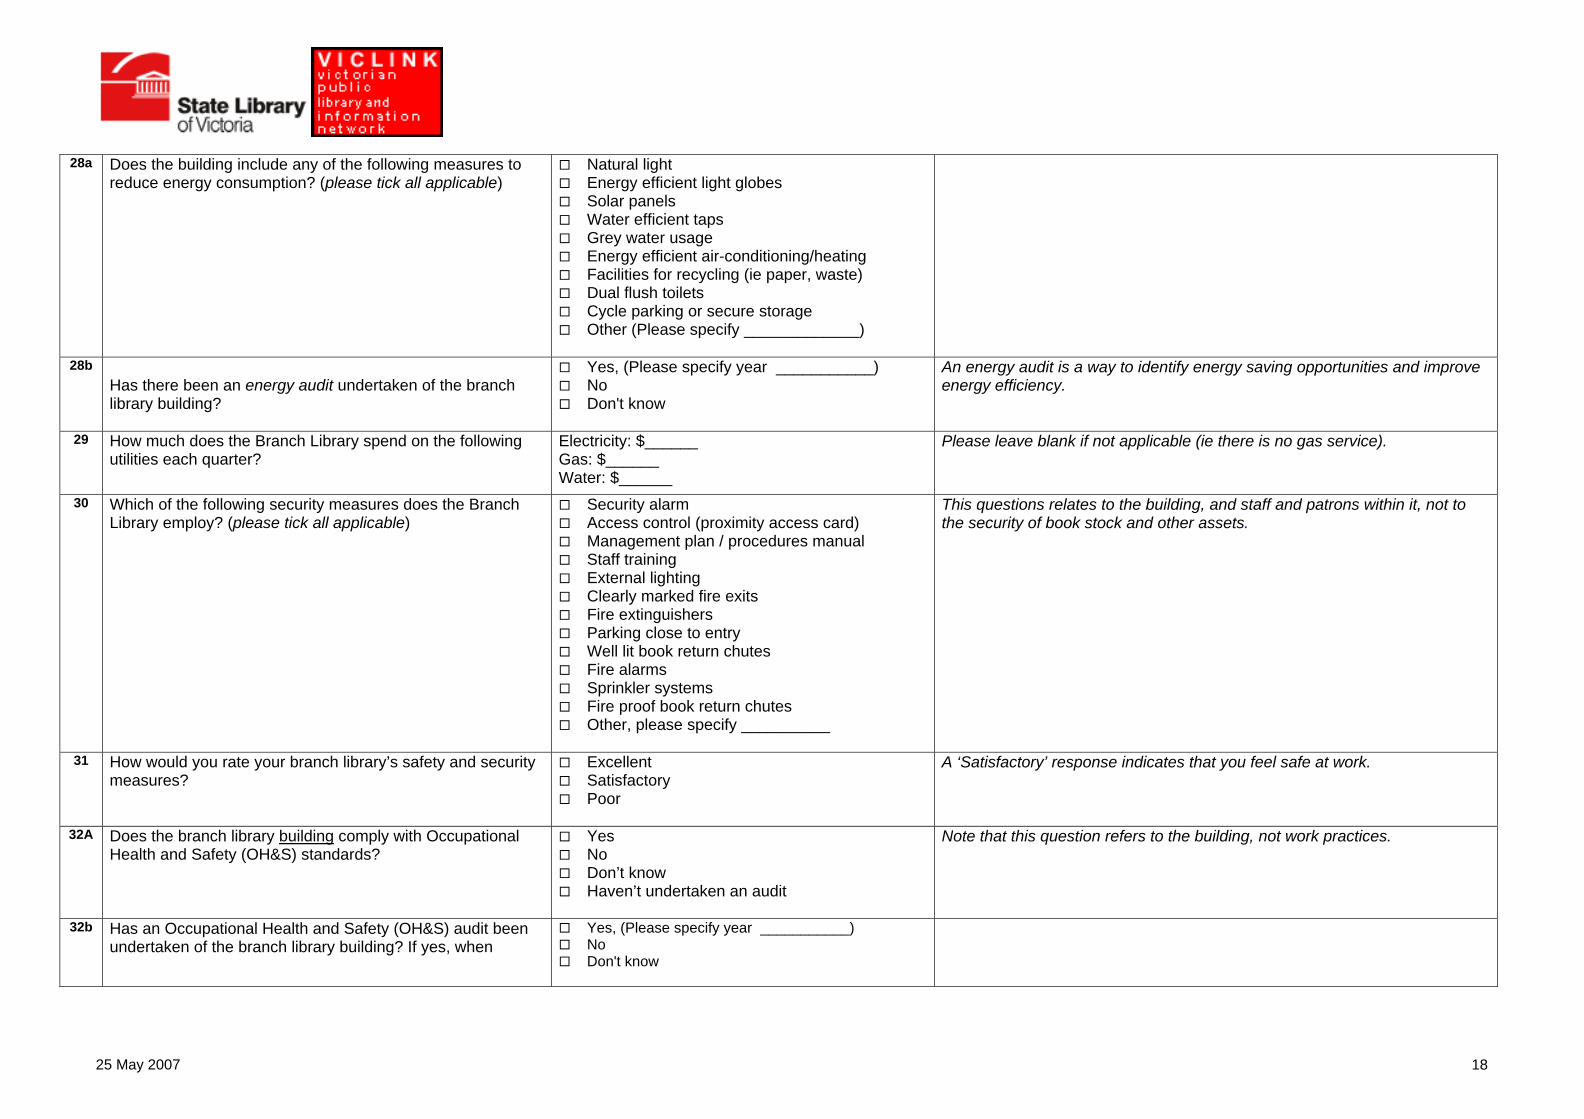
25 May 2007 18
28a Does the building include any of the following measures to reduce energy consumption? (please tick all applicable)
Natural light Energy efficient light globes Solar panels Water efficient taps Grey water usage Energy efficient air-conditioning/heating Facilities for recycling (ie paper, waste) Dual flush toilets Cycle parking or secure storage Other (Please specify _____________)
28b Has there been an energy audit undertaken of the branch library building?
Yes, (Please specify year ___________) No Don't know
An energy audit is a way to identify energy saving opportunities and improve energy efficiency.
29 How much does the Branch Library spend on the following utilities each quarter?
Electricity: $______ Gas: $______ Water: $______
Please leave blank if not applicable (ie there is no gas service).
30 Which of the following security measures does the Branch Library employ? (please tick all applicable)
Security alarm Access control (proximity access card) Management plan / procedures manual Staff training External lighting Clearly marked fire exits Fire extinguishers Parking close to entry Well lit book return chutes Fire alarms Sprinkler systems Fire proof book return chutes Other, please specify __________
This questions relates to the building, and staff and patrons within it, not to the security of book stock and other assets.
31 How would you rate your branch library’s safety and security measures?
Excellent Satisfactory Poor
A ‘Satisfactory’ response indicates that you feel safe at work.
32A Does the branch library building comply with Occupational Health and Safety (OH&S) standards?
Yes No Don’t know Haven’t undertaken an audit
Note that this question refers to the building, not work practices.
32b Has an Occupational Health and Safety (OH&S) audit been undertaken of the branch library building? If yes, when
Yes, (Please specify year ___________) No Don't know

25 May 2007 19
33a How would you rate the branch library building? Excellent Satisfactory Unsatisfactory
This is an assessment of the physical building only.
33b How would you rate the internal layout and design of the branch library?
Excellent Satisfactory Unsatisfactory
That is the elements of the layout which can be altered, such as shelving, desks.
33c How would you rate the overall standard of your branch library?
Excellent Satisfactory Unsatisfactory
This is an assessment of more than the Building fabric, and includes stock, service, satisfaction of user needs, etc
33d What do you consider to be the three finest attributes of your branch library building? (list in order of importance)
1._________ 2._________ 3._________
33e What do you consider to be the three worst features of your branch library building? (list in order of importance)
1._________ 2._________ 3._________
C. Location of the Building The questions in Part C are intended to obtain information on the location of the library premises.
34
Is the branch library premises located: (please tick all applicable)
Within
library building:
Adjacent to library building:
within 400m of:
a shopping centre
a shopping or business precinct
a main street a Council administration precinct
train station bus stop cultural facilities
Car parking eating facilities
school recreation/ sporting facility
parks and gardens
other (pls specify _____

25 May 2007 20
35a Is there car parking near the branch library? If yes, please provide the number of spaces.
No Yes (Please specify number of spaces _____)
35b If yes, is this car parking free or paid? Free Paid
35c If yes, how many car parks are provided solely for the use of branch library patrons?
___________ car parks
35d If yes, is there enough car parking near the library? Yes No
35e How many car parks are provided for staff use? ___________ car parks
Please insert zero if there are none.
D. Building Management and Maintenance The questions in Part D are intended to obtain information on the management and maintenance of the library premises.
36a Does the Council or Library Service have an asset management plan? If yes, for how many years does the plan extend?
No Yes (Years _______)
In answering this question, please liaise with Council’s Property Asset Manager.
36b If yes, which of the following does it cover? Please note the year at which it is planned (if known). Please tick all applicable.
New building (year _________) Closure (year _________) Relocation (year _________) Refurbishment of existing building (year
_________) Extensions (year _________) Maintenance (year _________) Other (please specify _________) (year
_________)
In answering this question, please liaise with Council’s Property Asset Manager or your Library Service manager.
37 What is the total insurance value of the library building? Please note the date of the assessment.
$_________ (Year: ________)
Date not known
This does not include the value of building contents. Please answer without separating commas. In answering this question, please liaise with Council’s Property Asset Manager or your Library Service manager.
38 What is the average annual cost of maintenance for the branch library building? Please provide this information by type of expense.
Total amount $_________ (REQUIRED) Cleaning $_________ Unplanned reactive maintenance work $_________ Planned preventative maintenance work $_________ Planned works program costs (condition-based) $_________ Major plant and equipment replacement $_________ Other (please specify ________) $_________
In answering this question, please liaise with Council’s Property Asset Manager or your Library Service manager.
39 What is the estimated backlog of planned maintenance of the library building? (in $ value)
$ _________________ In answering this question, please liaise with Council’s Property Asset Manager or your Library Service manager.

25 May 2007 21
40 What was the capital expenditure on the branch library building in the 06/07 financial year? ($)
$ _________________ In answering this question, please liaise with Council’s Property Asset Manager or your Library Service manager.
41 What is the projected capital expenditure on the branch library building for the 07/08 financial year? ($)
$ _________________ In answering this question, please liaise with Council’s Property Asset Manager or your Library Service manager.
42 Does the Local Authority/ library service carry out regular building condition surveys? If yes, at what intervals?
Less than every 5 years Between 2 and 5 years Every second year Every year Several times a year No, regular condition surveys are not done
In answering this question, please liaise with Council’s Property Asset Manager or your Library Service manager.
E. Planning and Development The questions in Part E are intended to obtain information on library development planning. Please liaise with the manager of your Library Service in completing this section of the survey.
43a Are major refurbishments/ extensions required to the existing building within the next five years?
Yes No
In answering this question, please liaise with your Library Service manager.
43b Is the site able to accommodate future expansion of the library if required?
Yes No
In answering this question, please liaise with your Library Service manager.
44a Are major alterations planned to the existing building? Yes No
In answering this question, please liaise with your Library Service manager.
If yes, please indicate which of the following is involved -
Refurbishment of existing branch building Demolition and replacement of branch building -
completely on the present site Replacement of the branch building and
relocation to another site
Please note that this section of the survey does NOT deal with any totally new branch libraries to be constructed on new sites. This information will be provided by your Library Service Manager in Question 7 of the survey
44b If yes, when is it expected to be operational?
less than two years between two and four years more than four years time
In answering this question, please liaise with your Library Service manager. Operational means the time at which construction is complete and the library is operating.
44c If yes, what is the proposed additional floor space (if any)? (m2) _______ No extra floor space
In answering this question, please liaise with your Library Service manager.
44d If yes, what is the likely budget (in $) for - (Please indicate to the nearest $100,000).
Capital building: $_______ Internal assets (eg shelving etc): $_______
This excludes budget for book stock and other resources. In answering this question, please liaise with your Library Service manager.

25 May 2007 22
44e If yes, please identify what works are planned. (please tick all applicable)
Internal reorganisation of space Additional floor space Decreased floor space Internal structural alterations Improved collection areas (as defined in Q12) Improved reading and study areas (defined in
Q12) Improved resource areas (defined in Q12) Improved staff areas (defined in Q12) Improved amenities areas (defined in Q12) Improvements to other areas (defined in Q12.
eg cafes). Please specify _____________ Improved shelving Building services upgrade (eg lifts) Fire safety improvements Improved disabled access Energy consumption improvements Increased computer access Wireless internet Carpeting or other change to floor covering Painting Building materials - external cladding Heating Air conditioning Other, Please specify ______
In answering this question, please liaise with your Library Service manager.
45 Do you currently have spaces which could be adapted for new uses (as an alternative to major alterations)?
Yes, Please provide detail ________ No
For example, internal reconfiguration or reallocation of space.
Thank you for your co-operation

Appendix 2: List of survey respondents Library service Local Government Authority Branch
Beaumaris
Brighton
Hampton
Bayside Library Service Bayside City Council
Sandringham
Deer Park
Keilor
St Albans
Sunshine
Brimbank Libraries Brimbank City Council
Sydenham
Echuca
Kyabram
Rochester
Rushworth
Campaspe Regional Library Campaspe Shire Council
Tongala
Cranbourne
Doveton
Endeavour Hills
Hampton Park
Casey City Council
Narre Warren
Emerald
Casey-Cardinia Library Corporation
Cardinia Shire Council
Pakenham
Ararat Rural City Council Ararat
Ballarat
Sebastopol
Ballarat City Council
Wendouree
Central Goldfields Shire Council Maryborough
Clunes
Creswick
Hepburn Shire Council
Daylesford
Central Highlands Regional Library
Moorabool Shire Council Bacchus Marsh

Library service Local Government Authority Branch
Avoca Pyrenees Shire Council
Beaufort
Southern Grampians Shire Council Hamilton
Ashburton
Balwyn
Camberwell
Hawthorn
City of Boroondara Library Service
Boroondara City Council
Kew
Fairfield
Northcote
Preston
Darebin Libraries Darebin City Council
Reservoir
Bairnsdale
Lakes Entrance
Omeo
Orbost
East Gippsland Shire Library East Gippsland Shire Council
Paynesville
Boronia
Ferntree Gully
Knox
Knox City Council
Rowville
Croydon Maroondah City Council
Ringwood
Belgrave
Healesville
Lilydale
Montrose
Mooroolbark
Mount Evelyn
Eastern Regional Libraries
Yarra Ranges Shire Council
Yarra Junction
Carrum Downs Frankston Library Service Frankston City Council
Frankston

Library service Local Government Authority Branch
Cohuna
Kerang
Leitchville
Gannawarra Library Service Gannawarra Shire Council
Quambatook
Borough of Queenscliffe Queenscliffe
Golden Plains Shire Council no library building
Barwon Heads
Belmont
Chilwell
Corio
Drysdale
Geelong
Geelong West
Highton
Newcomb
Greater Geelong City Council
Ocean Grove
Grovedale
Geelong Regional Library Corporation
Surf Coast Shire Council
Torquay
Bentleigh
Carnegie
Caulfield
Glen Eira Library and Information Service
Glen Eira City Council
Elsternwick
Casterton
Heywood
Glenelg Libraries Glenelg Shire Council
Portland
Mount Alexander Shire Council Castlemaine
Bendigo
Heathcote
Kangaroo Flat
Greater Bendigo City Council
Eaglehawk
Loddon Shire Council Pyramid Hill
Goldfields Library Corporation
Macedon Ranges Shire Council Gisborne

Library service Local Government Authority Branch
Kyneton
Woodend
Cobram
Mooroopna
Nathalia
Numurkah
Shepparton
Tatura
Greater Shepparton City Council
Yarrawonga
Euroa
Nagambie
Goulburn Valley Regional Library Corporation
Strathbogie Shire Council
Violet Town
Dandenong Greater Dandenong Libraries Greater Dandenong City Council
Springvale
Bright
Mt Beauty
Alpine Shire Council
Myrtleford
Benalla Rural City Council Benalla
Mansfield Shire Council Mansfield
High Country Library Corporation
Wangaratta Rural City Council Wangaratta
Altona
Altona Meadows
Newport
Hobsons Bay Libraries Hobsons Bay City Council
Williamstown
Broadmeadows
Craigieburn
Gladstone Park
Sunbury
Hume Global Learning Village Library Service
Hume City Council
Tullamarine
Chelsea
Cheltenham
Kingston Information and Library Service
Kingston City Council
Clarinda

Library service Local Government Authority Branch
Dingley
Highett
Moorabbin
Parkdale
South Oakleigh
Churchill
Moe
Morwell
Latrobe City Library Service Latrobe City Council
Traralgon
Footscray
Maribyrnong
West Footscray
Maribyrnong Library Service Maribyrnong City Council
Yarraville
East Melbourne
Melbourne (City Library)
Melbourne Library Service Melbourne City Council
North Melbourne
Caroline Springs Melton Library and Information Service
Melton Shire Council
Melton
Irymple
Merbein
Mildura
Mildura Rural City Council Library Service
Mildura Rural City Council
Red Cliffs
Broadford
Kilmore
Romsey
Seymour
Mitchell Shire Library and Information Service
Mitchell Shire Council
Wallan
Clayton
Glen Waverley
Mount Waverley
Oakleigh
Monash Public Library Service
Monash City Council
Wheelers Hill

Library service Local Government Authority Branch
Ascot Vale
East Keilor
Flemington
Moonee Ponds
Moonee Valley Library Service
Moonee Valley City Council
Niddrie
Brunswick
Brunswick West
Coburg
Fawkner
Moreland City Libraries Moreland City Council
Glenroy
Hastings
Mornington
Rosebud
Mornington Peninsula Library
Mornington Peninsula Shire Council
Somerville
Alexandra
Kinglake
Murrindindi Library Service Murrindindi Shire Council
Yea
Albert Park
Emerald Hill
Middle Park
Port Melbourne
Port Phillip Library Service Port Phillip City Council
St Kilda
Malvern
Malvern East
Prahran
Stonnington Library and Information Service
Stonnington City Council
South Yarra
Swan Hill Regional Library Service
Swan Hill Rural City Council Swan Hill
Beechworth
Chiltern
Indigo Shire Council
Rutherglen
Upper Murray Regional Library
Towong Shire Council Corryong
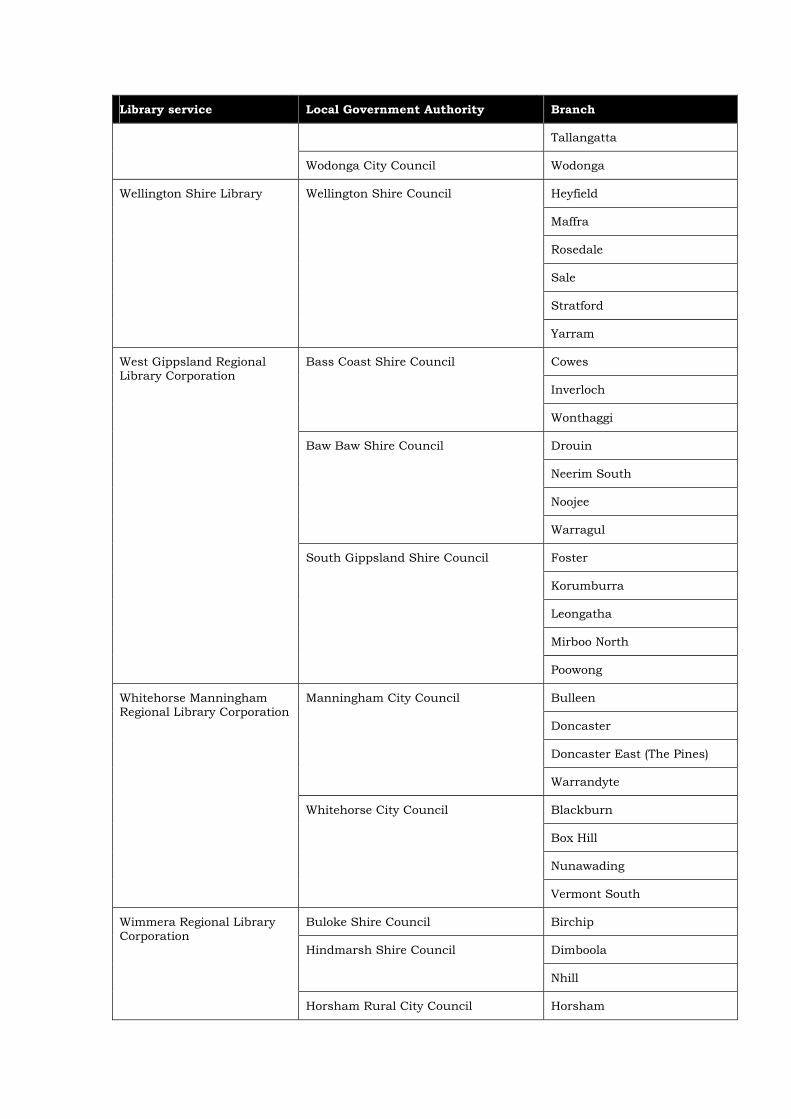
Library service Local Government Authority Branch
Tallangatta
Wodonga City Council Wodonga
Heyfield
Maffra
Rosedale
Sale
Stratford
Wellington Shire Library Wellington Shire Council
Yarram
Cowes
Inverloch
Bass Coast Shire Council
Wonthaggi
Drouin
Neerim South
Noojee
Baw Baw Shire Council
Warragul
Foster
Korumburra
Leongatha
Mirboo North
West Gippsland Regional Library Corporation
South Gippsland Shire Council
Poowong
Bulleen
Doncaster
Doncaster East (The Pines)
Manningham City Council
Warrandyte
Blackburn
Box Hill
Nunawading
Whitehorse Manningham Regional Library Corporation
Whitehorse City Council
Vermont South
Buloke Shire Council Birchip
Dimboola Hindmarsh Shire Council
Nhill
Wimmera Regional Library Corporation
Horsham Rural City Council Horsham

Library service Local Government Authority Branch
St Arnaud Northern Grampians Shire Council
Stawell
Edenhope
Goroke
Harrow
West Wimmera Shire Council
Kaniva
Yarriambiack Shire Council Warracknabeal
Werribee CBD Wyndham City Library Service
Wyndham City Council
Werribee, Heaths Rd
Carlton
Collingwood
Fitzroy
North Fitzroy
Yarra Libraries Yarra City Council
Richmond
Ivanhoe
Rosanna
Banyule City Council
Watsonia
Diamond Valley Nillumbik Shire Council
Eltham
Lalor
Mill Park
Yarra Plenty Regional Library Service
Whittlesea City Council
Thomastown

Appendix 3: Tabulated data – LGA survey

Q1 LGA Population (Banded)
10 13.3 13.3 13.328 37.3 37.3 50.715 20.0 20.0 70.714 18.7 18.7 89.3
8 10.7 10.7 100.075 100.0 100.0
<1000010000 - 4999950000 - 99999100000 - 149999150000+Total
ValidFrequency Percent Valid Percent
CumulativePercent
Q2A Total Library membership (Banded)
10 13.3 13.3 13.329 38.7 38.7 52.010 13.3 13.3 65.316 21.3 21.3 86.7
8 10.7 10.7 97.32 2.7 2.7 100.0
75 100.0 100.0
<50005000 - 2499925000 - 4999950000 - 7499975000 - 99999100000+Total
ValidFrequency Percent Valid Percent
CumulativePercent
Q2B Members Living within the LGA (Banded)
19 25.3 25.3 25.327 36.0 36.0 61.313 17.3 17.3 78.7
9 12.0 12.0 90.73 4.0 4.0 94.74 5.3 5.3 100.0
75 100.0 100.0
<50005000 - 2499925000 - 4999950000 - 7499975000 - 99999Not StatedTotal
ValidFrequency Percent Valid Percent
CumulativePercent
Q2B % not living in LGA (Banded)
8 10.7 10.7 10.724 32.0 32.0 42.718 24.0 24.0 66.7
6 8.0 8.0 74.73 4.0 4.0 78.7
12 16.0 16.0 94.74 5.3 5.3 100.0
75 100.0 100.0
00.1 - 9.910.0 - 24.925.0 - 49.950.0 - 74.975.0 - 100Not StatedTotal
ValidFrequency Percent Valid Percent
CumulativePercent
Page 1

Q2B % of LGA population who are members (Banded)
8 10.7 10.7 10.75 6.7 6.7 17.35 6.7 6.7 24.0
26 34.7 34.7 58.717 22.7 22.7 81.310 13.3 13.3 94.7
4 5.3 5.3 100.075 100.0 100.0
0.1 - 4.910.0 - 19.920.0 - 29.930.0 - 39.940.0 - 49.950.0 - 100.0Not StatedTotal
ValidFrequency Percent Valid Percent
CumulativePercent
Q3 Non-resident membership not Significant
46 61.3 61.3 61.323 30.7 30.7 92.0
6 8.0 8.0 100.075 100.0 100.0
Not SignificantSignificantNot StatedTotal
ValidFrequency Percent Valid Percent
CumulativePercent
Q6A Off-Site Library Floor Space
21 28.0 28.0 28.054 72.0 72.0 100.075 100.0 100.0
YesNoTotal
ValidFrequency Percent Valid Percent
CumulativePercent
Q6B Off-Site Administration Area
16 21.3 21.3 21.359 78.7 78.7 100.075 100.0 100.0
YesNoTotal
ValidFrequency Percent Valid Percent
CumulativePercent
Q6B Size of Off-Site Administration Area (m2) (Banded)
1 1.3 6.3 6.35 6.7 31.3 37.52 2.7 12.5 50.03 4.0 18.8 68.85 6.7 31.3 100.0
16 21.3 100.059 78.775 100.0
<2050 - 99250 - 499500 - 999Not StatedTotal
Valid
SystemMissingTotal
Frequency Percent Valid PercentCumulative
Percent
Page 2

Q6B Off-Site Storage Area
13 17.3 17.3 17.362 82.7 82.7 100.075 100.0 100.0
YesNoTotal
ValidFrequency Percent Valid Percent
CumulativePercent
Q6B Size of Off-Site Storage Area (m2) (Banded)
2 2.7 22.2 22.21 1.3 11.1 33.31 1.3 11.1 44.44 5.3 44.4 88.91 1.3 11.1 100.09 12.0 100.0
66 88.075 100.0
<55 - 910 - 2425 - 4950+Total
Valid
SystemMissingTotal
Frequency Percent Valid PercentCumulative
Percent
Q6B Other Off-Site Area
9 12.0 12.0 12.066 88.0 88.0 100.075 100.0 100.0
YesNoTotal
ValidFrequency Percent Valid Percent
CumulativePercent
Q6B Size of Other Type of Off-Site Area (m2) (Banded)
2 2.7 22.2 22.24 5.3 44.4 66.71 1.3 11.1 77.82 2.7 22.2 100.09 12.0 100.0
66 88.075 100.0
<20200 - 499500+Not StatedTotal
Valid
SystemMissingTotal
Frequency Percent Valid PercentCumulative
Percent
Q6C(A) Lessor of Administration Building
7 9.3 46.7 46.74 5.3 26.7 73.32 2.7 13.3 86.72 2.7 13.3 100.0
15 20.0 100.060 80.075 100.0
Not LeasedCouncilPrivate OwnerNot StatedTotal
Valid
SystemMissingTotal
Frequency Percent Valid PercentCumulative
Percent
Page 3

Q6C(A) Lessor of Administration Building (other type)
75 100.0 100.0 100.0 ValidFrequency Percent Valid Percent
CumulativePercent
Q6C(A) Owner of Administration Building
13 17.3 81.3 81.32 2.7 12.5 93.81 1.3 6.3 100.0
16 21.3 100.059 78.775 100.0
CouncilPrivate OwnerNot StatedTotal
Valid
SystemMissingTotal
Frequency Percent Valid PercentCumulative
Percent
Q6C(A) Owner of Administration Building (other type)
75 100.0 100.0 100.0 ValidFrequency Percent Valid Percent
CumulativePercent
Q6C(B) Lessor of Storage Building
5 6.7 38.5 38.54 5.3 30.8 69.24 5.3 30.8 100.0
13 17.3 100.062 82.775 100.0
Not LeasedPrivate OwnerNot StatedTotal
Valid
SystemMissingTotal
Frequency Percent Valid PercentCumulative
Percent
Q6C(B) Lessor of Storage Building (other type)
75 100.0 100.0 100.0 ValidFrequency Percent Valid Percent
CumulativePercent
Q6C(B) Owner of Storage Building
9 12.0 69.2 69.24 5.3 30.8 100.0
13 17.3 100.062 82.775 100.0
CouncilPrivate OwnerTotal
Valid
SystemMissingTotal
Frequency Percent Valid PercentCumulative
Percent
Q6C(B) Owner of Storage Building (other type)
75 100.0 100.0 100.0 ValidFrequency Percent Valid Percent
CumulativePercent
Page 4

Q6C(C) Lessor of Other Type of Off-Site Area
3 4.0 33.3 33.31 1.3 11.1 44.43 4.0 33.3 77.81 1.3 11.1 88.91 1.3 11.1 100.09 12.0 100.0
66 88.075 100.0
Not LeasedCouncilPrivate OwnerCommunity OwnedNot StatedTotal
Valid
SystemMissingTotal
Frequency Percent Valid PercentCumulative
Percent
Q6C(C) Lessor of Other Type of Off-Site Area (other type)
74 98.7 98.7 98.7
1 1.3 1.3 100.0
75 100.0 100.0
We lease a room fromthe Private OwnerTotal
ValidFrequency Percent Valid Percent
CumulativePercent
Q6C(C) Owner of Other Type of Off-Site Area
3 4.0 33.3 33.32 2.7 22.2 55.61 1.3 11.1 66.73 4.0 33.3 100.09 12.0 100.0
66 88.075 100.0
CouncilPrivate OwnerCommunity OwnedNot StatedTotal
Valid
SystemMissingTotal
Frequency Percent Valid PercentCumulative
Percent
Q6C(C) Owner of Other Type of Off-Site Area (other type)
75 100.0 100.0 100.0 ValidFrequency Percent Valid Percent
CumulativePercent
Q7A Number of New Buildings Planned
50 66.7 66.7 66.7
16 21.3 21.3 88.07 9.3 9.3 97.32 2.7 2.7 100.0
75 100.0 100.0
No New buildingsplannedOneTwoThreeTotal
ValidFrequency Percent Valid Percent
CumulativePercent
Page 5

Q7A Number of New Buildings Planned
60 80.0 80.0 80.0
12 16.0 16.0 96.02 2.7 2.7 98.71 1.3 1.3 100.0
75 100.0 100.0
No New buildingsplannedOneTwoThreeTotal
ValidFrequency Percent Valid Percent
CumulativePercent
Q7A Unique New Buildings
13 17.3 52.0 52.0
12 16.0 48.0 100.0
25 33.3 100.050 66.775 100.0
New BuildingWorks affectingexisting branchTotal
Valid
SystemMissingTotal
Frequency Percent Valid PercentCumulative
Percent
Q7(I)B First Building - Timeframe
8 10.7 32.0 32.010 13.3 40.0 72.0
7 9.3 28.0 100.025 33.3 100.050 66.775 100.0
< 2 years2 - 4 Years> 4 YearsTotal
Valid
SystemMissingTotal
Frequency Percent Valid PercentCumulative
Percent
Q7(I)C First Building - Proposed Floor space (m2) (Banded)
1 1.3 4.0 4.01 1.3 4.0 8.04 5.3 16.0 24.0
13 17.3 52.0 76.06 8.0 24.0 100.0
25 33.3 100.050 66.775 100.0
0150 - 199200 - 499500+Not StatedTotal
Valid
SystemMissingTotal
Frequency Percent Valid PercentCumulative
Percent
Page 6

Q7(I)D First Building - Capital Budget ($) (Banded)
7 9.3 28.0 28.01 1.3 4.0 32.01 1.3 4.0 36.02 2.7 8.0 44.06 8.0 24.0 68.05 6.7 20.0 88.03 4.0 12.0 100.0
25 33.3 100.050 66.775 100.0
Not Stated<500,000500000 - 9999991000000 - 24999992500000 - 49999995000000 - 999999910000000+Total
Valid
SystemMissingTotal
Frequency Percent Valid PercentCumulative
Percent
Q7(I)D First Building - Internal Fit-out Budget ($) (Banded)
3 4.0 12.0 12.03 4.0 12.0 24.04 5.3 16.0 40.02 2.7 8.0 48.03 4.0 12.0 60.03 4.0 12.0 72.07 9.3 28.0 100.0
25 33.3 100.050 66.775 100.0
<100000100000 - 249999250000 - 499999500000 - 9999991000000 - 14999991500000+Not StatedTotal
Valid
SystemMissingTotal
Frequency Percent Valid PercentCumulative
Percent
Q7(I)D First Building - Total Budget ($) (Banded)
3 4.0 12.0 12.01 1.3 4.0 16.08 10.7 32.0 48.03 4.0 12.0 60.03 4.0 12.0 72.07 9.3 28.0 100.0
25 33.3 100.050 66.775 100.0
<10000001000000 - 19999992000000 - 49999995000000 - 84999998500000+Not StatedTotal
Valid
SystemMissingTotal
Frequency Percent Valid PercentCumulative
Percent
Page 7

Q7(i)e First Building - Type of Facility Planned
3 4.0 12.0 12.016 21.3 64.0 76.0
4 5.3 16.0 92.0
1 1.3 4.0 96.0
1 1.3 4.0 100.025 33.3 100.050 66.775 100.0
Joint UseCo-LocatedNeitherBoth Joint Useand Co-LocatedNot StatedTotal
Valid
SystemMissingTotal
Frequency Percent Valid PercentCumulative
Percent
Q7(I)F First Building - Proximity to a shopping centre
6 8.0 24.0 24.06 8.0 24.0 48.09 12.0 36.0 84.04 5.3 16.0 100.0
25 33.3 100.050 66.775 100.0
AdjacentWithin 400mN/ANot StatedTotal
Valid
SystemMissingTotal
Frequency Percent Valid PercentCumulative
Percent
Q7(I)F First Building - Proximity to a shopping or business precinct
9 12.0 36.0 36.09 12.0 36.0 72.03 4.0 12.0 84.04 5.3 16.0 100.0
25 33.3 100.050 66.775 100.0
AdjacentWithin 400mN/ANot StatedTotal
Valid
SystemMissingTotal
Frequency Percent Valid PercentCumulative
Percent
First Building - Proximity to a main street
10 13.3 40.0 40.07 9.3 28.0 68.04 5.3 16.0 84.04 5.3 16.0 100.0
25 33.3 100.050 66.775 100.0
AdjacentWithin 400mN/ANot StatedTotal
Valid
SystemMissingTotal
Frequency Percent Valid PercentCumulative
Percent
Page 8

First Building - Proximity to a Council administration precinct
3 4.0 12.0 12.02 2.7 8.0 20.04 5.3 16.0 36.0
10 13.3 40.0 76.06 8.0 24.0 100.0
25 33.3 100.050 66.775 100.0
Within BuildingAdjacentWithin 400mN/ANot StatedTotal
Valid
SystemMissingTotal
Frequency Percent Valid PercentCumulative
Percent
First Building - Proximity to train station
1 1.3 4.0 4.04 5.3 16.0 20.0
15 20.0 60.0 80.05 6.7 20.0 100.0
25 33.3 100.050 66.775 100.0
AdjacentWithin 400mN/ANot StatedTotal
Valid
SystemMissingTotal
Frequency Percent Valid PercentCumulative
Percent
First Building - Proximity to bus stop
5 6.7 20.0 20.012 16.0 48.0 68.0
4 5.3 16.0 84.04 5.3 16.0 100.0
25 33.3 100.050 66.775 100.0
AdjacentWithin 400mN/ANot StatedTotal
Valid
SystemMissingTotal
Frequency Percent Valid PercentCumulative
Percent
First Building - Proximity to cultural facilities
5 6.7 20.0 20.04 5.3 16.0 36.04 5.3 16.0 52.07 9.3 28.0 80.05 6.7 20.0 100.0
25 33.3 100.050 66.775 100.0
Within BuildingAdjacentWithin 400mN/ANot StatedTotal
Valid
SystemMissingTotal
Frequency Percent Valid PercentCumulative
Percent
Page 9

First Building - Proximity to car parking
18 24.0 72.0 72.01 1.3 4.0 76.02 2.7 8.0 84.04 5.3 16.0 100.0
25 33.3 100.050 66.775 100.0
AdjacentWithin 400mN/ANot StatedTotal
Valid
SystemMissingTotal
Frequency Percent Valid PercentCumulative
Percent
First Building - Proximity to eating facilities
7 9.3 29.2 29.22 2.7 8.3 37.59 12.0 37.5 75.02 2.7 8.3 83.34 5.3 16.7 100.0
24 32.0 100.051 68.075 100.0
Within BuildingAdjacentWithin 400mN/ANot StatedTotal
Valid
SystemMissingTotal
Frequency Percent Valid PercentCumulative
Percent
First Building - Proximity to school
5 6.7 20.0 20.05 6.7 20.0 40.0
10 13.3 40.0 80.05 6.7 20.0 100.0
25 33.3 100.050 66.775 100.0
AdjacentWithin 400mN/ANot StatedTotal
Valid
SystemMissingTotal
Frequency Percent Valid PercentCumulative
Percent
First Building - Proximity to recreation/ sporting facility
1 1.3 4.0 4.04 5.3 16.0 20.07 9.3 28.0 48.07 9.3 28.0 76.06 8.0 24.0 100.0
25 33.3 100.050 66.775 100.0
Within BuildingAdjacentWithin 400mN/ANot StatedTotal
Valid
SystemMissingTotal
Frequency Percent Valid PercentCumulative
Percent
Page 10

First Building - Proximity to parks and gardens
5 6.7 20.0 20.07 9.3 28.0 48.09 12.0 36.0 84.04 5.3 16.0 100.0
25 33.3 100.050 66.775 100.0
AdjacentWithin 400mN/ANot StatedTotal
Valid
SystemMissingTotal
Frequency Percent Valid PercentCumulative
Percent
First Building - Proximity to other facility (Distance)
2 2.7 25.0 25.06 8.0 75.0 100.08 10.7 100.0
67 89.375 100.0
Within 400mN/ATotal
Valid
SystemMissingTotal
Frequency Percent Valid PercentCumulative
Percent
Q7(i)g First Building - Rebuild at Existing Site
8 10.7 32.0 32.017 22.7 68.0 100.025 33.3 100.050 66.775 100.0
At Exisitng SiteNew BuildingTotal
Valid
SystemMissingTotal
Frequency Percent Valid PercentCumulative
Percent
Q7Aii Unique New Buildings
4 5.3 44.4 44.4
5 6.7 55.6 100.0
9 12.0 100.066 88.075 100.0
New BuildingWorks affectingexisting branchTotal
Valid
SystemMissingTotal
Frequency Percent Valid PercentCumulative
Percent
Q7(ii)b Second Building - Timeframe
3 4.0 33.3 33.36 8.0 66.7 100.09 12.0 100.0
66 88.075 100.0
2 - 4 Years> 4 YearsTotal
Valid
SystemMissingTotal
Frequency Percent Valid PercentCumulative
Percent
Page 11
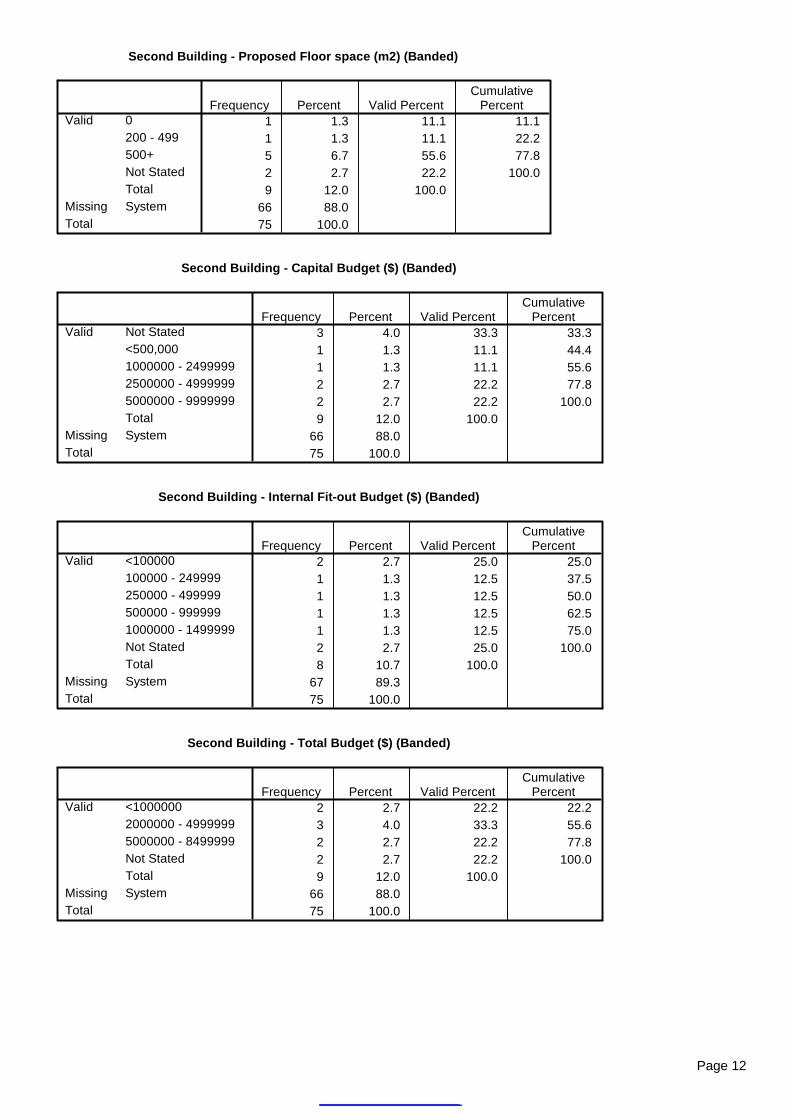
Second Building - Proposed Floor space (m2) (Banded)
1 1.3 11.1 11.11 1.3 11.1 22.25 6.7 55.6 77.82 2.7 22.2 100.09 12.0 100.0
66 88.075 100.0
0200 - 499500+Not StatedTotal
Valid
SystemMissingTotal
Frequency Percent Valid PercentCumulative
Percent
Second Building - Capital Budget ($) (Banded)
3 4.0 33.3 33.31 1.3 11.1 44.41 1.3 11.1 55.62 2.7 22.2 77.82 2.7 22.2 100.09 12.0 100.0
66 88.075 100.0
Not Stated<500,0001000000 - 24999992500000 - 49999995000000 - 9999999Total
Valid
SystemMissingTotal
Frequency Percent Valid PercentCumulative
Percent
Second Building - Internal Fit-out Budget ($) (Banded)
2 2.7 25.0 25.01 1.3 12.5 37.51 1.3 12.5 50.01 1.3 12.5 62.51 1.3 12.5 75.02 2.7 25.0 100.08 10.7 100.0
67 89.375 100.0
<100000100000 - 249999250000 - 499999500000 - 9999991000000 - 1499999Not StatedTotal
Valid
SystemMissingTotal
Frequency Percent Valid PercentCumulative
Percent
Second Building - Total Budget ($) (Banded)
2 2.7 22.2 22.23 4.0 33.3 55.62 2.7 22.2 77.82 2.7 22.2 100.09 12.0 100.0
66 88.075 100.0
<10000002000000 - 49999995000000 - 8499999Not StatedTotal
Valid
SystemMissingTotal
Frequency Percent Valid PercentCumulative
Percent
Page 12

Q7(ii)e Second Building - Type of Facility Planned
6 8.0 66.7 66.73 4.0 33.3 100.09 12.0 100.0
66 88.075 100.0
Co-LocatedNeitherTotal
Valid
SystemMissingTotal
Frequency Percent Valid PercentCumulative
Percent
Second Building - Proximity to a shopping centre
2 2.7 22.2 22.23 4.0 33.3 55.61 1.3 11.1 66.73 4.0 33.3 100.09 12.0 100.0
66 88.075 100.0
AdjacentWithin 400mN/ANot StatedTotal
Valid
SystemMissingTotal
Frequency Percent Valid PercentCumulative
Percent
Second Building - Proximity to a shopping or business precinct
1 1.3 11.1 11.13 4.0 33.3 44.42 2.7 22.2 66.73 4.0 33.3 100.09 12.0 100.0
66 88.075 100.0
AdjacentWithin 400mN/ANot StatedTotal
Valid
SystemMissingTotal
Frequency Percent Valid PercentCumulative
Percent
Second Building - Proximity to a main street
2 2.7 22.2 22.23 4.0 33.3 55.61 1.3 11.1 66.73 4.0 33.3 100.09 12.0 100.0
66 88.075 100.0
AdjacentWithin 400mN/ANot StatedTotal
Valid
SystemMissingTotal
Frequency Percent Valid PercentCumulative
Percent
Second Building - Proximity to a Council administration precinct
1 1.3 11.1 11.14 5.3 44.4 55.64 5.3 44.4 100.09 12.0 100.0
66 88.075 100.0
Within 400mN/ANot StatedTotal
Valid
SystemMissingTotal
Frequency Percent Valid PercentCumulative
Percent
Page 13

Second Building - Proximity to train station
3 4.0 33.3 33.32 2.7 22.2 55.64 5.3 44.4 100.09 12.0 100.0
66 88.075 100.0
Within 400mN/ANot StatedTotal
Valid
SystemMissingTotal
Frequency Percent Valid PercentCumulative
Percent
Second Building - Proximity to bus stop
1 1.3 11.1 11.14 5.3 44.4 55.61 1.3 11.1 66.73 4.0 33.3 100.09 12.0 100.0
66 88.075 100.0
AdjacentWithin 400mN/ANot StatedTotal
Valid
SystemMissingTotal
Frequency Percent Valid PercentCumulative
Percent
Second Building - Proximity to cultural facilities
1 1.3 11.1 11.11 1.3 11.1 22.23 4.0 33.3 55.64 5.3 44.4 100.09 12.0 100.0
66 88.075 100.0
Within BuildingAdjacentN/ANot StatedTotal
Valid
SystemMissingTotal
Frequency Percent Valid PercentCumulative
Percent
Second Building - Proximity to car parking
6 8.0 66.7 66.71 1.3 11.1 77.82 2.7 22.2 100.09 12.0 100.0
66 88.075 100.0
AdjacentN/ANot StatedTotal
Valid
SystemMissingTotal
Frequency Percent Valid PercentCumulative
Percent
Page 14

Second Building - Proximity to eating facilities
1 1.3 11.1 11.13 4.0 33.3 44.41 1.3 11.1 55.64 5.3 44.4 100.09 12.0 100.0
66 88.075 100.0
AdjacentWithin 400mN/ANot StatedTotal
Valid
SystemMissingTotal
Frequency Percent Valid PercentCumulative
Percent
Second Building - Proximity to school
1 1.3 11.1 11.12 2.7 22.2 33.32 2.7 22.2 55.64 5.3 44.4 100.09 12.0 100.0
66 88.075 100.0
AdjacentWithin 400mN/ANot StatedTotal
Valid
SystemMissingTotal
Frequency Percent Valid PercentCumulative
Percent
Second Building - Proximity to recreation/ sporting facility
1 1.3 11.1 11.11 1.3 11.1 22.22 2.7 22.2 44.45 6.7 55.6 100.09 12.0 100.0
66 88.075 100.0
AdjacentWithin 400mN/ANot StatedTotal
Valid
SystemMissingTotal
Frequency Percent Valid PercentCumulative
Percent
Second Building - Proximity to parks and gardens
1 1.3 11.1 11.14 5.3 44.4 55.61 1.3 11.1 66.73 4.0 33.3 100.09 12.0 100.0
66 88.075 100.0
AdjacentWithin 400mN/ANot StatedTotal
Valid
SystemMissingTotal
Frequency Percent Valid PercentCumulative
Percent
Second Building - Proximity to other facility (Distance)
9 12.0 100.0 100.066 88.075 100.0
N/AValidSystemMissing
Total
Frequency Percent Valid PercentCumulative
Percent
Page 15

Q7(ii)g Second Building - Rebuild at Existing Site
3 4.0 33.3 33.36 8.0 66.7 100.09 12.0 100.0
66 88.075 100.0
At Exisitng SiteNew BuildingTotal
Valid
SystemMissingTotal
Frequency Percent Valid PercentCumulative
Percent
Q7Aiii Unique New Buildings
2 2.7 100.0 100.073 97.375 100.0
New BuildingValidSystemMissing
Total
Frequency Percent Valid PercentCumulative
Percent
Q7(iii)b Third Building - Timeframe
1 1.3 50.0 50.01 1.3 50.0 100.02 2.7 100.0
73 97.375 100.0
2 - 4 Years> 4 YearsTotal
Valid
SystemMissingTotal
Frequency Percent Valid PercentCumulative
Percent
Third Building - Proposed Floor space (m2) (Banded)
2 2.7 100.0 100.073 97.375 100.0
500+ValidSystemMissing
Total
Frequency Percent Valid PercentCumulative
Percent
Third Building - Capital Budget ($) (Banded)
1 1.3 50.0 50.01 1.3 50.0 100.02 2.7 100.0
73 97.375 100.0
1000000 - 24999992500000 - 4999999Total
Valid
SystemMissingTotal
Frequency Percent Valid PercentCumulative
Percent
Third Building - Internal Fit-out Budget ($) (Banded)
2 2.7 100.0 100.073 97.375 100.0
<100000ValidSystemMissing
Total
Frequency Percent Valid PercentCumulative
Percent
Page 16

Third Building - Total Budget ($) (Banded)
1 1.3 50.0 50.01 1.3 50.0 100.02 2.7 100.0
73 97.375 100.0
1000000 - 19999992000000 - 4999999Total
Valid
SystemMissingTotal
Frequency Percent Valid PercentCumulative
Percent
Q7(iIi)e Third Building - Type of Facility Planned
2 2.7 100.0 100.073 97.375 100.0
Co-LocatedValidSystemMissing
Total
Frequency Percent Valid PercentCumulative
Percent
Third Building - Proximity to a shopping centre
1 1.3 50.0 50.01 1.3 50.0 100.02 2.7 100.0
73 97.375 100.0
Within 400mN/ATotal
Valid
SystemMissingTotal
Frequency Percent Valid PercentCumulative
Percent
Third Building - Proximity to a shopping or business precinct
2 2.7 100.0 100.073 97.375 100.0
Within 400mValidSystemMissing
Total
Frequency Percent Valid PercentCumulative
Percent
Third Building - Proximity to a main street
1 1.3 50.0 50.01 1.3 50.0 100.02 2.7 100.0
73 97.375 100.0
AdjacentWithin 400mTotal
Valid
SystemMissingTotal
Frequency Percent Valid PercentCumulative
Percent
Third Building - Proximity to a Council administration precinct
2 2.7 100.0 100.073 97.375 100.0
N/AValidSystemMissing
Total
Frequency Percent Valid PercentCumulative
Percent
Page 17

Third Building - Proximity to train station
2 2.7 100.0 100.073 97.375 100.0
N/AValidSystemMissing
Total
Frequency Percent Valid PercentCumulative
Percent
Third Building - Proximity to bus stop
2 2.7 100.0 100.073 97.375 100.0
Within 400mValidSystemMissing
Total
Frequency Percent Valid PercentCumulative
Percent
Third Building - Proximity to cultural facilities
1 1.3 50.0 50.01 1.3 50.0 100.02 2.7 100.0
73 97.375 100.0
Within BuildingN/ATotal
Valid
SystemMissingTotal
Frequency Percent Valid PercentCumulative
Percent
Third Building - Proximity to car parking
2 2.7 100.0 100.073 97.375 100.0
AdjacentValidSystemMissing
Total
Frequency Percent Valid PercentCumulative
Percent
Third Building - Proximity to eating facilities
1 1.3 50.0 50.01 1.3 50.0 100.02 2.7 100.0
73 97.375 100.0
AdjacentWithin 400mTotal
Valid
SystemMissingTotal
Frequency Percent Valid PercentCumulative
Percent
Third Building - Proximity to school
1 1.3 50.0 50.01 1.3 50.0 100.02 2.7 100.0
73 97.375 100.0
Within 400mN/ATotal
Valid
SystemMissingTotal
Frequency Percent Valid PercentCumulative
Percent
Page 18
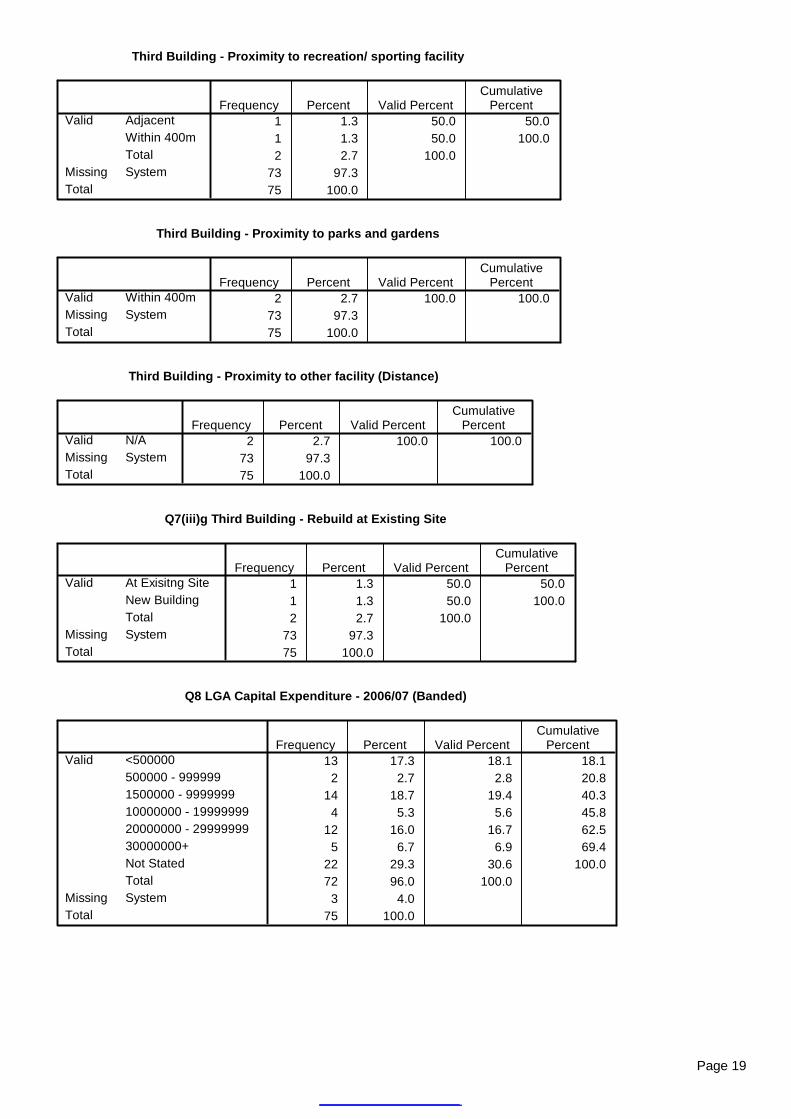
Third Building - Proximity to recreation/ sporting facility
1 1.3 50.0 50.01 1.3 50.0 100.02 2.7 100.0
73 97.375 100.0
AdjacentWithin 400mTotal
Valid
SystemMissingTotal
Frequency Percent Valid PercentCumulative
Percent
Third Building - Proximity to parks and gardens
2 2.7 100.0 100.073 97.375 100.0
Within 400mValidSystemMissing
Total
Frequency Percent Valid PercentCumulative
Percent
Third Building - Proximity to other facility (Distance)
2 2.7 100.0 100.073 97.375 100.0
N/AValidSystemMissing
Total
Frequency Percent Valid PercentCumulative
Percent
Q7(iii)g Third Building - Rebuild at Existing Site
1 1.3 50.0 50.01 1.3 50.0 100.02 2.7 100.0
73 97.375 100.0
At Exisitng SiteNew BuildingTotal
Valid
SystemMissingTotal
Frequency Percent Valid PercentCumulative
Percent
Q8 LGA Capital Expenditure - 2006/07 (Banded)
13 17.3 18.1 18.12 2.7 2.8 20.8
14 18.7 19.4 40.34 5.3 5.6 45.8
12 16.0 16.7 62.55 6.7 6.9 69.4
22 29.3 30.6 100.072 96.0 100.0
3 4.075 100.0
<500000500000 - 9999991500000 - 999999910000000 - 1999999920000000 - 2999999930000000+Not StatedTotal
Valid
SystemMissingTotal
Frequency Percent Valid PercentCumulative
Percent
Page 19

Q8 LGA Capital Expenditure - 2007/08 (Banded)
11 14.7 15.3 15.32 2.7 2.8 18.12 2.7 2.8 20.8
10 13.3 13.9 34.78 10.7 11.1 45.8
10 13.3 13.9 59.76 8.0 8.3 68.1
23 30.7 31.9 100.072 96.0 100.0
3 4.075 100.0
<500000500000 - 9999991000000 - 14999991500000 - 999999910000000 - 1999999920000000 - 2999999930000000+Not StatedTotal
Valid
SystemMissingTotal
Frequency Percent Valid PercentCumulative
Percent
Q8 LGA Capital Expenditure - 2008/09 (Banded)
8 10.7 11.1 11.11 1.3 1.4 12.51 1.3 1.4 13.98 10.7 11.1 25.09 12.0 12.5 37.5
10 13.3 13.9 51.43 4.0 4.2 55.6
32 42.7 44.4 100.072 96.0 100.0
3 4.075 100.0
<500000500000 - 9999991000000 - 14999991500000 - 999999910000000 - 1999999920000000 - 2999999930000000+Not StatedTotal
Valid
SystemMissingTotal
Frequency Percent Valid PercentCumulative
Percent
Q8 LGA Capital Expenditure - 2009/10 (Banded)
7 9.3 9.7 9.72 2.7 2.8 12.54 5.3 5.6 18.19 12.0 12.5 30.69 12.0 12.5 43.14 5.3 5.6 48.6
37 49.3 51.4 100.072 96.0 100.0
3 4.075 100.0
<5000001000000 - 14999991500000 - 999999910000000 - 1999999920000000 - 2999999930000000+Not StatedTotal
Valid
SystemMissingTotal
Frequency Percent Valid PercentCumulative
Percent
Page 20

Appendix 4: Tabulated data – Branch survey

Q9 Operating Hours per Week (Banded)
1 .4 .4 .419 7.8 7.8 8.241 16.8 16.8 25.046 18.9 18.9 43.9
109 44.7 44.7 88.528 11.5 11.5 100.0
244 100.0 100.0
0<1515 - 2930 - 3940 - 5960+Total
ValidFrequency Percent Valid Percent
CumulativePercent
Q10 Visits each week (Banded)
2 .8 .8 .856 23.0 23.0 23.933 13.5 13.6 37.461 25.0 25.1 62.665 26.6 26.7 89.320 8.2 8.2 97.5
5 2.0 2.1 99.61 .4 .4 100.0
243 99.6 100.01 .4
244 100.0
0<500500 - 9991000 - 24992500 - 49995000 - 74997500 - 89999000+Total
Valid
SystemMissingTotal
Frequency Percent Valid PercentCumulative
Percent
Q11 Gross Floor Area (m2) (Banded)
35 14.3 14.6 14.644 18.0 18.4 33.154 22.1 22.6 55.651 20.9 21.3 77.036 14.8 15.1 92.114 5.7 5.9 97.9
5 2.0 2.1 100.0239 98.0 100.0
5 2.0244 100.0
<150150 - 249250 - 499500 - 9991000 - 14991500 - 19992000+Total
Valid
SystemMissingTotal
Frequency Percent Valid PercentCumulative
Percent
Page 1

Q12a Functional Area - Collections (m2) (Banded)
1 .4 .4 .435 14.3 15.5 15.962 25.4 27.4 43.454 22.1 23.9 67.343 17.6 19.0 86.311 4.5 4.9 91.220 8.2 8.8 100.0
226 92.6 100.018 7.4
244 100.0
01 - 4950 - 149150 - 299300 - 449450 - 599600+Total
Valid
SystemMissingTotal
Frequency Percent Valid PercentCumulative
Percent
Q12B Functional Area - Reading/ Study (m2) (Banded)
17 7.0 7.6 7.647 19.3 21.1 28.745 18.4 20.2 48.973 29.9 32.7 81.628 11.5 12.6 94.2
9 3.7 4.0 98.24 1.6 1.8 100.0
223 91.4 100.021 8.6
244 100.0
01 - 2425 - 4950 - 199200 - 349350 - 499500+Total
Valid
SystemMissingTotal
Frequency Percent Valid PercentCumulative
Percent
Q12C Functional Area - Resource Areas (m2) (Banded)
9 3.7 4.0 4.025 10.2 11.1 15.1
100 41.0 44.4 59.650 20.5 22.2 81.831 12.7 13.8 95.6
8 3.3 3.6 99.12 .8 .9 100.0
225 92.2 100.019 7.8
244 100.0
01 - 910 - 4950 - 99100 - 199200 - 299300+Total
Valid
SystemMissingTotal
Frequency Percent Valid PercentCumulative
Percent
Page 2

Q12D Functional Area - Staff Areas (m2) (Banded)
8 3.3 3.6 3.665 26.6 29.5 33.246 18.9 20.9 54.192 37.7 41.8 95.9
5 2.0 2.3 98.23 1.2 1.4 99.51 .4 .5 100.0
220 90.2 100.024 9.8
244 100.0
01 - 2425 - 4950 - 299300 - 499500 - 799800+Total
Valid
SystemMissingTotal
Frequency Percent Valid PercentCumulative
Percent
Q12E Functional Area - Amenities Area (m2) (Banded)
10 4.1 4.7 4.750 20.5 23.6 28.346 18.9 21.7 50.072 29.5 34.0 84.019 7.8 9.0 92.910 4.1 4.7 97.6
5 2.0 2.4 100.0212 86.9 100.0
32 13.1244 100.0
01 - 1920 - 4950 - 149150 - 299300 - 449450+Total
Valid
SystemMissingTotal
Frequency Percent Valid PercentCumulative
Percent
Q12F Functional Area - Other (m2) (Banded)
90 36.9 62.1 62.18 3.3 5.5 67.6
14 5.7 9.7 77.27 2.9 4.8 82.1
10 4.1 6.9 89.016 6.6 11.0 100.0
145 59.4 100.099 40.6
244 100.0
01 - 1415 - 4950 - 99100 - 199200+Total
Valid
SystemMissingTotal
Frequency Percent Valid PercentCumulative
Percent
Q13A Number of Levels
205 84.0 84.4 84.431 12.7 12.8 97.1
7 2.9 2.9 100.0243 99.6 100.0
1 .4244 100.0
123Total
Valid
SystemMissingTotal
Frequency Percent Valid PercentCumulative
Percent
Page 3

Q13B Levels Publicly Accessible
213 87.3 87.7 87.722 9.0 9.1 96.7
4 1.6 1.6 98.44 1.6 1.6 100.0
243 99.6 100.01 .4
244 100.0
123Not ProvidedTotal
Valid
SystemMissingTotal
Frequency Percent Valid PercentCumulative
Percent
Q13C Ground Floor with Street Frontage
230 94.3 94.7 94.79 3.7 3.7 98.44 1.6 1.6 100.0
243 99.6 100.01 .4
244 100.0
YesNoNot ProvidedTotal
Valid
SystemMissingTotal
Frequency Percent Valid PercentCumulative
Percent
Q13D Lifts?
207 84.8 85.2 85.23 1.2 1.2 86.49 3.7 3.7 90.1
24 9.8 9.9 100.0
243 99.6 100.01 .4
244 100.0
NoYes, for patronsYes, for goodsYes, both passangersand goodsTotal
Valid
SystemMissingTotal
Frequency Percent Valid PercentCumulative
Percent
Q13E Do Lifts Service all Levels
33 13.5 91.7 91.73 1.2 8.3 100.0
36 14.8 100.0208 85.2244 100.0
YesNoTotal
Valid
SystemMissingTotal
Frequency Percent Valid PercentCumulative
Percent
Q14A Provision of Children's Storytelling Area
15 6.1 6.2 6.293 38.1 38.3 44.4
135 55.3 55.6 100.0243 99.6 100.0
1 .4244 100.0
NoYes, ExclusiveYes, SharedTotal
Valid
SystemMissingTotal
Frequency Percent Valid PercentCumulative
Percent
Page 4

Q14B Provision of Young Adult Area
71 29.1 29.2 29.267 27.5 27.6 56.8
105 43.0 43.2 100.0243 99.6 100.0
1 .4244 100.0
NoYes, ExclusiveYes, SharedTotal
Valid
SystemMissingTotal
Frequency Percent Valid PercentCumulative
Percent
Q14C Provision of Specialist Genre Collection
134 54.9 55.1 55.154 22.1 22.2 77.455 22.5 22.6 100.0
243 99.6 100.01 .4
244 100.0
NoYes, ExclusiveYes, SharedTotal
Valid
SystemMissingTotal
Frequency Percent Valid PercentCumulative
Percent
Q14D Provision of Specialist Room, local and Family History
187 76.6 77.0 77.038 15.6 15.6 92.618 7.4 7.4 100.0
243 99.6 100.01 .4
244 100.0
NoYes, ExclusiveYes, SharedTotal
Valid
SystemMissingTotal
Frequency Percent Valid PercentCumulative
Percent
Q14E Provision of Multi-purpose Room
133 54.5 54.7 54.755 22.5 22.6 77.455 22.5 22.6 100.0
243 99.6 100.01 .4
244 100.0
NoYes, ExclusiveYes, SharedTotal
Valid
SystemMissingTotal
Frequency Percent Valid PercentCumulative
Percent
Q14F Provision of Bookshop, Coffeeshop, Gift Shop
240 98.4 98.8 98.82 .8 .8 99.61 .4 .4 100.0
243 99.6 100.01 .4
244 100.0
NoYes, ExclusiveYes, SharedTotal
Valid
SystemMissingTotal
Frequency Percent Valid PercentCumulative
Percent
Page 5

Q14G Provision of Toy Library
235 96.3 96.7 96.75 2.0 2.1 98.83 1.2 1.2 100.0
243 99.6 100.01 .4
244 100.0
NoYes, ExclusiveYes, SharedTotal
Valid
SystemMissingTotal
Frequency Percent Valid PercentCumulative
Percent
Q14H Provision of Community Services, Bank Services, Council Customer Service
208 85.2 85.6 85.612 4.9 4.9 90.523 9.4 9.5 100.0
243 99.6 100.01 .4
244 100.0
NoYes, ExclusiveYes, SharedTotal
Valid
SystemMissingTotal
Frequency Percent Valid PercentCumulative
Percent
Q14I Provision of Storage Area for Archival Materials
175 71.7 72.0 72.043 17.6 17.7 89.725 10.2 10.3 100.0
243 99.6 100.01 .4
244 100.0
NoYes, ExclusiveYes, SharedTotal
Valid
SystemMissingTotal
Frequency Percent Valid PercentCumulative
Percent
Q14J Provision of Office Space
54 22.1 22.2 22.2164 67.2 67.5 89.7
25 10.2 10.3 100.0243 99.6 100.0
1 .4244 100.0
NoYes, ExclusiveYes, SharedTotal
Valid
SystemMissingTotal
Frequency Percent Valid PercentCumulative
Percent
Q14K Provision of Exhibition Space
144 59.0 59.3 59.322 9.0 9.1 68.377 31.6 31.7 100.0
243 99.6 100.01 .4
244 100.0
NoYes, ExclusiveYes, SharedTotal
Valid
SystemMissingTotal
Frequency Percent Valid PercentCumulative
Percent
Page 6

Q14L Provision of Mobile Library Services Area
225 92.2 92.6 92.65 2.0 2.1 94.7
13 5.3 5.3 100.0243 99.6 100.0
1 .4244 100.0
NoYes, ExclusiveYes, SharedTotal
Valid
SystemMissingTotal
Frequency Percent Valid PercentCumulative
Percent
Q14M Provision of Computer Lab/ Internet Area
52 21.3 21.4 21.490 36.9 37.0 58.4
101 41.4 41.6 100.0243 99.6 100.0
1 .4244 100.0
NoYes, ExclusiveYes, SharedTotal
Valid
SystemMissingTotal
Frequency Percent Valid PercentCumulative
Percent
Q14N Provision of Wireless Internet
220 90.2 90.5 90.56 2.5 2.5 93.0
17 7.0 7.0 100.0243 99.6 100.0
1 .4244 100.0
NoYes, ExclusiveYes, SharedTotal
Valid
SystemMissingTotal
Frequency Percent Valid PercentCumulative
Percent
Q14O Provision of Staff Lunchroom
48 19.7 19.8 19.8137 56.1 56.4 76.1
58 23.8 23.9 100.0243 99.6 100.0
1 .4244 100.0
NoYes, ExclusiveYes, SharedTotal
Valid
SystemMissingTotal
Frequency Percent Valid PercentCumulative
Percent
Q14P Provision of Other Space - Shared or Exclusive?
220 90.2 90.5 90.518 7.4 7.4 97.9
5 2.0 2.1 100.0243 99.6 100.0
1 .4244 100.0
NoYes, ExclusiveYes, SharedTotal
Valid
SystemMissingTotal
Frequency Percent Valid PercentCumulative
Percent
Page 7

Q14Q Provision of Other Space - Shared or Exclusive?
30 12.3 83.3 83.34 1.6 11.1 94.42 .8 5.6 100.0
36 14.8 100.0208 85.2244 100.0
NoYes, ExclusiveYes, SharedTotal
Valid
SystemMissingTotal
Frequency Percent Valid PercentCumulative
Percent
Q15 Ability to divide multi-purpose areas
37 15.2 15.2 15.2150 61.5 61.7 77.0
56 23.0 23.0 100.0243 99.6 100.0
1 .4244 100.0
YesNoDon't Have AnyTotal
Valid
SystemMissingTotal
Frequency Percent Valid PercentCumulative
Percent
Q16A Co-located/ Integrated?
127 52.0 52.3 52.3116 47.5 47.7 100.0243 99.6 100.0
1 .4244 100.0
YesNo FreestandingTotal
Valid
SystemMissingTotal
Frequency Percent Valid PercentCumulative
Percent
Q16B Other Uses - Private sector businesses (eg shops)
13 5.3 10.2 10.2114 46.7 89.8 100.0127 52.0 100.0117 48.0244 100.0
YesNoTotal
Valid
SystemMissingTotal
Frequency Percent Valid PercentCumulative
Percent
Q16B Other Uses - Child care
6 2.5 4.7 4.7121 49.6 95.3 100.0127 52.0 100.0117 48.0244 100.0
YesNoTotal
Valid
SystemMissingTotal
Frequency Percent Valid PercentCumulative
Percent
Page 8
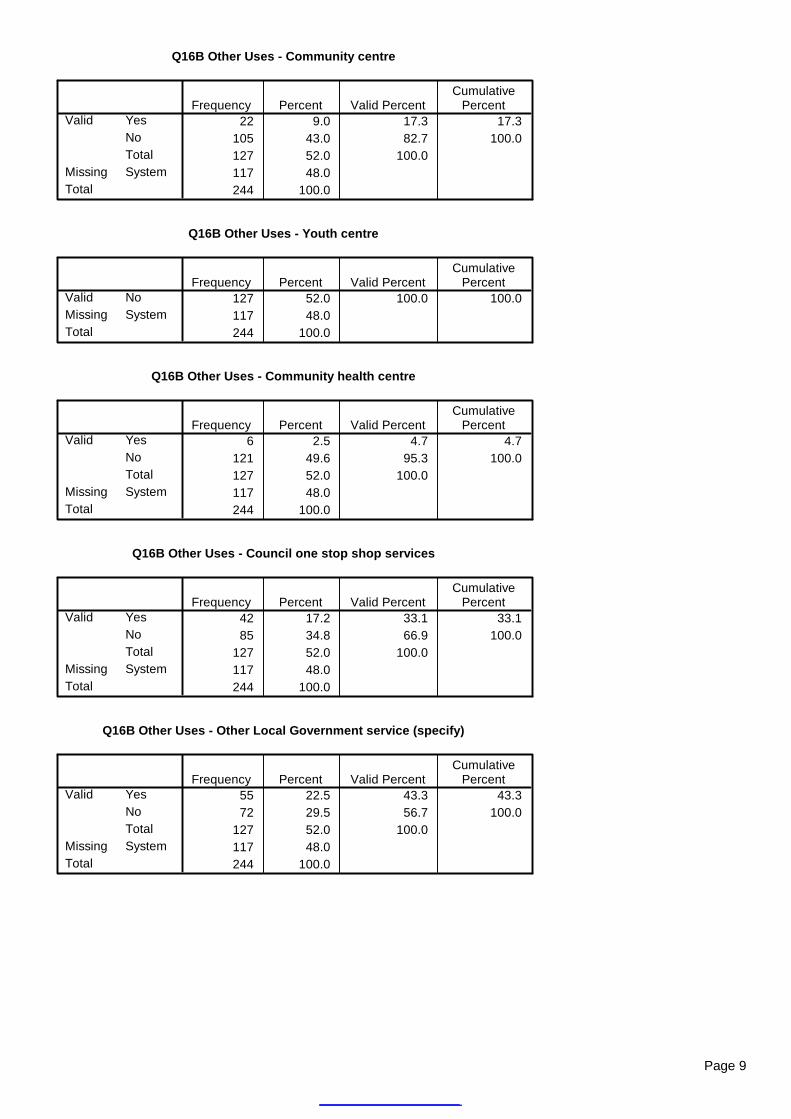
Q16B Other Uses - Community centre
22 9.0 17.3 17.3105 43.0 82.7 100.0127 52.0 100.0117 48.0244 100.0
YesNoTotal
Valid
SystemMissingTotal
Frequency Percent Valid PercentCumulative
Percent
Q16B Other Uses - Youth centre
127 52.0 100.0 100.0117 48.0244 100.0
NoValidSystemMissing
Total
Frequency Percent Valid PercentCumulative
Percent
Q16B Other Uses - Community health centre
6 2.5 4.7 4.7121 49.6 95.3 100.0127 52.0 100.0117 48.0244 100.0
YesNoTotal
Valid
SystemMissingTotal
Frequency Percent Valid PercentCumulative
Percent
Q16B Other Uses - Council one stop shop services
42 17.2 33.1 33.185 34.8 66.9 100.0
127 52.0 100.0117 48.0244 100.0
YesNoTotal
Valid
SystemMissingTotal
Frequency Percent Valid PercentCumulative
Percent
Q16B Other Uses - Other Local Government service (specify)
55 22.5 43.3 43.372 29.5 56.7 100.0
127 52.0 100.0117 48.0244 100.0
YesNoTotal
Valid
SystemMissingTotal
Frequency Percent Valid PercentCumulative
Percent
Page 9

Q16B Other Uses - Other State Government service (specify)
14 5.7 11.0 11.0113 46.3 89.0 100.0127 52.0 100.0117 48.0244 100.0
YesNoTotal
Valid
SystemMissingTotal
Frequency Percent Valid PercentCumulative
Percent
Q16B Other Uses - Other Federal Government service (specify)
1 .4 .8 .8126 51.6 99.2 100.0127 52.0 100.0117 48.0244 100.0
YesNoTotal
Valid
SystemMissingTotal
Frequency Percent Valid PercentCumulative
Percent
Q16B Other Uses - Other Service (specify)
43 17.6 33.9 33.984 34.4 66.1 100.0
127 52.0 100.0117 48.0244 100.0
YesNoTotal
Valid
SystemMissingTotal
Frequency Percent Valid PercentCumulative
Percent
Q16C Percentage Area Dedicated to Library Functions (Banded)
22 9.0 17.2 17.244 18.0 34.4 51.630 12.3 23.4 75.016 6.6 12.5 87.515 6.1 11.7 99.2
1 .4 .8 100.0128 52.5 100.0116 47.5244 100.0
<2525 - 4950 - 7475 - 8990+Data Not ProvidedTotal
Valid
SystemMissingTotal
Frequency Percent Valid PercentCumulative
Percent
Q17A Joint use or mulit use facility?
24 9.8 9.8 9.8220 90.2 90.2 100.0244 100.0 100.0
YesNoTotal
ValidFrequency Percent Valid Percent
CumulativePercent
Page 10

Q18A Owner of Building
202 82.8 83.1 83.15 2.0 2.1 85.2
26 10.7 10.7 95.9
6 2.5 2.5 98.4
2 .8 .8 99.2
1 .4 .4 99.6
1 .4 .4 100.0
243 99.6 100.01 .4
244 100.0
CouncilCrown LandPrivate OwnerState GovernmentBody (Specified)Community (eg viaTrustee) (Specified)RSLPrivate School(Specified)Total
Valid
SystemMissingTotal
Frequency Percent Valid PercentCumulative
Percent
Q18B Leasor of Building
54 22.1 56.3 56.319 7.8 19.8 76.0
3 1.2 3.1 79.25 2.0 5.2 84.4
15 6.1 15.6 100.0
96 39.3 100.0148 60.7244 100.0
Not LeasedCouncilPrivate OwnerOther, SpecifyCouncil provides buildingfree to Library ServiceTotal
Valid
SystemMissingTotal
Frequency Percent Valid PercentCumulative
Percent
Q18C Cost of Lease (Banded)
23 9.4 46.9 46.94 1.6 8.2 55.12 .8 4.1 59.23 1.2 6.1 65.33 1.2 6.1 71.44 1.6 8.2 79.63 1.2 6.1 85.74 1.6 8.2 93.93 1.2 6.1 100.0
49 20.1 100.0195 79.9244 100.0
01 - 9992500 - 49995000 - 999910000 - 2499925000 - 4999950000 - 99999100000 +Data not providedTotal
Valid
SystemMissingTotal
Frequency Percent Valid PercentCumulative
Percent
Page 11

Q18C Outgoings included in Lease?
7 2.9 14.3 14.330 12.3 61.2 75.512 4.9 24.5 100.049 20.1 100.0
195 79.9244 100.0
YesNoData not providedTotal
Valid
SystemMissingTotal
Frequency Percent Valid PercentCumulative
Percent
Q19 Year original building constructed
18 7.4 7.4 7.46 2.5 2.5 9.9
14 5.7 5.8 15.620 8.2 8.2 23.981 33.2 33.3 57.242 17.2 17.3 74.531 12.7 12.8 87.231 12.7 12.8 100.0
243 99.6 100.01 .4
244 100.0
pre 19001900-19191920-19391940-19591960-19791980-19891990-2000post 2000Total
Valid
SystemMissingTotal
Frequency Percent Valid PercentCumulative
Percent
Q20 Heritage Listed Building?
30 12.3 12.3 12.3212 86.9 86.9 99.2
2 .8 .8 100.0244 100.0 100.0
YesNoData not providedTotal
ValidFrequency Percent Valid Percent
CumulativePercent
Q21A Purpose Built Building?
147 60.2 60.5 60.596 39.3 39.5 100.0
243 99.6 100.01 .4
244 100.0
YesNoTotal
Valid
SystemMissingTotal
Frequency Percent Valid PercentCumulative
Percent
Page 12

Q21B Year Library Established in Building (Banded)
1 .4 1.1 1.16 2.5 6.3 7.4
12 4.9 12.6 20.015 6.1 15.8 35.832 13.1 33.7 69.511 4.5 11.6 81.112 4.9 12.6 93.7
6 2.5 6.3 100.095 38.9 100.0
149 61.1244 100.0
< 19001950 - 19691970 - 19791980 - 19891990 - 19992000 - 20042005+Data not providedTotal
Valid
SystemMissingTotal
Frequency Percent Valid PercentCumulative
Percent
Q21C Original Purpose of Building - Unknown
5 2.0 5.2 5.291 37.3 94.8 100.096 39.3 100.0
148 60.7244 100.0
UnknownKnownTotal
Valid
SystemMissingTotal
Frequency Percent Valid PercentCumulative
Percent
Q22A Year of Last Major Building Refurbishment (Banded)
96 39.3 41.4 41.4
5 2.0 2.2 43.5
2 .8 .9 44.45 2.0 2.2 46.6
37 15.2 15.9 62.551 20.9 22.0 84.536 14.8 15.5 100.0
232 95.1 100.012 4.9
244 100.0
No RefurbishmentRefurbished, DateUnknown1970 - 19791980 - 19891990 - 19992000 - 20042005+Total
Valid
SystemMissingTotal
Frequency Percent Valid PercentCumulative
Percent
Page 13

Q22A Cost of last refurbishmnet (Banded)
27 11.1 19.7 19.720 8.2 14.6 34.311 4.5 8.0 42.326 10.7 19.0 61.319 7.8 13.9 75.2
8 3.3 5.8 81.07 2.9 5.1 86.18 3.3 5.8 92.05 2.0 3.6 95.66 2.5 4.4 100.0
137 56.1 100.0107 43.9244 100.0
Not Stated<5000050000 - 99999100000 - 249999250000 - 499999500000 - 749999750000 - 9999991000000 - 14999991500000 - 19999992000000+Total
Valid
SystemMissingTotal
Frequency Percent Valid PercentCumulative
Percent
Q22B Refurbishment Undertaken - Internal reorganisation of space
31 12.7 22.6 22.6106 43.4 77.4 100.0137 56.1 100.0107 43.9244 100.0
Not UndertakenUndertakenTotal
Valid
SystemMissingTotal
Frequency Percent Valid PercentCumulative
Percent
Q22B Refurbishment Undertaken - Additional floor space
76 31.1 55.5 55.561 25.0 44.5 100.0
137 56.1 100.0107 43.9244 100.0
Not UndertakenUndertakenTotal
Valid
SystemMissingTotal
Frequency Percent Valid PercentCumulative
Percent
Q22B Refurbishment Undertaken - Decreased floor space
131 53.7 95.6 95.66 2.5 4.4 100.0
137 56.1 100.0107 43.9244 100.0
Not UndertakenUndertakenTotal
Valid
SystemMissingTotal
Frequency Percent Valid PercentCumulative
Percent
Page 14

Q22B Refurbishment Undertaken - Internal structural alterations
43 17.6 31.4 31.494 38.5 68.6 100.0
137 56.1 100.0107 43.9244 100.0
Not UndertakenUndertakenTotal
Valid
SystemMissingTotal
Frequency Percent Valid PercentCumulative
Percent
Q22B Refurbishment Undertaken - Improved collection areas
56 23.0 40.9 40.981 33.2 59.1 100.0
137 56.1 100.0107 43.9244 100.0
Not UndertakenUndertakenTotal
Valid
SystemMissingTotal
Frequency Percent Valid PercentCumulative
Percent
Q22B Refurbishment Undertaken - Improved reading and study areas
62 25.4 45.3 45.375 30.7 54.7 100.0
137 56.1 100.0107 43.9244 100.0
Not UndertakenUndertakenTotal
Valid
SystemMissingTotal
Frequency Percent Valid PercentCumulative
Percent
Q22B Refurbishment Undertaken - Improved resource areas
62 25.4 45.3 45.375 30.7 54.7 100.0
137 56.1 100.0107 43.9244 100.0
Not UndertakenUndertakenTotal
Valid
SystemMissingTotal
Frequency Percent Valid PercentCumulative
Percent
Q22B Refurbishment Undertaken - Improved staff areas
73 29.9 53.3 53.364 26.2 46.7 100.0
137 56.1 100.0107 43.9244 100.0
Not UndertakenUndertakenTotal
Valid
SystemMissingTotal
Frequency Percent Valid PercentCumulative
Percent
Page 15

Q22B Refurbishment Undertaken - Improved amenities areas
89 36.5 65.0 65.048 19.7 35.0 100.0
137 56.1 100.0107 43.9244 100.0
Not UndertakenUndertakenTotal
Valid
SystemMissingTotal
Frequency Percent Valid PercentCumulative
Percent
Q22B Refurbishment Undertaken - Improvements to other areas (specify)
127 52.0 92.7 92.710 4.1 7.3 100.0
137 56.1 100.0107 43.9244 100.0
Not UndertakenUndertakenTotal
Valid
SystemMissingTotal
Frequency Percent Valid PercentCumulative
Percent
Q22B Refurbishment Undertaken - Improved shelving
59 24.2 43.1 43.178 32.0 56.9 100.0
137 56.1 100.0107 43.9244 100.0
Not UndertakenUndertakenTotal
Valid
SystemMissingTotal
Frequency Percent Valid PercentCumulative
Percent
Q22B Refurbishment Undertaken - Building services upgrade
116 47.5 84.7 84.721 8.6 15.3 100.0
137 56.1 100.0107 43.9244 100.0
Not UndertakenUndertakenTotal
Valid
SystemMissingTotal
Frequency Percent Valid PercentCumulative
Percent
Q22B Refurbishment Undertaken - Fire safety improvements
101 41.4 73.7 73.736 14.8 26.3 100.0
137 56.1 100.0107 43.9244 100.0
Not UndertakenUndertakenTotal
Valid
SystemMissingTotal
Frequency Percent Valid PercentCumulative
Percent
Page 16

Q22B Refurbishment Undertaken - Improved disabled access
68 27.9 49.6 49.669 28.3 50.4 100.0
137 56.1 100.0107 43.9244 100.0
Not UndertakenUndertakenTotal
Valid
SystemMissingTotal
Frequency Percent Valid PercentCumulative
Percent
Q22B Refurbishment Undertaken - Energy consumption improvements
117 48.0 85.4 85.420 8.2 14.6 100.0
137 56.1 100.0107 43.9244 100.0
Not UndertakenUndertakenTotal
Valid
SystemMissingTotal
Frequency Percent Valid PercentCumulative
Percent
Q22B Refurbishment Undertaken - Increased computer access
72 29.5 52.6 52.665 26.6 47.4 100.0
137 56.1 100.0107 43.9244 100.0
Not UndertakenUndertakenTotal
Valid
SystemMissingTotal
Frequency Percent Valid PercentCumulative
Percent
Q22B Refurbishment Undertaken - Wireless internet
133 54.5 97.1 97.14 1.6 2.9 100.0
137 56.1 100.0107 43.9244 100.0
Not UndertakenUndertakenTotal
Valid
SystemMissingTotal
Frequency Percent Valid PercentCumulative
Percent
Q22B Refurbishment Undertaken - Carpeting or other floor covering
36 14.8 26.3 26.3101 41.4 73.7 100.0137 56.1 100.0107 43.9244 100.0
Not UndertakenUndertakenTotal
Valid
SystemMissingTotal
Frequency Percent Valid PercentCumulative
Percent
Page 17

Q22B Refurbishment Undertaken - Painting
31 12.7 22.6 22.6106 43.4 77.4 100.0137 56.1 100.0107 43.9244 100.0
Not UndertakenUndertakenTotal
Valid
SystemMissingTotal
Frequency Percent Valid PercentCumulative
Percent
Q22B Refurbishment Undertaken - Building materials - external cladding
112 45.9 81.8 81.825 10.2 18.2 100.0
137 56.1 100.0107 43.9244 100.0
Not UndertakenUndertakenTotal
Valid
SystemMissingTotal
Frequency Percent Valid PercentCumulative
Percent
Q22B Refurbishment Undertaken - Heating
86 35.2 62.8 62.851 20.9 37.2 100.0
137 56.1 100.0107 43.9244 100.0
Not UndertakenUndertakenTotal
Valid
SystemMissingTotal
Frequency Percent Valid PercentCumulative
Percent
Q22B Refurbishment Undertaken - Air Conditioning
76 31.1 55.5 55.561 25.0 44.5 100.0
137 56.1 100.0107 43.9244 100.0
Not UndertakenUndertakenTotal
Valid
SystemMissingTotal
Frequency Percent Valid PercentCumulative
Percent
Q22B Refurbishment Undertaken - Other Works (specify)
112 45.9 81.8 81.825 10.2 18.2 100.0
137 56.1 100.0107 43.9244 100.0
Not UndertakenUndertakenTotal
Valid
SystemMissingTotal
Frequency Percent Valid PercentCumulative
Percent
Page 18

Q23 Compliance Audit with BCA - Last 5 Years
137 56.1 56.4 56.480 32.8 32.9 89.326 10.7 10.7 100.0
243 99.6 100.01 .4
244 100.0
YesNoDon't KnowTotal
Valid
SystemMissingTotal
Frequency Percent Valid PercentCumulative
Percent
Q23 Year BCA Compliance Audit undertaken
26 10.7 19.0 19.05 2.0 3.6 22.61 .4 .7 23.42 .8 1.5 24.8
10 4.1 7.3 32.110 4.1 7.3 39.434 13.9 24.8 64.224 9.8 17.5 81.825 10.2 18.2 100.0
137 56.1 100.0107 43.9244 100.0
Year not provided19982001200220032004200520062007Total
Valid
SystemMissingTotal
Frequency Percent Valid PercentCumulative
Percent
Q23 Year BCA Compliance Audit undertaken (Banded)
26 10.7 19.0 19.05 2.0 3.6 22.63 1.2 2.2 24.8
54 22.1 39.4 64.224 9.8 17.5 81.825 10.2 18.2 100.0
137 56.1 100.0107 43.9244 100.0
Year not Provided<20002000 - 20022003 - 200520062007Total
Valid
SystemMissingTotal
Frequency Percent Valid PercentCumulative
Percent
Q24 Compliance with Fire Rating Assessments
183 75.0 75.3 75.37 2.9 2.9 78.2
35 14.3 14.4 92.6
18 7.4 7.4 100.0243 99.6 100.0
1 .4244 100.0
YesNoHaven't UndertakenAn AssessmentDon't KnowTotal
Valid
SystemMissingTotal
Frequency Percent Valid PercentCumulative
Percent
Page 19

Q25A Compliance with Access and Mobility Standards
161 66.0 66.3 66.331 12.7 12.8 79.050 20.5 20.6 99.6
1 .4 .4 100.0243 99.6 100.0
1 .4244 100.0
YesNoDon't KnowNo Requirement ToTotal
Valid
SystemMissingTotal
Frequency Percent Valid PercentCumulative
Percent
Q25B Access Audit Undertaken
154 63.1 63.4 63.467 27.5 27.6 90.922 9.0 9.1 100.0
243 99.6 100.01 .4
244 100.0
YesNoDon't KnowTotal
Valid
SystemMissingTotal
Frequency Percent Valid PercentCumulative
Percent
Q25B Year Access Audit Undertaken (Banded)
20 8.2 12.9 12.911 4.5 7.1 20.016 6.6 10.3 30.352 21.3 33.5 63.945 18.4 29.0 92.911 4.5 7.1 100.0
155 63.5 100.089 36.5
244 100.0
Year not Provided<20002000 - 20022003 - 200520062007Total
Valid
SystemMissingTotal
Frequency Percent Valid PercentCumulative
Percent
Q25C Main Entrance Wheelchair Accessible
224 91.8 92.2 92.219 7.8 7.8 100.0
243 99.6 100.01 .4
244 100.0
YesNoTotal
Valid
SystemMissingTotal
Frequency Percent Valid PercentCumulative
Percent
Page 20

Q25D Are all levels wheelchair Accessible
27 11.1 11.1 11.17 2.9 2.9 14.0
208 85.2 85.6 99.6
1 .4 .4 100.0243 99.6 100.0
1 .4244 100.0
YesNoNot over morethan one levelData not ProvidedTotal
Valid
SystemMissingTotal
Frequency Percent Valid PercentCumulative
Percent
Q25E Wheelchair Accessible parking near main entrance
167 68.4 69.0 69.075 30.7 31.0 100.0
242 99.2 100.02 .8
244 100.0
YesNoTotal
Valid
SystemMissingTotal
Frequency Percent Valid PercentCumulative
Percent
Q25E Number of Wheelchair Accessible Parking Bays (Banded)
76 31.1 45.2 45.273 29.9 43.5 88.7
8 3.3 4.8 93.52 .8 1.2 94.69 3.7 5.4 100.0
168 68.9 100.076 31.1
244 100.0
12 - 45 - 910 +Number Not StatedTotal
Valid
SystemMissingTotal
Frequency Percent Valid PercentCumulative
Percent
Q25F Aisle Space Provides Wheelchair Access
204 83.6 84.0 84.039 16.0 16.0 100.0
243 99.6 100.01 .4
244 100.0
YesNoTotal
Valid
SystemMissingTotal
Frequency Percent Valid PercentCumulative
Percent
Q25G Wheelchair Accessible Toilet
176 72.1 72.4 72.467 27.5 27.6 100.0
243 99.6 100.01 .4
244 100.0
YesNoTotal
Valid
SystemMissingTotal
Frequency Percent Valid PercentCumulative
Percent
Page 21

Q26 Rating of Building Lighting Levels
78 32.0 32.1 32.1137 56.1 56.4 88.5
28 11.5 11.5 100.0243 99.6 100.0
1 .4244 100.0
ExcellentSatisfactoryPoorTotal
Valid
SystemMissingTotal
Frequency Percent Valid PercentCumulative
Percent
Q27A Rating of Internal Public Information Signage
35 14.3 14.4 14.4154 63.1 63.4 77.8
54 22.1 22.2 100.0243 99.6 100.0
1 .4244 100.0
ExcellentSatisfactoryPoorTotal
Valid
SystemMissingTotal
Frequency Percent Valid PercentCumulative
Percent
Q27B Rating of External Public Information Signage
34 13.9 14.0 14.0128 52.5 52.7 66.7
81 33.2 33.3 100.0243 99.6 100.0
1 .4244 100.0
ExcellentSatisfactoryPoorTotal
Valid
SystemMissingTotal
Frequency Percent Valid PercentCumulative
Percent
Q28A Provides Energy Reduction Measure - Natural light
46 18.9 18.9 18.9197 80.7 81.1 100.0243 99.6 100.0
1 .4244 100.0
NoYesTotal
Valid
SystemMissingTotal
Frequency Percent Valid PercentCumulative
Percent
Q28A Provides Energy Reduction Measure - Energy efficient light globes
176 72.1 72.4 72.467 27.5 27.6 100.0
243 99.6 100.01 .4
244 100.0
NoYesTotal
Valid
SystemMissingTotal
Frequency Percent Valid PercentCumulative
Percent
Page 22

Q28A Provides Energy Reduction Measure - Solar panels
239 98.0 98.4 98.44 1.6 1.6 100.0
243 99.6 100.01 .4
244 100.0
NoYesTotal
Valid
SystemMissingTotal
Frequency Percent Valid PercentCumulative
Percent
Q28A Provides Energy Reduction Measure - Water efficient taps
222 91.0 91.4 91.421 8.6 8.6 100.0
243 99.6 100.01 .4
244 100.0
NoYesTotal
Valid
SystemMissingTotal
Frequency Percent Valid PercentCumulative
Percent
Q28A Provides Energy Reduction Measure - Grey water usage
242 99.2 99.6 99.61 .4 .4 100.0
243 99.6 100.01 .4
244 100.0
NoYesTotal
Valid
SystemMissingTotal
Frequency Percent Valid PercentCumulative
Percent
Q28A Provides Energy Reduction Measure - Energy efficient air-conditioning/heating
206 84.4 84.8 84.837 15.2 15.2 100.0
243 99.6 100.01 .4
244 100.0
NoYesTotal
Valid
SystemMissingTotal
Frequency Percent Valid PercentCumulative
Percent
Q28A Provides Energy Reduction Measure - Facilities for recycling
78 32.0 32.1 32.1165 67.6 67.9 100.0243 99.6 100.0
1 .4244 100.0
NoYesTotal
Valid
SystemMissingTotal
Frequency Percent Valid PercentCumulative
Percent
Page 23
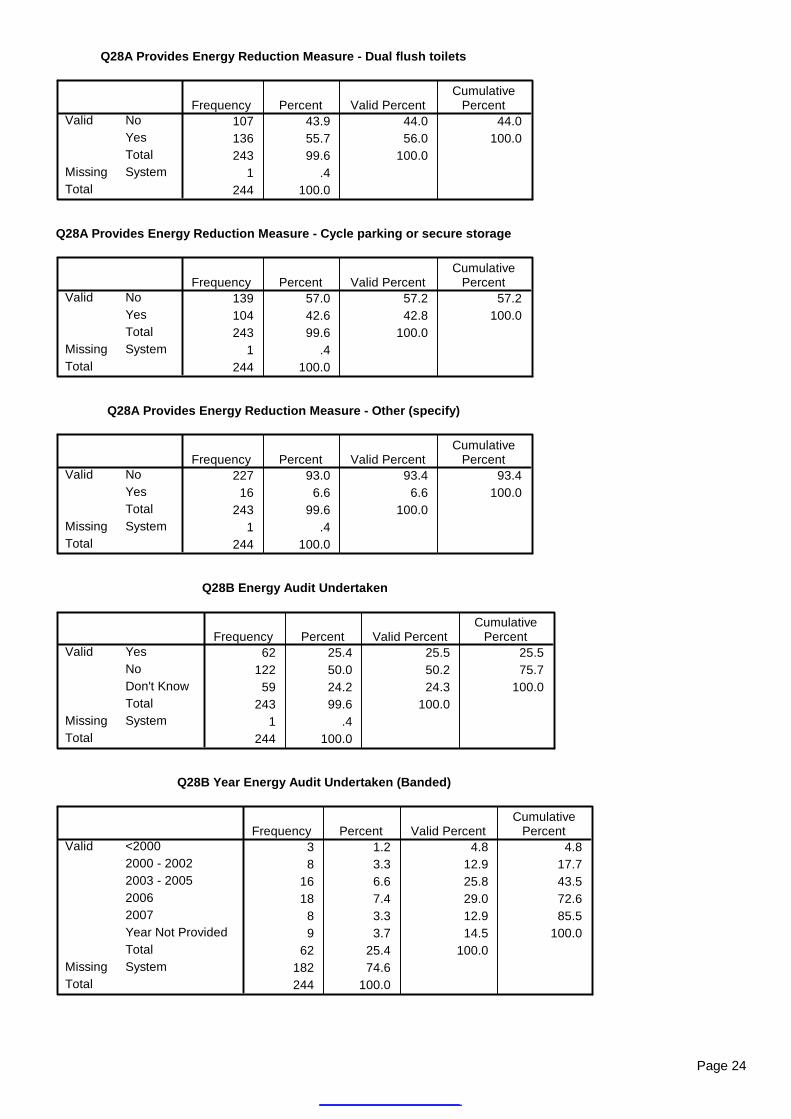
Q28A Provides Energy Reduction Measure - Dual flush toilets
107 43.9 44.0 44.0136 55.7 56.0 100.0243 99.6 100.0
1 .4244 100.0
NoYesTotal
Valid
SystemMissingTotal
Frequency Percent Valid PercentCumulative
Percent
Q28A Provides Energy Reduction Measure - Cycle parking or secure storage
139 57.0 57.2 57.2104 42.6 42.8 100.0243 99.6 100.0
1 .4244 100.0
NoYesTotal
Valid
SystemMissingTotal
Frequency Percent Valid PercentCumulative
Percent
Q28A Provides Energy Reduction Measure - Other (specify)
227 93.0 93.4 93.416 6.6 6.6 100.0
243 99.6 100.01 .4
244 100.0
NoYesTotal
Valid
SystemMissingTotal
Frequency Percent Valid PercentCumulative
Percent
Q28B Energy Audit Undertaken
62 25.4 25.5 25.5122 50.0 50.2 75.7
59 24.2 24.3 100.0243 99.6 100.0
1 .4244 100.0
YesNoDon't KnowTotal
Valid
SystemMissingTotal
Frequency Percent Valid PercentCumulative
Percent
Q28B Year Energy Audit Undertaken (Banded)
3 1.2 4.8 4.88 3.3 12.9 17.7
16 6.6 25.8 43.518 7.4 29.0 72.6
8 3.3 12.9 85.59 3.7 14.5 100.0
62 25.4 100.0182 74.6244 100.0
<20002000 - 20022003 - 200520062007Year Not ProvidedTotal
Valid
SystemMissingTotal
Frequency Percent Valid PercentCumulative
Percent
Page 24

Q29 Electricity Expenditure per Quarter (Banded)
13 5.3 7.0 7.037 15.2 19.9 26.935 14.3 18.8 45.747 19.3 25.3 71.027 11.1 14.5 85.518 7.4 9.7 95.2
6 2.5 3.2 98.43 1.2 1.6 100.0
186 76.2 100.058 23.8
244 100.0
01 - 9991000 - 24992500 - 49995000 - 74997500 - 999910000 - 1499915000+Total
Valid
SystemMissingTotal
Frequency Percent Valid PercentCumulative
Percent
Q29 Gas Expenditure per Quarter (Banded)
18 7.4 21.2 21.216 6.6 18.8 40.0
8 3.3 9.4 49.44 1.6 4.7 54.17 2.9 8.2 62.4
16 6.6 18.8 81.24 1.6 4.7 85.9
12 4.9 14.1 100.085 34.8 100.0
159 65.2244 100.0
01 - 249250 - 499500 - 749750 - 9991000 - 14991500 - 19992000+Total
Valid
SystemMissingTotal
Frequency Percent Valid PercentCumulative
Percent
Q29 Water Expenditure per Quarter (Banded)
14 5.7 9.1 9.166 27.0 42.9 51.928 11.5 18.2 70.118 7.4 11.7 81.8
9 3.7 5.8 87.79 3.7 5.8 93.52 .8 1.3 94.88 3.3 5.2 100.0
154 63.1 100.090 36.9
244 100.0
01 - 249250 - 499500 - 749750 - 9991000 - 14991500 - 19992000+Total
Valid
SystemMissingTotal
Frequency Percent Valid PercentCumulative
Percent
Page 25

Q30 Provides Security Measure - Security alarm
75 30.7 30.9 30.9168 68.9 69.1 100.0243 99.6 100.0
1 .4244 100.0
NoYesTotal
Valid
SystemMissingTotal
Frequency Percent Valid PercentCumulative
Percent
Q30 Provides Security Measure - Access control (proximity access card)
201 82.4 82.7 82.742 17.2 17.3 100.0
243 99.6 100.01 .4
244 100.0
NoYesTotal
Valid
SystemMissingTotal
Frequency Percent Valid PercentCumulative
Percent
Q30 Provides Security Measure - Management plan / procedures manual
60 24.6 24.7 24.7183 75.0 75.3 100.0243 99.6 100.0
1 .4244 100.0
NoYesTotal
Valid
SystemMissingTotal
Frequency Percent Valid PercentCumulative
Percent
Q30 Provides Security Measure - Staff training
51 20.9 21.0 21.0192 78.7 79.0 100.0243 99.6 100.0
1 .4244 100.0
NoYesTotal
Valid
SystemMissingTotal
Frequency Percent Valid PercentCumulative
Percent
Q30 Provides Security Measure - External lighting
34 13.9 14.0 14.0209 85.7 86.0 100.0243 99.6 100.0
1 .4244 100.0
NoYesTotal
Valid
SystemMissingTotal
Frequency Percent Valid PercentCumulative
Percent
Page 26

Q30 Provides Security Measure - Clearly marked fire exits
15 6.1 6.2 6.2228 93.4 93.8 100.0243 99.6 100.0
1 .4244 100.0
NoYesTotal
Valid
SystemMissingTotal
Frequency Percent Valid PercentCumulative
Percent
Q30 Provides Security Measure - Fire extinguishers
9 3.7 3.7 3.7234 95.9 96.3 100.0243 99.6 100.0
1 .4244 100.0
NoYesTotal
Valid
SystemMissingTotal
Frequency Percent Valid PercentCumulative
Percent
Q30 Provides Security Measure - Parking close to entry
46 18.9 18.9 18.9197 80.7 81.1 100.0243 99.6 100.0
1 .4244 100.0
NoYesTotal
Valid
SystemMissingTotal
Frequency Percent Valid PercentCumulative
Percent
Q30 Provides Security Measure - Well lit book return chutes
119 48.8 49.0 49.0124 50.8 51.0 100.0243 99.6 100.0
1 .4244 100.0
NoYesTotal
Valid
SystemMissingTotal
Frequency Percent Valid PercentCumulative
Percent
Q30 Provides Security Measure - Fire alarms
106 43.4 43.6 43.6137 56.1 56.4 100.0243 99.6 100.0
1 .4244 100.0
NoYesTotal
Valid
SystemMissingTotal
Frequency Percent Valid PercentCumulative
Percent
Page 27

Q30 Provides Security Measure - Sprinkler systems
193 79.1 79.4 79.450 20.5 20.6 100.0
243 99.6 100.01 .4
244 100.0
NoYesTotal
Valid
SystemMissingTotal
Frequency Percent Valid PercentCumulative
Percent
Q30 Provides Security Measure - Fire proof book return chutes
192 78.7 79.0 79.051 20.9 21.0 100.0
243 99.6 100.01 .4
244 100.0
NoYesTotal
Valid
SystemMissingTotal
Frequency Percent Valid PercentCumulative
Percent
Q30 Provides Security Measure - Other (specify)
228 93.4 93.8 93.815 6.1 6.2 100.0
243 99.6 100.01 .4
244 100.0
NoYesTotal
Valid
SystemMissingTotal
Frequency Percent Valid PercentCumulative
Percent
Q31 Rating of Safety and Security Measures
33 13.5 13.6 13.6191 78.3 78.9 92.6
18 7.4 7.4 100.0242 99.2 100.0
2 .8244 100.0
ExcellentSatisfactoryPoorTotal
Valid
SystemMissingTotal
Frequency Percent Valid PercentCumulative
Percent
Q32A Compliance with OH&S Standards
165 67.6 67.9 67.96 2.5 2.5 70.4
55 22.5 22.6 93.0
17 7.0 7.0 100.0
243 99.6 100.01 .4
244 100.0
YesNoDon't KnowHaven't undertakenan AuditTotal
Valid
SystemMissingTotal
Frequency Percent Valid PercentCumulative
Percent
Page 28

Q32B OH&S Audit Undertaken
163 66.8 67.1 67.116 6.6 6.6 73.764 26.2 26.3 100.0
243 99.6 100.01 .4
244 100.0
YesNoDon't KnowTotal
Valid
SystemMissingTotal
Frequency Percent Valid PercentCumulative
Percent
Q32B Year of OH&S Audit (Banded)
2 .8 1.2 1.228 11.5 17.2 18.462 25.4 38.0 56.468 27.9 41.7 98.2
3 1.2 1.8 100.0163 66.8 100.0
81 33.2244 100.0
2000 - 20022003 - 200520062007No Date ProvidedTotal
Valid
SystemMissingTotal
Frequency Percent Valid PercentCumulative
Percent
Q33A Rating of Building
62 25.4 25.5 25.5134 54.9 55.1 80.7
47 19.3 19.3 100.0243 99.6 100.0
1 .4244 100.0
ExcellentSatisfactoryUnsatisfactoryTotal
Valid
SystemMissingTotal
Frequency Percent Valid PercentCumulative
Percent
Q33B Rating of Internal Layout and Design
59 24.2 24.4 24.4135 55.3 55.8 80.2
48 19.7 19.8 100.0242 99.2 100.0
2 .8244 100.0
ExcellentSatisfactoryUnsatisfactoryTotal
Valid
SystemMissingTotal
Frequency Percent Valid PercentCumulative
Percent
Q33C Rating of Overal Standard of Library
77 31.6 31.8 31.8140 57.4 57.9 89.7
25 10.2 10.3 100.0242 99.2 100.0
2 .8244 100.0
ExcellentSatisfactoryUnsatisfactoryTotal
Valid
SystemMissingTotal
Frequency Percent Valid PercentCumulative
Percent
Page 29

Q34 Proximity to a shopping centre
34 13.9 15.7 15.765 26.6 30.0 45.6
118 48.4 54.4 100.0217 88.9 100.0
27 11.1244 100.0
AdjacentWithin 400mN/ATotal
Valid
SystemMissingTotal
Frequency Percent Valid PercentCumulative
Percent
Q34 Proximity to a shopping or business precinct
70 28.7 29.7 29.7130 53.3 55.1 84.7
36 14.8 15.3 100.0236 96.7 100.0
8 3.3244 100.0
AdjacentWithin 400mN/ATotal
Valid
SystemMissingTotal
Frequency Percent Valid PercentCumulative
Percent
Q34 Proximity to a main street
117 48.0 49.4 49.4103 42.2 43.5 92.8
17 7.0 7.2 100.0237 97.1 100.0
7 2.9244 100.0
AdjacentWithin 400mN/ATotal
Valid
SystemMissingTotal
Frequency Percent Valid PercentCumulative
Percent
Q34 Proximity to a Council administration precinct
29 11.9 13.7 13.733 13.5 15.6 29.240 16.4 18.9 48.1
110 45.1 51.9 100.0212 86.9 100.0
32 13.1244 100.0
Within BuildingAdjacentWithin 400mN/ATotal
Valid
SystemMissingTotal
Frequency Percent Valid PercentCumulative
Percent
Q34 Proximity to train station
2 .8 1.0 1.064 26.2 30.8 31.7
142 58.2 68.3 100.0208 85.2 100.0
36 14.8244 100.0
AdjacentWithin 400mN/ATotal
Valid
SystemMissingTotal
Frequency Percent Valid PercentCumulative
Percent
Page 30

Q34 Proximity to bus stop
31 12.7 13.8 13.8149 61.1 66.5 80.4
44 18.0 19.6 100.0224 91.8 100.0
20 8.2244 100.0
AdjacentWithin 400mN/ATotal
Valid
SystemMissingTotal
Frequency Percent Valid PercentCumulative
Percent
Q34 Proximity to cultural facilities
13 5.3 6.3 6.332 13.1 15.5 21.856 23.0 27.2 49.0
105 43.0 51.0 100.0206 84.4 100.0
38 15.6244 100.0
Within BuildingAdjacentWithin 400mN/ATotal
Valid
SystemMissingTotal
Frequency Percent Valid PercentCumulative
Percent
Q34 Proximity to car parking
1 .4 .4 .4211 86.5 88.7 89.1
21 8.6 8.8 97.95 2.0 2.1 100.0
238 97.5 100.06 2.5
244 100.0
Within BuildingAdjacentWithin 400mN/ATotal
Valid
SystemMissingTotal
Frequency Percent Valid PercentCumulative
Percent
Q34 Proximity to eating facilities
7 2.9 2.9 2.949 20.1 20.6 23.5
161 66.0 67.6 91.221 8.6 8.8 100.0
238 97.5 100.06 2.5
244 100.0
Within BuildingAdjacentWithin 400mN/ATotal
Valid
SystemMissingTotal
Frequency Percent Valid PercentCumulative
Percent
Page 31

Q34 Proximity to school
4 1.6 1.9 1.910 4.1 4.8 6.798 40.2 46.9 53.697 39.8 46.4 100.0
209 85.7 100.035 14.3
244 100.0
Within BuildingAdjacentWithin 400mN/ATotal
Valid
SystemMissingTotal
Frequency Percent Valid PercentCumulative
Percent
Q34 Proximity to recreation/ sporting facility
3 1.2 1.4 1.425 10.2 11.7 13.182 33.6 38.5 51.6
103 42.2 48.4 100.0213 87.3 100.0
31 12.7244 100.0
Within BuildingAdjacentWithin 400mN/ATotal
Valid
SystemMissingTotal
Frequency Percent Valid PercentCumulative
Percent
Q34 Proximity to parks and gardens
49 20.1 22.2 22.297 39.8 43.9 66.175 30.7 33.9 100.0
221 90.6 100.023 9.4
244 100.0
AdjacentWithin 400mN/ATotal
Valid
SystemMissingTotal
Frequency Percent Valid PercentCumulative
Percent
Q34 Proximity to other facility (specify)
4 1.6 5.3 5.316 6.6 21.3 26.712 4.9 16.0 42.743 17.6 57.3 100.075 30.7 100.0
169 69.3244 100.0
Within BuildingAdjacentWithin 400mN/ATotal
Valid
SystemMissingTotal
Frequency Percent Valid PercentCumulative
Percent
Q35A Car Parking Nearby
234 95.9 96.3 96.39 3.7 3.7 100.0
243 99.6 100.01 .4
244 100.0
YesNoTotal
Valid
SystemMissingTotal
Frequency Percent Valid PercentCumulative
Percent
Page 32

Q35A Number of Car Parking Spaces (Banded)
8 3.3 3.4 3.417 7.0 7.3 10.796 39.3 41.0 51.740 16.4 17.1 68.854 22.1 23.1 91.919 7.8 8.1 100.0
234 95.9 100.010 4.1
244 100.0
1 - 45 - 910 - 4950 - 99100+Data Not ProvidedTotal
Valid
SystemMissingTotal
Frequency Percent Valid PercentCumulative
Percent
Q35B Car parking Free or Paid
231 94.7 95.9 95.99 3.7 3.7 99.61 .4 .4 100.0
241 98.8 100.03 1.2
244 100.0
FreePaidData Not ProvidedTotal
Valid
SystemMissingTotal
Frequency Percent Valid PercentCumulative
Percent
Q35C Car parks solely for library patrons (Banded)
94 38.5 39.0 39.08 3.3 3.3 42.3
22 9.0 9.1 51.54 1.6 1.7 53.12 .8 .8 53.9
111 45.5 46.1 100.0241 98.8 100.0
3 1.2244 100.0
1 - 45 - 910 - 4950 - 99100+Not StatedTotal
Valid
SystemMissingTotal
Frequency Percent Valid PercentCumulative
Percent
Q35D Adequacy of car parking near library
173 70.9 72.1 72.167 27.5 27.9 100.0
240 98.4 100.04 1.6
244 100.0
YesNoTotal
Valid
SystemMissingTotal
Frequency Percent Valid PercentCumulative
Percent
Page 33

Q35E Staff Car Parks (Banded)
136 55.7 57.1 57.120 8.2 8.4 65.535 14.3 14.7 80.328 11.5 11.8 92.013 5.3 5.5 97.5
6 2.5 2.5 100.0238 97.5 100.0
6 2.5244 100.0
012 - 45 - 910 - 1920+Total
Valid
SystemMissingTotal
Frequency Percent Valid PercentCumulative
Percent
Q36A Extent of Asset Managment Plan (Banded)
1 .4 .7 .78 3.3 5.9 6.6
59 24.2 43.4 50.015 6.1 11.0 61.030 12.3 22.1 83.123 9.4 16.9 100.0
136 55.7 100.0108 44.3244 100.0
13 - 45 - 910 - 1920+Data not providedTotal
Valid
SystemMissingTotal
Frequency Percent Valid PercentCumulative
Percent
Q36A Asset Management Plan
136 55.7 56.0 56.086 35.2 35.4 91.421 8.6 8.6 100.0
243 99.6 100.01 .4
244 100.0
YesNoDon't KnowTotal
Valid
SystemMissingTotal
Frequency Percent Valid PercentCumulative
Percent
Q36A Extent of Asset Managment Plan
1 .4 .7 .78 3.3 5.9 6.6
58 23.8 42.6 49.31 .4 .7 50.0
15 6.1 11.0 61.017 7.0 12.5 73.513 5.3 9.6 83.123 9.4 16.9 100.0
136 55.7 100.0108 44.3244 100.0
1356102025Data not providedTotal
Valid
SystemMissingTotal
Frequency Percent Valid PercentCumulative
Percent
Page 34

Q36B New building Planned
124 50.8 91.2 91.212 4.9 8.8 100.0
136 55.7 100.0108 44.3244 100.0
NoYesTotal
Valid
SystemMissingTotal
Frequency Percent Valid PercentCumulative
Percent
Q36B Year New building Planned
5 2.0 41.7 41.72 .8 16.7 58.31 .4 8.3 66.71 .4 8.3 75.01 .4 8.3 83.31 .4 8.3 91.71 .4 8.3 100.0
12 4.9 100.0232 95.1244 100.0
Not Stated200620072010201220132016Total
Valid
SystemMissingTotal
Frequency Percent Valid PercentCumulative
Percent
Q36B Closure Planned
131 53.7 96.3 96.35 2.0 3.7 100.0
136 55.7 100.0108 44.3244 100.0
NoYesTotal
Valid
SystemMissingTotal
Frequency Percent Valid PercentCumulative
Percent
Q36B Year Closure Planned
1 .4 100.0 100.0243 99.6244 100.0
2007ValidSystemMissing
Total
Frequency Percent Valid PercentCumulative
Percent
Q36B Relocation Planned
130 53.3 95.6 95.66 2.5 4.4 100.0
136 55.7 100.0108 44.3244 100.0
NoYesTotal
Valid
SystemMissingTotal
Frequency Percent Valid PercentCumulative
Percent
Page 35

Q36B Year Relocation Planned
4 1.6 66.7 66.72 .8 33.3 100.06 2.5 100.0
238 97.5244 100.0
Not Stated2009Total
Valid
SystemMissingTotal
Frequency Percent Valid PercentCumulative
Percent
Q36B Refurbishment of existing building Planned
101 41.4 75.4 75.433 13.5 24.6 100.0
134 54.9 100.0110 45.1244 100.0
NoYesTotal
Valid
SystemMissingTotal
Frequency Percent Valid PercentCumulative
Percent
Q36B Year Refurbishment Planned
20 8.2 60.6 60.61 .4 3.0 63.61 .4 3.0 66.76 2.5 18.2 84.83 1.2 9.1 93.91 .4 3.0 97.01 .4 3.0 100.0
33 13.5 100.0211 86.5244 100.0
Not Stated200020062007200820152022Total
Valid
SystemMissingTotal
Frequency Percent Valid PercentCumulative
Percent
Q36B Extensions Planned
124 50.8 91.2 91.212 4.9 8.8 100.0
136 55.7 100.0108 44.3244 100.0
NoYesTotal
Valid
SystemMissingTotal
Frequency Percent Valid PercentCumulative
Percent
Q36B Year Extensions Planned
9 3.7 75.0 75.01 .4 8.3 83.31 .4 8.3 91.71 .4 8.3 100.0
12 4.9 100.0232 95.1244 100.0
Not Stated200720082013Total
Valid
SystemMissingTotal
Frequency Percent Valid PercentCumulative
Percent
Page 36

Q36B Maintenance Planned
50 20.5 36.8 36.886 35.2 63.2 100.0
136 55.7 100.0108 44.3244 100.0
NoYesTotal
Valid
SystemMissingTotal
Frequency Percent Valid PercentCumulative
Percent
Q36B Year Maintenance Planned
56 23.0 65.1 65.11 .4 1.2 66.3
12 4.9 14.0 80.25 2.0 5.8 86.04 1.6 4.7 90.73 1.2 3.5 94.21 .4 1.2 95.31 .4 1.2 96.53 1.2 3.5 100.0
86 35.2 100.0158 64.8244 100.0
Not Stated20062007200820102012201320142015Total
Valid
SystemMissingTotal
Frequency Percent Valid PercentCumulative
Percent
Q36B Other Works Planned
118 48.4 86.8 86.818 7.4 13.2 100.0
136 55.7 100.0108 44.3244 100.0
NoYesTotal
Valid
SystemMissingTotal
Frequency Percent Valid PercentCumulative
Percent
Q36B Year Other Works Planned
11 4.5 61.1 61.16 2.5 33.3 94.41 .4 5.6 100.0
18 7.4 100.0226 92.6244 100.0
Not Stated20072008Total
Valid
SystemMissingTotal
Frequency Percent Valid PercentCumulative
Percent
Page 37

Q36B Year New building Planned (Banded)
5 2.0 41.7 41.72 .8 16.7 58.31 .4 8.3 66.73 1.2 25.0 91.71 .4 8.3 100.0
12 4.9 100.0232 95.1244 100.0
Not Stated200620072010 - 20142015+Total
Valid
SystemMissingTotal
Frequency Percent Valid PercentCumulative
Percent
Q36B Year Refurbishment Planned (Banded)
20 8.2 60.6 60.61 .4 3.0 63.61 .4 3.0 66.76 2.5 18.2 84.83 1.2 9.1 93.92 .8 6.1 100.0
33 13.5 100.0211 86.5244 100.0
Not Stated<2006200620072008 - 20092015+Total
Valid
SystemMissingTotal
Frequency Percent Valid PercentCumulative
Percent
Q36B Year Extensions Planned (Banded)
9 3.7 75.0 75.01 .4 8.3 83.31 .4 8.3 91.71 .4 8.3 100.0
12 4.9 100.0232 95.1244 100.0
Not Stated20072008 - 20092010 - 2014Total
Valid
SystemMissingTotal
Frequency Percent Valid PercentCumulative
Percent
Q36B Year Maintenance Planned (Banded)
56 23.0 65.1 65.11 .4 1.2 66.3
12 4.9 14.0 80.25 2.0 5.8 86.09 3.7 10.5 96.53 1.2 3.5 100.0
86 35.2 100.0158 64.8244 100.0
Not Stated200620072008 - 20092010 - 20142015+Total
Valid
SystemMissingTotal
Frequency Percent Valid PercentCumulative
Percent
Page 38

Q37 Total Insurance Value of Building (Banded)
17 7.0 10.1 10.115 6.1 8.9 18.914 5.7 8.3 27.210 4.1 5.9 33.125 10.2 14.8 47.919 7.8 11.2 59.223 9.4 13.6 72.846 18.9 27.2 100.0
169 69.3 100.075 30.7
244 100.0
<250000250000 - 499999500000 - 749999750000 - 9999991000000 - 14999991500000 - 19999992000000 - 29999993000000+Total
Valid
SystemMissingTotal
Frequency Percent Valid PercentCumulative
Percent
Q37 Date of Insurance Assessment
39 16.0 23.1 23.14 1.6 2.4 25.4
11 4.5 6.5 32.052 21.3 30.8 62.763 25.8 37.3 100.0
169 69.3 100.075 30.7
244 100.0
Unknown2004200520062007Total
Valid
SystemMissingTotal
Frequency Percent Valid PercentCumulative
Percent
Q38 Average Annual Maintenance Cost ($) (Banded)
8 3.3 3.8 3.813 5.3 6.2 10.013 5.3 6.2 16.223 9.4 11.0 27.117 7.0 8.1 35.219 7.8 9.0 44.320 8.2 9.5 53.866 27.0 31.4 85.222 9.0 10.5 95.7
9 3.7 4.3 100.0210 86.1 100.0
34 13.9244 100.0
<10001000 - 24992500 - 49995000 - 74997500 - 999910000 - 1499915000 - 1999920000 - 4999950000 - 99999100000+Total
Valid
SystemMissingTotal
Frequency Percent Valid PercentCumulative
Percent
Page 39

Q38 Average Annual Cleaning Cost ($) (Banded)
6 2.5 3.5 3.516 6.6 9.2 12.719 7.8 11.0 23.730 12.3 17.3 41.017 7.0 9.8 50.921 8.6 12.1 63.022 9.0 12.7 75.741 16.8 23.7 99.4
1 .4 .6 100.0173 70.9 100.0
71 29.1244 100.0
<10001000 - 24992500 - 49995000 - 74997500 - 999910000 - 1499915000 - 1999920000 - 4999950000+Total
Valid
SystemMissingTotal
Frequency Percent Valid PercentCumulative
Percent
Q38 Average Annual Cost of Unplanned Maintenance Work ($) (Banded)
29 11.9 23.0 23.029 11.9 23.0 46.026 10.7 20.6 66.719 7.8 15.1 81.7
2 .8 1.6 83.38 3.3 6.3 89.78 3.3 6.3 96.04 1.6 3.2 99.21 .4 .8 100.0
126 51.6 100.0118 48.4244 100.0
<10001000 - 24992500 - 49995000 - 74997500 - 999910000 - 1499915000 - 1999920000 - 4999950000+Total
Valid
SystemMissingTotal
Frequency Percent Valid PercentCumulative
Percent
Q38 Average Annual Cost of Planned preventative maintenance work ($) (Banded)
6 2.5 6.3 6.332 13.1 33.7 40.017 7.0 17.9 57.910 4.1 10.5 68.4
6 2.5 6.3 74.710 4.1 10.5 85.3
7 2.9 7.4 92.66 2.5 6.3 98.91 .4 1.1 100.0
95 38.9 100.0149 61.1244 100.0
<10001000 - 24992500 - 49995000 - 74997500 - 999910000 - 1499915000 - 1999920000 - 4999950000+Total
Valid
SystemMissingTotal
Frequency Percent Valid PercentCumulative
Percent
Page 40

Q38 Average Annual Cost - Planned works program costs (condition-based) ($) (Banded)
3 1.2 6.5 6.514 5.7 30.4 37.0
2 .8 4.3 41.38 3.3 17.4 58.74 1.6 8.7 67.47 2.9 15.2 82.67 2.9 15.2 97.81 .4 2.2 100.0
46 18.9 100.0198 81.1244 100.0
<500.01000.0 - 2499.02500.0 - 4999.05000.0 - 7499.07500.0 - 9999.010000.0 - 14999.020000.0 - 49999.050000.0+Total
Valid
SystemMissingTotal
Frequency Percent Valid PercentCumulative
Percent
Q38 Average Annual Cost - Major plant and equipment replacement ($) (Banded)
2 .8 6.5 6.55 2.0 16.1 22.64 1.6 12.9 35.53 1.2 9.7 45.22 .8 6.5 51.62 .8 6.5 58.18 3.3 25.8 83.91 .4 3.2 87.14 1.6 12.9 100.0
31 12.7 100.0213 87.3244 100.0
<10001000 - 24992500 - 49995000 - 74997500 - 999910000 - 1499915000 - 1999920000 - 49999100000+Total
Valid
SystemMissingTotal
Frequency Percent Valid PercentCumulative
Percent
Q38 Average Annual Cost of Other Maintenance Expense ($) (Banded)
2 .8 9.5 9.53 1.2 14.3 23.82 .8 9.5 33.34 1.6 19.0 52.41 .4 4.8 57.12 .8 9.5 66.73 1.2 14.3 81.03 1.2 14.3 95.21 .4 4.8 100.0
21 8.6 100.0223 91.4244 100.0
<10001000 - 24992500 - 49995000 - 74997500 - 999910000 - 1499915000 - 1999920000 - 4999950000 - 99999Total
Valid
SystemMissingTotal
Frequency Percent Valid PercentCumulative
Percent
Page 41

Q39 Estimated Backlog of Planned Maintenance ($) (Banded)
1 .4 2.2 2.23 1.2 6.7 8.97 2.9 15.6 24.47 2.9 15.6 40.09 3.7 20.0 60.0
18 7.4 40.0 100.045 18.4 100.0
199 81.6244 100.0
<5001000 - 19992000 - 49995000 - 999910000 - 2499925000+Total
Valid
SystemMissingTotal
Frequency Percent Valid PercentCumulative
Percent
Q40 Capital Expenditure (2006/07) ($) (Banded)
36 14.8 40.4 40.434 13.9 38.2 78.7
9 3.7 10.1 88.83 1.2 3.4 92.17 2.9 7.9 100.0
89 36.5 100.0155 63.5244 100.0
<100001000 - 4999950000 - 99999100000 - 249999250000+Total
Valid
SystemMissingTotal
Frequency Percent Valid PercentCumulative
Percent
Q41 Projected Capital Expenditure (2007/08) ($) (Banded)
27 11.1 35.5 35.528 11.5 36.8 72.4
8 3.3 10.5 82.96 2.5 7.9 90.87 2.9 9.2 100.0
76 31.1 100.0168 68.9244 100.0
<100001000 - 4999950000 - 99999100000 - 249999250000+Total
Valid
SystemMissingTotal
Frequency Percent Valid PercentCumulative
Percent
Q42 Interval of Regular building Surveys
13 5.3 6.3 6.39 3.7 4.4 10.7
56 23.0 27.2 37.921 8.6 10.2 48.194 38.5 45.6 93.713 5.3 6.3 100.0
206 84.4 100.038 15.6
244 100.0
Not Done< 5 Years2 - 5 YearsEvery second yearYearlySeveral times a yearTotal
Valid
SystemMissingTotal
Frequency Percent Valid PercentCumulative
Percent
Page 42

Q43A Requirement for Major Refurbishment/ Extension in next 5 years
60 24.6 24.7 24.7170 69.7 70.0 94.7
13 5.3 5.3 100.0243 99.6 100.0
1 .4244 100.0
YesNoNot StatedTotal
Valid
SystemMissingTotal
Frequency Percent Valid PercentCumulative
Percent
Q43B Capability of Accommodating any Expansion
122 50.0 50.2 50.2107 43.9 44.0 94.2
14 5.7 5.8 100.0243 99.6 100.0
1 .4244 100.0
YesNoNot StatedTotal
Valid
SystemMissingTotal
Frequency Percent Valid PercentCumulative
Percent
Q44A Type of Alterations Planned
24 9.8 9.8 9.8
8 3.3 3.3 13.1
17 7.0 7.0 20.1
3 1.2 1.2 21.3182 74.6 74.6 95.9
10 4.1 4.1 100.0244 100.0 100.0
Refurbishment ofExisting BranchDemolition andReplacement - On SiteReplacement andRelocation to new SiteYes, UnstatedNoNot StatedTotal
ValidFrequency Percent Valid Percent
CumulativePercent
Q44B Timeframe of Alterations
22 9.0 42.3 42.313 5.3 25.0 67.316 6.6 30.8 98.1
1 .4 1.9 100.052 21.3 100.0
192 78.7244 100.0
< 2 years2 - 4 years> 4 yearsUnstatedTotal
Valid
SystemMissingTotal
Frequency Percent Valid PercentCumulative
Percent
Page 43

Q44C Proposed Additional Floor space (m2)
17 7.0 32.7 32.71 .4 1.9 34.64 1.6 7.7 42.36 2.5 11.5 53.85 2.0 9.6 63.54 1.6 7.7 71.29 3.7 17.3 88.56 2.5 11.5 100.0
52 21.3 100.0192 78.7244 100.0
<11 - 4950 - 149150 - 299300 - 499500 - 9991000 +Not StatedTotal
Valid
SystemMissingTotal
Frequency Percent Valid PercentCumulative
Percent
Q44D Budget of Alterations - Capital Building (to nearest $100,000)
5 2.0 9.6 9.61 .4 1.9 11.52 .8 3.8 15.44 1.6 7.7 23.11 .4 1.9 25.07 2.9 13.5 38.51 .4 1.9 40.4
15 6.1 28.8 69.216 6.6 30.8 100.052 21.3 100.0
192 78.7244 100.0
<2500025000 - 4999950000 - 99999100000 - 249999250000 - 499999500000 - 9999991000000 - 19999992000000+Data Not ProvidedTotal
Valid
SystemMissingTotal
Frequency Percent Valid PercentCumulative
Percent
Q44D Budget of Alterations - Internal Assets (to nearest $100,000)
4 1.6 7.7 7.75 2.0 9.6 17.34 1.6 7.7 25.05 2.0 9.6 34.64 1.6 7.7 42.36 2.5 11.5 53.8
24 9.8 46.2 100.052 21.3 100.0
192 78.7244 100.0
<1500015000 - 4999950000 - 99999100000 - 199999200000 - 499999500000+Data Not ProvidedTotal
Valid
SystemMissingTotal
Frequency Percent Valid PercentCumulative
Percent
Page 44

Q44E Refurbishment Planned - Internal reorganisation of space
12 4.9 24.0 24.029 11.9 58.0 82.0
9 3.7 18.0 100.050 20.5 100.0
194 79.5244 100.0
Not PlannedPlannedData Not ProvidedTotal
Valid
SystemMissingTotal
Frequency Percent Valid PercentCumulative
Percent
Q44ERefurbishment Planned - Additional floor space
11 4.5 22.0 22.030 12.3 60.0 82.0
9 3.7 18.0 100.050 20.5 100.0
194 79.5244 100.0
Not PlannedPlannedData Not ProvidedTotal
Valid
SystemMissingTotal
Frequency Percent Valid PercentCumulative
Percent
Q44E Refurbishment Planned - Decreased floor space
40 16.4 80.0 80.010 4.1 20.0 100.050 20.5 100.0
194 79.5244 100.0
Not PlannedData Not ProvidedTotal
Valid
SystemMissingTotal
Frequency Percent Valid PercentCumulative
Percent
Q44E Refurbishment Planned - Internal structural alterations
23 9.4 46.0 46.017 7.0 34.0 80.010 4.1 20.0 100.050 20.5 100.0
194 79.5244 100.0
Not PlannedPlannedData Not ProvidedTotal
Valid
SystemMissingTotal
Frequency Percent Valid PercentCumulative
Percent
Q44E Refurbishment Planned - Improved collection areas
12 4.9 24.0 24.028 11.5 56.0 80.010 4.1 20.0 100.050 20.5 100.0
194 79.5244 100.0
Not PlannedPlannedData Not ProvidedTotal
Valid
SystemMissingTotal
Frequency Percent Valid PercentCumulative
Percent
Page 45

Q44E Refurbishment Planned - Improved reading and study areas
11 4.5 22.0 22.029 11.9 58.0 80.010 4.1 20.0 100.050 20.5 100.0
194 79.5244 100.0
Not PlannedPlannedData Not ProvidedTotal
Valid
SystemMissingTotal
Frequency Percent Valid PercentCumulative
Percent
Q44E Refurbishment Planned - Improved resource areas
15 6.1 30.0 30.025 10.2 50.0 80.010 4.1 20.0 100.050 20.5 100.0
194 79.5244 100.0
Not PlannedPlannedData Not ProvidedTotal
Valid
SystemMissingTotal
Frequency Percent Valid PercentCumulative
Percent
Q44E Refurbishment Planned - Improved staff areas
19 7.8 38.0 38.021 8.6 42.0 80.010 4.1 20.0 100.050 20.5 100.0
194 79.5244 100.0
Not PlannedPlannedData Not ProvidedTotal
Valid
SystemMissingTotal
Frequency Percent Valid PercentCumulative
Percent
Q44E Refurbishment Planned - Improved amenities areas
20 8.2 40.0 40.020 8.2 40.0 80.010 4.1 20.0 100.050 20.5 100.0
194 79.5244 100.0
Not PlannedPlannedData Not ProvidedTotal
Valid
SystemMissingTotal
Frequency Percent Valid PercentCumulative
Percent
Q44E Refurbishment Planned - Improvements to other areas (specify)
32 13.1 64.0 64.08 3.3 16.0 80.0
10 4.1 20.0 100.050 20.5 100.0
194 79.5244 100.0
Not PlannedPlannedData Not ProvidedTotal
Valid
SystemMissingTotal
Frequency Percent Valid PercentCumulative
Percent
Page 46

Q44E Refurbishment Planned - Improved shelving
15 6.1 30.0 30.025 10.2 50.0 80.010 4.1 20.0 100.050 20.5 100.0
194 79.5244 100.0
Not PlannedPlannedData Not ProvidedTotal
Valid
SystemMissingTotal
Frequency Percent Valid PercentCumulative
Percent
Q44E Refurbishment Planned - Building services upgrade
33 13.5 66.0 66.07 2.9 14.0 80.0
10 4.1 20.0 100.050 20.5 100.0
194 79.5244 100.0
Not PlannedPlannedData Not ProvidedTotal
Valid
SystemMissingTotal
Frequency Percent Valid PercentCumulative
Percent
Q44E Refurbishment Planned - Fire safety improvements
24 9.8 48.0 48.016 6.6 32.0 80.010 4.1 20.0 100.050 20.5 100.0
194 79.5244 100.0
Not PlannedPlannedData Not ProvidedTotal
Valid
SystemMissingTotal
Frequency Percent Valid PercentCumulative
Percent
Q44E Refurbishment Planned - Improved disabled access
20 8.2 40.0 40.020 8.2 40.0 80.010 4.1 20.0 100.050 20.5 100.0
194 79.5244 100.0
Not PlannedPlannedData Not ProvidedTotal
Valid
SystemMissingTotal
Frequency Percent Valid PercentCumulative
Percent
Q44E Refurbishment Planned - Energy consumption improvements
21 8.6 42.0 42.019 7.8 38.0 80.010 4.1 20.0 100.050 20.5 100.0
194 79.5244 100.0
Not PlannedPlannedData Not ProvidedTotal
Valid
SystemMissingTotal
Frequency Percent Valid PercentCumulative
Percent
Page 47

Q44E Refurbishment Planned - Increased computer access
16 6.6 32.0 32.024 9.8 48.0 80.010 4.1 20.0 100.050 20.5 100.0
194 79.5244 100.0
Not PlannedPlannedData Not ProvidedTotal
Valid
SystemMissingTotal
Frequency Percent Valid PercentCumulative
Percent
Q44E Refurbishment Planned - Wireless internet
25 10.2 50.0 50.015 6.1 30.0 80.010 4.1 20.0 100.050 20.5 100.0
194 79.5244 100.0
Not PlannedPlannedData Not ProvidedTotal
Valid
SystemMissingTotal
Frequency Percent Valid PercentCumulative
Percent
Q44E Refurbishment Planned - Carpeting or other floor covering
13 5.3 26.0 26.027 11.1 54.0 80.010 4.1 20.0 100.050 20.5 100.0
194 79.5244 100.0
Not PlannedPlannedData Not ProvidedTotal
Valid
SystemMissingTotal
Frequency Percent Valid PercentCumulative
Percent
Q44E Refurbishment Planned - Painting
12 4.9 24.0 24.028 11.5 56.0 80.010 4.1 20.0 100.050 20.5 100.0
194 79.5244 100.0
Not PlannedPlannedData Not ProvidedTotal
Valid
SystemMissingTotal
Frequency Percent Valid PercentCumulative
Percent
Q44E Refurbishment Planned - Building materials - external cladding
28 11.5 56.0 56.012 4.9 24.0 80.010 4.1 20.0 100.050 20.5 100.0
194 79.5244 100.0
Not PlannedPlannedData Not ProvidedTotal
Valid
SystemMissingTotal
Frequency Percent Valid PercentCumulative
Percent
Page 48

Q44E Refurbishment Planned - Heating
25 10.2 50.0 50.015 6.1 30.0 80.010 4.1 20.0 100.050 20.5 100.0
194 79.5244 100.0
Not PlannedPlannedData Not ProvidedTotal
Valid
SystemMissingTotal
Frequency Percent Valid PercentCumulative
Percent
Q44E Refurbishment Planned - Air Conditioning
23 9.4 46.0 46.017 7.0 34.0 80.010 4.1 20.0 100.050 20.5 100.0
194 79.5244 100.0
Not PlannedPlannedData Not ProvidedTotal
Valid
SystemMissingTotal
Frequency Percent Valid PercentCumulative
Percent
Q44E Refurbishment Planned - Other Works (specify)
35 14.3 70.0 70.08 3.3 16.0 86.07 2.9 14.0 100.0
50 20.5 100.0194 79.5244 100.0
Not PlannedPlannedData Not ProvidedTotal
Valid
SystemMissingTotal
Frequency Percent Valid PercentCumulative
Percent
Q45 Ability to Adapt Spaces for New Uses
57 23.4 23.4 23.4172 70.5 70.5 93.9
15 6.1 6.1 100.0244 100.0 100.0
YesNoNot StatedTotal
ValidFrequency Percent Valid Percent
CumulativePercent
Page 49