building an executive dashboard on top of...
TRANSCRIPT
Business Objects Insight Americas 2006
1
Building an Executive Dashboard On Top Of Excel
Building an Executive Dashboard On Top Of Excel
William Lay, Technicolor
Copyright © 2006 Business Objects S.A. All rights reserved.Slide 2
Breakout Information (Hidden Slide)
Building an Executive Dashboard On Top Of ExcelHas management asked you to create an executive dashboard for them, and then you discover the data exist only in a collection of poorly organized, error-prone spreadsheets? We'll explore this all-too-familiar scenario and present a real-world problem tackled with Performance Manager XI Release 2. If you're considering a dashboard project but can't justify the time and expense to build a data warehouse, this session is for you!
Print_Code (please leave for Business Objects use)
Business Objects Insight Americas 2006
2
Copyright © 2006 Business Objects S.A. All rights reserved.Slide 3
The ChallengeThe ProposalThe ProcessThe DashboardLessons LearnedQ&A
Topics
Copyright © 2006 Business Objects S.A. All rights reserved.Slide 4
DVD manufacturing processTechnicolor manufactures over one billion DVDs each yearFor purpose of KPI reporting, the process is broken into• Replication• Printing• Packaging
Key cost drivers are raw materials (polycarbonate plastic) and labor • Tracking of yield, scrap, and labor utilization is critical!
OrganizationEleven manufacturing and/or packaging plantsThe plants are organized geographically• North America• International (Europe and Australia)
The Challenge – Background

Business Objects Insight Americas 2006
3
Copyright © 2006 Business Objects S.A. All rights reserved.Slide 5
The current monthly KPI report ExcelTwelve manufacturing key performance indicators (KPIs)• Tracked monthly against budgeted targets• Regional rollups also tracked and targeted (N.A. & International)
One KPI graph per page over 30 pages total!Large file (2MB+) emailed to approx. 50 recipientsPoor visibility of underlying data, i.e. hidden tabsNo formal version control or retention of historyNo year-over-year comparisons
Managed by quality engineering teamData “wrangling” performed by quality engineering teamBulk of time spent collecting and integrating dataPoor use of valuable people
The Challenge – KPI Reporting
Copyright © 2006 Business Objects S.A. All rights reserved.Slide 6
Better use of Engineering timeAutomate the monthly process to create the reportAllow Engineers to spend time on analysis vs. data fetching
Better distribution mechanismAbility to retain all historyCommon shared corporate repository for the reportA more scalable “platform;” i.e. ability to serve more KPIs in the futureAbility to securely share reports with customers in the future.
Better contentDrill-down to detailsWeekly updates, instead of monthly
“And can we have it in six months please?”
The Challenge – The Business’ Request“There’s got to be a better way.”

Business Objects Insight Americas 2006
4
Copyright © 2006 Business Objects S.A. All rights reserved.Slide 7
The hard work of defining KPIs was already doneAgreement on KPIs amongst business owners, even globally!Strong business sponsorship for a better solutionOutputs well understood – 12 KPIsCalculations well defined
An inventory of source systems was conducted100+ surveys were sent to process managers and IT staffResults captured in an Excel spreadsheet
Results were dismaying At least 17 disparate source systems were identifiedSystems ranged from ERP (e.g. SAP) to Access databasesNone of the systems flowing into existing data warehouses
The Challenge – What’s the Best Approach?Is this a good data warehouse candidate?
Copyright © 2006 Business Objects S.A. All rights reserved.Slide 8
Costs for a data warehouse approach were prohibitiveProject costs would easily run into high six or seven figuresCoordinating with local application teams in global localesConforming data across disparate systems performing like processes
Time to deliver not acceptableEasily a multi-year projectPhase-in KPIs and locations incrementally
Huge risk!Multi-source, multi-location data warehouse project = high risk!
The Challenge – Not a Data Warehouse Project!

Business Objects Insight Americas 2006
5
Copyright © 2006 Business Objects S.A. All rights reserved.Slide 9
The ChallengeThe ProposalThe ProcessThe DashboardLessons LearnedQ&A
Topics
Copyright © 2006 Business Objects S.A. All rights reserved.Slide 10
No drill-down capabilityThe business’ understanding and acceptance of this was critical
Extremely limited process automationQuality engineering would continue to compile the data for the master spreadsheet manuallyOnly the graph creation and publishing steps would be automated
Monthly refresh of dashboard data (i.e. not weekly)This was consistent with the existing process
Exclusively use the term “Executive Dashboard” within the business and BI team
Concept adopted from Wayne Eckerson’s “Performance Dashboards: Measuring, Monitoring and Managing Your Business” (Wiley, 2005)
The Proposal – an “Executive” DashboardExtreme scope reduction
Business Objects Insight Americas 2006
6
Copyright © 2006 Business Objects S.A. All rights reserved.Slide 11
Use the master Excel spreadsheet as a data sourceSheet to be maintained by quality engineering teamIT to assist in enhancing the spreadsheet with macros or similar
Data pushed to the BI team as a text fileInclude all supporting metrics, not just KPI ratiosTake KPI ratios pre-calculated from the spreadsheetTake KPI aggregates pre-calculated from the spreadsheet
“Lite” data staging in the BI environmentA very simple data model to stage the data from the spreadsheetUse Informatica to move the data
The Proposal – Back-End Conceptual SolutionHow will this “Executive Dashboard” work?
Copyright © 2006 Business Objects S.A. All rights reserved.Slide 12
Standalone dashboard tool was consideredAnother vendor’s stand-alone dashboard tool was consideredPerformance Manager XI was chosen because of its integration in BusinessObjects XIPlatform standardization is a key strategy of the BI programWe want a single platform where users can access all BI content: dashboards, reports, ad hoc query, etc.
Dashboards or Scorecards?Although we were not using a Balanced Scorecard methodology, we still required the functionality of Performance Manager XI scorecards Comparison of actual KPI values against target goals
The Proposal – Front-End Considerations

Business Objects Insight Americas 2006
7
Copyright © 2006 Business Objects S.A. All rights reserved.Slide 13
The Proposal – Front-End Conceptual Solution
BusinessObjects Performance Manager XI
Dashboard analyticsGoal analytics
BusinessObjects Web Intelligence XI
Used for linked, auxiliary reports, if needed
Risk This would be the team’s first experience with BusinessObjects XI
Lots to learn!
Copyright © 2006 Business Objects S.A. All rights reserved.Slide 14
The Proposal – Conceptual Architecture
SourceData
Master Spreadsheet
Data Staging
Semantic Layer
Information Delivery
MS Excel Spreadsheet
Oracle RDBMS
BusinessObjects XI BusinessObjects XI
Manufacturing
Customer Service
Work Orders
Inventory (Raw Goods)
Web Intelligence XI
Local Systems & Spreadsheets
Human Resources
Reporting Universe
Performance Manager XI
Metrics Universe
Dimension Metadata
Informatica

Business Objects Insight Americas 2006
8
Copyright © 2006 Business Objects S.A. All rights reserved.Slide 15
The ChallengeThe ProposalThe ProcessThe DashboardLessons LearnedQ&A
Topics
Copyright © 2006 Business Objects S.A. All rights reserved.Slide 16
Planned ScheduleFour month projectTime to learn new tools and platform “baked” into scheduleStoryboarding to server as “functional requirements” for front-endUser acceptance testing (UAT) and refinement phase was critical
The Process – Timeline PlanningHow to plan in uncharted territory?
Business Objects Insight Americas 2006
9
Copyright © 2006 Business Objects S.A. All rights reserved.Slide 17
BI resourcesBI analyst/developer• Design data staging area• Design and build Business Objects universes, metrics, and goals• Design and build dashboard and reports
Back-end developer• Build data staging area• Build Informatica mappings• Create refresh schedules for Performance Management objects
BI administrator• Create environments (test and production)• Create security model and user accounts
BI project manager (PM)• Assist quality engineer in building master spreadsheet
The Process – BI Resources
Copyright © 2006 Business Objects S.A. All rights reserved.Slide 18
Business resourcesEngineering managers• Storyboarding• UAT
Project champions• High-level requirements• UAT
Quality engineer• Subject matter expert on source spreadsheet data• Build master spreadsheet with assistance from BI PM
Sample users• UAT
The Process – Business Resources

Business Objects Insight Americas 2006
10
Copyright © 2006 Business Objects S.A. All rights reserved.Slide 19
New paradigm for the BI teamThe dashboard is not a query and analysis tool; definitely not OLAP!Information at-a-glance• Minimal on-page filtering• Limited drill-down (slice lists only)
Ground rules for the dashboard designClean and clear interfaceMaximize screen “real estate”Use only out-of-the box features – no customization, no SDKUse the most effective visualizations, regardless of “glitz” factorAs a guide, we used Stephen Few’s “Information Dashboard Design: The Effective Visual Communication of Data” (O’Reilly, 2006)
The Process – Dashboard DesignThe dashboard is not a query tool!
Copyright © 2006 Business Objects S.A. All rights reserved.Slide 20
Requirements gathering and documentationTraditional requirements gathering and documentation not effectiveCaptured requirements with storyboarding, inspired by “Enterprise Dashboards, Design and Best Practices for IT,” Shadan Malik (Wiley 2005)
Storyboarding process (four days)In-person, daily meeting with business lots of white board spaceCaptured all ideas on the white boards (digital photos for “archival”)Explicitly document out-of-scope functionality • Keep a running list for possible future enhancements
Analyst builds skeleton prototypes in prep for the next meeting
Dashboard layout and navigation flow done!
The Process – Storyboarding

Business Objects Insight Americas 2006
11
Copyright © 2006 Business Objects S.A. All rights reserved.Slide 21
Build metrics universe on top of the data stageA second universe was built for Web Intelligence reporting
Create dimension metadata for “slices”Time dimension – fixed, monthly incrementsSite dimension – captured in the data stage and universe
Build metricsSelect a measure from metrics universeSelect an aggregation function, select site and time dimensions
Build goalsSelect a metric (created in previous step)Write a query against the metrics universe to return goal data
The Process – Creating Metrics and Goals
Copyright © 2006 Business Objects S.A. All rights reserved.Slide 22
Functional requirements will drive choice of analyticsComparison of actual values to target goalsTrending, i.e. several months of history at a glanceComparison between plants not of primary importance
Candidate analyticsGoal analyticsGoal listsMetric treesTraffic lightsThermometersSpeedometers
The Process – Options for Analytics
Business Objects Insight Americas 2006
12
Copyright © 2006 Business Objects S.A. All rights reserved.Slide 23
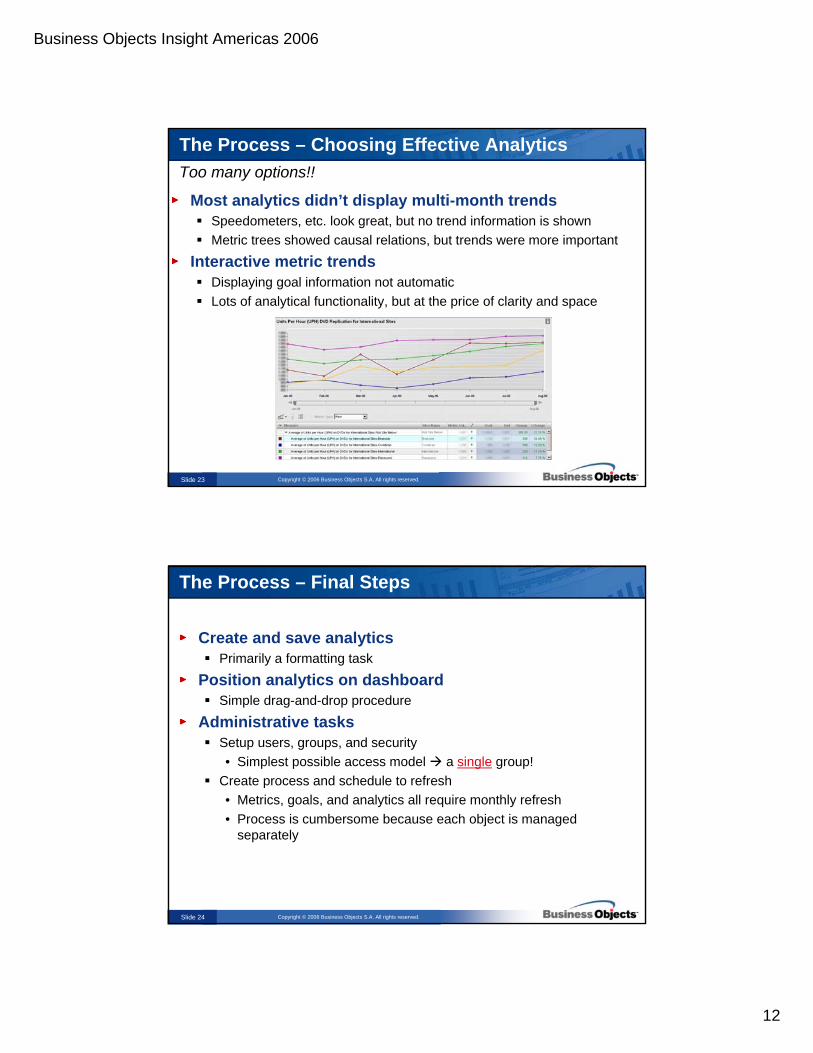
Most analytics didn’t display multi-month trendsSpeedometers, etc. look great, but no trend information is shownMetric trees showed causal relations, but trends were more important
Interactive metric trendsDisplaying goal information not automaticLots of analytical functionality, but at the price of clarity and space
The Process – Choosing Effective AnalyticsToo many options!!
Copyright © 2006 Business Objects S.A. All rights reserved.Slide 24
Create and save analyticsPrimarily a formatting task
Position analytics on dashboardSimple drag-and-drop procedure
Administrative tasksSetup users, groups, and security• Simplest possible access model a single group!
Create process and schedule to refresh• Metrics, goals, and analytics all require monthly refresh• Process is cumbersome because each object is managed
separately
The Process – Final Steps

Business Objects Insight Americas 2006
13
Copyright © 2006 Business Objects S.A. All rights reserved.Slide 25
The ChallengeThe ProposalThe ProcessThe DashboardLessons LearnedQ&A
Topics
Copyright © 2006 Business Objects S.A. All rights reserved.Slide 26
The Dashboard – Logon Page
Quick-Look goal listPerfect level of detail for top managementSummary view of worldwide KPIsSimilar page provided for North America and international KPIs
Associated viewerClicking on a KPI brings its analytic into the viewer

Business Objects Insight Americas 2006
14
Copyright © 2006 Business Objects S.A. All rights reserved.Slide 27
The Dashboard – the Goal ListTraffic lights for goal comparison, plus trend arrows
Year-over-year comparison will start in 2007
Copyright © 2006 Business Objects S.A. All rights reserved.Slide 28
The Dashboard – Goal AnalyticsGoal analytics organized by region and by process
Region tabs Process sub-tabs
Slice list defaults to regional aggregate
Hyperlink navigates to Web Intelligence detail report

Business Objects Insight Americas 2006
15
Copyright © 2006 Business Objects S.A. All rights reserved.Slide 29
The Dashboard – Web Intelligence Detail ReportThe Web Intelligence report for printing and site-by-site detail
Copyright © 2006 Business Objects S.A. All rights reserved.Slide 30
The ChallengeThe ProposalThe ProcessThe DashboardLessons LearnedQ&A
Topics

Business Objects Insight Americas 2006
16
Copyright © 2006 Business Objects S.A. All rights reserved.Slide 31
Ongoing business input and supportGood sponsorship, motivated businessKept business involved throughout development• Prototyping prior to project launch• Storyboarding• UAT and refinement phase
Small, cohesive BI teamCombining the analyst and dashboard developer rolesFlexible software development and management of dependenciesDevelopment was very efficient 60 person-days total effort
Confining scope to well-defined, agreed upon KPIsStrong business ownership of KPIs and data qualityNo time was exhausted discussing KPI definitionsClear scope
Lessons Learned – What Worked
Copyright © 2006 Business Objects S.A. All rights reserved.Slide 32
Adopting dashboard thinking took timeParadigm shift for BI team – the dashboard is not a query toolWhat helped• Getting team buy-in, one person at a time • Stephen Few’s text was a helpful guide
Learning new tools “on-the-job”Learning the nuances of the tool while simultaneously building the application The BusinessObjects XI platform is very different from Version 6.5
Refreshing Performance Management XI objectsBusiness Objects is improving this functionality
Lessons Learned – What Didn’t Work

Business Objects Insight Americas 2006
17
Copyright © 2006 Business Objects S.A. All rights reserved.Slide 33
The ChallengeThe ProposalThe ProcessThe DashboardLessons LearnedQ&A
Topics
Copyright © 2006 Business Objects S.A. All rights reserved.Slide 34
QuestionsWilliam Lay, BI Program Manager, Technicolor/ThomsonI will repeat questions to ensure everyone can hear
Contact informationEmail: [email protected]: +1 (310) 699-1609
Q&A