building aerodynamics optimization of wind- · pdf file05/08/2017 ·...
TRANSCRIPT
BUILDING AERODYNAMICS –OPTIMIZATION OF WIND-INDUCED STRUCTURAL RESPONSES
Sudeesh Kala, M.A.Sc., B.E. (Hons), P.Eng.
Regional Manager | Associate
Rowan Williams Davies & Irwin Inc. (RWDI)
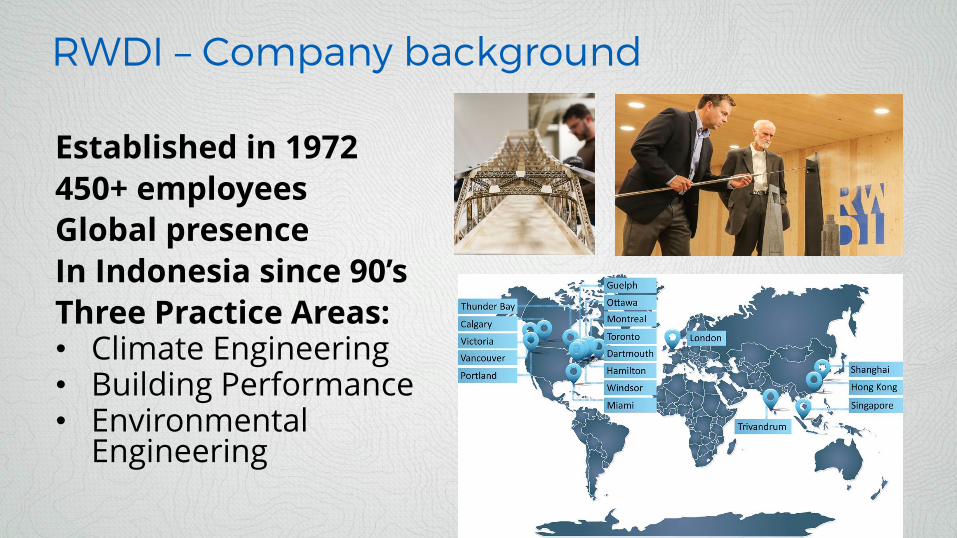
Established in 1972
450+ employees
Global presence
In Indonesia since 90’s
Three Practice Areas:• Climate Engineering• Building Performance• Environmental
Engineering
RWDI – Company background
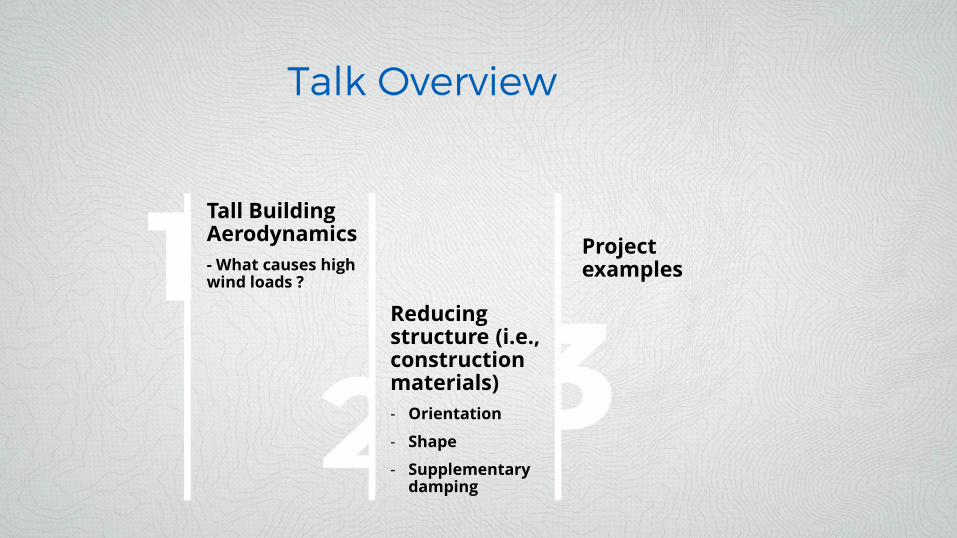
Tall Building Aerodynamics
- What causes high wind loads ?
Reducing structure (i.e., construction materials)
- Orientation
- Shape
- Supplementary damping
Project examples
Talk Overview
What causes high wind loads ?
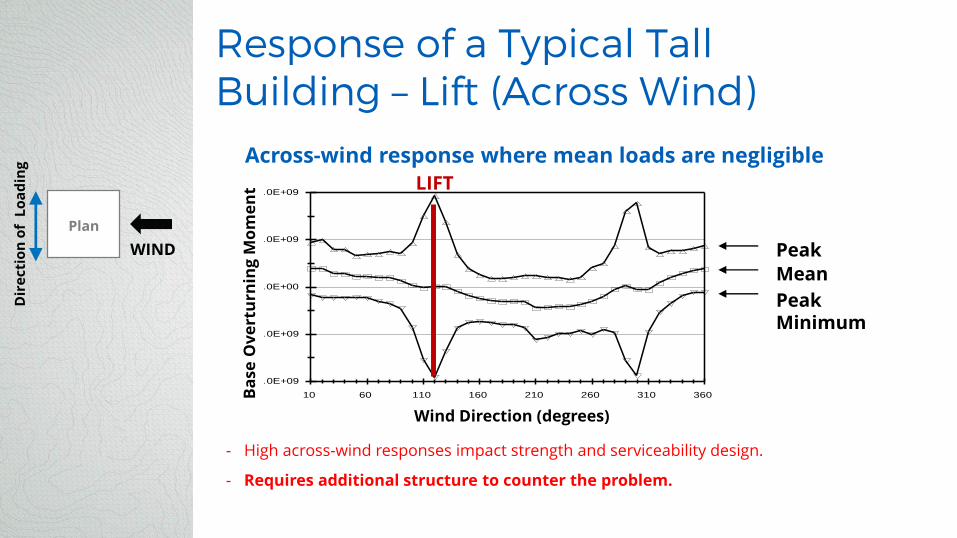
Response of a Typical Tall Building – Lift (Across Wind)
-4.0E+09
-2.0E+09
0.0E+00
2.0E+09
4.0E+09
Ba
se O
vert
urn
ing
Mo
me
nt (
N-m
)
10 60 110 160 210 260 310 360
Wind Direction (degrees)
Mx
Wind Direction (degrees)
Ba
se O
ve
rtu
rnin
g M
om
en
t
Across-wind response where mean loads are negligible
Peak MaximumMean
Peak Minimum
Dir
ecti
on
of
Lo
ad
ing
Plan
WIND
- High across-wind responses impact strength and serviceability design.
- Requires additional structure to counter the problem.
LIFT
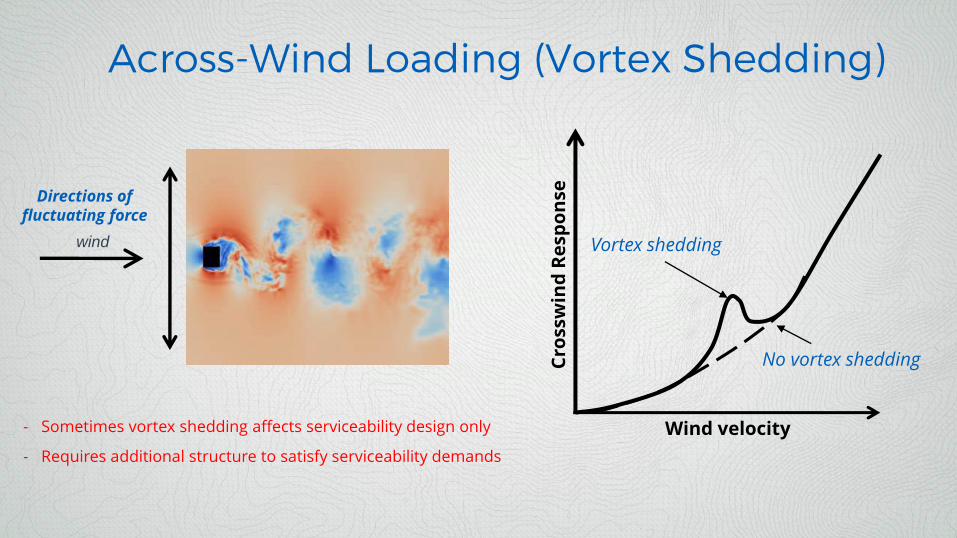
Across-Wind Loading (Vortex Shedding)
wind
Directions of fluctuating force
Wind velocity
Cro
ssw
ind
Re
spo
nse
Vortex shedding
No vortex shedding
- Sometimes vortex shedding affects serviceability design only
- Requires additional structure to satisfy serviceability demands
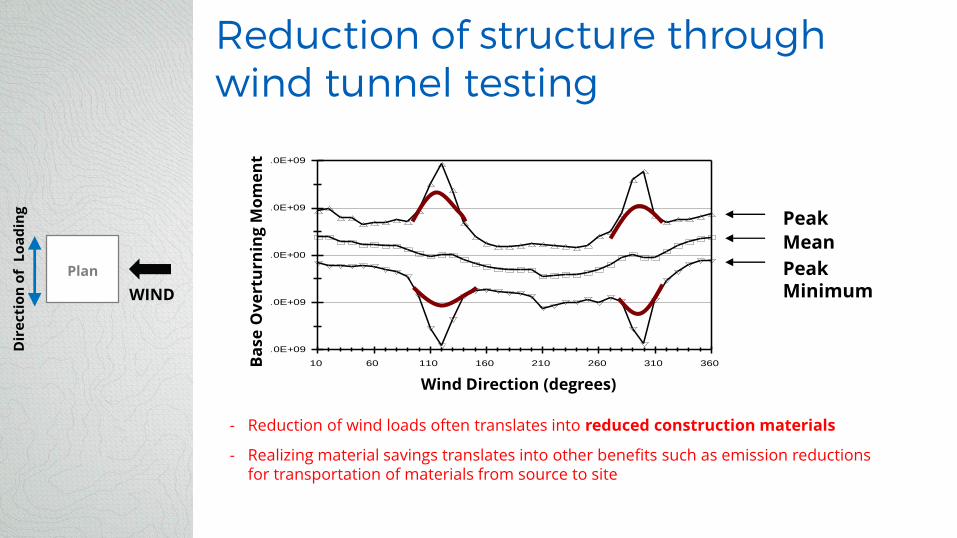
Reduction of structure through wind tunnel testing
-4.0E+09
-2.0E+09
0.0E+00
2.0E+09
4.0E+09
Ba
se O
vert
urn
ing
Mo
me
nt (
N-m
)
10 60 110 160 210 260 310 360
Wind Direction (degrees)
Mx
Wind Direction (degrees)
Ba
se O
ve
rtu
rnin
g M
om
en
t
Peak MaximumMean
Peak Minimum
Dir
ecti
on
of
Lo
ad
ing
Plan
WIND
- Reduction of wind loads often translates into reduced construction materials
- Realizing material savings translates into other benefits such as emission reductions for transportation of materials from source to site
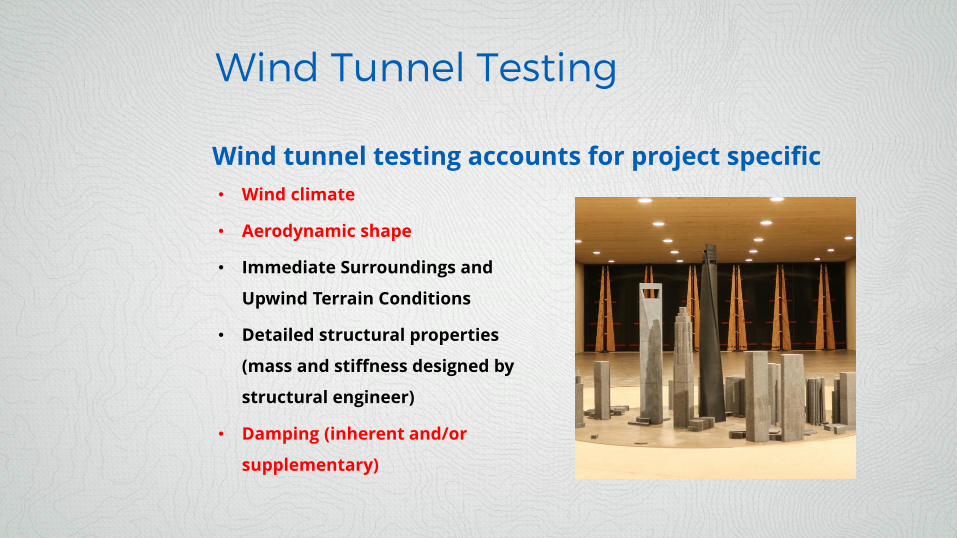
• Wind climate
• Aerodynamic shape
• Immediate Surroundings and
Upwind Terrain Conditions
• Detailed structural properties
(mass and stiffness designed by
structural engineer)
• Damping (inherent and/or
supplementary)
Wind Tunnel Testing
Wind tunnel testing accounts for project specific
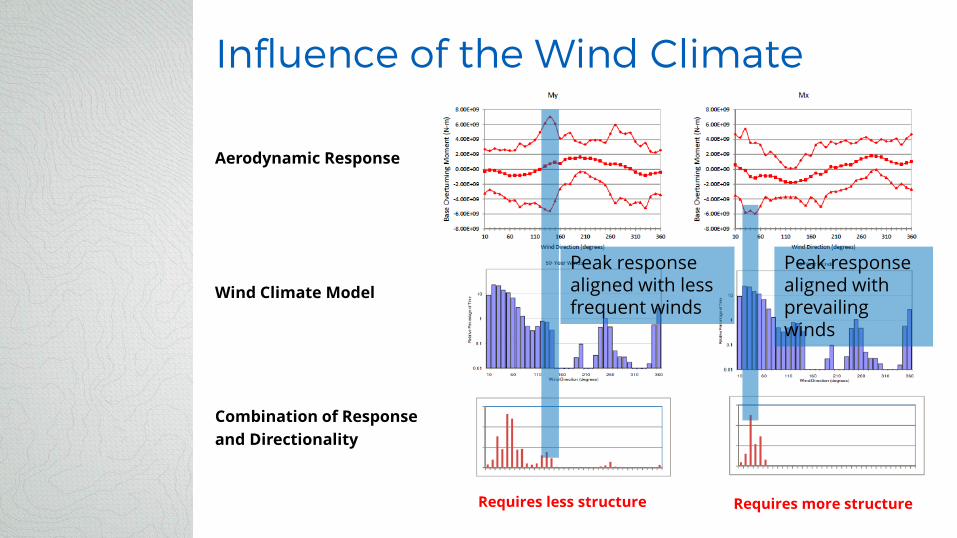
Aerodynamic Response
Wind Climate Model
Combination of Response
and Directionality
Influence of the Wind Climate
Peak response aligned with prevailing winds
Peak response aligned with less frequent winds
Requires less structure Requires more structure
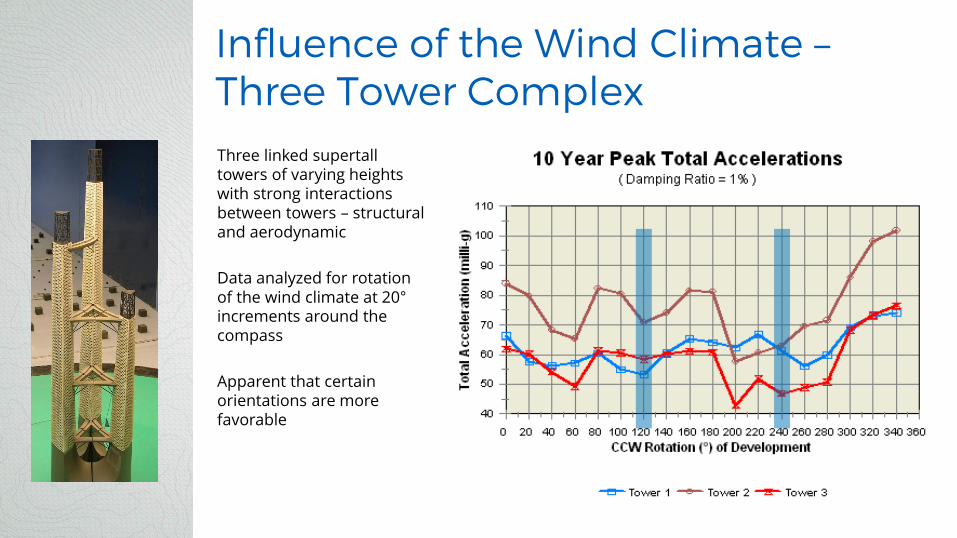
Influence of the Wind Climate –Three Tower ComplexThree linked supertall towers of varying heights with strong interactions between towers – structural and aerodynamic
Data analyzed for rotation of the wind climate at 20°increments around the compass
Apparent that certain orientations are more favorable

Optimizing building form
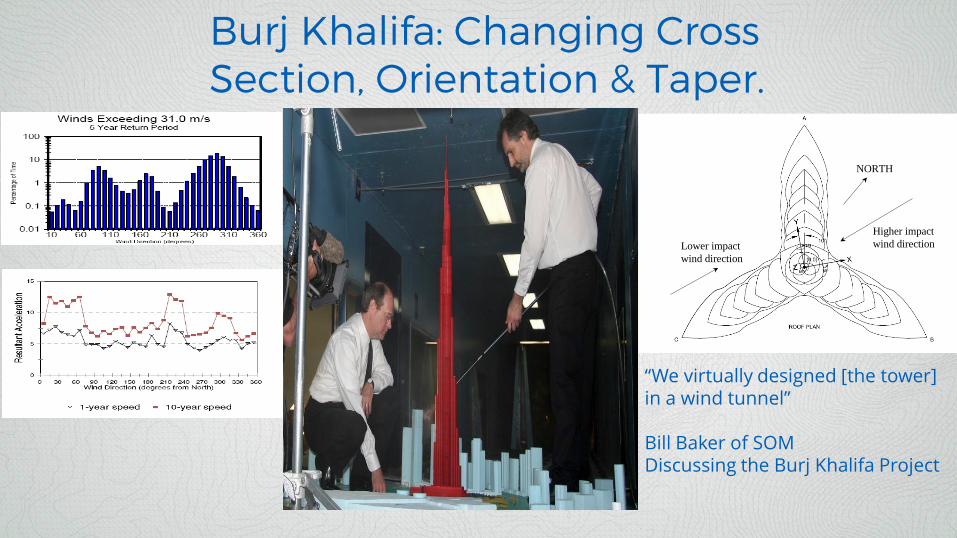
Burj Khalifa: Changing Cross Section, Orientation & Taper.
Lower impact
wind direction
Higher impact
wind direction
NORTH
“We virtually designed [the tower] in a wind tunnel”
Bill Baker of SOMDiscussing the Burj Khalifa Project
1313
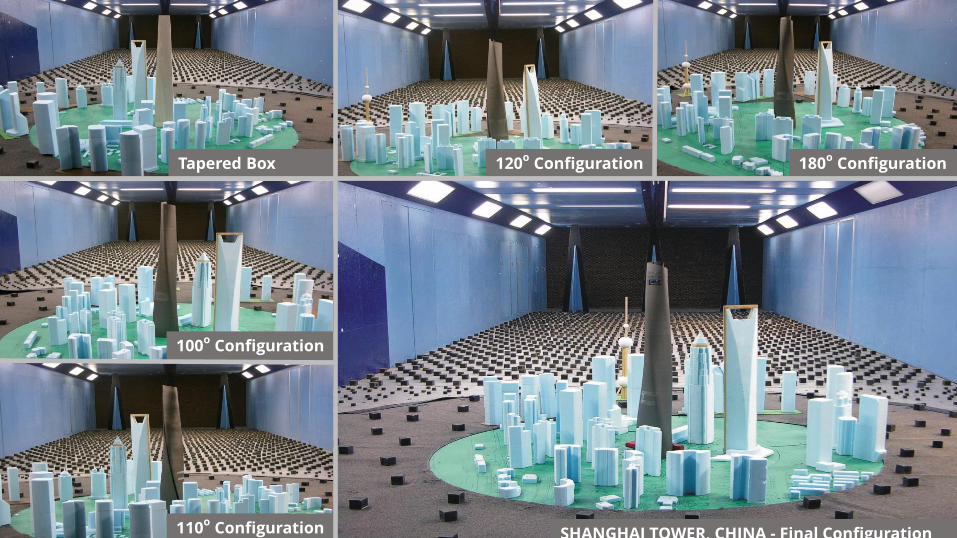
Tapered Box
100o Configuration
110o Configuration
120o Configuration 180o Configuration
SHANGHAI TOWER, CHINA - Final Configuration
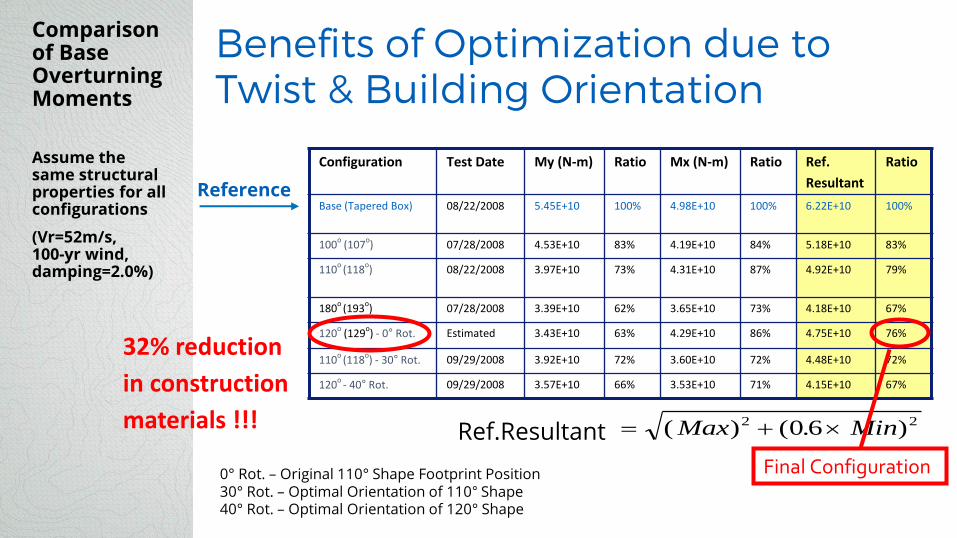
Reference
( ) ( . )Max Min2 20 6Ref.Resultant
Configuration Test Date My (N-m) Ratio Mx (N-m) Ratio Ref.
Resultant
Ratio
Base (Tapered Box) 08/22/2008 5.45E+10 100% 4.98E+10 100% 6.22E+10 100%
100o
(107o) 07/28/2008 4.53E+10 83% 4.19E+10 84% 5.18E+10 83%
110o
(118o) 08/22/2008 3.97E+10 73% 4.31E+10 87% 4.92E+10 79%
180o
(193o) 07/28/2008 3.39E+10 62% 3.65E+10 73% 4.18E+10 67%
120o
(129o) - 0° Rot. Estimated 3.43E+10 63% 4.29E+10 86% 4.75E+10 76%
110o
(118o) - 30° Rot. 09/29/2008 3.92E+10 72% 3.60E+10 72% 4.48E+10 72%
120o
- 40° Rot. 09/29/2008 3.57E+10 66% 3.53E+10 71% 4.15E+10 67%
0° Rot. – Original 110° Shape Footprint Position30° Rot. – Optimal Orientation of 110° Shape40° Rot. – Optimal Orientation of 120° Shape
Comparison of Base Overturning Moments
Assume the same structural properties for all configurations
(Vr=52m/s, 100-yr wind, damping=2.0%)
Benefits of Optimization due to Twist & Building Orientation
32% reduction
in construction
materials !!!
Final Configuration
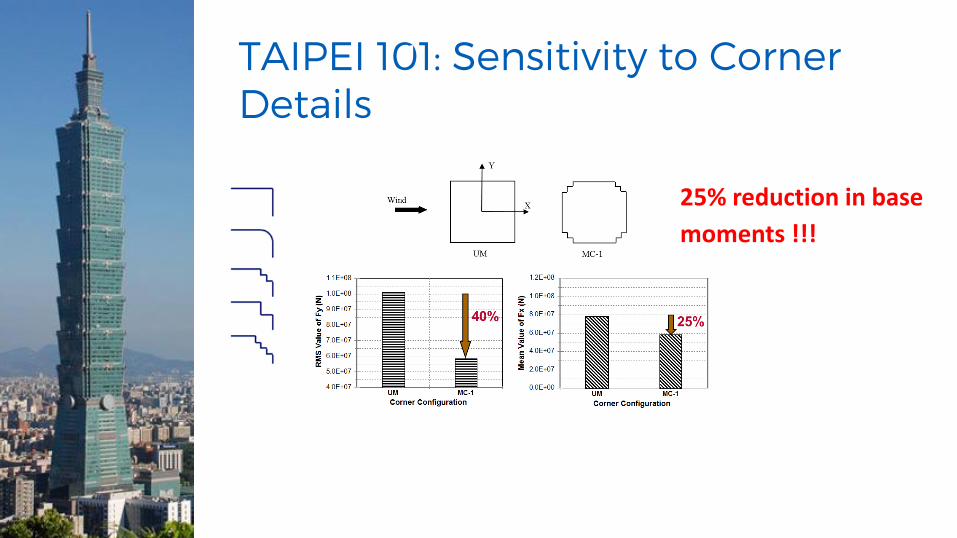
TAIPEI 101: Sensitivity to Corner Details
25% reduction in base
moments !!!
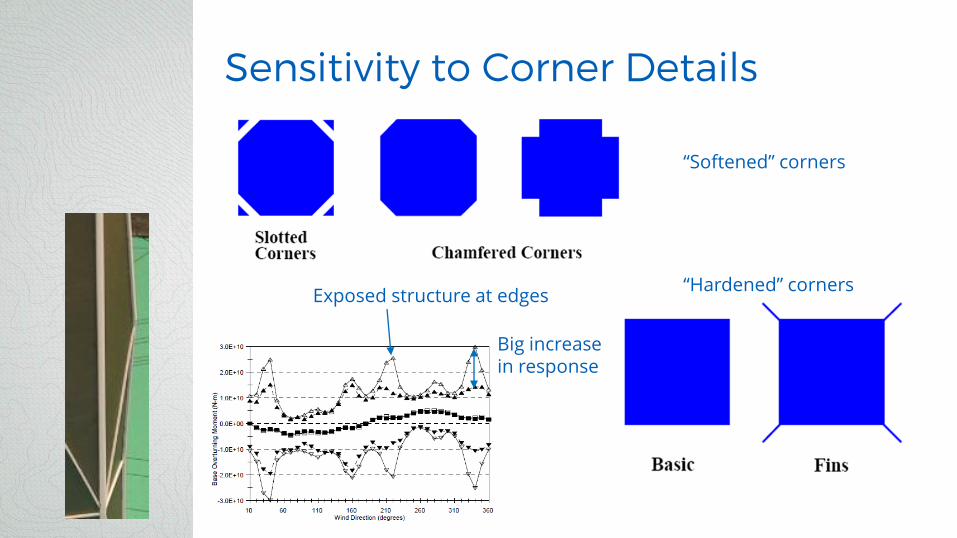
Sensitivity to Corner Details
Exposed structure at edges
“Softened” corners
“Hardened” corners
Big increase in response
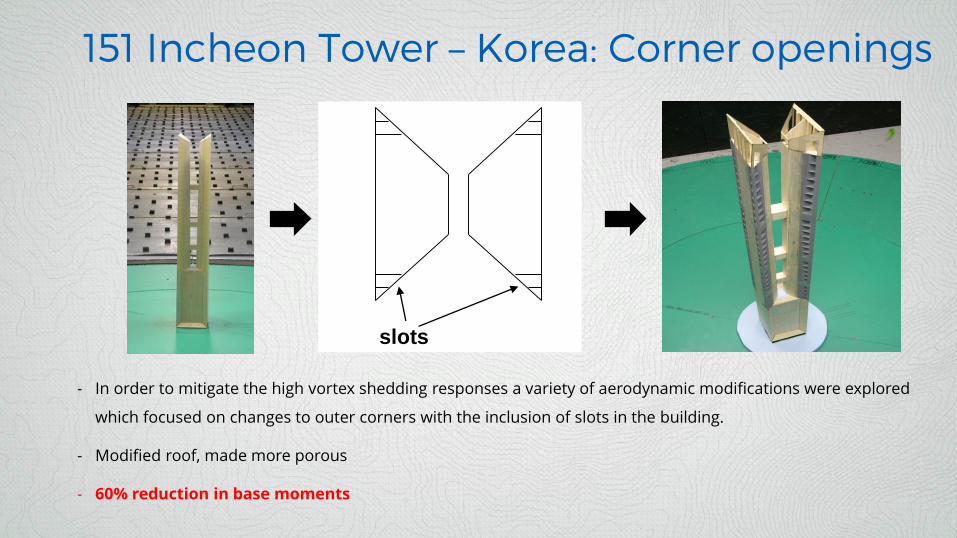
151 Incheon Tower – Korea: Corner openings
- In order to mitigate the high vortex shedding responses a variety of aerodynamic modifications were explored
which focused on changes to outer corners with the inclusion of slots in the building.
- Modified roof, made more porous
- 60% reduction in base moments
slots
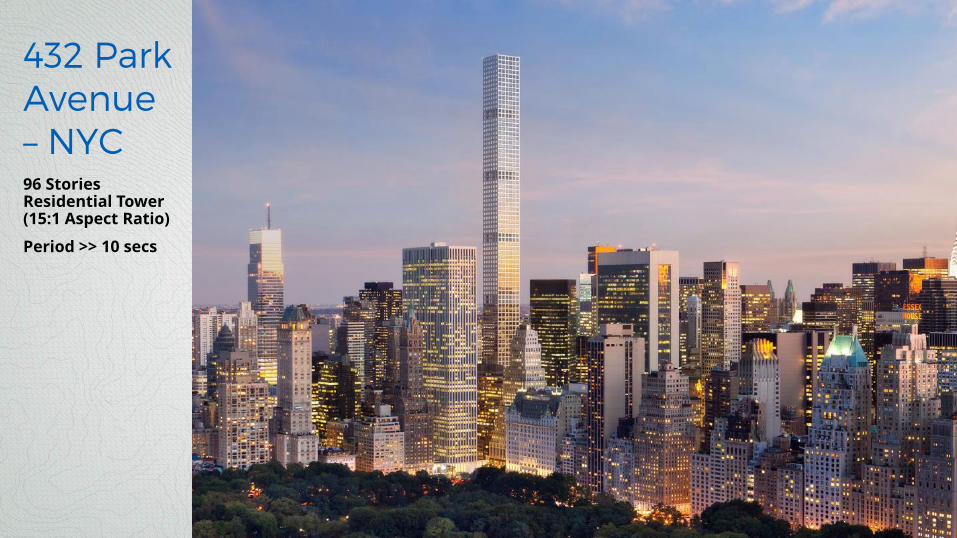
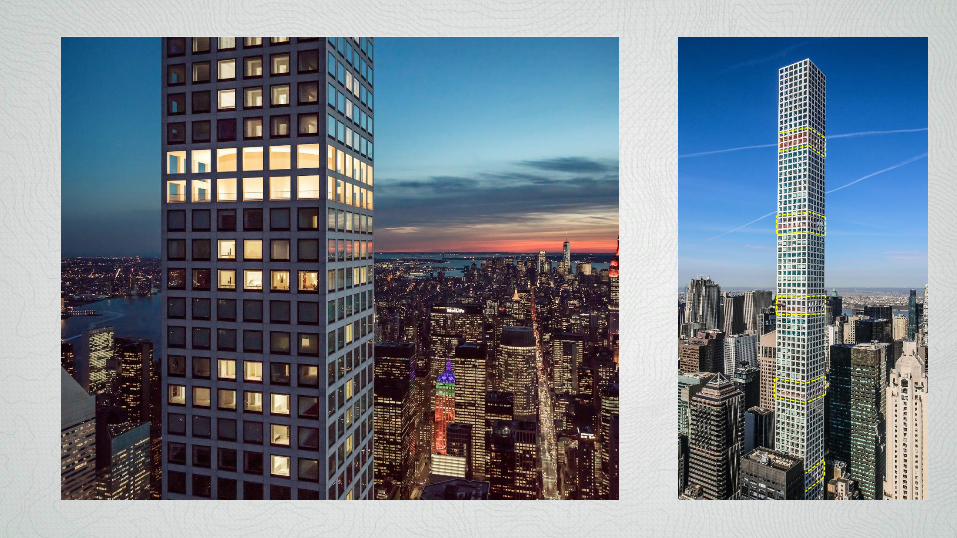
96 Stories Residential Tower (15:1 Aspect Ratio)
Period >> 10 secs
432 Park Avenue – NYC
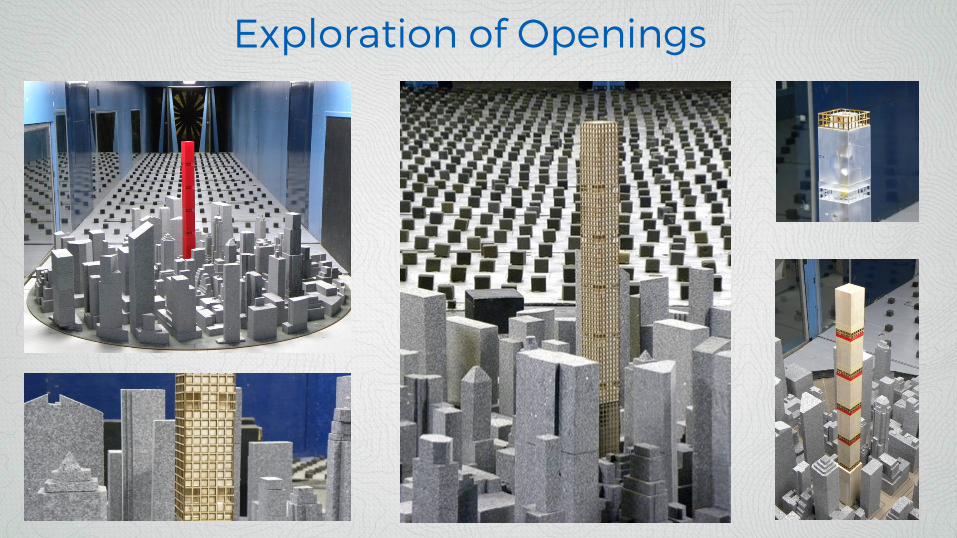
Exploration of Openings
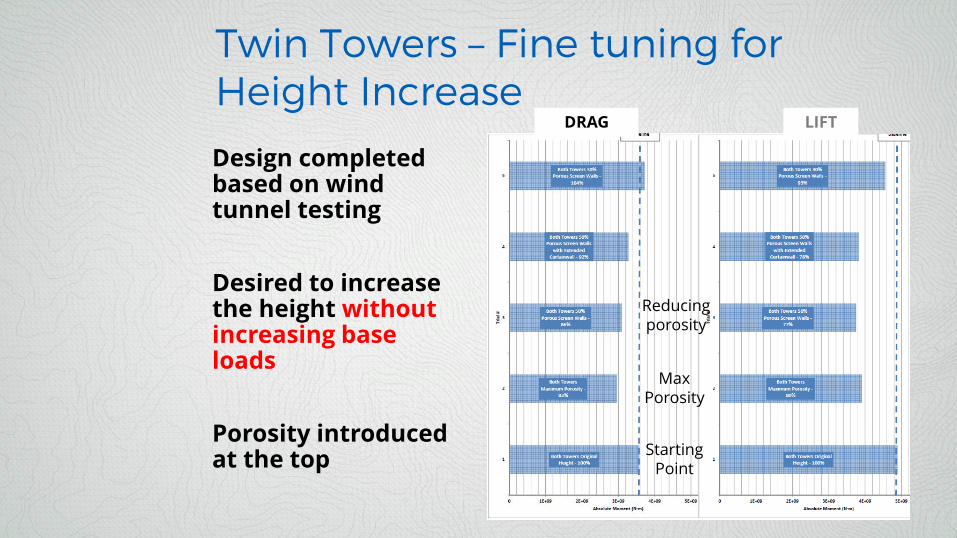
Design completed based on wind tunnel testing
Desired to increase the height without increasing base loads
Porosity introduced at the top
Twin Towers – Fine tuning for Height Increase
Starting Point
Max Porosity
Reducing porosity
DRAG LIFT
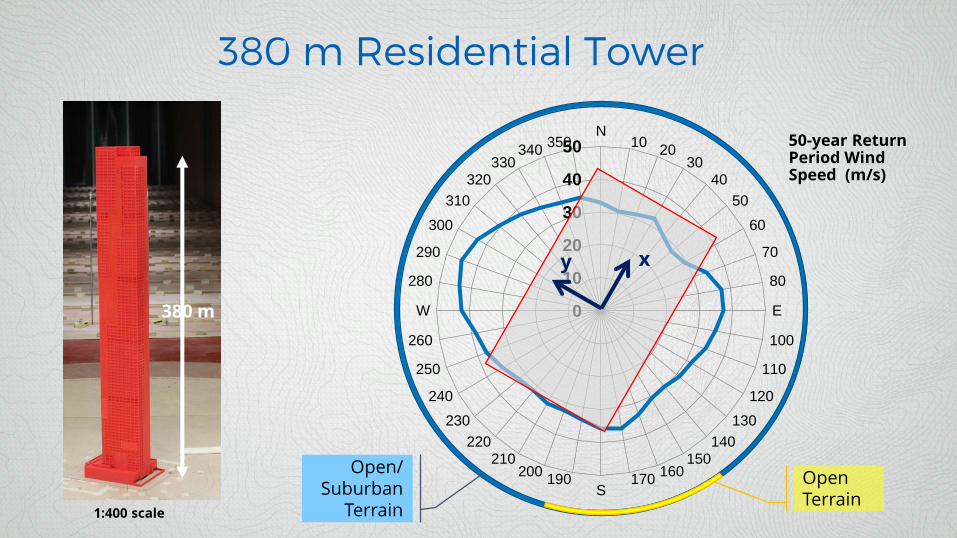
380 m Residential Tower
380 m
1:400 scale
0
10
20
30
40
50N
1020
3040
50
60
70
80
E
100
110
120
130
140150
160170
S190
200210
220
230
240
250
260
W
280
290
300
310
320330
340350
y x
Open Terrain
Open/ Suburban
Terrain
50-year Return Period Wind Speed (m/s)
0.00E+00
5.00E+09
1.00E+10
1.50E+10
2.00E+10
2.50E+10
3.00E+10
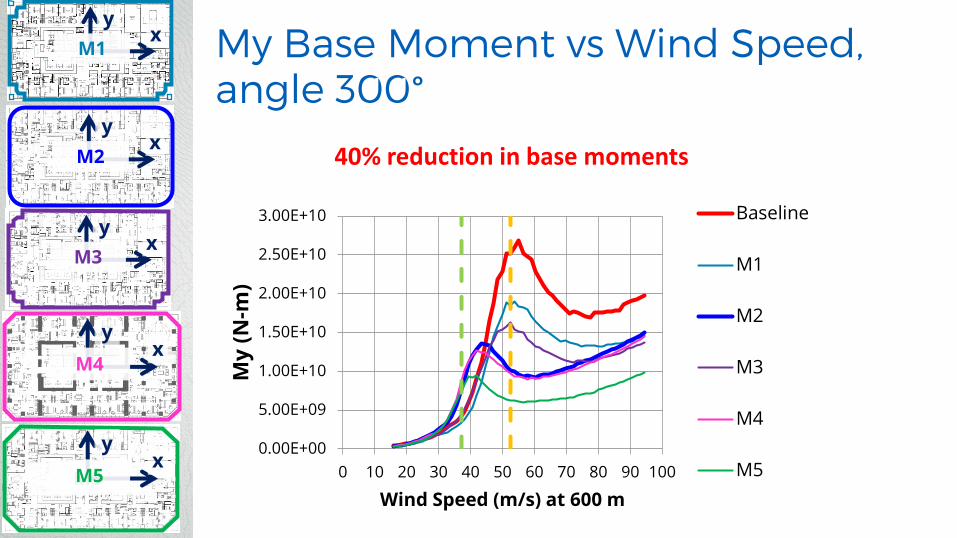
0 10 20 30 40 50 60 70 80 90 100
My
(N
-m)
Wind Speed (m/s) at 600 m
Baseline
M1
M2
M3
M4
M5
My Base Moment vs Wind Speed, angle 300°
40% reduction in base moments
M5x
y
M5
xy
M4
xy
M2
xy
M1
xy
M3

Influence of damping
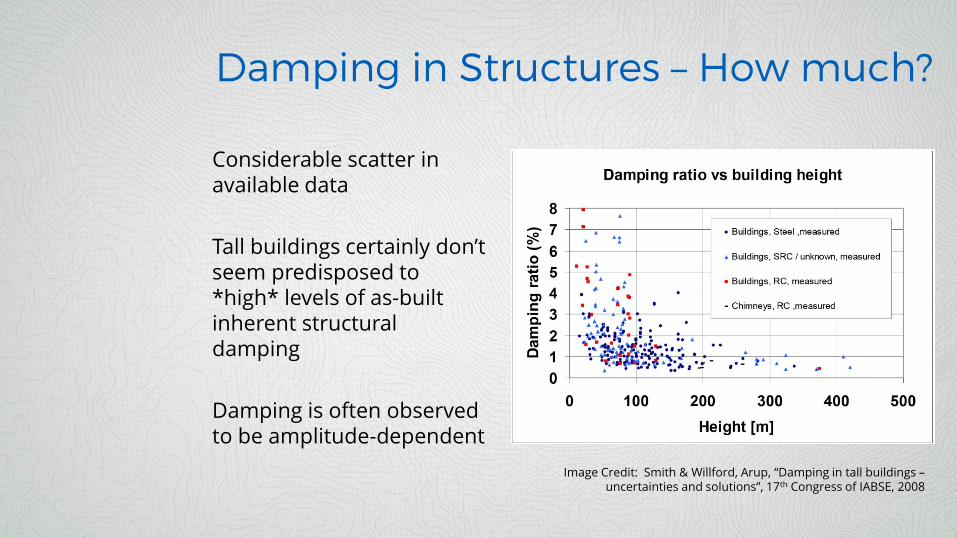
Considerable scatter in available data
Tall buildings certainly don’t seem predisposed to *high* levels of as-built inherent structural damping
Damping is often observed to be amplitude-dependent
Damping in Structures – How much?
Image Credit: Smith & Willford, Arup, “Damping in tall buildings –uncertainties and solutions”, 17th Congress of IABSE, 2008
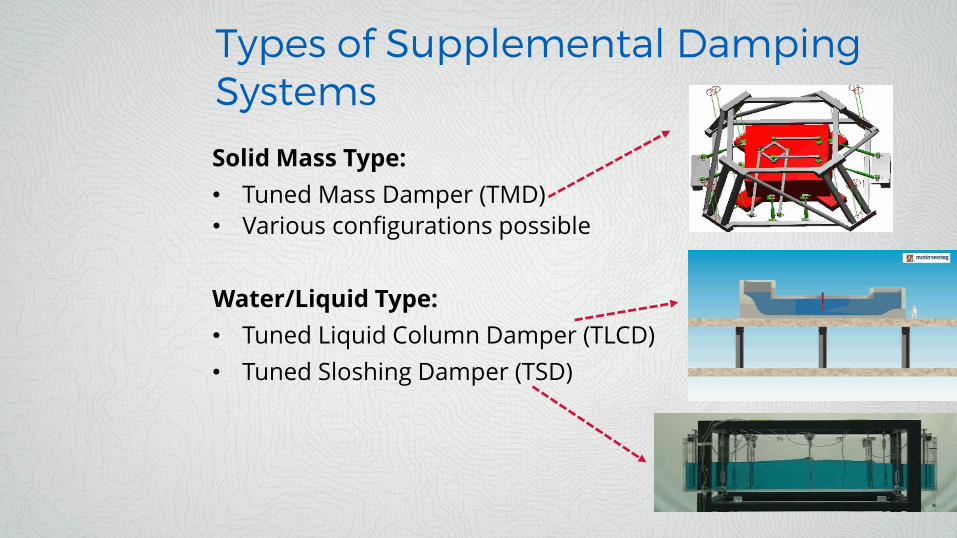
Solid Mass Type:
• Tuned Mass Damper (TMD)
• Various configurations possible
Water/Liquid Type:
• Tuned Liquid Column Damper (TLCD)
• Tuned Sloshing Damper (TSD)
Types of Supplemental Damping Systems
Benefits of Supplementary Damping for Buildings
• Achieve “High-Quality Building” standard in terms of comfort
• Save quantity of structure needed …. cost savings
• Increased revenue through increased floor space
• Sustainable Design / Green Benefits
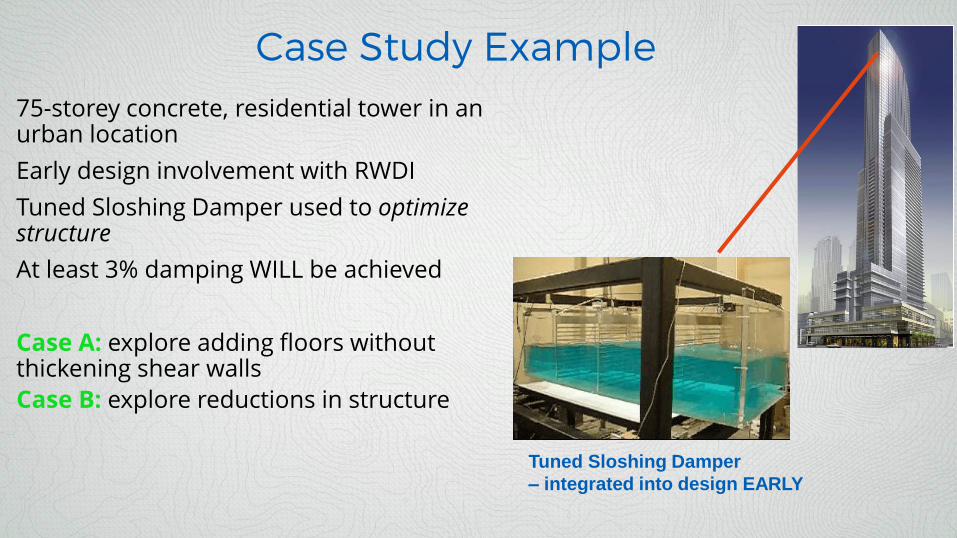
75-storey concrete, residential tower in an urban location
Early design involvement with RWDI
Tuned Sloshing Damper used to optimize structure
At least 3% damping WILL be achieved
Case A: explore adding floors without thickening shear walls
Case B: explore reductions in structure
Case Study Example
Tuned Sloshing Damper
– integrated into design EARLY
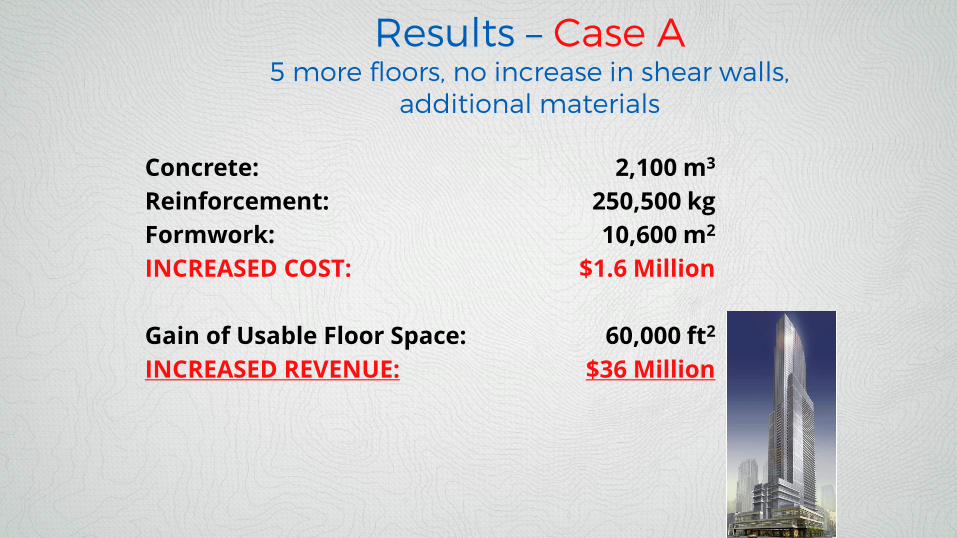
Results – Case A5 more floors, no increase in shear walls,
additional materials
Concrete: 2,100 m3
Reinforcement: 250,500 kg
Formwork: 10,600 m2
INCREASED COST: $1.6 Million
Gain of Usable Floor Space: 60,000 ft2
INCREASED REVENUE: $36 Million
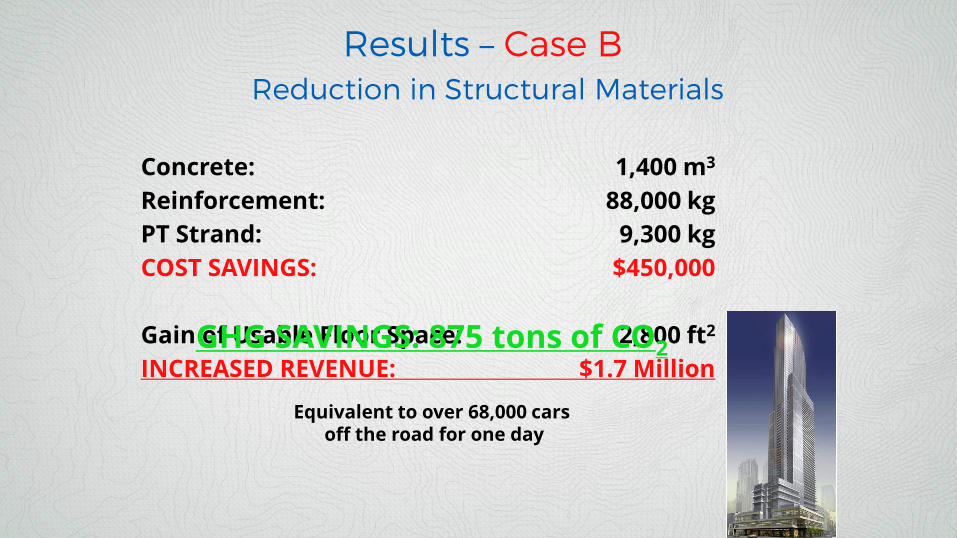
Results – Case BReduction in Structural Materials
Concrete: 1,400 m3
Reinforcement: 88,000 kg
PT Strand: 9,300 kg
COST SAVINGS: $450,000
Gain of Usable Floor Space: 2,800 ft2
INCREASED REVENUE: $1.7 MillionGHG SAVINGS: 875 tons of CO2
Equivalent to over 68,000 carsoff the road for one day