building a stress-testing framework for the household sector · building a stress-testing framework...
TRANSCRIPT

Building a stress-testing
framework for the household
sector
Martin W Johansson
PDF skapad med pdfFactory demo version www.jsk.nu

The Riksbankn Founded in 1668
n Operates an inflation target (±2 % p.a.)n Non-regulatory central bank
n Financial Stability Report (FSR) issued twice a year (first issue: 1997)
n Financial Stability Department has 40 employees
PDF skapad med pdfFactory demo version www.jsk.nu

The Swedish banks’ lendingSwedish households;
24%
Swedish non-financial firms; 23%
Foreign households; 23%
Foreign non-financial firms; 30%
Sources: The Riksbank
PDF skapad med pdfFactory demo version www.jsk.nu

Outline of presentationn A bird’s eye view of the Swedish household
sectorn Micro data
n The data setsn Constructing metrics for household
vulnerabilitiesn Stress-testing
n Conclusions
PDF skapad med pdfFactory demo version www.jsk.nu

Real house pricesindex 1953=100
Sources: Robert Shiller, OFHEO, Reuters EcoWin, Statistics Sweden and the Riksbank
0
50
100
150
200
250
1952 1955 1958 1961 1964 1967 1970 1973 1976 1979 1982 1985 1988 1991 1994 1997 2000 2003 2006
Sweden US
PDF skapad med pdfFactory demo version www.jsk.nu

Household indebtedness and interest expendituresper cent of disposable income
0
20
40
60
80
100
120
140
160
1970
1972
1974
1976
1978
1980
1982
1984
1986
1988
1990
1992
1994
1996
1998
2000
2002
2004
2006
2008
0,0
2,0
4,0
6,0
8,0
10,0
12,0
14,0
16,0
debt-to-income (lhs) interest-to-income (rhs)
Sources: Statistics Sweden and The Riksbank
PDF skapad med pdfFactory demo version www.jsk.nu
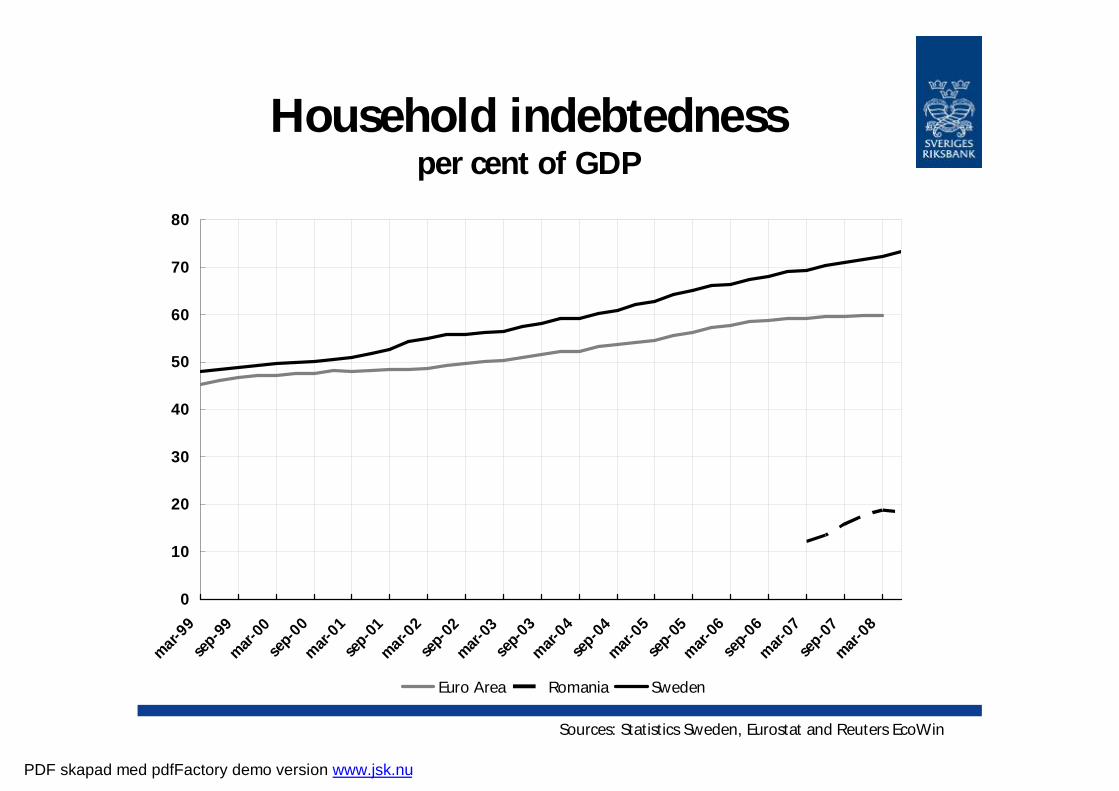
Household indebtednessper cent of GDP
Sources: Statistics Sweden, Eurostat and Reuters EcoWin
0
10
20
30
40
50
60
70
80
mar-9
9
sep-9
9
mar-0
0
sep-
00
mar
-01
sep-0
1
mar-0
2
sep-
02
mar-0
3
sep-
03
mar
-04
sep-0
4
mar-0
5
sep-
05
mar
-06
sep-
06
mar
-07
sep-0
7
mar-0
8
Euro Area Romania Sweden
PDF skapad med pdfFactory demo version www.jsk.nu

Possible threat to financial stability (and macroeconomic stability)
n Household debt has increased sharply in the last few years. What happens to the ability to pay if…n Unemployment rise?n Interest rates go up?
n How many households will end up with negative equity if house prices fall by 20 per cent?
PDF skapad med pdfFactory demo version www.jsk.nu

Possible avenuesn Time-series analysis
n Example: Running a univariate regression or VAR on non performing loans, Profit/Loss, GDP, interest rates, inflation etc
n See e.g. Norges Bank (2007): ” An analysis of banks’ problem loans”, Economic Bulletin 2007:2
n http://www.norges-bank.no/Upload/62923/ec_bull2_07_problem_loans.pdf
PDF skapad med pdfFactory demo version www.jsk.nu

Time-series analysisn Pros
n Timely datan Lots of useful tools (e.g. impulse-response functions,
variance decomposition and R2) n Relatively easy to incorporate with models used in
monetary policy (e.g. Bayesian VAR:s)
n Consn Disregards the distribution of income, assets and
liabilities within the household sectorn Often little (useful) variation in data
PDF skapad med pdfFactory demo version www.jsk.nu

Micro datan Micro data
n Prosn Possible to take into household heterogeneity.n Lots of variables which offers to answer wide range
of questions.n PR value
n Consn Substantial time-lagsn Confidentiality issues
PDF skapad med pdfFactory demo version www.jsk.nu

Household Finance surveyn Dataset compiled the national statistical agency
(Statistics Sweden), not the Riksbankn Annual data set (consistently constructed since 2000)
n Preliminary data release 11 months after year’s endn Final data release 15 months after year's end
n Dataset originally complied to facilitate socioeconomic studies. Not financial stability analysis. (we were just lucky)
PDF skapad med pdfFactory demo version www.jsk.nu

Household Finance survey, contn Data on individuals is mainly based on
information acquired by the tax authorities (submitted by employers, not reported by the individuals themselves)
n Still, of course, problems with measurement errors and omissions
n The survey covers 40 000 individuals, comprising 20 000 or 13 000 households depending on how a household is defined
PDF skapad med pdfFactory demo version www.jsk.nu

Household Finance survey, contn Included variables
n Income and its various componentsn Labor incomen Capital incomen Transfersn Interest expenditures
n Debtsn Student loansn Other loans (mainly mortgages)
n Assetsn Financial assets (stocks, bonds and deposits)n Residential property (assessed values)
n All in all 1000 variables
PDF skapad med pdfFactory demo version www.jsk.nu

Household Finance survey, cont
n Since 2003 half of the households in the survey answer an add-on questionnaire related to housing
n Example:n Have you borrowed money that you have
spent on non-housing items? If yes, how much?
PDF skapad med pdfFactory demo version www.jsk.nu
Preparing the data set for analysis
n Divide the data into five income groups containing an equal number of households.
n Remove households with…n Zero debt (no credit risk)
n Negative disposable income (obvious measurement errors/omission)
n The remaining households make up the sample used for analysis. N.B. each income category now holds an unequal number of households.
PDF skapad med pdfFactory demo version www.jsk.nu

Distribution of debt and assets across income categories
per cent of total
Sources: Statistics Sweden and the Riksbank
0
10
20
30
40
50
60
Quintile 1 Quintile 2 Quintile 3 Quintile 4 Quintile 5
share of total debt
share of financia l assets
share of real assets
PDF skapad med pdfFactory demo version www.jsk.nu

Debt and interest expendituresper cent of disposable income
Sources: Statistics Sweden and the Riksbank
0
50
100
150
200
250
quintile 1 quintile 2 quintile 3 quintile 4 quintile 5
0
1
2
3
4
5
6
debt (lhs)
interest expenditure (rhs)
PDF skapad med pdfFactory demo version www.jsk.nu

Some useful metricsn Household margins
n The amount of income left for a household after minimum expenditures
needed for food and clothing, interest rates and non-interest related
housing expenditures have been paid.
n Margin for household k: Mk =Disposable incomek –(base
amount)*(household sizek ) –(interest expendituresk) –(other housing
expenditures of the income decile)
n In 2006 the base amount was 39 700 SEK.
n 1 SEK ≈ 0.1 EUR ≈ 0.35 RON
PDF skapad med pdfFactory demo version www.jsk.nu

Some useful metrics, contn Example: household # 15877…
n Disposable income: 386 986 SEKn Size: 1.92 (two adult, no children)n Interest expenditures: 2 132 SEKn Debt: 56 025 SEKn Value of real assets: 3 284 560 SEKn The household resides in income decile 9 where average non-
interest housing expenditures amount to 61 110 SEK.
n Mk = (386 986 – 1.92*39 700 – 2 132 – 61 110) SEK= 247 520 SEK.
n If a household has a margin less than zero, it is termed “vulnerable”
PDF skapad med pdfFactory demo version www.jsk.nu

Some useful metrics, contn Exposure at default (EAD):
n The share of total debt held by vulnerable households
n Loss given default (LGD):n The share of total debt, held by vulnerable
debts, that is not covered by assets
PDF skapad med pdfFactory demo version www.jsk.nu

A simple example n The entire household sector consists of 5
households with total debts 10 000 SEKn Only household i and household j have margins
less than zero. This means that the proportion of vulnerable households is 2/5=40%
n Suppose household i has 800 SEK in debts and assets worth 1300 SEK. Household j has 900 SEK in debts and 600 SEK worth of assets. The EAD is (800+900)/10000= 17 %
n However, the LGD for household i is zero as its net wealth is positive. The LGD for household j is –(600-900)=300 SEK à LGD=300/10 000= 3 %
PDF skapad med pdfFactory demo version www.jsk.nu

Descriptive statistics from 2006thousands of SEK and per cent
0.02%0.6%2.2%6.3%62%Vulnerable households
314%312%316%395%392%Assets-to-debt
56%25%13%5%2%Share of total debt
5.1%4.4%4.1%3.1%4.0%Interest-to-income
211%175%161%120%204%Debt-to-income
340716721038662630Assets
1087536328168161Debt
51530720413979Disposable income
54321Income quintile à
Sources: The Riksbank and Statistics Sweden
PDF skapad med pdfFactory demo version www.jsk.nu

Proportion of vulnerable households EAD:s and LGD:s in 2006
Source: Statistics Sweden and the Riksbank
0.64 %4.03 %Σ quintiles
0.00 %0.08 %Income quintile 5
0.004 %0.3 %Income quintile 4
0.08 %1.0 %Income quintile 3
0.06 %1.3 %Income quintile 2
0.5 %1.8 %Income quintile 1
LGD (as share of total debts)
EAD (as share of total debts)
PDF skapad med pdfFactory demo version www.jsk.nu

Stress testing n Parameters:
n Interest rate changesn Swings in asset pricesn Changes in unemployment
n Variables: n The proportion of households with a margin less than
zero (“vulnerable households”)n The debt held by vulnerable households as a
proportion of total household debt (“exposure-at-default”, EAD)
n The debt held by vulnerable households that is notcovered by assets as a proportion of total household debt (LGD)
PDF skapad med pdfFactory demo version www.jsk.nu

Stress testing the interest rate1. An implicit interest rate is calculated for
each and every household by dividing interest rate expenditures with debt
2. Calculate stressed levels of interest rate expenditures by multiplying the debts of each household by a stressed level of interest rate
3. Recalculate the EAD and LGD
PDF skapad med pdfFactory demo version www.jsk.nu

Stress testing the interest raten E.g. Household no 15877
n Implicit interest rate, i=2132/56025=3,81%
n Assume interest rates rise by 2 percentage points
n New interest rate expenditure: 56025*(2+3,81)%=3252 SEK
n New Margin: (386 986 – 1.92*39 700 – 3 252 – 61 110) SEK= 246 410 SEK
PDF skapad med pdfFactory demo version www.jsk.nu

Effects of a 2-4 p.p. increase in the interest rateper cent
Note: numbers in parentheses denote the long-term effect of changes in interest rates.
Source: Statistics Sweden and the Riksbank
6.1 (8.3)5.7 (7.4)5.3 (6.4)4.6Interest ratio (iD/Y)
1.2 (1.6)1.0 (1.3)0.9 (1.2)0.6LGD
6.6 (10.0)5.9 (7.9)5.3 (7.0)4.0EAD
7.2 (8.6)7.1 (7.9)6.9 (7.4)6.5Proportion of vulnerable households
4320Increase in interest rate à
PDF skapad med pdfFactory demo version www.jsk.nu

Stress testing asset pricesn Easy!1. Write down the value of the real- and/or
financial assets of each household by a stressed percentage
2. Recalculate the EAD and LGD
PDF skapad med pdfFactory demo version www.jsk.nu

LGD:s from falling asset prices and a 4 p.p. increase in the interest rate
(per cent)
1.5 (2.0)1.3(1.8)1.2 (1.7)1.2 (1.6)
70 %80 %90 %100 %Remaining real wealth à
Source: Statistics Sweden and the Riksbank
PDF skapad med pdfFactory demo version www.jsk.nu
Stress testing the unemployment rate
n A lot trickier!1. Randomly pick an employed individual and
recalculate that individual’s income if he/she were to be unemployed
2. Do (1) until the aggregate level of unemployment reaches the stressed level
3. Form the households from the individuals4. Recalculate the EAD and LGD 5. Repeat (1)-(4) 500 times and calculate the
average EAD and LGD
PDF skapad med pdfFactory demo version www.jsk.nu

Effects of a 2-4 p.p. rise in unemploymentper cent
Source: Statistics Sweden and the Riksbank
4.74.74.74.6Interest ratio (iD/Y)
0.70.70.70.6LGD
4.94.74.54.0EAD
7.06.96.86.5Proportion of vulnerable households
4320Increase in unempl. rate à
PDF skapad med pdfFactory demo version www.jsk.nu

How to forecast the metrics?n Data is at least 11-15 months old. What
does things look like today?n Disposable income for all households is
assumed to grow in line with data from the national accounts
n Prices and interest rates are also assumed to change in line with the national averages
n Stress tests can then be performed on ”updated” data
PDF skapad med pdfFactory demo version www.jsk.nu

Conclusions n Credit losses are more vulnerable to interest rate
hikes than to rising unemploymentn Question: How bad are the stressed EAD:s and
LGD:s?n Our conclusion: An adverse macroeconomic
outcome would increase credit losses in the banking sector, although it seems unlikely it would pose a threat to the stability of the financial system
n Challenge: Roughly half of the lending of the Swedish banks is abroad.
PDF skapad med pdfFactory demo version www.jsk.nu

Profit before loan losses and net loan losses in the major banks
Four-quarter totals. SEK billion. 2008 prices
-20
0
20
40
60
80
100
dec-9
0
dec-9
1
dec-92
dec-93
dec-94
dec-95
dec-96
dec-97
dec-9
8
dec-9
9
dec-00
dec-0
1
dec-0
2
dec-0
3
dec-0
4
dec-05
dec-06
dec-07
dec-08
Profit before loan lossesLoan lossesProfit before loan losses according to IFRS
Sources: Banks’ report and the Riksbank
PDF skapad med pdfFactory demo version www.jsk.nu