building a search engine to find and robustly …...building a search engine to find and robustly...
TRANSCRIPT
Building a search engine to find and robustly
identify environmental factors with
phenotype and disease
Chirag J Patel
Unite for Sight
4/14/2018
@chiragjp
www.chiragjpgroup.org

P = G + EType 2 Diabetes
Cancer
Alzheimer’s
Gene expression
Phenotype Genome
Variants
Environment
Infectious agents
Diet + Nutrients
Pollutants
Drugs

We are great at G investigation!
>4000 (as of 1/1/18)
36,066 G-P associations
Genome-wide Association Studies (GWAS)
https://www.ebi.ac.uk/gwas/
G

Nothing comparable to elucidate E influence!
E: ???
We lack high-throughput methods
and data to discover new E in P…
A similar paradigm for discovery should exist
for E!
Why?
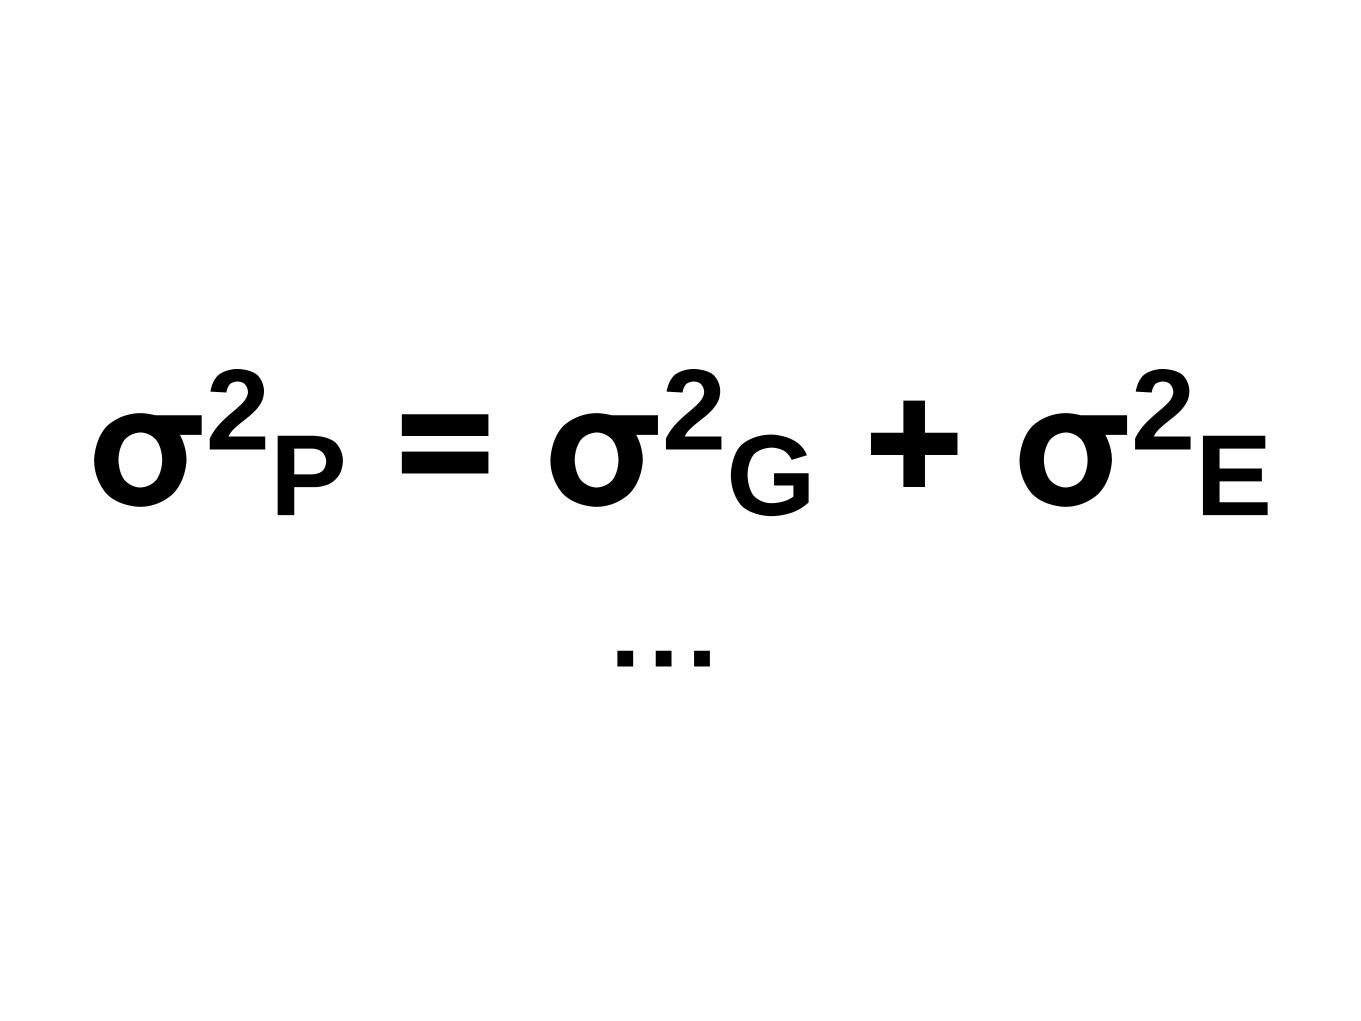
σ2P = σ2
G + σ2E
…
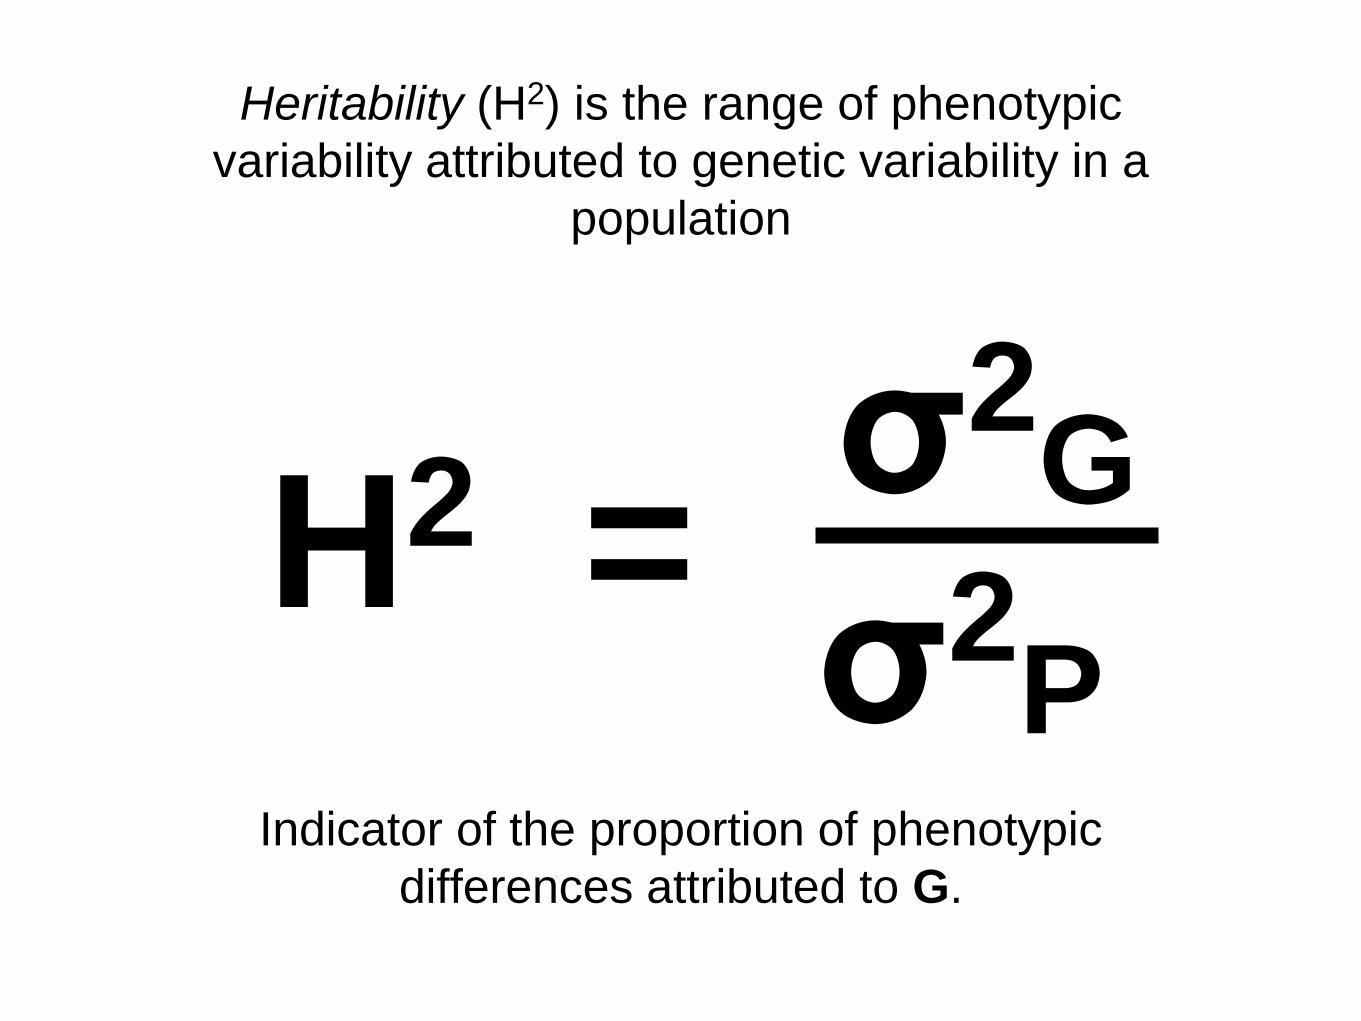
σ2G
σ2P
H2 =
Heritability (H2) is the range of phenotypic
variability attributed to genetic variability in a
population
Indicator of the proportion of phenotypic
differences attributed to G.

Height is an example of a heritable trait:
Francis Galton shows how its done (1887)
“mid-height of 205 parents described 60% of variability of 928
offspring”
What else describes height?
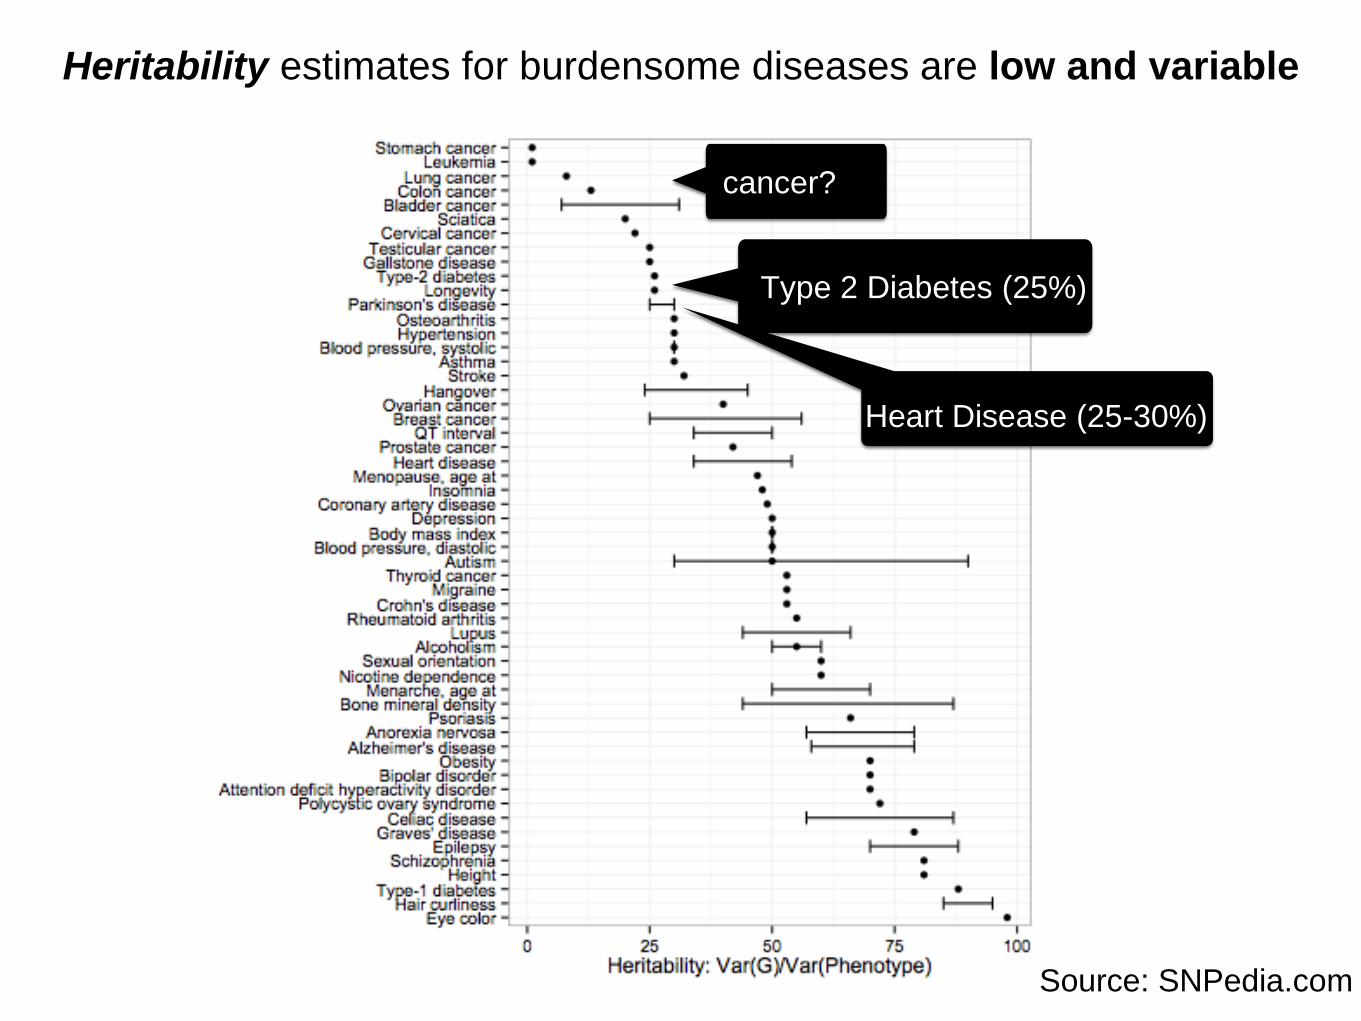
Source: SNPedia.com
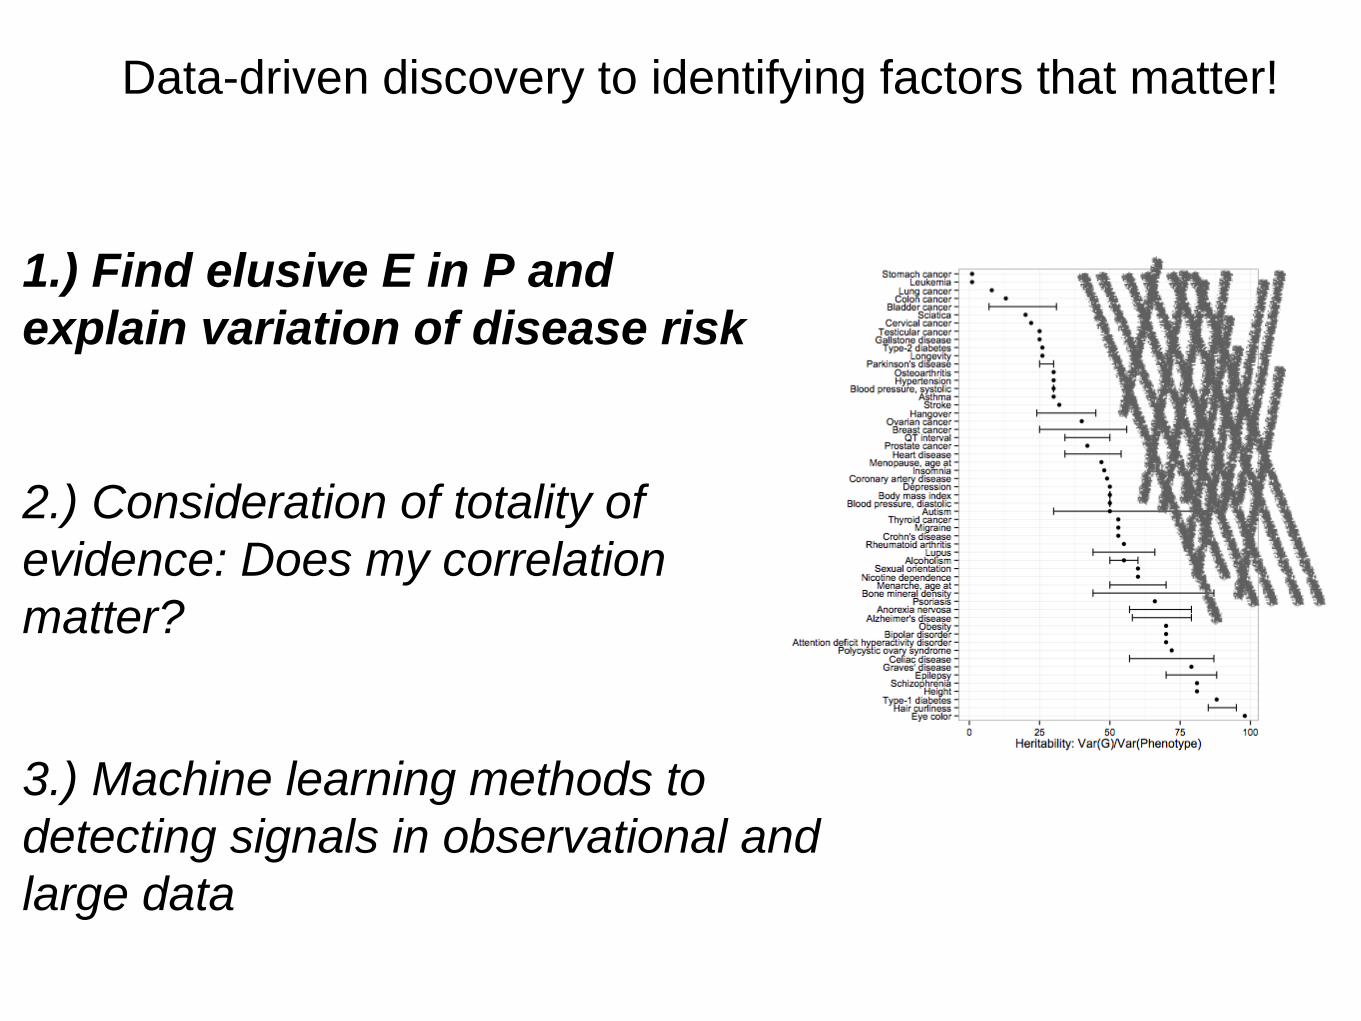
Heritability estimates for burdensome diseases are low and variable
Type 2 Diabetes (25%)
Heart Disease (25-30%)
cancer?

Source: SNPedia.com
G estimates for complex disease (P) are low and variable:
massive opportunity for high-throughput E discovery
σ2E
What describes this variation NOT explained by
genetics?
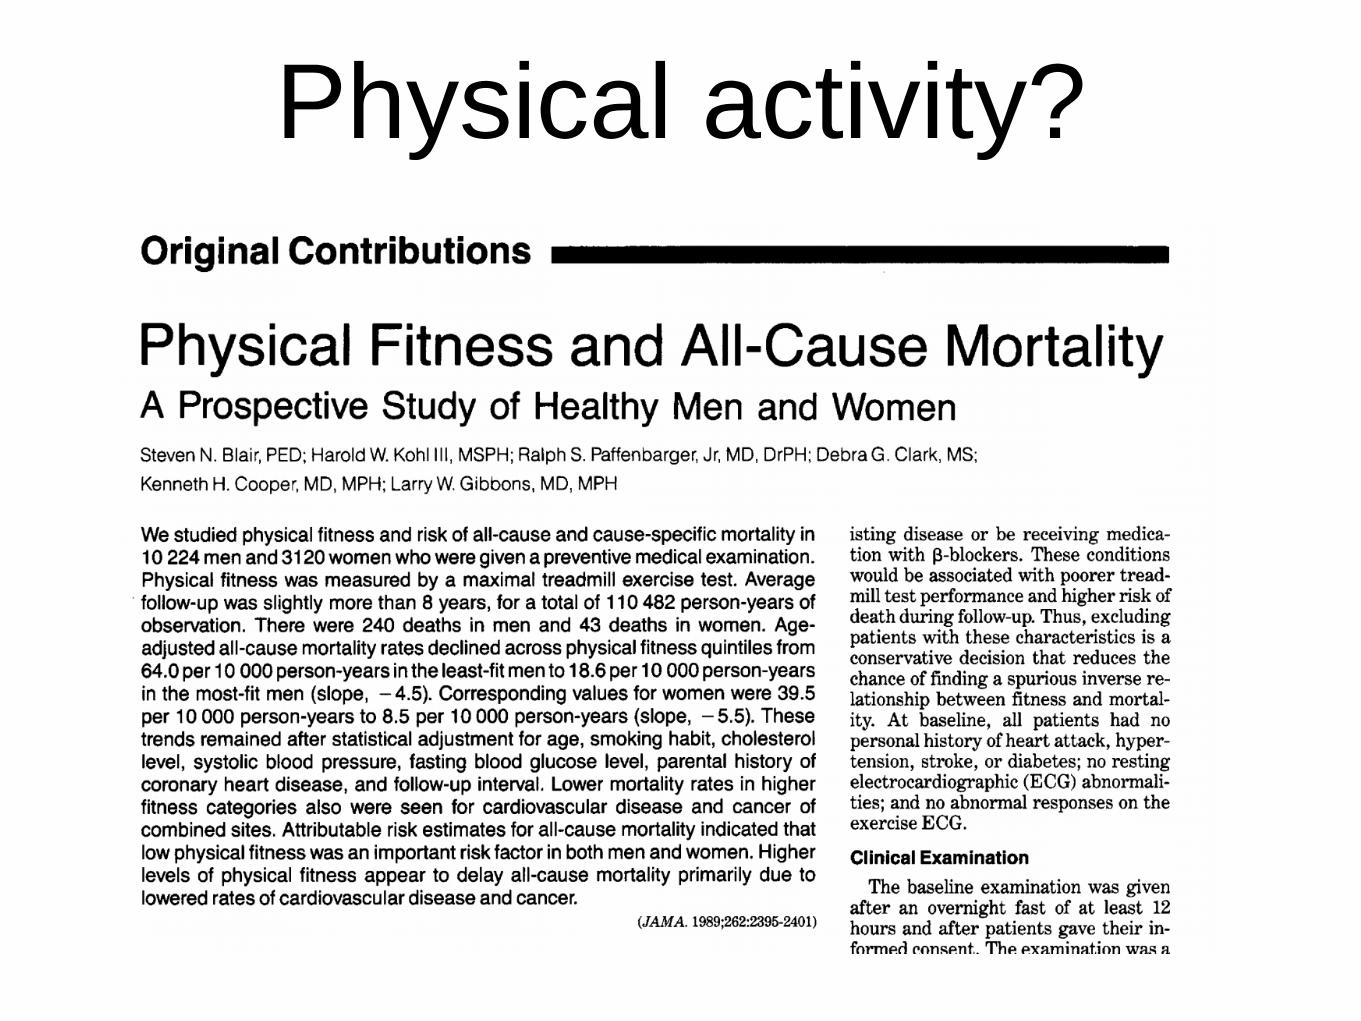
Physical activity?

Is it coffee…?
HR: 0.9 in N=500K

HR: 0.9 in N=50K
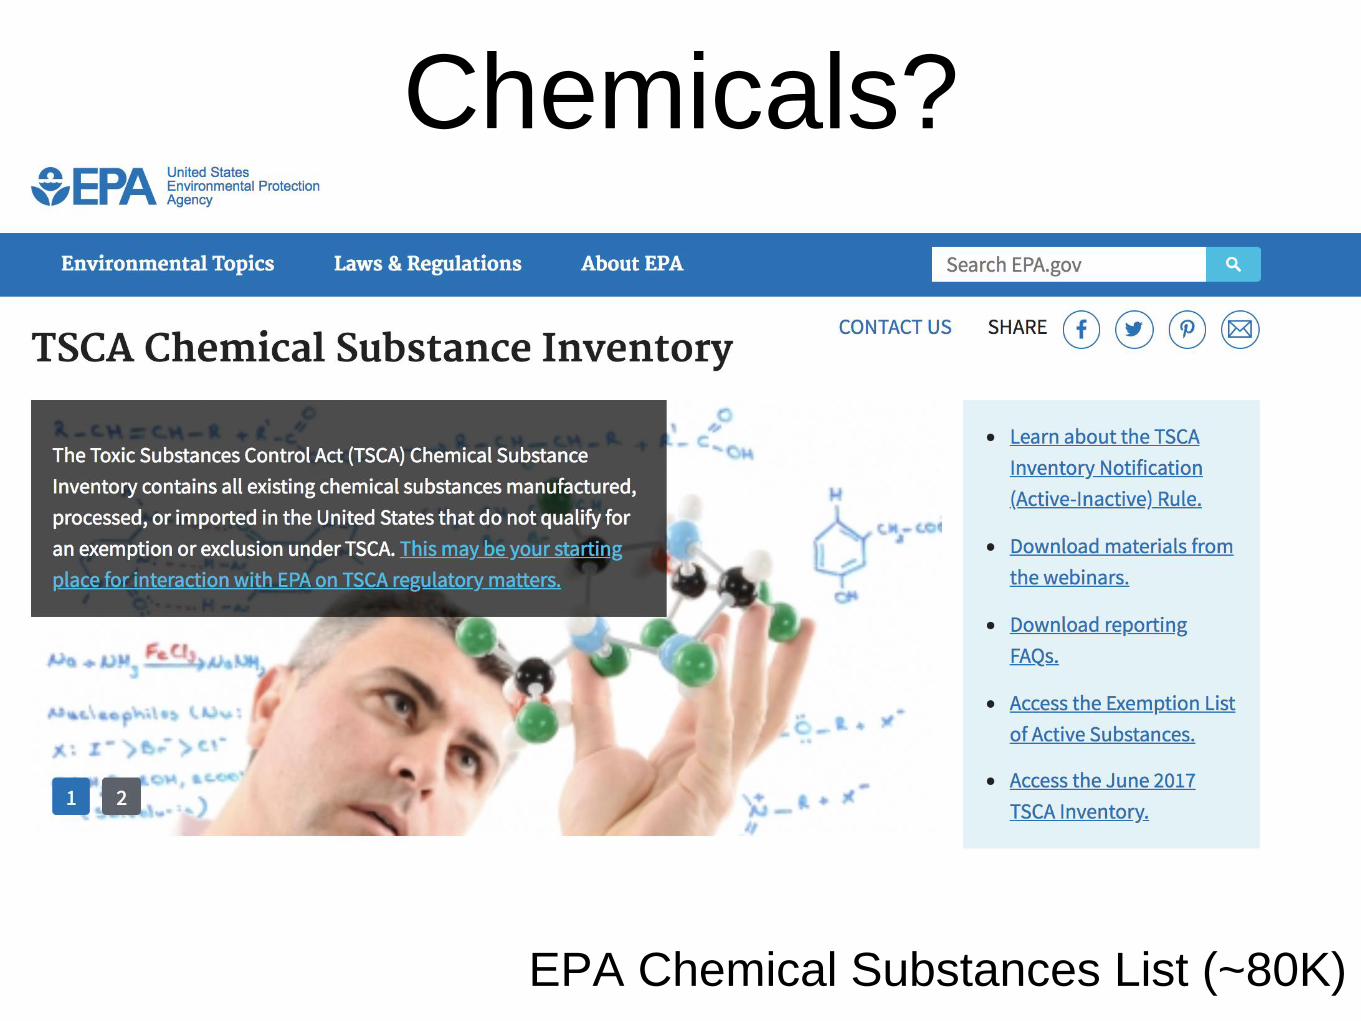
Chemicals?
EPA Chemical Substances List (~80K)

via tylervigen.com
… we just don’t know


We just don’t know:
Is everything we are exposed to associated with cancer?
Schoenfeld and Ioannidis, AJCN 2012
50 random ingredients from
Boston Cooking School
Cookbook
Any associated with cancer?
Of 50, 40 studied in cancer risk
Weak statistical evidence:
non-replicated
inconsistent effects
non-standardized
… we just don’t know
http://fivethirtyeight.com/features/you-cant-trust-what-you-read-about-nutrition/

The problem remains:
(1) what explains the missing variation in phenotype…
σ2E

So the problem remains:
(2) and how do we find the stuff that matters?
E: ???Diet
Infection
Pollution
Drugs

We are great at G investigation!
>4000 (as of 1/1/18)
36,066 G-P associations
Genome-wide Association Studies (GWAS)
https://www.ebi.ac.uk/gwas/
G
How did genetics-based investigations advance?
(And advance so quickly?)

A new paradigm of GWAS for discovery of G in P:
Human Genome Project to GWAS
Sequencing of the genome
2001
HapMap project:
http://hapmap.ncbi.nlm.nih.gov/
Characterize common variation
2001-current day
High-throughput variant
assay
< $99 for ~1M variants
Measurement tools
~2003 (ongoing)
Nature 2008
Comprehensive, high-throughput analyses
GWAS
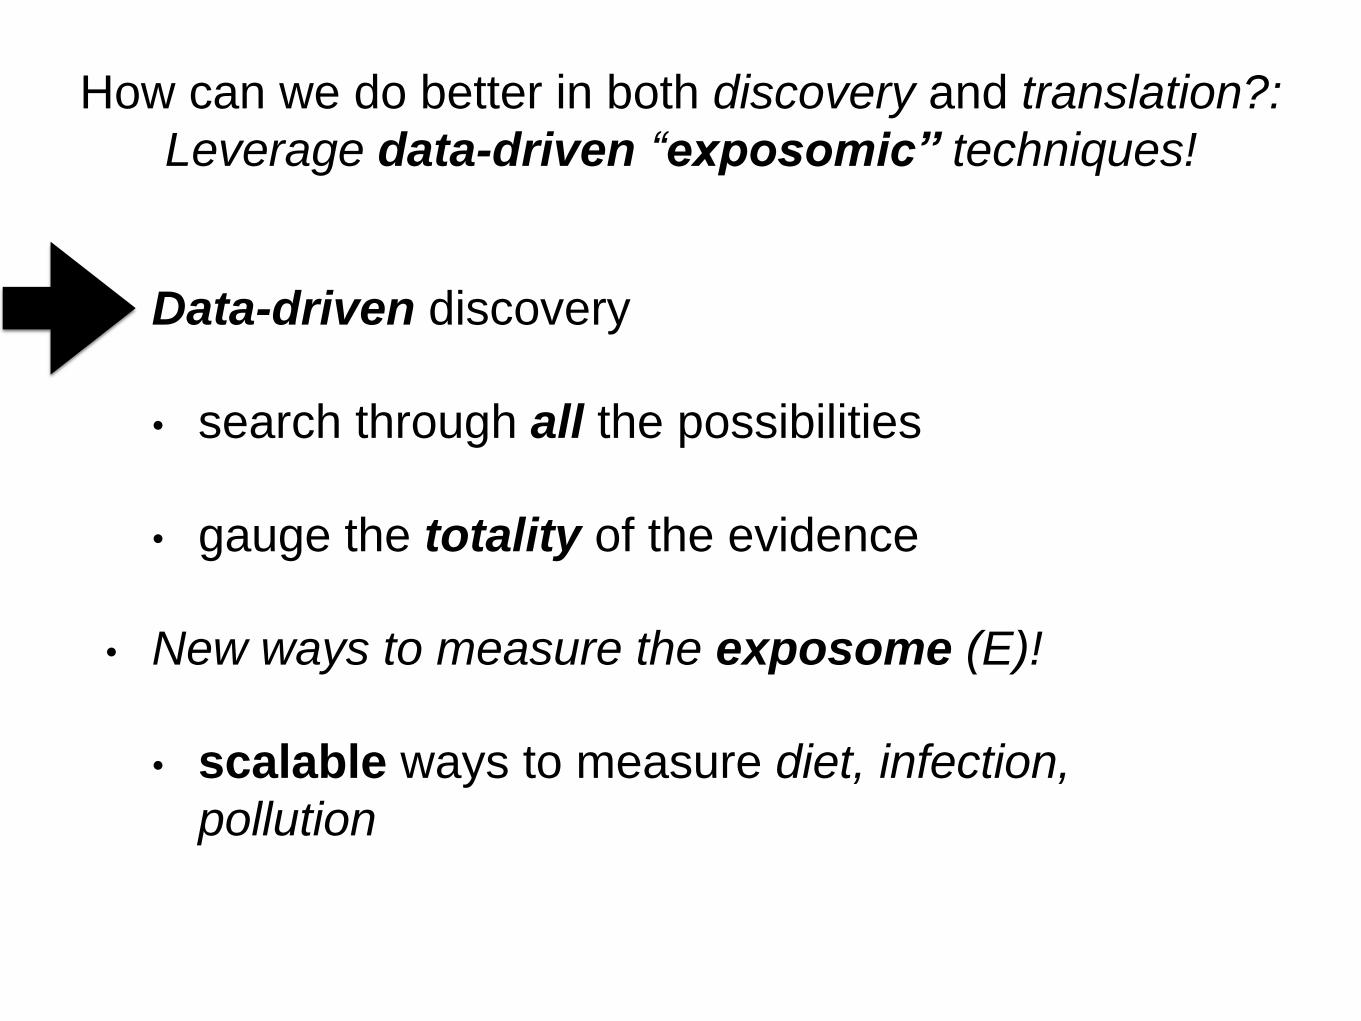
How can we do better in both discovery and
translation?:
Leverage data-driven “exposomic” techniques!
• Data-driven discovery
• search through all the possibilities
• gauge the totality of the evidence
• New ways to measure the exposome (E)!
• scalable ways to measure diet, infection,
pollution
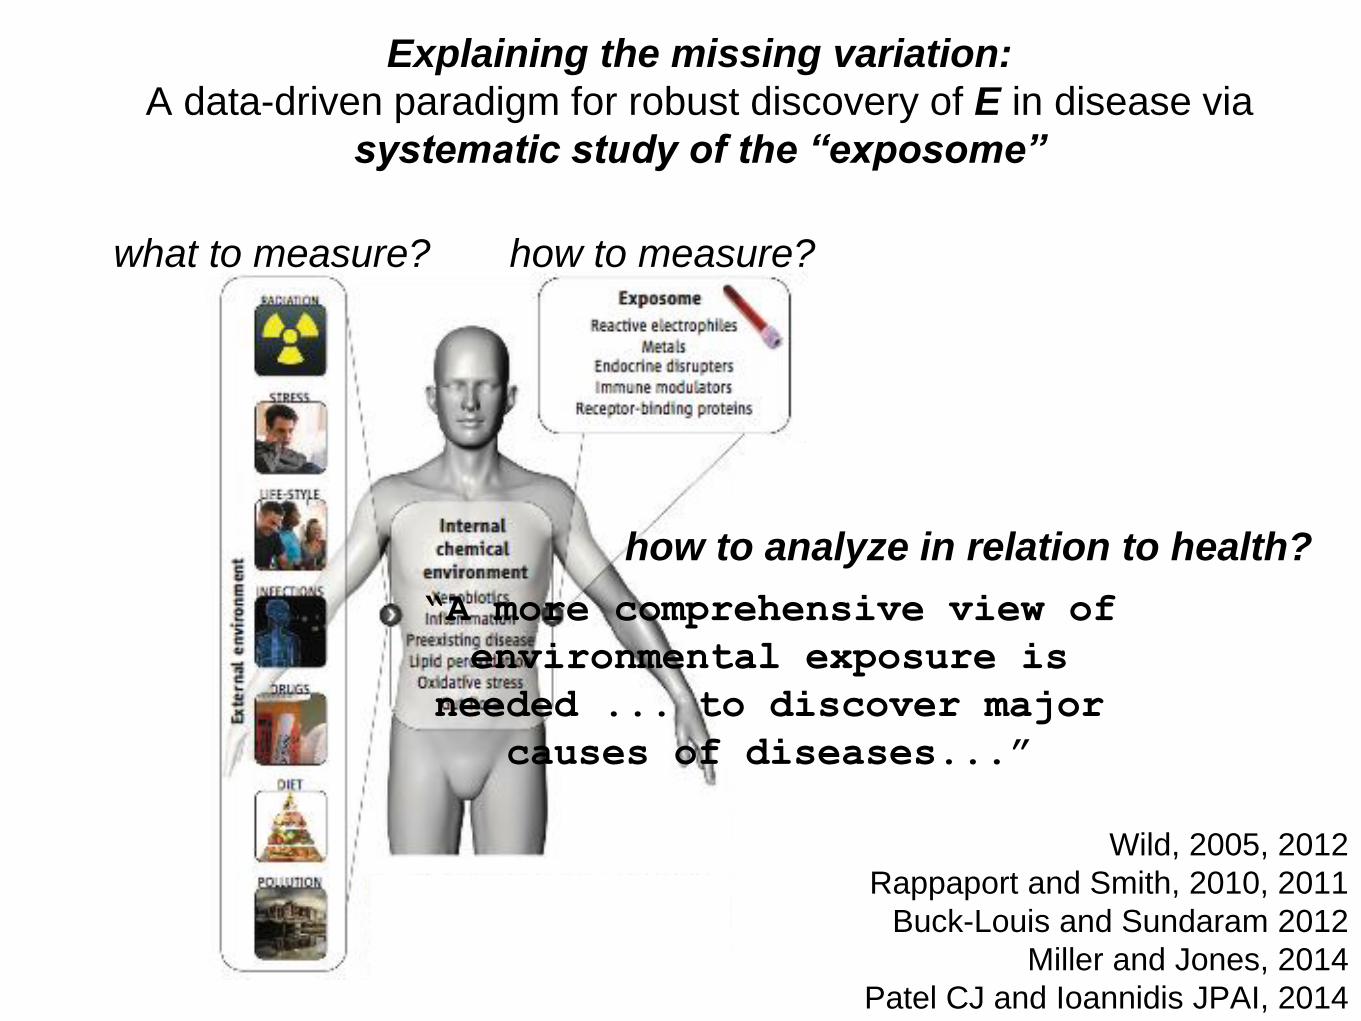
Explaining the missing variation:
A data-driven paradigm for robust discovery of E in disease via
systematic study of the “exposome”
what to measure? how to measure?
“A more comprehensive view of
environmental exposure is
needed ... to discover major
causes of diseases...”
how to analyze in relation to health?
Wild, 2005, 2012
Rappaport and Smith, 2010, 2011
Buck-Louis and Sundaram 2012
Miller and Jones, 2014
Patel CJ and Ioannidis JPAI, 2014

Possible to use existing technologies for E
Exposure (and P) Assessment…
CEBP 2017
… however, heterogeneous measures that require different study
designs and analytic approaches.
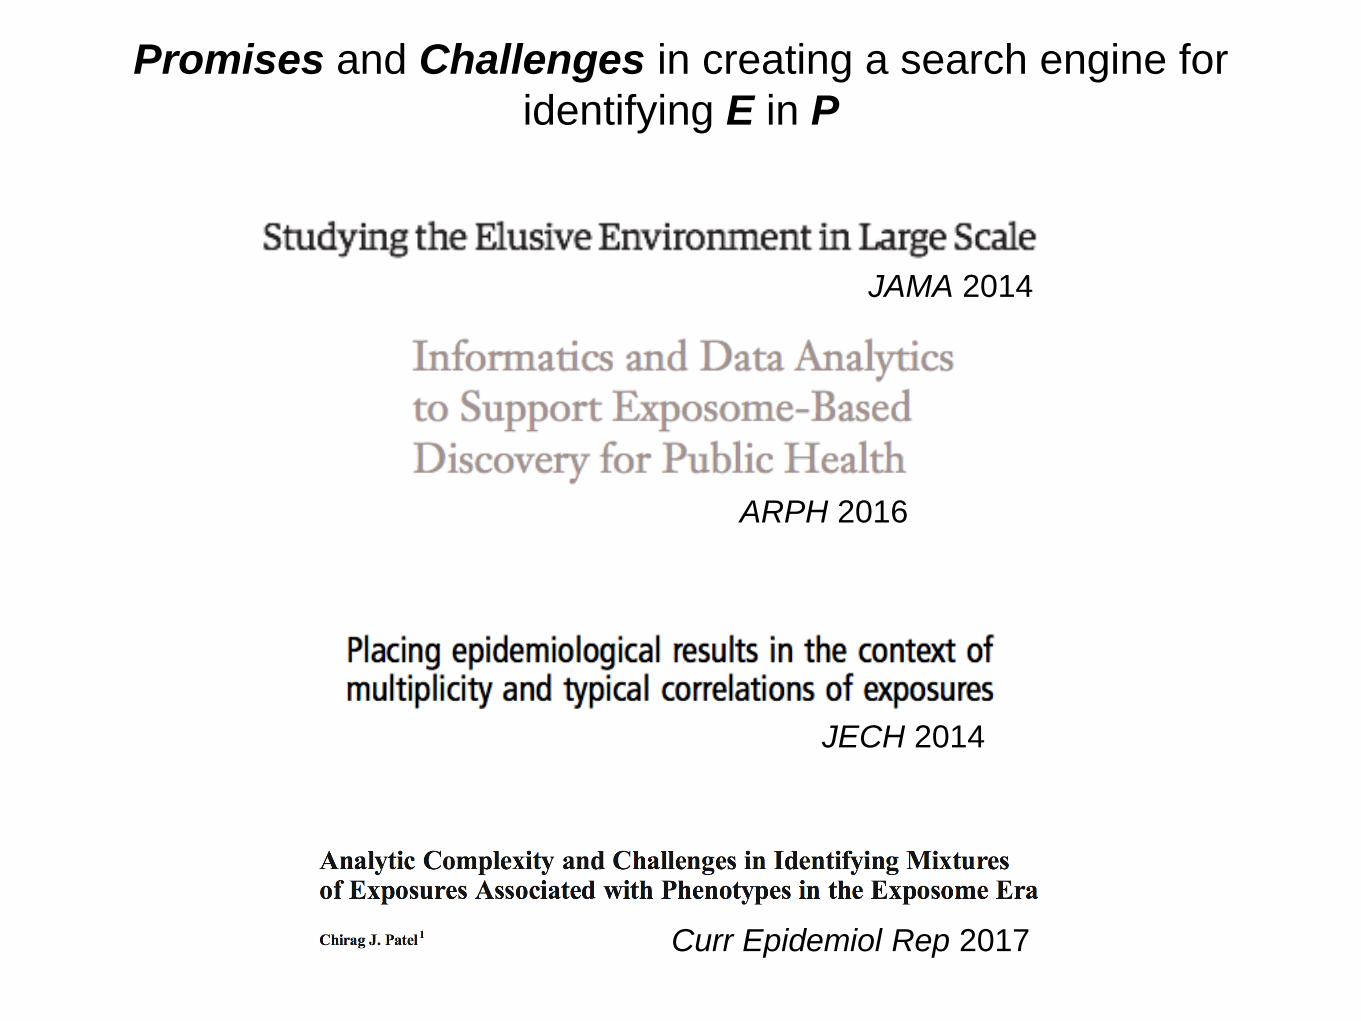
Promises and Challenges in creating a search engine for
identifying E in P
JAMA 2014
ARPH 2016
JECH 2014
Curr Epidemiol Rep 2017

Examples of data-driven discovery for E associations
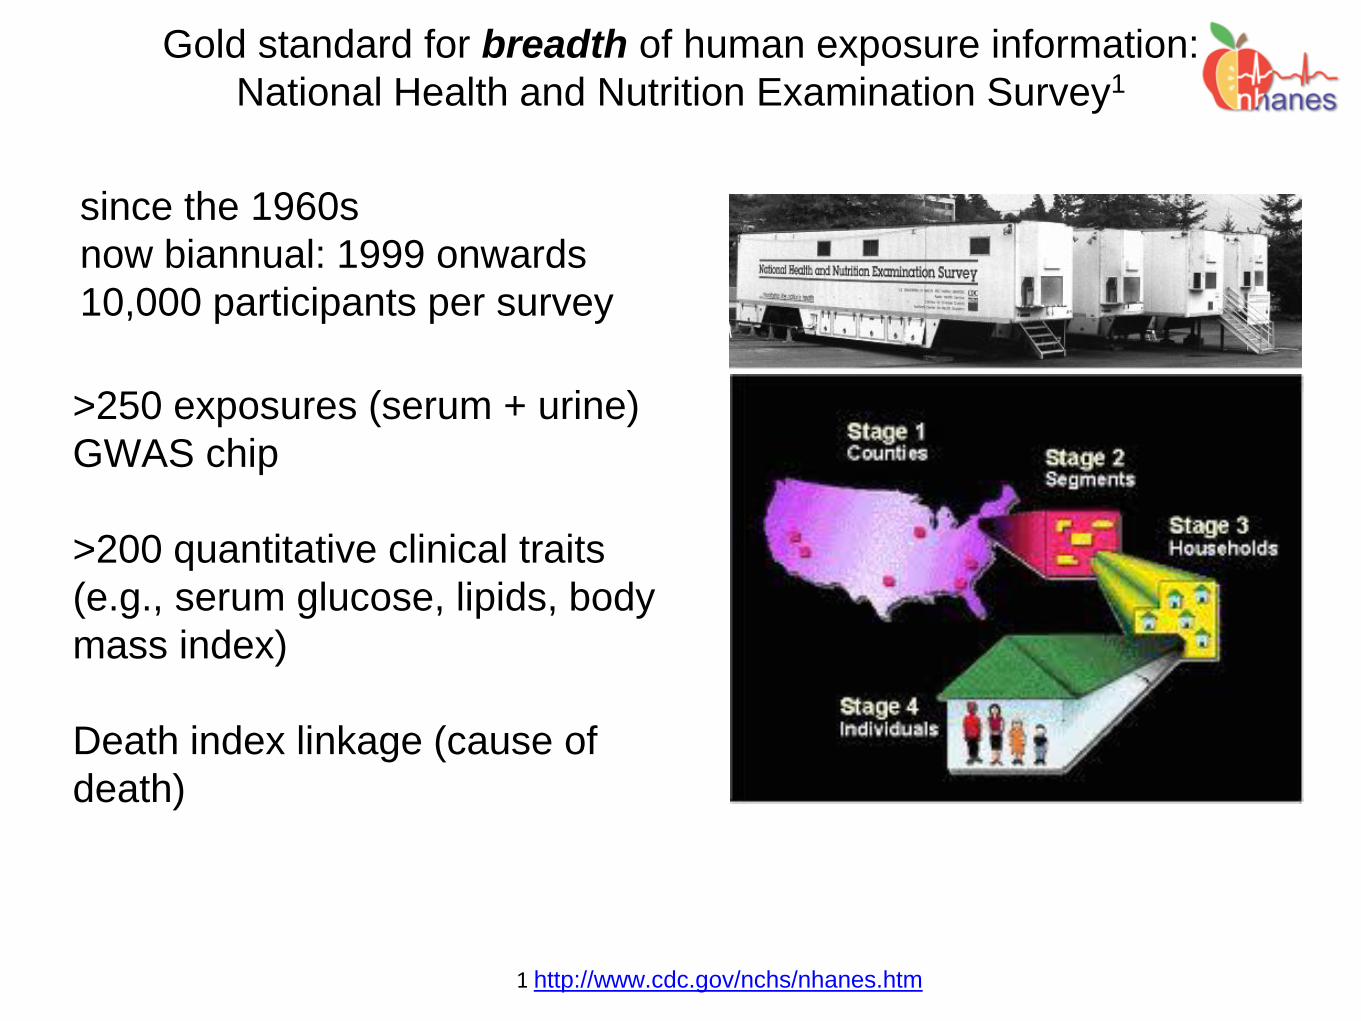
Gold standard for breadth of human exposure information:
National Health and Nutrition Examination Survey1
since the 1960s
now biannual: 1999 onwards
10,000 participants per survey
1 http://www.cdc.gov/nchs/nhanes.htm
>250 exposures (serum + urine)
GWAS chip
>200 quantitative clinical traits
(e.g., serum glucose, lipids, body
mass index)
Death index linkage (cause of
death)
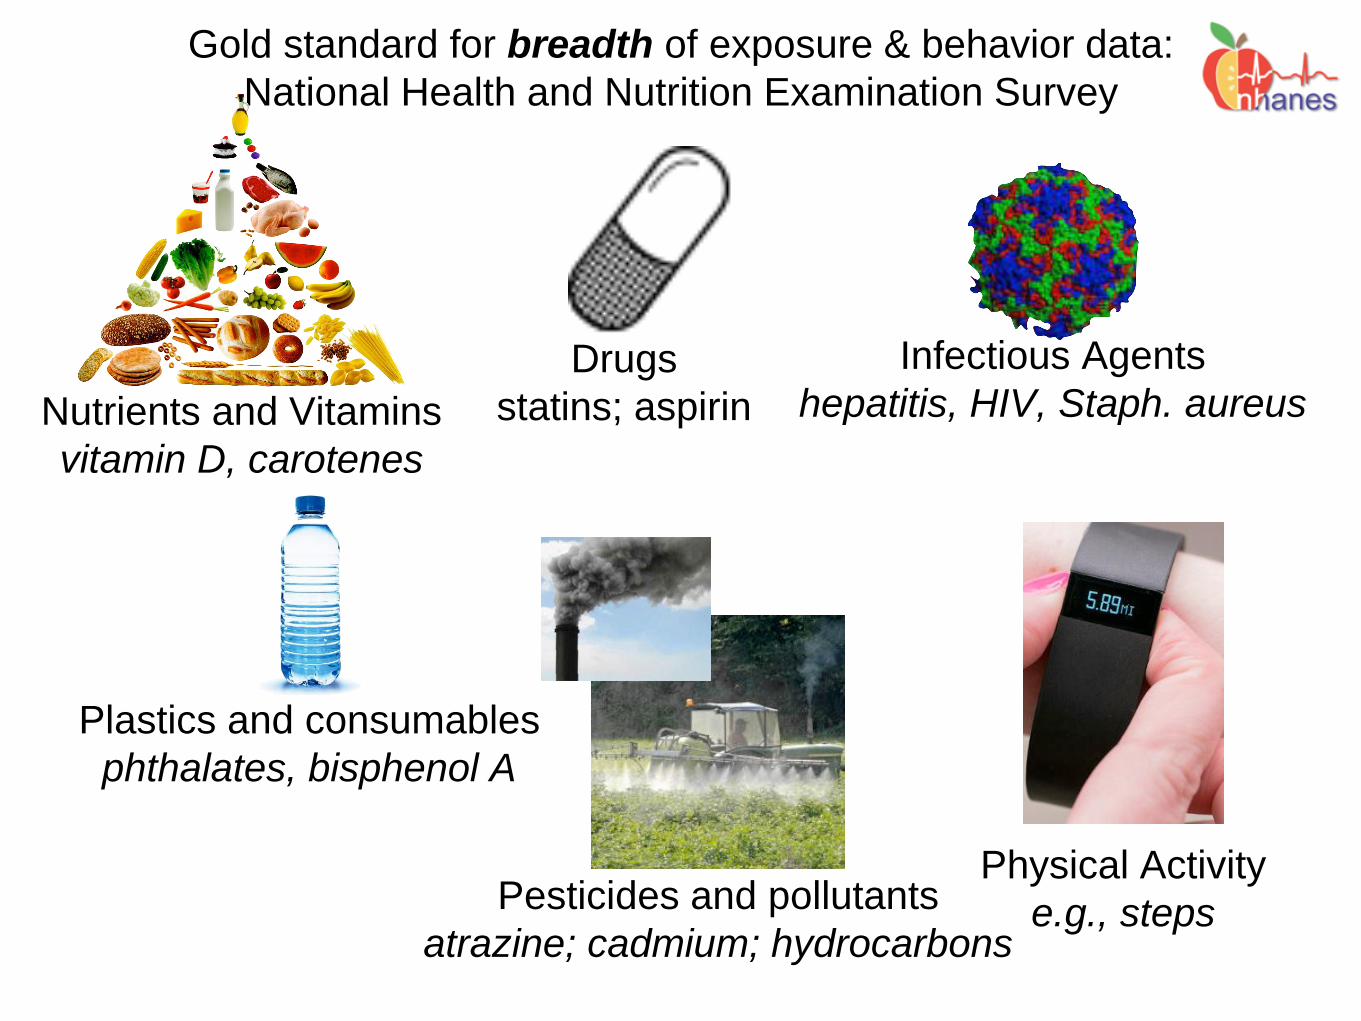
Gold standard for breadth of exposure & behavior data:
National Health and Nutrition Examination Survey
Nutrients and Vitamins
vitamin D, carotenes
Infectious Agents
hepatitis, HIV, Staph. aureus
Plastics and consumables
phthalates, bisphenol A
Physical Activity
e.g., stepsPesticides and pollutants
atrazine; cadmium; hydrocarbons
Drugs
statins; aspirin

What E are associated with aging:
all-cause mortality, heart disease, and
telomere length?
Int J Epidem 2013
Int J Epidem 2016

Identifying E associated with all-cause mortality:
Data-driven searching through 253 associations
age (10 years)
income (quintile 2)
income (quintile 1)male
black income (quintile 3)
any one smoke in home?
Multivariate cox (age, sex, income, education, race/ethnicity, occupation [in red])
serum and urine cadmium
[1 SD]
past smoker?current smoker?serum lycopene
[1SD]
physical activity[low, moderate, high activity]*
*derived from METs per activity and categorized by Health.gov guidelines
R2 ~ 14%
(2%)

R2 < 10-20%
Required
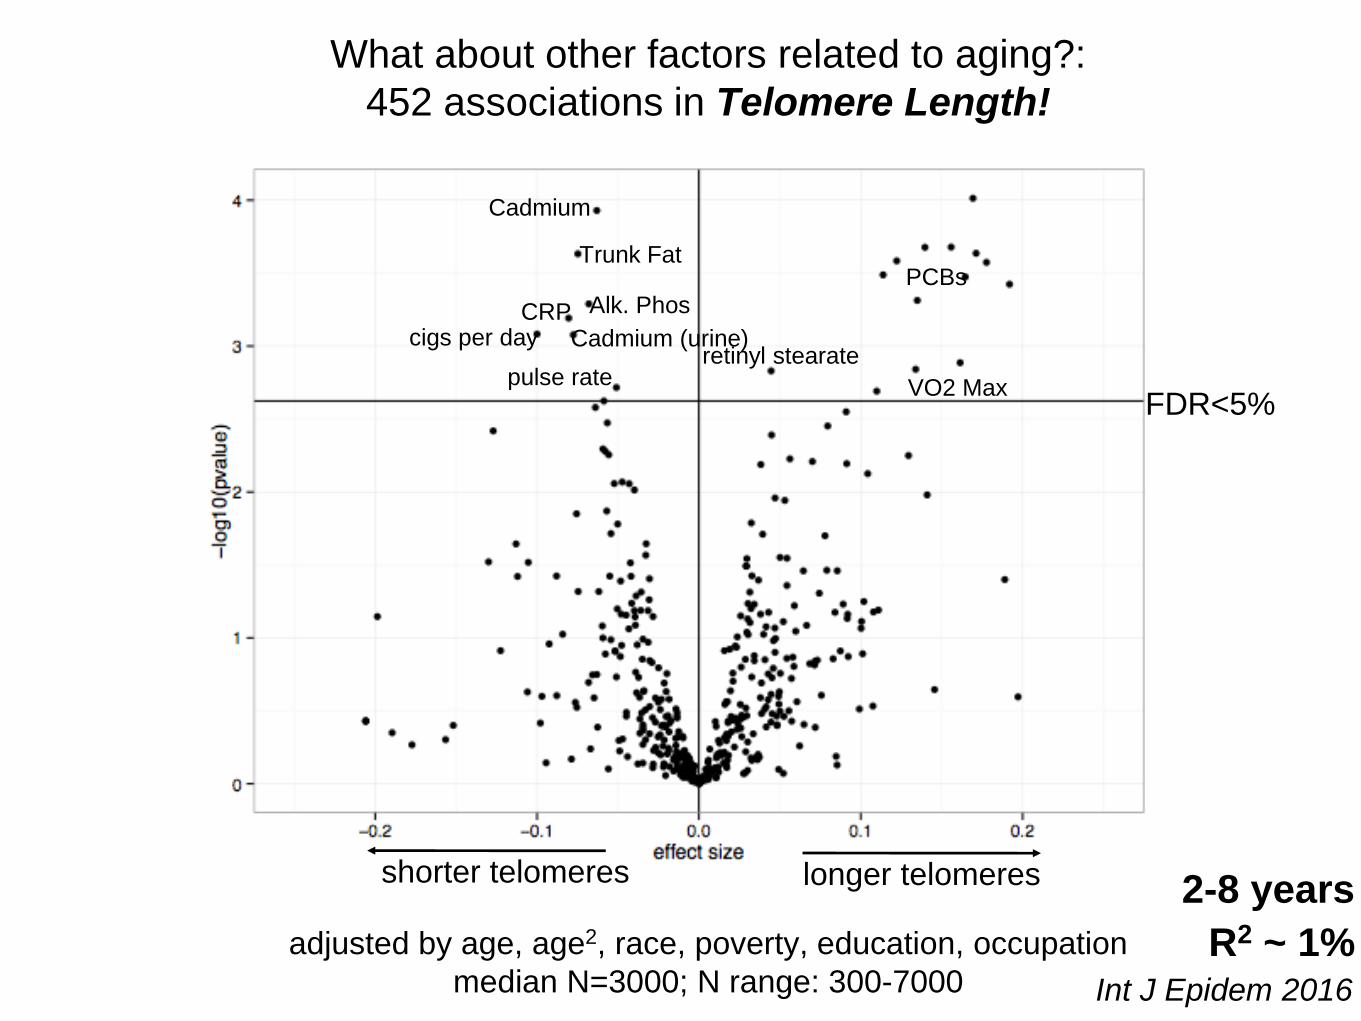
What about other factors related to aging?:
452 associations in Telomere Length!
Int J Epidem 2016
PCBs
FDR<5%
Trunk Fat
Alk. PhosCRP
Cadmium
Cadmium (urine)cigs per dayretinyl stearate
R2 ~ 1%
VO2 Maxpulse rate
shorter telomeres longer telomeres
adjusted by age, age2, race, poverty, education, occupation
median N=3000; N range: 300-7000
2-8 years

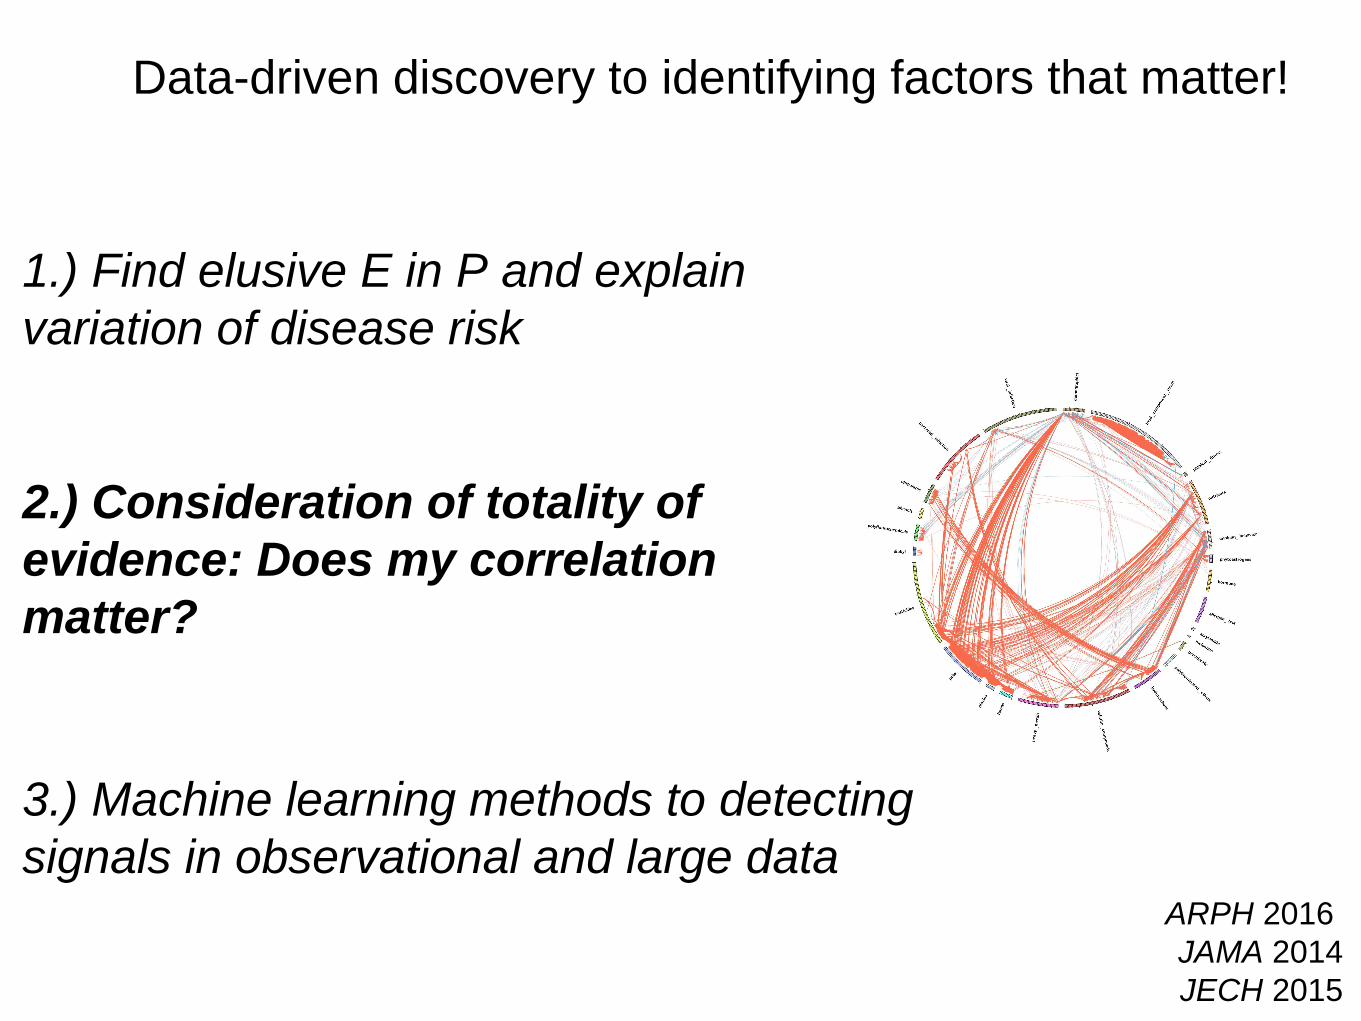
Interdependencies of the exposome:
Correlation globes paint a complex view of exposure
Red: positive ρ
Blue: negative ρ
thickness: |ρ|
for each pair of E:
Spearman ρ
(575 factors: 81,937 correlations)
permuted data to produce
“null ρ”
sought replication in > 1
cohort
Pac Symp Biocomput. 2015
JECH. 2015

Red: positive ρ
Blue: negative ρ
thickness: |ρ|
for each pair of E:
Spearman ρ
(575 factors: 81,937 correlations)
Interdependencies of the exposome:
Correlation globes paint a complex view of exposure: average
correlation of < 0.3
permuted data to produce
“null ρ”
sought replication in > 1
cohort
Pac Symp Biocomput. 2015
JECH. 2015
Effective number of
variables:
500 (10% decrease)
How can we do better in both discovery and translation?:
Leverage data-driven “exposomic” techniques!
• Data-driven discovery
• search through all the possibilities
• gauge the totality of the evidence
• New ways to measure the exposome (E)!
• scalable ways to measure diet, infection,
pollution
Data-driven discovery to identifying factors that matter!
1.) Find elusive E in P and
explain variation of disease risk
2.) Consideration of totality of
evidence: Does my correlation
matter?
3.) Machine learning methods to
detecting signals in observational and
large data
Data-driven discovery to identifying factors that matter!
1.) Find elusive E in P and explain
variation of disease risk
2.) Consideration of totality of
evidence: Does my correlation
matter?
3.) Machine learning methods to detecting
signals in observational and large dataARPH 2016
JAMA 2014
JECH 2015

Data-driven discovery to identifying factors that matter!
1.) Find elusive E in P and explain
variation of disease risk
2.) Consideration of totality of
evidence: Does my correlation
matter?
3.) Machine learning methods to
detecting signals in observational and
large data ARPH 2016
JAMA 2014
JECH 2015
How can we do better in both discovery and translation?:
Leverage data-driven “exposomic” techniques!
• Data-driven discovery
• search through all the possibilities
• gauge the totality of the evidence
• New ways to measure the exposome (E)!
• scalable ways to measure diet, infection,
pollution

Explaining the missing variation:
A data-driven paradigm for robust discovery of E in disease via
systematic study of the “exposome”
what to measure? how to measure?
“A more comprehensive view of
environmental exposure is
needed ... to discover major
causes of diseases...”
how to analyze in relation to health?
Wild, 2005, 2012
Rappaport and Smith, 2010, 2011
Buck-Louis and Sundaram 2012
Miller and Jones, 2014
Patel CJ and Ioannidis JPAI, 2014
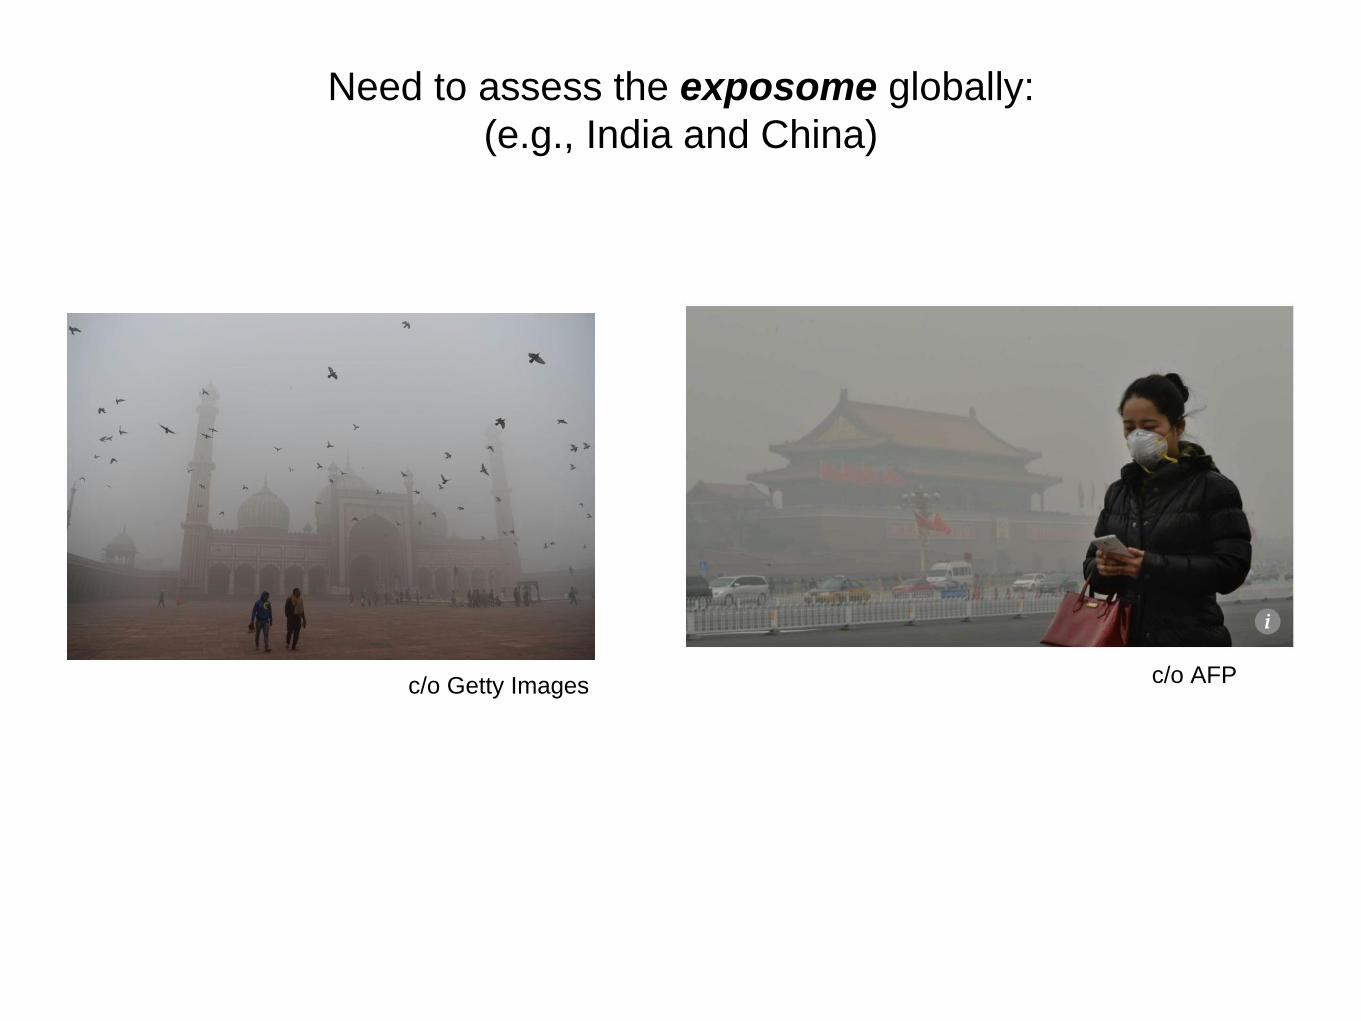
Need to assess the exposome globally:
(e.g., India and China)
c/o Getty Images c/o AFP

… and Sub-Saharan Africa!
Can we predict HIV as a function of the exposome?
AIDS 2018
Harvard DBMI
Susanne Churchill
Nathan Palmer
Sophia Mamousette
Sunny Alvear
Chirag J Patel
@chiragjp
www.chiragjpgroup.org
NIH Common Fund
Big Data to Knowledge
Acknowledgements
RagGroup
Arjun Manrai
Nam Pho
Jake Chung
Kajal Claypool
Chirag Lakhani
Danielle Rasooly
Alan LeGoallec
Sivateja Tangirala
Mentioned Collaborators
Isaac Kohane
John Ioannidis
Dennis Bier
Hugo Aschard