build to zero phase 2 research - final report july 8 2010
TRANSCRIPT

Modelling High‐Impact Local Government Measures to Reduce Energy Use and GHG Emissions
For New and Existing Buildings in BC’s Lower Mainland
July, 2010
FINAL REPORT
Prepared by the Community Energy Association

FINAL REPORT
Acknowledgements
Build to Zero, a project of the Community Energy Association, aims to accelerate local government adoption of policy, planning and regulatory measures to reduce greenhouse gas emissions from new and existing buildings, community‐wide. The current initiative is being piloted in the Lower Mainland of British Columbia. The Community Energy Association is grateful to Natural Resources Canada, CanmetENERGY centre in Ottawa for funding this research report. We also wish to acknowledge Vive Le Monde Mapping for their role in the development of the SCEC3 model.
Lead authors
Lead authors: Patricia Bell and Peter Robinson Strategic development and research support: Norm Connolly and Dale Littlejohn Front page photo credits (left to right): Metro Vancouver; Flickr Vancouver Convention Centre, October 1, 2009; Dockside Green; Hanvey Goodland House, Flickr – Jessica Woolliams, May 22, 2006; City of Coquitlam
This report by the Community Energy Association was supported by the CanmetENERGY division of Natural Resources Canada with funding from the Program of Energy Research and Development. Natural Resources Canada makes no warrantees or representations, express or implied, as to the accuracy or completeness of the report and does not assume any liability arising from the use of any information contained in this report. The conclusions, opinions and recommendations contained herein do not necessarily represent the views of the Government of Canada
FINAL REPORT
Contents
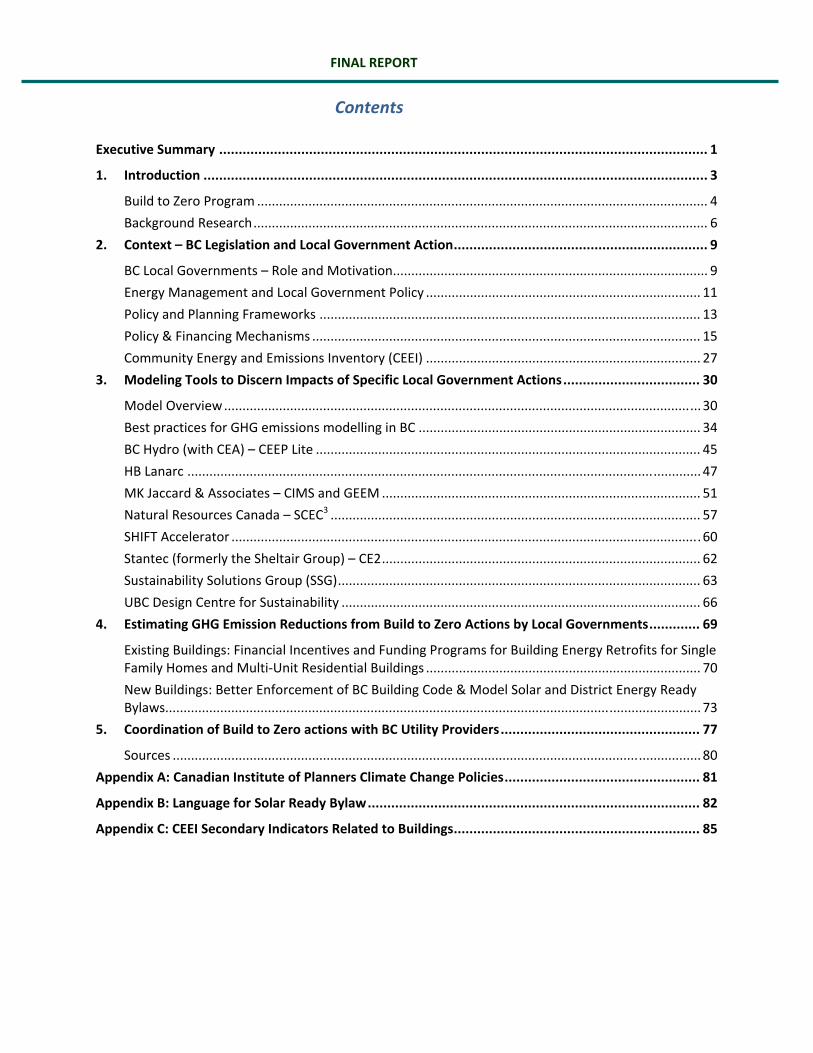
Executive Summary ............................................................................................................................. 1
1. Introduction ................................................................................................................................. 3
Build to Zero Program ........................................................................................................................... 4
Background Research ............................................................................................................................ 6
2. Context – BC Legislation and Local Government Action ................................................................. 9
BC Local Governments – Role and Motivation ...................................................................................... 9
Energy Management and Local Government Policy ........................................................................... 11
Policy and Planning Frameworks ........................................................................................................ 13
Policy & Financing Mechanisms .......................................................................................................... 15
Community Energy and Emissions Inventory (CEEI) ........................................................................... 27
3. Modeling Tools to Discern Impacts of Specific Local Government Actions ................................... 30
Model Overview .................................................................................................................................. 30
Best practices for GHG emissions modelling in BC ............................................................................. 34
BC Hydro (with CEA) – CEEP Lite ......................................................................................................... 45
HB Lanarc ............................................................................................................................................ 47
MK Jaccard & Associates – CIMS and GEEM ....................................................................................... 51
Natural Resources Canada – SCEC3 ..................................................................................................... 57
SHIFT Accelerator ................................................................................................................................ 60
Stantec (formerly the Sheltair Group) – CE2 ....................................................................................... 62
Sustainability Solutions Group (SSG) ................................................................................................... 63
UBC Design Centre for Sustainability .................................................................................................. 66
4. Estimating GHG Emission Reductions from Build to Zero Actions by Local Governments ............. 69
Existing Buildings: Financial Incentives and Funding Programs for Building Energy Retrofits for Single Family Homes and Multi‐Unit Residential Buildings ........................................................................... 70
New Buildings: Better Enforcement of BC Building Code & Model Solar and District Energy Ready Bylaws.................................................................................................................................................. 73
5. Coordination of Build to Zero actions with BC Utility Providers ................................................... 77
Sources ................................................................................................................................................ 80
Appendix A: Canadian Institute of Planners Climate Change Policies .................................................. 81
Appendix B: Language for Solar Ready Bylaw ..................................................................................... 82
Appendix C: CEEI Secondary Indicators Related to Buildings ............................................................... 85

FINAL REPORT
1
Executive Summary
This study supports ongoing research by Natural Resources Canada's CanmetENERGY group as well
as the Community Energy Association’s (CEA) Build to Zero program. CanmetENERGY is Canada's
research centre for scientific expertise on clean energy technologies.
This study is an essential element in the 15‐month Build to Zero initiative that is designed to help local
governments in BC’s Lower Mainland prepare selected policies and strategies to a near‐state‐of‐
readiness for implementation. Build to Zero supports local governments in British Columbia’s Lower
Mainland, through a regional and sub‐regional approach, to mitigate climate change by implementing
high‐impact bylaws and policies that encourage the creation of low‐energy buildings. This initiative
encompasses both new and existing buildings. While this initiative is envisioned as potentially being
replicated in other regions of BC, its initial phase focuses on 34 local governments within the Lower
Mainland.
Build to Zero has the following objectives:
Increase local government capacity to develop and implement municipal bylaws, policies and
practices that promote energy efficiency and renewable energy in new and existing buildings.
Set the framework for a collaborative approach to encourage low‐emission buildings throughout the
Lower Mainland of British Columbia (31 municipalities and three regional districts).
Support local governments in overcoming existing barriers to action on high‐performance buildings.
This study deals primarily with the potential impact of key policy measures available to BC local
governments. However, technical approaches, such as emissions inventories and modelling, are
required to provide important feedback to the local government workings groups as they seek to
understand the potential impact of various Build to Zero actions. As such, Section 4 of this report
provides detail on proposed GHG emission reduction modelling approaches for four high‐potential
measures. These measures are deemed suitable for modelling GHG emission reductions based upon
strong local government interest as well as the potential to make a difference over a short period of
time. For each of these measures, a methodology for estimating the magnitude of GHG emission
reductions has been proposed.

FINAL REPORT
2
Existing Buildings ‐ Financial Incentives and Program Funding
1. Explore use of energy retrofit financing mechanisms such as local improvement charges and service
area bylaws to foster retrofits in single family dwellings and to foster district energy at the
neighbourhood scale.
2. Identify and promote retrofit financing mechanisms for Multi‐Unit Residential Buildings (MURBs).
New Buildings – Improved Regulatory Approaches
3. Improve enforcement of the BC Building Code by ensuring that existing energy related standards
within the building code are achieved.
4. Working with the Province of BC, develop model bylaws requiring solar ready and district energy
ready homes.
A methodology for estimating the magnitude of GHG emission reductions possible from each of these
measures has been proposed, and a thorough review of existing modelling tools in BC is provided.
Models reviewed in this report include:
Name of Modelling Tool (if any) Proponent
No formal name HB Lanarc (HBL)
CIMS and GEEM MK Jaccard and Associates (MKJA)
SCEC3 (Spatial Community, Energy, Carbon and Cost Characterization Model)
Natural Resources Canada
SHIFT Accelerator SHIFT was developed through a collaborative effort 1
CE2 (Community Energy and Emissions model) Stantec (formerly the Sheltair Group)
No formal name Sustainability Solutions Group (SSG)
No formal name University of British Columbia (UBC)
1 This included representatives from a variety of BC organizations and independent professionals with an interest in energy sustainability and climate action.

FINAL REPORT
3
1. Introduction
The purpose of this report is to provide background investigation that supports local government
working groups in BC’s Lower Mainland as they assess, prioritize, collaborate on, and implement
selected building energy efficiency and GHG emission reduction strategies attributable to buildings. This
research is an essential element in the 15‐month Build to Zero initiative that is designed to help local
governments in BC’s Lower Mainland prepare selected policies and strategies to a near‐state‐of‐
readiness for local government implementation.
This report incorporates findings from the Local Government Survey and White Paper (drafts
completed during the first phase of research for Build to Zero), workshop discussion provided by
participants at the December 9, 2009 Build to Zero Workshop in Vancouver, as well as additional input
provided by local governments in early 2010. Priority measures have already been identified, and
beginning in April 2010, they will be reviewed by the local government working groups.
This study deals primarily with the potential offered by policy tools used by local governments.
However, technical approaches, such as emissions inventories and modelling may be required to
provide important feedback to the local government workings groups as they seek to understand the
potential impact of various Build to Zero actions.
The following high priority measures were selected based upon strong local government interest as well
as their potential to make a difference over a short period of time. For each of these measures, a
methodology for estimating the magnitude of GHG emission reductions has been proposed.
Existing Buildings ‐ Financial Incentives and Program Funding
1. Explore the use of energy retrofit financing mechanisms such as local improvement charges and
service area bylaws to foster retrofits in single family dwellings and to foster district energy at the
neighbourhood scale
2. Identify and promote retrofit financing mechanisms for Multi‐Unit Residential Buildings (MURBs)
New Buildings – Improved Regulatory Approaches
3. Improve enforcement of BC Building Code by ensuring that existing energy‐related standards within
the Code are achieved

FINAL REPORT
4
4. Working with the Province of BC, develop ‘model’ (sample) bylaws requiring solar‐ready and district
energy‐ready homes
Build to Zero Program Build to Zero supports local governments in British Columbia’s Lower Mainland, through a regional and
sub‐regional approach, to mitigate climate change by implementing high‐impact bylaws and policies that
encourage the creation of low‐energy buildings. This initiative encompasses both new and existing
buildings. While Build to Zero is envisioned as potentially being replicated in other regions of BC, its
initial phase focuses on 34 local governments, including municipalities and Regional Districts, within the
Lower Mainland (shown in the table below). The University of British Columbia, which forms part of
Metro Vancouver’s Electoral Area “A”, is included in this list. Metro Vancouver is the civic planning
authority for those parts of Electoral Area ‘A’ not administered by the provincial government. UBC’s
Official Community Plan, developed by Metro Vancouver in partnership with UBC, sets objectives for
land use and transportation, particularly in relation to non‐institutional development. University
development, in accordance with the provisions of the Universities Act, is the purview of UBC.
Metro Vancouver RD City of Surrey
Village of Anmore City of Vancouver
Village of Belcarra District of West Vancouver
Bowen Island Municipality City of White Rock
City of Burnaby University of British Columbia
City of Coquitlam
Corporation of Delta Fraser Valley RD
City of Langley City of Abbotsford
Township of Langley City of Chilliwack
Village of Lions Bay Village of Harrison Hot Springs
District of Maple Ridge District of Hope
City of New Westminster District of Kent
City of North Vancouver District of Mission
District of North Vancouver
District of Pitt Meadows Squamish‐Lillooet RD
City of Port Coquitlam Village of Pemberton
City of Port Moody District of Squamish
City of Richmond Resort Municipality of Whistler

FINAL REPORT
5
For purposes of this report, the term “local government” includes both municipalities and regional
districts in BC. “Municipalities” can be cities, towns, villages or municipal districts whereas regional
districts, particularly in urbanized areas, typically include more than one municipality. Often regional
districts provide services that are more efficiently shared between adjacent municipalities, such as
water treatment and delivery services as well as management of liquid and solid waste.
Build to Zero has the following objectives:
Build local government capacity to develop and implement bylaws, policies and practices that
promote energy efficiency and renewable energy in new and existing buildings.
Set the framework for a collaborative approach to encourage low‐emission buildings throughout the
Lower Mainland of British Columbia (in terms of geographic scope, the Lower Mainland includes 31
municipalities and three regional districts).
Support local governments in overcoming existing barriers to action on high‐performance buildings.
While some local governments in this region have made significant progress in encouraging high‐
performance buildings through green building bylaws and policies at the local level, widespread
adoption has not been achieved. As such, there is a need to share innovative approaches and
collaborate regionally to provide a supportive environment for accelerated deployment of energy‐
efficient, low‐emission buildings. Some local governments find it difficult to move alone, fearful that
development will move to the next municipality. Others do not have adequate staff resources to
undertake a project of this scale by themselves. By approaching this challenge by cooperation at a
regional or sub‐regional level, this barrier can be reduced or eliminated.
Developers and homebuilders have indicated frustration at time lost due to varying development and
permitting rules between municipalities. Both the development and regulatory community will benefit
from a regionally consistent and supportive approach to emissions reductions in new construction and
building retrofits. Policies do not have to be consistent region‐wide, but it would be advantageous to
have harmonious approaches within sub‐regions of similar municipalities (i.e. to make the development
‘playing‐field’ more consistent within various parts of the Lower Mainland).

FINAL REPORT
6
Municipal governments have indicated that barriers to action include insufficient time to research best
practices and policy mechanisms that would encourage or require enhanced energy efficiency and
renewable energy in buildings. Build to Zero intends to provide local councils and staff with information
necessary to make informed decisions to begin the acceleration toward energy efficient, low‐emission
buildings.
Background Research
According to BC’s Community Energy & Greenhouse Gas Emissions Inventory (CEEI), the proportion of
GHG emissions from buildings in the Lower Mainland varies quite widely, depending primarily upon the
proportion of urban and rural land within the municipality. Buildings tend to account for a higher
proportion of emissions in urbanized areas. Within the Lower Mainland, buildings typically account for
between 30 and 50 percent of GHG emissions, and thus present a significant emissions reduction
opportunity.
Cascadia Region Green Building Council presented preliminary results of a ‘White Paper’ focusing on key
enabling strategies to reduce GHG emissions from new and existing buildings within the Lower
Mainland. The draft White Paper provided:
• An overview and summary evaluation of relevant municipal policy, regulatory and financial tools
to reduce carbon emissions from buildings in place elsewhere in Canada and the United States.
• Based upon existing research, an identification of high‐potential measures.
• Conceptual policy/regulatory/incentive approaches to reduce GHG emissions from buildings in
the Lower Mainland.
The final White Paper report is expected to be complete at the end of June 2010. It will be posted on
CEA’s website at: http://www.communityenergy.bc.ca/community‐energy‐association‐connecting‐
community‐sustainability‐and‐energy/build‐to‐zero
To support the development of the White Paper and the Build to Zero workshop and program, CEA
surveyed each of the 34 local governments within the Squamish‐Lillooet, Fraser Valley, and Metro
Vancouver regional districts. The purpose of this survey was to identify the various approaches being
taken by local governments to reduce greenhouse gas emissions from new and existing private buildings

FINAL REPORT
7
within their communities. Note: This survey did not include initiatives related to the local government‐
owned building stock. A presentation summarizing key results from this survey was delivered at the
December 9th workshop, along with a draft copy of the survey. A final version of the local government
survey report is expected to be complete in May, 2010. It will be posted on CEA’s website at:
http://www.communityenergy.bc.ca/community‐energy‐association‐connecting‐community‐
sustainability‐and‐energy/build‐to‐zero
With the exception of the City of Vancouver, which has its own charter, all local governments operate
primarily within the limitations of two statutes: the Local Government Act and the Community Charter.
In 2008, these two statutes were amended by the Local Government (Green Communities) Statutes
Amendment Act (also known as Bill 27). Bill 27 requires local governments to include greenhouse gas
emission reduction targets in their Official Community Plans (OCPs) by May 31, 2010, and within
Regional Growth Strategies (RGSs) by May 31, 2011, along with policies and actions proposed for
achieving those targets. This legislation enables local governments to encourage development that will
reduce greenhouse gas emissions.
The powers of local government with respect to buildings (with the exception of the City of Vancouver)
are restricted by Section 9 of the Community Charter, which defines a number of spheres of ‘concurrent
authority,’ including ‘buildings and other structures.’ In areas of concurrent authority, local governments
cannot make requirements that differ from provincial regulations covering the same topic, without
specific provincial approval to do so. This means that local governments (with the exception of the City
of Vancouver) cannot require either new or existing buildings to differ from the BC Building Code and
cannot regulate in areas where the BC Building Code could potentially regulate.
Preliminary survey results indicate that some policies are being used much more than others. Most local
government in the Lower Mainland have a policy framework in place to support energy efficiency in
buildings. Many have also created policies that are supportive of district energy and renewable energy.
Other measures, like the use of Development Permit Area (DPA) guidelines, expedited approvals,
density bonusing, tax exemptions, and innovative financing are being used less frequently. According to
the survey, three other measures – development cost charges (DCC) reductions, local improvement
charges, and building labelling – are not being used at all in the Lower Mainland for purposes of

FINAL REPORT
8
improving building energy efficiency or lowering emissions. Most local governments are using less than
five of the possible tools and half are using less than two.
A number of the underused policy measures have financial implications (DCC reductions, tax exemption
bylaws, fee rebates) which suggest that there is an opportunity for additional research that identifies
financial implications of these tools for local governments.
Preliminary conclusions:
• Many of the available tools are underused. Further research is needed to understand why and
what could be done about it.
• If the available tools are not truly highly effective at emissions reductions measures, would they
work better if all local governments (or at least a significant group of local governments) were to
use them in the same way?

FINAL REPORT
9
2. Context – BC Legislation and Local Government Action BC Local Governments – Role and Motivation Local governments have a critical role in reducing community‐wide greenhouse gas (GHG) emissions.
Residential, commercial and institutional buildings account for about 10% of Canada’s GHG emissions.2
Local governments design their communities, and through various policy mechanisms, shape emissions
profiles of buildings throughout their communities and in their own facilities. In 2008, the Community
Energy Association surveyed BC local governments to identify, among other things, their motivations for
taking action on energy innovation and greenhouse gas reductions.
As the adjacent graph, from the BC
Local Government Energy Survey
(2008) illustrates, top drivers for
action on building energy
efficiency are:
• Rising energy costs over
the long term;
• the BC Climate Action
Charter; and,
• a desire to play a
leadership role.
Top drivers for GHG action on GHG
emission reductions are:
• the BC Climate Action
Charter;
• a desire to play a leadership role; and,
• new provincial legislative requirements.
2 According to Canada’s 2008 Greenhouse Gas Inventory: Summary of Trends http://www.ec.gc.ca/ges‐ghg/default.asp?lang=En&n=F1CA74A6‐1
0%
10%
20%
30%
40%
50%
60%
70%
80%
90%BC
Clim
ate
Actio
n Charter
Provincial GHG
require
ments
(Bill 27)
Energy co
sts
To play a
leadership role
Because it is the
"right thing" to
do
Energy
GHG reduction

FINAL REPORT
10
Results of the survey can be found at: http://www.communityenergy.bc.ca/resources‐
introduction/2008‐energy‐survey‐report
In 2007, the Province of British Columbia set targets for provincial GHG emissions cuts of 33% by 2020
and 80% by 2050, relative to 2007 levels, and set interim targets for 2012 and 2015. The 2008 BC
Climate Action Plan set out a strategy to achieve provincial targets, and an array of policy mechanisms
for BC local governments to encourage energy efficiency, GHG reductions, and alternative energy ‐
within their corporate operations and in the broader community.
The Province committed to becoming carbon neutral in its own operations by 2010 and encouraged
local governments to share a similar commitment by signing and implementing the voluntary Climate
Action Charter. Signatory local governments agree to develop strategies and take action to achieve the
following goals:
• Becoming carbon neutral in respect of their operations by 2012 (solid waste facilities regulated
under the Environmental Management Act are not included in ‘operations’ for the purposes of
the Charter);
• Measuring and reporting on their community’s greenhouse gas emissions profile; and
• Creating complete, compact, more energy‐efficient rural and urban communities. For example,
fostering a built environment that supports a reduction in car dependency and energy use,
establishing policies and processes that support fast tracking of green development projects, or
adopting zoning practices that encourage land use patterns that increase density and reduce
sprawl.
As of January 20, 2010, 177 local governments in BC (plus the Islands Trust) have signed the Charter.
Implementation of the Charter is being supported by a “Green Communities Committee” established by
the Province and Union of British Columbia Municipalities (UBCM).
In British Columbia, buildings are regulated under the BC Building Code, which is administered by the
Ministry of Housing and Social Development. In 2008, the Province “greened” the building code by
incorporating energy and water conservation requirements. These new code provisions require small
residential buildings to meet a standard of EnerGuide 77 or equivalent, while large commercial,
institutional and high‐rise residential buildings must meet the ASHRAE 90.1 (2004) standard.

FINAL REPORT
11
The BC Energy Efficient Buildings Strategy: More Action, Less Energy, released in May 2008, encourages
energy efficiency improvements to communities, homes and businesses and establishes the following
energy efficiency targets:
• Reduce average energy demand per home by 20 percent by 2020;
• Complete energy conservation plans for all BC communities;
• Reduce the energy demand of commercial and institutional buildings by 9 percent per square
metre by 2020;
• Make public sector buildings carbon neutral by 2010.
This strategy included funding to support the LiveSmart BC building energy efficiency incentive program,
which provides grants to homes and businesses. Funding for this program was reinstated in the most
recent Provincial budget announcement on March 2, 2010. More information on this strategy can be
found at: www.energyplan.gov.bc.ca/efficiency/
Energy Management and Local Government Policy
In British Columbia, local governments are considered creatures of the Province, meaning all planning
and administrative actions are enabled by provincial legislation. With the exception of the City of
Vancouver3, all local governments operate primarily within the limitations of two statutes: the Local
Government Act and the Community Charter. The Local Government Act provides local governments
with the powers they require to fulfill their purposes and respond to the different needs and changing
circumstances of their communities. The Community Charter, a companion statute to the Local
Government Act, establishes a core of enabling provisions to local governments. In 2008, the Province
passed legislation that amended these two statutes through the Local Government (Green
Communities) Statutes Amendment Act or Bill 27. This legislation requires local governments to include
greenhouse gas (GHG) emission reduction targets in their Official Community Plans by May 31, 2010 and
Regional Growth Strategies (RGSs) by May 31, 2011, along with policies and actions proposed for
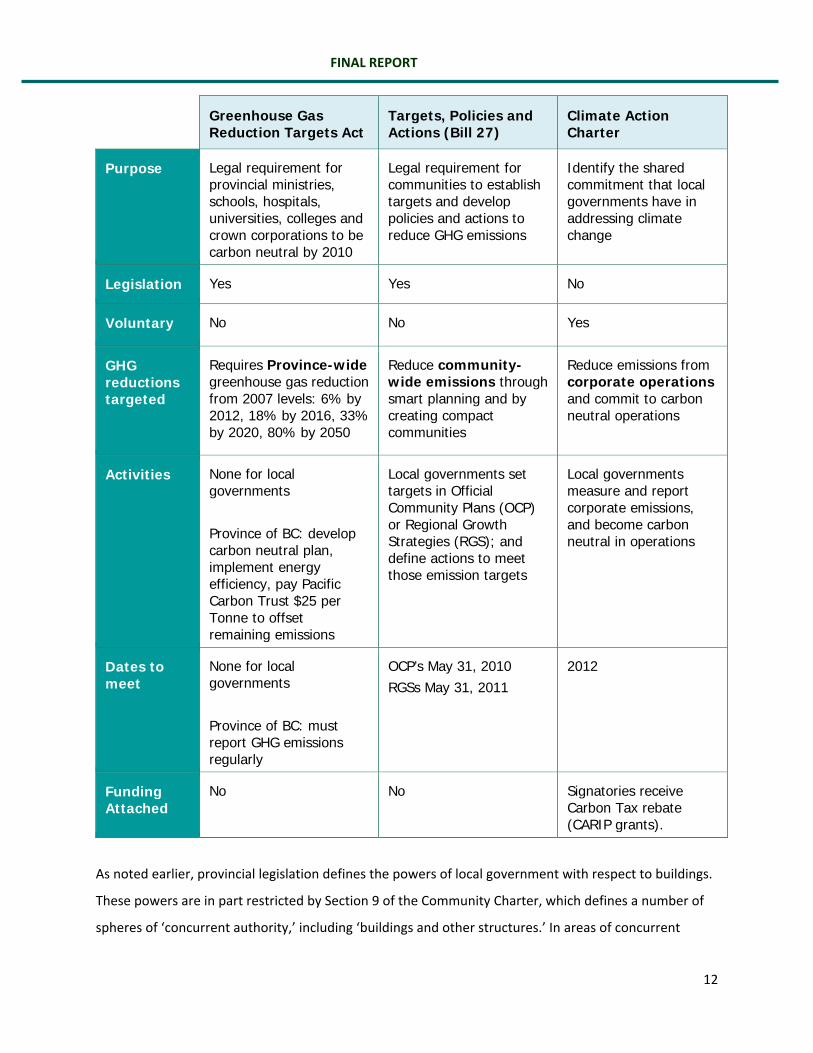
achieving those targets. The table below compares various aspects of Provincial policy with regard to
climate action (Bill 10, Bill 27 and voluntary Local Government Climate Action Charter).
3 The City of Vancouver operates under its own unique enabling legislation known as the Vancouver Charter.
FINAL REPORT
12
Greenhouse Gas Reduction Targets Act
Targets, Policies and Actions (Bill 27)
Climate Action Charter
Purpose Legal requirement for provincial ministries, schools, hospitals, universities, colleges and crown corporations to be carbon neutral by 2010
Legal requirement for communities to establish targets and develop policies and actions to reduce GHG emissions
Identify the shared commitment that local governments have in addressing climate change
Legislation Yes Yes No
Voluntary No No Yes
GHG reductions targeted
Requires Province-wide greenhouse gas reduction from 2007 levels: 6% by 2012, 18% by 2016, 33% by 2020, 80% by 2050
Reduce community-wide emissions through smart planning and by creating compact communities
Reduce emissions from corporate operations and commit to carbon neutral operations
Activities None for local governments Province of BC: develop carbon neutral plan, implement energy efficiency, pay Pacific Carbon Trust $25 per Tonne to offset remaining emissions
Local governments set targets in Official Community Plans (OCP) or Regional Growth Strategies (RGS); and define actions to meet those emission targets
Local governments measure and report corporate emissions, and become carbon neutral in operations
Dates to meet
None for local governments Province of BC: must report GHG emissions regularly
OCP’s May 31, 2010 RGSs May 31, 2011
2012
Funding Attached
No No Signatories receive Carbon Tax rebate (CARIP grants).
As noted earlier, provincial legislation defines the powers of local government with respect to buildings.
These powers are in part restricted by Section 9 of the Community Charter, which defines a number of
spheres of ‘concurrent authority,’ including ‘buildings and other structures.’ In areas of concurrent

FINAL REPORT
13
authority, local governments cannot make requirements that differ from provincial regulations covering
the same topic, without specific provincial approval to do so. That means local governments cannot
directly require buildings to differ from the BC Building Code.
The next section describes planning frameworks and policy mechanisms through which it is possible to
encourage energy efficiency, greenhouse gas emission reductions and the use of alternative energy in
buildings and developments.
Policy and Planning Frameworks This section describes both planning policy and organizing frameworks that are helpful to local
governments seeking to reduce energy end‐use and associated GHG emissions.
Canadian Institute of Planners (CIP) policy on Climate Change
As the professional body representing planners across Canada, CIP has recognized that the role of
planners is vital in helping Canada meet the challenges of climate change. In launching this policy, CIP is
breaking new ground. In the past, CIP has focused its policy activity on reacting to government initiatives
rather than creating new policy. However, given that climate change affects every dimension of the
planning profession and adds considerable uncertainty to the planning process, CIP maintains that all
sectors of society must work together and that planners can play a significant role. CIP’s climate change
policy draws from the fifth core principle established in the institute’s Strategic Plan. This principle
commits CIP to “reduce the rate of climate change, mitigate its effects, and plan for adaptation.”
To achieve the expressed goal of acknowledging their “...share of responsibility to future generations for
custodianship of this planet and its habitats,” the Canadian Institute of Planners’ Policy on Climate
Change aims to empower its members to tackle the effects of climate change. To achieve this goal, CIP
has set the following objectives:
• To increase planners’ capacity to mitigate and adapt to climate change locally, nationally, and
internationally,
• To increase planners’ knowledge about climate change, mitigation techniques, and adaptation
strategies,

FINAL REPORT
14
• To raise awareness of the links between planning and climate change among its members, the
general public, other professionals, and our international colleagues, and
• To build networks of professionals to support collaborative solutions for meeting the challenges
of climate change.
Detailed policy directives to achieve these objectives are located in Appendix B.
Quality Urban Energy Systems of Tomorrow (QUEST)
QUEST is a national collaborative network of representatives from industry, environmental groups,
governments, academia and consulting communities working together to make Canada a world leader in
urban integrated energy systems. This network has developed the following principles to guide future
development:
• Encouraging mixed‐use higher density urban development
• Reducing the energy input required for a given level of service
• Matching the type of energy with its use
• Managing surplus heat across applications and sectors
• Converting waste to energy
• Integrating on‐site renewable sources of energy
• Optimizing use of grid energy and as a resource to optimize the overall system and ensure
reliability.
These principles provide a national framework
for evaluation of policies and development
projects.
The Four R’s of Sustainable Community Energy
Planning
Another useful planning framework to guide
local government planning and priorities, is the
pyramid of planning priorities developed by BC
Hydro. This pyramid suggests that the first step
for action is to reduce energy demand through
community design, green / high‐performance
buildings and improved energy efficiency in Suggested steps in energy planning. Concept source: Robyn Wark and Jorge Marques, BC Hydro

FINAL REPORT
15
buildings. Next, waste heat can be recovered, and renewable heat sources developed. And, as a final
priority, renewable electricity sources can be developed. This framework, together with the QUEST
principles above, suggests steps for consideration, and criteria for evaluation, of potential policy
measures for action which follow.
Policy & Financing Mechanisms A fairly broad suite of measures are available to help BC local governments encourage or require energy
efficiency in new buildings. Fewer policy measures (instruments) are available to support retrofit of
existing buildings. Several of the measures described below are also helpful for requiring or supporting
district energy or renewable energy systems. The use of these measures by local governments can be
supported and encouraged by modelling techniques that will allow the potential impact of the measure
to be evaluated.
1. The following six policy measures are especially applicable to the initiatives proposed in Section 4 of
this report: Estimating GHG emission reductions from Build to Zero actions by local governments:
a. Supportive policies within the Official Community Plan (OCP)
Bill 27, passed by the Province in 2008, requires local governments to include greenhouse gas
(GHG) emission reduction targets in their Official Community Plans by May 31, 2010 and
Regional Growth Strategies (RGSs) by May 31, 2011, along with policies and actions proposed
for achieving those targets. Supportive objectives and policies within OCPs provide important
foundational elements to encourage the development of energy and heating systems or utilities
in the community. They also raise awareness about the role for local government staff and
developers in promoting these policies. Inclusion of such supportive policies in an OCP puts
them on the agenda, and provides staff with an explicit mandate to explore energy
opportunities in the community.
Since an Official Community Plan provides policy guidance for a community over a five to ten
year period, it is appropriate to include comprehensive language on energy management, thus
providing a context for both immediate and future decisions. In addition, policies and actions
taken on the City’s own operations can demonstrate leadership, further justifying community‐
wide initiatives.

FINAL REPORT
16
Supportive policies within an OCP are a necessary basis for all further community action on
reducing energy use and GHG emissions. Policies can be prepared to support energy efficiency
and district or renewable energy for both new and existing buildings.
Excerpts from two Lower Mainland Local Government OCPs:
i. District of West Vancouver Official Community Plan (2004)
Policy BF‐A 1 Promote superior environmental design in new development. • Encourage high performance building design for major new construction to minimize
the use of energy, water and materials in construction and operation of buildings. • Promote the use of passive energy, environmentally friendly materials, storm water
management and construction practices that minimize impacts on the natural environment.
• Consider incentives for superior environmental designs such as density bonuses to offset increased construction costs.
ii. Whistler Built Environment and Energy Strategies
In 2020, Whistler’s built environment is vibrant, reflects the community’s character, contributes to individual health and wellbeing, and is moving toward its identified sustainability objectives. By this time: • Building design, construction and operation is characterized by efficiency, durability
and flexibility for changing and long‐term uses • The new and renovated built environment has transitioned towards sustainable
management of energy and materials • Building ownership is structured to continually encourage transition toward a flexible
and improved built environment over time....
In 2020, Whistler’s energy system is reliable, flexible and moving toward our sustainability objectives. By this time: • Whistler’s energy system is supplied by a mix of sources that are local and regional
wherever possible • The energy system is continuously moving towards a state whereby a build up of
emissions and waste into air, land and water is eliminated • Whistler’s energy system is transitioning to renewable energy sources • Residents, businesses and visitors understand energy issues....
b. Bylaws requiring new buildings to be ready for future energy upgrades
In recent years, federal and provincial governments, including interested local governments,
have explored the possibility of creating bylaws that require buildings to be constructed so that
they may readily be adapted to future renewable energy systems. Alternatives are:
• Solar Ready Bylaws – requiring buildings to include infrastructure to support solar hot water
heating equipment

FINAL REPORT
17
• District Energy Ready Bylaws – requiring buildings to include infrastructure to support
connections to future district energy systems
• Net Zero Ready Bylaws – requiring buildings to achieve high levels of thermal efficiency and
include infrastructure to support either stand alone or district renewable energy systems
such that the building may produce its own energy and achieve a ‘net zero’ effect.
Significant progress has been made towards the development of solar ready bylaws. As noted
previously, with the exception of the City of Vancouver, BC local governments may not create
regulations pertaining to building construction – this power remains with the Province through
the BC Building Code. However, the Province of BC Energy Mines and Resources, Building
Standards Branch, is developing an alternative stream for local governments who wish to
require solar water heating. (A local government may choose to require traditional water
heating requirements in their implementation of the building code or may opt to require solar
water heating as well.) The Province expects to have completed this work by early in 2011.
Examples of language for a solar water heating bylaw are contained in Appendix C.
The City of Vancouver, under powers provided by their unique Charter, is exploring the
development of a district energy ready bylaw. This work is in its early stages.
c. Local Service Area bylaws
The Community Charter authorizes local governments to create a local area service, enabling
them to provide and charge for any service that Council considers necessary or desirable, either
directly or through another public authority, person or organization. Consequently, local
governments are able to provide local energy services, such as heating via a district energy
system or through solar hot water systems for individual buildings, and charge for their use. A
service area bylaw can be used to establish service areas for particular types of energy services
(e.g. a hydronic district energy system) and to require buildings within the service area to
connect to the energy source. A service area could encompass part or all of each of the City’s
areas.
This approach was used by the Lonsdale Energy Corporation (LEC) in the City of North
Vancouver. The City established a Hydronic Heat Energy Service Bylaw to create a district
heating service area for Lower Lonsdale, with a requirement that all new or retrofitted buildings

FINAL REPORT
18
greater than 10,000 square feet be connected to and use the system. This bylaw requires
developers in the district to provide infrastructure to connect to the system, avoiding the
construction of baseboard heating in the district. The Lonsdale Corporation requires that
developers post a performance bond to ensure compliance with the bylaw. This bond is
normally around $50,000, but can increase to $100,000 if LEC anticipates that the project will
require a high level of involvement from LEC staff and contractors.
The Lonsdale Energy Corporation focused their educational efforts on developers and engineers
active in the Lonsdale Quarter.4 Most of LEC’s efforts were focused on facilitating project design
and engineering to accommodate the systems necessary to connect to the district heating
system. The required level of developer and engineer education needed varies greatly. For the
City, the process of undertaking an energy plan led to identifying sites within the municipality
that would have a high demand for heating, as well as a mix of building types. The process
contributed to the City acknowledging a need for contractual obligations with builders
purchasing City‐owned land to connect to district energy. As part of the rezoning process for
development on City‐owned lands, connection to the LEC is required and is treated like other
municipal infrastructure requests, such as provisions for sidewalks, roads, sewer connections,
and stormwater management. Before any development proceeds, every builder must sign a
heat service contract. Because of this agreement, every customer pays the same rate for
heating.5
A local service area bylaw can be used to support a district‐energy‐ready initiative after the
construction of a district energy system is complete.
d. Local Improvement Charges
Municipalities have traditionally used local improvement charges (LICs) to help cover the costs
of infrastructure investments that benefit a specific neighbourhood ‐ for example the
construction of residential sidewalks or grants to support business improvement areas.
4 Geographically, the area serviced by LEC encompasses both Lower Lonsdale and Upper Lonsdale neighbourhoods on either side of Lonsdale Avenue. 5 Seattle New Building Energy Efficiency Policy Analysis (EDAW, Inc.) ‐ Vancouver District Heating Program Case Study Latest revision: 11/4/08

FINAL REPORT
19
Landowners who benefit from improvements are assessed a charge that is added to their
property taxes each year until their share of the improvements has been paid for. The possibility
of using LICs to fund energy efficiency and renewable energy improvements within privately
owned buildings is a potential new application of this policy measure that is supported by
widespread interest in reducing greenhouse gas emissions.
In BC, the Community Charter outlines these powers under Part 7 – Municipal Revenue ‐ Division
Five, entitled Local Service Taxes:
Authority for local area services 210 (1) A local area service is a municipal service that is to be paid for in whole or in part by a local service tax under section 216 [local service taxes]. (2) The only services that may be provided as local area services are
(a) services that the council considers provide particular benefit to part of the municipality, and (b) business improvement area services under section 215 [business improvement areas].
(3) Nothing in this Division restricts a municipality from recovering part of the costs of a local area service by means of any other source of municipal revenue.
There are two key differences between the traditional use of local area service taxes and their
potential application to encourage renewable energy or energy efficiency upgrades in privately
owned residences:
This kind of upgrade is entirely contained on the resident’s private property and does
not directly benefit other residents; and,
Once paid for, upgrades are fully owned by the resident – they are not municipal
property.
However, if LIC financing could be used, permanent comprehensive improvements with long
paybacks (e.g. high‐efficiency windows; wall upgrades; heating, ventilation and air‐conditioning
[HVAC] systems; and control systems) would be more attractive to home and building owners
because both their costs and benefits are passed on to new owners if the property is sold before
the investments are paid off.
Several studies completed by the Pembina Institute have found that the mechanism for
establishing and collecting local service area taxes can be adapted to finance improvements in

FINAL REPORT
20
residential and/or commercial building energy efficiency. A study prepared by the Pembina
Institute in 2004 for BC Hydro and Climate Change Central6 reviewed how the concept could be
implemented in BC and proposed a “model” program for municipalities to design and
implement an energy efficiency or renewable energy LIC program. This work was followed by a
comprehensive study, funded by The Office of Energy Efficiency of Natural Resources Canada, to
explore applicability of the concept across Canada.7 More recently, Pembina has worked with
the City of Dawson Creek to further develop the concept.
Most interested parties agree that the Community Charter neither supports nor prohibits the
use of local service taxes for upgrades located on private property. However, some BC local
governments are interested in finding ways to use this tool for this purpose for two reasons:
• Privately owned single family dwellings account for a large portion of the existing
building stock, and opportunities to directly influence energy efficiency and renewable
energy upgrades in this residential sub‐sector are limited; and,
• This tool has the potential to significantly reduce greenhouse gas emissions within
communities, helping to meet community‐wide GHG emission reduction targets and,
consequently, providing a benefit to the entire community.
The Vancouver Charter regulates LICs in a less restrictive manner. There is no specific
requirement for the City of Vancouver to pay maintenance costs for LIC improvements. Based
on the Charter, Vancouver appears to have sufficient powers to expand its use of LICs to include
energy efficiency improvements; however, similar to other jurisdictions interested in an
application of LICs, Vancouver is actively exploring financial considerations associated with loan
risks and guarantees, as well as other key financial matters.
The development of a modelling technique to estimate the potential impact of such a tool will
support further work in this area.
6 Using Local Improvement Charges to Finance Building Energy Efficiency Improvements: A Concept Report, located at http://re.pembina.org/pub/170 7 http://www.pembina.org/pub/197

FINAL REPORT
21
e. Public Endowed Funds
A public endowed fund is a fixed amount set aside by a local government to provide loans for
development that combats global climate change and improves air quality.8 The Toronto
Atmospheric Fund is an example of this approach. Under this program, loans are advanced to
developers interested in building local solar generation capacity or improving energy efficiency
in high‐rise buildings. Another program, called TowerWise, is focussed on improving the energy
efficiency of Toronto’s high‐rise condominium and rental buildings through ‘green condo’ loans
for new buildings and retrofit loans for existing buildings. Developers secure the loan during
construction and unit owners pay the loan back through utility savings. Neither the developer
nor the owner incurs extra costs. The City of Toronto is now working on a loan guarantee
model.
RETScreen and other whole‐building energy models would be appropriate to help calculate the
impact of this measure.
f. Public loan guarantee concept
A public loan guarantee option operates in conjunction with bank lending. It is also called ‘First
Loss’ fund. A pool of capital is created and held by a public body but it is not used to provide
loans. Instead, the fund is used as a guarantee for a private lending institution, and is only
accessed if there is a default on the loan, in which case the lender is reimbursed by the fund.
This approach helps offset the risk of a conventional lender and encourages them to consider
this type of loan, or to offer a better rate. Typically, only part of the loan is guaranteed. In the
past, this approach has been used to support lending associated with social community goals
(such as community economic development.)
Non‐governmental policy measures include innovative approaches to private sector financing
and “on‐bill” financing programs initiated by energy utilities. The Verdant, a building located at
UniverCity (Simon Fraser University) in Burnaby, provides a good example of private sector
financing. Vancity provided an unsecured loan, based on future cash flow revenue from the
8 Heather Tremain, Innovative Financing Strategies for New Buildings, Presentation at Build to Zero December 2009 Workshop http://www.communityenergy.bc.ca/december‐9‐2009‐workshop‐proceedings‐and‐presentations

FINAL REPORT
22
building’s strata corporation, to the developer to cover the cost of premium green elements. In
the case of the Pomeria building in Vancouver, the developer delivered a highly energy efficient
building financed by Terasen Utility Service. Terasen owns the system and leases it back to the
strata council. Fees can be collected via an extra charge on the utility bill.
More information on these approaches can be found in Heather Tremain’s presentation titled
Innovative Financing Strategies for New Buildings on the Build to Zero webpage at:
http://www.communityenergy.bc.ca/december‐9‐2009‐workshop‐proceedings‐and‐
presentations
RETScreen and other whole‐building energy models could be appropriate to help calculate the
impact of this measure, depending on the technology being considered.
2. The following measures can also be used by local governments to encourage energy efficient
buildings and the development of district and/or renewable energy systems, but are less applicable
to the four initiatives proposed for modelling in this report. These tools can be used in conjunction
with the six tools described above or on their own.
a. Zoning for high density and mixed use development
Promoting mixed‐use, higher density development through zoning can establish the necessary
conditions for alternative energy/heating supply utilities. Although developments with higher
residential density and mixed commercial‐residential uses do not on their own guarantee the
financial and operational feasibility of district energy systems, they can provide a sufficient level
of demand for shared heating and cooling.
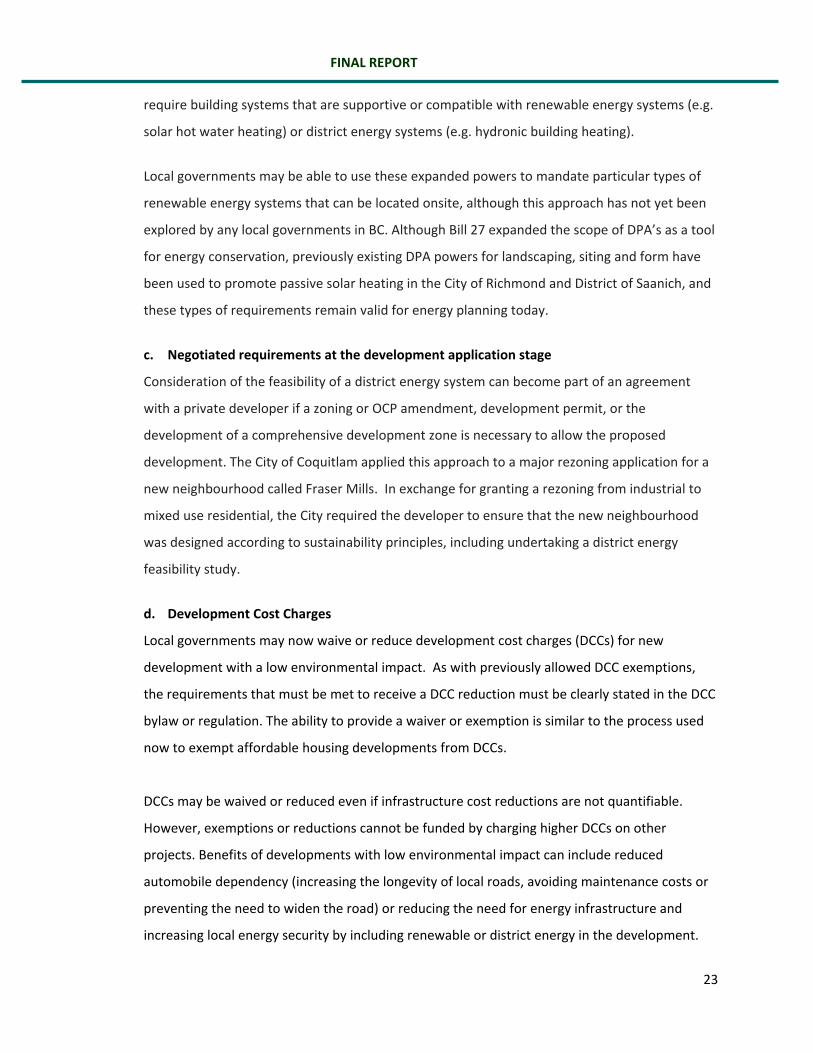
b. Development Permit Area (DPA) guidelines
Bill 27 expanded local government authority to establish DPA requirements with respect to
energy conservation and GHG reductions. Local governments may now establish DPAs for the
purpose of promoting energy conservation and reducing GHG emissions. Within DPA areas, as a
development permit condition specified in development permit guidelines, local governments
can now require specific features within the development, including machinery, equipment and
systems external to buildings and other structures. This makes it easier for local governments to
FINAL REPORT
23
require building systems that are supportive or compatible with renewable energy systems (e.g.
solar hot water heating) or district energy systems (e.g. hydronic building heating).
Local governments may be able to use these expanded powers to mandate particular types of
renewable energy systems that can be located onsite, although this approach has not yet been
explored by any local governments in BC. Although Bill 27 expanded the scope of DPA’s as a tool
for energy conservation, previously existing DPA powers for landscaping, siting and form have
been used to promote passive solar heating in the City of Richmond and District of Saanich, and
these types of requirements remain valid for energy planning today.
c. Negotiated requirements at the development application stage
Consideration of the feasibility of a district energy system can become part of an agreement
with a private developer if a zoning or OCP amendment, development permit, or the
development of a comprehensive development zone is necessary to allow the proposed
development. The City of Coquitlam applied this approach to a major rezoning application for a
new neighbourhood called Fraser Mills. In exchange for granting a rezoning from industrial to
mixed use residential, the City required the developer to ensure that the new neighbourhood
was designed according to sustainability principles, including undertaking a district energy
feasibility study.
d. Development Cost Charges
Local governments may now waive or reduce development cost charges (DCCs) for new
development with a low environmental impact. As with previously allowed DCC exemptions,
the requirements that must be met to receive a DCC reduction must be clearly stated in the DCC
bylaw or regulation. The ability to provide a waiver or exemption is similar to the process used
now to exempt affordable housing developments from DCCs.
DCCs may be waived or reduced even if infrastructure cost reductions are not quantifiable.
However, exemptions or reductions cannot be funded by charging higher DCCs on other
projects. Benefits of developments with low environmental impact can include reduced
automobile dependency (increasing the longevity of local roads, avoiding maintenance costs or
preventing the need to widen the road) or reducing the need for energy infrastructure and
increasing local energy security by including renewable or district energy in the development.

FINAL REPORT
24
e. Tax Exemption Bylaw
The powers of tax exemption were strengthened in 2007, allowing local governments to use tax
exemptions to encourage particular forms of revitalization, including environmental
revitalization, primarily because long‐term lower energy costs can help achieve local
government revitalization objectives. In particular, the restriction of tax exemptions to areas
designated as ‘revitalization areas’ has been removed. Tax exemptions can represent a
significant financial benefit, and are an attractive incentive to the developer of a district energy
system, particularly to help offset capital costs during the early stages of the project.
The Ministry of Community Development has prepared a guide on the use of revitalization tax
exemptions. Local governments could also use the tax exemption power to promote green
buildings or energy efficiency retrofits on existing buildings (e.g. properties that install solar
panels or solar hot water heaters), or multi‐building or neighbourhood‐scale initiatives (e.g. heat
pump or heat recovery system). Dockside Green, a sustainable development located in Victoria,
BC, was facilitated by a tax exemption bylaw, particularly with respect to development of a
biomass plant to provide district energy.9
f. Density Bonusing
The Local Government Act allows local governments to exchange density for amenities. This
means that a developer may be allowed to build more units than what is normally permitted in
the zone (via increased floor space ratio, site coverage or number of buildings per parcel) in
exchange for the provision of amenities such as recreation centres, public squares, or pedestrian
or bicycle paths. Typically these amenities have included parks, public areas, improvements to
roads and sidewalks, public art, space for recreational or community services, and affordable
housing, but this tool may be able to be used to promote a district energy system that serves as
a community amenity. Density bonusing is only an incentive if both developer and local
government agree that the site can reasonably accommodate more density, if both developer
9 http://canmetenergy‐canmetenergie.nrcan‐rncan.gc.ca/eng/buildings_communities/communities/publications/dockside_green.html

FINAL REPORT
25
and local government agree upon type and value of the preferred amenity, and if the developer
can anticipate a reasonable profit while providing the amenity.
Density bonusing was used by the City of Burnaby to encourage green buildings at the
UniverCity site. UniverCity and the City of Burnaby implemented a set of zoning bylaws that
included requirements for sustainable features and practices in all new developments. This is
one of the first bylaws in North America that mandates green building practices as part of the
development process resulting in significantly more environmentally friendly and energy
efficient projects. The bylaw includes a green building bonus, which provides density bonusing
for projects demonstrating further enhancements in the areas of stormwater management,
energy efficiency, and utilization of alternative energy systems. Innovative financing was also
used to support construction of a key building on the site, the Verdant.10
g. Expedited approvals and/or reduced permit fees
Expedited approvals and reduced permit fees save developers time and money, and can provide
an added incentive to consider district energy or renewable energy systems during
development. The attractiveness of an expedited approval process for innovative projects
should not be underestimated.
Further information on policy tools, as well as examples from other communities, can be found in
Energy Efficiency and Buildings: A Resource for BC’s Local Governments
http://www.communityenergy.bc.ca/resources‐introduction/energy‐efficiency‐buildings‐a‐resource‐for‐
bcs‐local‐governments and in the Renewable Energy Guide for Local Governments in BC – Policy and
Governance module: www.communityenergy.bc.ca/resources/cea‐publications‐0
10 Lowry, Sam: Taking Green Higher, American Planning Association, 2008 http://www.univercity.ca/upload/documents/APA‐magazine_TakingGreenHigher.pdf
FINAL REPORT
26
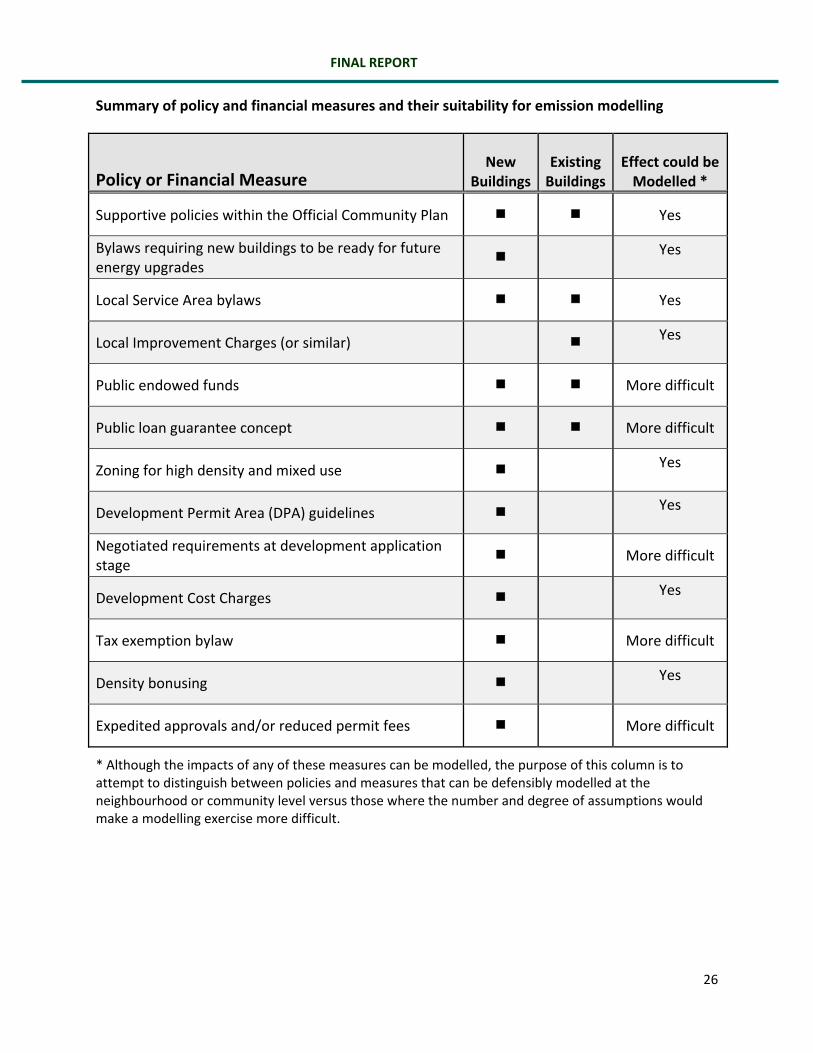
Summary of policy and financial measures and their suitability for emission modelling
Policy or Financial Measure New
BuildingsExisting Buildings
Effect could be Modelled *
Supportive policies within the Official Community Plan Yes
Bylaws requiring new buildings to be ready for future energy upgrades Yes
Local Service Area bylaws Yes
Local Improvement Charges (or similar)
Yes
Public endowed funds More difficult
Public loan guarantee concept More difficult
Zoning for high density and mixed use Yes
Development Permit Area (DPA) guidelines Yes
Negotiated requirements at development application stage More difficult
Development Cost Charges Yes
Tax exemption bylaw More difficult
Density bonusing Yes
Expedited approvals and/or reduced permit fees More difficult
* Although the impacts of any of these measures can be modelled, the purpose of this column is to attempt to distinguish between policies and measures that can be defensibly modelled at the neighbourhood or community level versus those where the number and degree of assumptions would make a modelling exercise more difficult.

FINAL REPORT
27
Community Energy and Emissions Inventory (CEEI) The 2007 CEEI Reports developed by the Province of BC represent high level modeled community energy
consumption and greenhouse gas emissions from on‐road transportation, buildings, solid waste and
land‐use change (deforestation at regional district scale only). The first of their kind in North America,
these reports are intended to help local governments meet their Climate Action Charter commitments
to measure and report on their community's greenhouse gas (GHG) emissions profile.
These inventories also help local governments meet the Green Communities legislative requirement (Bill
27) to establish greenhouse gas targets, policies and actions in official community plans or regional
growth strategies. Subsequent releases of CEEI reports will include secondary indicators to expand the
emission inventory range and to support the government’s emerging Green Communities Performance
Reporting Program.
Like all inventory systems, the BC government’s CEEI reports are live documents that will continue to
improve.11 They are designed to create a solid foundation upon which local governments can build. 12
Community energy use and GHG emission inventories for Lower Mainland municipalities
Municipality Population Dwellings Residential Buildings Commercial Buildings
(2007) (2007) Energy (GJ) CO2e t Energy (GJ) CO2e t
Metro Vancouver
2,237,559 870,992 78,687,089 2,826,151 68,925,052 1,913,615
Anmore 2,032 571 118,423 4,499 2,882 20
Belcarra 679 296 46,767 1,486 2,605 46
Bowen Island 3,615 1,640 130,487 797 20,096 123
Burnaby 214,993 82,950 6,733,730 246,031 8,309,722 223,273
Coquitlam 120,286 43,241 4,460,108 167,541 2,859,369 80,954
Delta 99,588 35,125 4,367,951 167,122 3,654,821 91,877
Langley City 25,155 11,110 738,233 23,816 1,155,992 36,118
District of Langley
99,132 35,098 4,795,616 172,263 3,251,292 90,861
Lions Bay 1,404 552 62,060 637 4,439 30
Maple Ridge 72,577 26,488 2,971,450 102,725 1,255,564 34,281
11 The figures in the table represent the May 2010 version of the 2007 CEEI reports. 12 Appendix C contains additional information on CEEI.
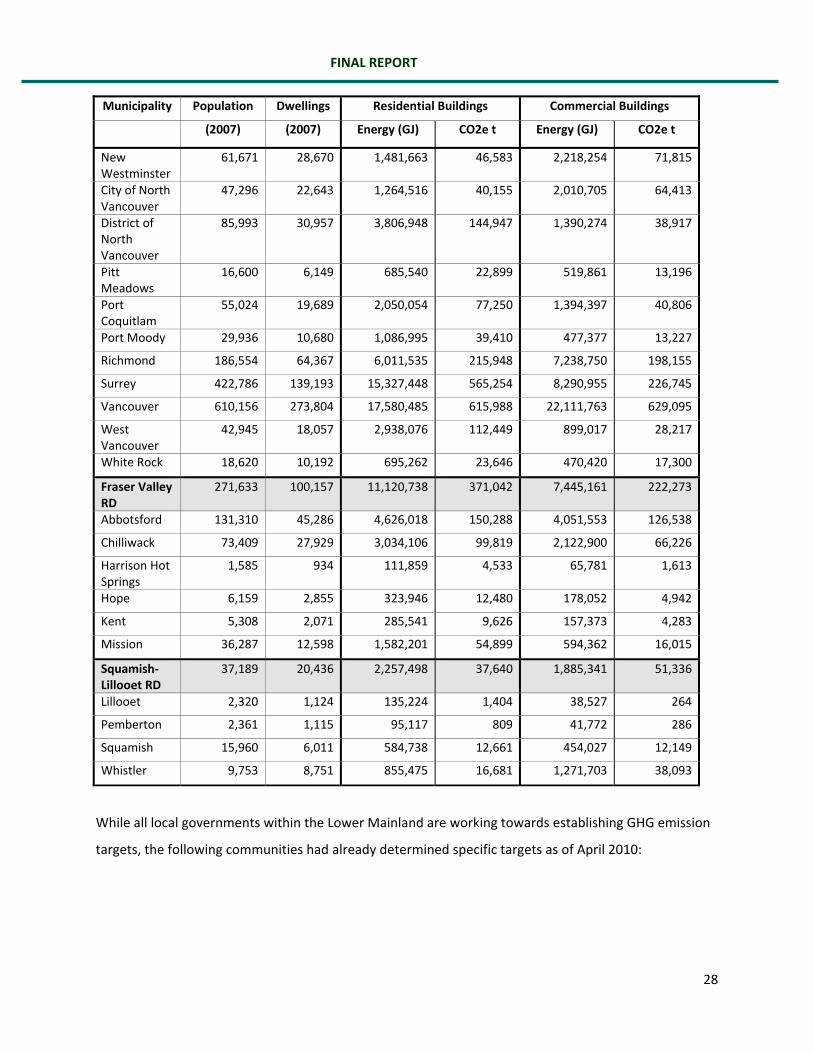
FINAL REPORT
28
Municipality Population Dwellings Residential Buildings Commercial Buildings
(2007) (2007) Energy (GJ) CO2e t Energy (GJ) CO2e t
New Westminster
61,671 28,670 1,481,663 46,583 2,218,254 71,815
City of North Vancouver
47,296 22,643 1,264,516 40,155 2,010,705 64,413
District of North Vancouver
85,993 30,957 3,806,948 144,947 1,390,274 38,917
Pitt Meadows
16,600 6,149 685,540 22,899 519,861 13,196
Port Coquitlam
55,024 19,689 2,050,054 77,250 1,394,397 40,806
Port Moody 29,936 10,680 1,086,995 39,410 477,377 13,227
Richmond 186,554 64,367 6,011,535 215,948 7,238,750 198,155
Surrey 422,786 139,193 15,327,448 565,254 8,290,955 226,745
Vancouver 610,156 273,804 17,580,485 615,988 22,111,763 629,095
West Vancouver
42,945 18,057 2,938,076 112,449 899,017 28,217
White Rock 18,620 10,192 695,262 23,646 470,420 17,300
Fraser Valley RD
271,633 100,157 11,120,738 371,042 7,445,161 222,273
Abbotsford 131,310 45,286 4,626,018 150,288 4,051,553 126,538
Chilliwack 73,409 27,929 3,034,106 99,819 2,122,900 66,226
Harrison Hot Springs
1,585 934 111,859 4,533 65,781 1,613
Hope 6,159 2,855 323,946 12,480 178,052 4,942
Kent 5,308 2,071 285,541 9,626 157,373 4,283
Mission 36,287 12,598 1,582,201 54,899 594,362 16,015
Squamish‐Lillooet RD
37,189 20,436 2,257,498 37,640 1,885,341 51,336
Lillooet 2,320 1,124 135,224 1,404 38,527 264
Pemberton 2,361 1,115 95,117 809 41,772 286
Squamish 15,960 6,011 584,738 12,661 454,027 12,149
Whistler 9,753 8,751 855,475 16,681 1,271,703 38,093
While all local governments within the Lower Mainland are working towards establishing GHG emission
targets, the following communities had already determined specific targets as of April 2010:

FINAL REPORT
29
Municipality Community Target
Metro Vancouver RD A 15% reduction by 2015 and a 33% reduction by 2020 below 2007 levels.
Bowen Island Stabilize greenhouse gas emissions at 2000 levels by the year 2010.
Delta Provincial Target: Reduce overall emissions by 33% of 2007 levels by 2020
North Vancouver City 6% below projected levels by 2010.
Port Coquitlam Target is 1,075 tonnes CO2e, an amount that will reduce emissions by 37% below 2002 levels by 2012. A target will be determined later this year
Vancouver 6% by 2012, 33% by 2020, 80 % by 2050. All new construction to be carbon neutral by 2030.
Squamish‐Lillooet RD 30% below 1990 levels by 2020 and 90% below 1990 levels by 2050.
Squamish GHG emissions per capita for regional energy systems are less than one tonne by 2030.
A list of CEEI secondary indicators was developed by the Sheltair Group for the Ministry of Environment
CEEI Working Group.13 This list consists of energy and GHG outcome indicators, as well as influence
indicators. For the purpose of a CEEI community indicator report, Sheltair proposes that both types of
indicators be included. Using sectors as an organizing framework, a refined list of indicators was
developed using the criteria that an ideal indicator would be:
Within the influence of local government
Meaningful and measurable data are available (or could be developed if indicator is important)
Easily and affordably measured
Easily understood by a broad range of readers and audiences
Comparable to indicators Secondary indicators are particularly helpful because there is a range of activities and influences that
local governments cannot control. Secondary indicators can be used to help measure progress towards
achieving outputs that will hopefully result in an improvement in the outcome indicator.
Recommended secondary indicators for buildings are as follows:
Number of new, energy efficient residential units
Number of new, energy efficient (LEED Certified or better) commercial/institutional buildings
Number of existing homes evaluated for EnerGuide rating through the ecoENERGY initiative
Number of dwellings on a renewable energy district heating system
13 The Sheltair Group, Community Energy & Emissions Inventory (CEEI) Secondary Indicators for Community Inventory Interpretation, June 2008 http://www.env.gov.bc.ca/epd/climate/pdfs/ceei‐second‐indicators.pdf

FINAL REPORT
30
3. Modeling Tools to Discern Impacts of Specific Local Government Actions
Model Overview As 187 14 local governments in British Columbia respond to the legal requirement to have a GHG
reduction target and action strategy in the document that guides development in the community
(official community plan or regional growth strategy), there is increasing use of modeling tools to
support the establishment of achievable goals and to discern the impacts of specific local government
actions.
Models to measure GHG emission reduction can be segregated into two broad groups. The first group
includes a “comprehensive” approach that addresses multiple aspects of development at a community
scale, typically addressing emissions from several categories of buildings and transportation options.
These models are applied at a community level rather than a provincial or national level. The second
category of models are “topic‐specific”, which typically address a particular topic area at a building or
unit scale such as RETScreen (http://www.retscreen.net) or detailed transportation modeling tools.
To support modeling efforts related to Build to Zero, the Community Energy Association (CEA) has
conducted a review of community‐scale GHG models with a view to identifying best practice approaches
to model the impact of local government actions that influence building‐related GHG emissions. Only
models in use within BC in March 2010, or those that would shortly be available for which we could
gather information, were reviewed.
There are several comprehensive models that are currently being used in BC to analyze and predict the
potential impact of policies and decisions on community greenhouse gas emissions related to buildings.
The models are referred to by the organizations that have developed them, or in the case of SHIFT, it is
referred to by its name as it was developed by a collaboration of volunteers. With the proponents in
alphabetical order, the models are listed in the following table:
14 According to the BC Ministry of Community & Rural Development, see http://www.cd.gov.bc.ca/lgd/pathfinder‐rd.htm

FINAL REPORT
31
Name of Modelling Tool (if any) Proponent
CEEP‐Lite BC Hydro (with Community Energy Association (CEA))
No formal name HB Lanarc (HBL)
CIMS and GEEM (known by their acronyms) MK Jaccard and Associates (MKJA)
SCEC3 (Spatial Community, Energy, Carbon and Cost Characterization Model)
Natural Resources Canada
SHIFT Accelerator SHIFT was developed through a collaborative effort and is currently managed by CEA
CE2 (Community Energy and Emissions model) Stantec
No formal name Sustainability Solutions Group (SSG)
No formal name University of British Columbia (UBC)
Other organizations such as MetroQuest were also contacted, but they considered that their model did
not sufficiently deal with emissions from buildings to warrant inclusion.
CEA has a full version of CEEP‐Lite, and was able to obtain full versions of both SHIFT and SSG models.
The other models are considered on the basis of background material that is available for them, such as
reports that have been conducted for clients, as well as communication with the proponents. The UBC
model is that described in the paper “City of North Vancouver 100 Year Sustainability Mapping Vision:
GHG Measurement and Mapping / Technical Paper”, by Nicole Miller and Duncan Cavens on behalf of
the UBC Design Centre for Sustainability.
It is important to note that the effectiveness of GHG emissions models is highly correlated to the
assumptions and data upon which they are based. In addition, all models reviewed by this report are
continually evolving and improving functionally. The review that follows is based upon current
functionality as of March 2010.

FINAL REPORT
32
Key characteristics of GHG emissions modelling programs used in British Columbia The characteristics by which each model is considered are described in the following table.
Characteristic Description Open source? Whether access to the model is open and free or not.
Includes economic analysis?
Whether the model accounts for economics or not; such as whether it includes technology costs, fuel prices, and uses this information to great extent to achieve its results. A model that partially achieves this usually can provide energy cost forecasts, while a model that fully achieves this may for example use increasing fuel prices to increase demand for sustainable energy technologies.
Interim targets Whether there is one final result that the model provides based on the inputs, or whether it is also capable of providing interim results from the base case to the final result.
Estimated complexity level An estimate of the level of complexity the model has, i.e. the extent to which it tries to represent the real world.
Effort to implement An estimate of the amount of effort that is involved in implementing the model.
Software basis The name(s) of the software packages that the model uses.
Spatial at the community level? Whether the model has a spatial component at the level of individual communities or not, e.g. through GIS.
Number of building archetypes The number of building archetypes that the model uses.
Attempt to simulate human behavioural choices?
Whether the model makes any effort to simulate the effects of human behavioural choice or not (e.g. the likelihood of choosing to walk instead of drive, or not select a building technology due to unfamiliarity). Some models may only incorporate one behavioural aspect, while others are more comprehensive.

FINAL REPORT
33
The table below compares each model by the key characteristics. BC
Hydro / CEA
HBL MKJA NRCan SHIFT Stantec SSG UBC
Open source?
√ × × √ √ × √ ×
Includes economic analysis?
(partial) (partial) √ (partial) (partial) × (partial) ×
Interim targets
Annual 3
Every 5 years or
user choice of
milestones
Every 5 years or user
choice of milestones
Annual Annual, up to 2050
None 1
Estimated complexity level
Medium High High High Medium Medium Medium Medium
Effort to implement
Medium High High High Medium Medium Medium High
Software basis Excel
Excel and GIS
CIMS and GEEM
HOT2000, GIS, Excel, Access
Excel Excel Excel Unknown and GIS
Spatial at the community level?
× √ Partial √ × × × √
Number of building archetypes
None Unknown (likely 7+)
15 16 None None 4 8
Attempt to simulate human behavioural choices?
√ (limited)
Unknown √ √
(limited) ×
√ (limited)
√ (limited)
√

FINAL REPORT
34
Best practices for GHG emissions modelling in BC There are several practices in these models that appear valuable for Build to Zero:
Inputs
Leverage existing data (CEEI, BC Stats, Census, BC Assessment) Characterize built environment (residential and commercial building archetypes,
spatial characteristics such as density and proximity) Model / estimate current emissions based on characterization and compare to CEEI
to calibrate model Measure reductions from a Business as Usual Scenario
Modeling Content
Model the impact local government policies and actions can have on factors driving energy and emissions
Identify all assumptions and key variables including rationale for values Include ability to vary timing of each local government action Identify saving opportunities for all fuels (including electricity) Include economic development potential for local government actions Recognize level of confidence for each measure and include sensitivity Calculate actions within a sector (existing buildings) sequentially: measure
reduction from first measure from business as usual but measure reduction from second measure against the remaining emissions after the first measure is applied (to avoid double‐counting)
Outputs Include multiple interim dates – not just results for the end target date Display results graphically in formats such as maps, wedge diagrams or histograms Recognize the inherent uncertainty in models and use them to test multiple
scenarios or possible futures to inform decisions and plans Include increases and decreases across fuels including electricity
General Open source where possible to assist community GHG modeling evolution overall Use Microsoft Excel as a base Match modeling approach and effort to need
The following pages contain a table that summarizes the key assumptions used in some specific applications of each model. The CEA and SHIFT models are not part of this table because they do not contain sufficient assumptions. The NRCan model is not part of the table because there is insufficient information available on it.

FINAL REPORT
35
Proponent HBL MKJA NRCan Stantec SSG UBC Notes Information sourced
from District of North Vancouver report and personal communication
Information sourced from Metro Vancouver report and personal communication
Information sourced from NRCan personal communication, based on Prince George study
Information sourced from Stantec personal communication
Information sourced from model implemented for District of Kent and personal communication
Information sourced from City of North Vancouver report
Emissions – baseline and business as usual projection
Current emissions profiles utilised, and business as usual projection
CEEI calibrated with information including: • Population • Number of
residences and type
• Number of jobs • Average energy
intensity of building stock (NRCan)
• Existing transportation infrastructure
• Solid waste diversion rates
Data from census data & information from municipality
Lower Fraser Valley Emissions Inventory and BC’s greenhouse gas inventory. The models forecast greenhouse gas emissions to an end-year (e.g. 2020, 2030 or 2050), and are calibrated using the following information: • Population,
households, and economic growth
• Type of dwelling (i.e. single family detached, apartments, etc)
• Forecasts of energy prices and industrial output
• BC’s input-output accounts (which show the material, labour, energy and capital inputs for each sector of the economy)
Energy simulation for 16 different residential, commercial and industrial building types defined by BC Assessment year built dates, manual class and actual use values and calculated using HOT2000 software. Energy and emissions for industrial buildings that include process energy adjusted based on CEEI results All results compared with CEEI values Household occupation rates gathered from census data and BC Hydro studies Two different future projections were created based on a growth study by
CEEI data as basis for baseline Projection based on: • Population growth
& statistics • Housing statistics
from census data • Impact of
announced policy measures of BC to reduce energy use in residential and commercial buildings
• Changes of building type splits in the future
• Forecast calibrated with BC Hydro and Terasen data for different housing types in different regions
CEEI calibrated with information including: • Number of
households • Population • People per
household • Number of
buildings & of which type
• Factors for transportation, waste, forestry & agriculture
Data from census data & information from municipality
City of North Vancouver and CEEI inventories calibrated with information including: • Population • Number of
residences and type • Commercial,
industrial, and institutional floor space
• Number of jobs • Population density • Residential density • Annual growth rate • Transportation • Waste Population, employment, household, dwelling number and type information using National Census data sourced from Statistics Canada Building footprints provided by the City of North Vancouver, with some adjustment

FINAL REPORT
36
Other information provided by data from NRCan, National Energy Board, BC Climate Action Plan, Environment Canada
Urban Strategies Simulations and growth projections linked with City of Prince George GIS
for Comprehensive Development Zones using information from BC Assessment No Business As Usual baseline projection was made
Economics
Proponent HBL MKJA NRCan Stantec SSG UBC Energy price information – current & forecasted
Unspecified third party sources used for future energy prices
Flexible format, but options include the National Energy Board energy outlook, NRCan’s 2006 Energy Outlook, BC Hydro for electricity
Used current pricing for future as well: • Electricity rates
from BC Hydro • Natural gas rates
from Terasen
Uses current approximate price information (e.g. for CEEI data year). Does not currently include future price forecasting
Current only: • Fuel – BC Gas
Prices • Electricity – BC
Hydro rates • Natural gas –
NRCan • Heating oil –
NRCan • Wood –
woodheat.org
N/A
Current and projected capital and operating costs
N/A Technical and market literature
Capital costs for retrofit improvements gathered from a detailed study
N/A N/A N/A

FINAL REPORT
37
Buildings
Proponent HBL MKJA NRCan Stantec SSG UBC Energy intensity of current building stock
NRCan data for all buildings. Calibrated with CEEI data for commercial & industrial
Residential – historic data from Metro Vancouver on energy consumption Commercial – historic energy data used Industrial – derived using data from Lower Fraser Valley GHG inventory, labour statistics, and BC Stats 2003 information on energy costs and value added Sources include NRCan, Environment Canada, CIEEDAC and contact with industry representatives
Energy simulation for 16 different residential, commercial and industrial building types defined by BC Assessment year built dates, manual class and actual use values and calculated using HOT2000 software. Energy and emissions for industrial buildings that include process energy were adjusted based on CEEI results
CEEI data, crosschecked against BC Hydro (e.g. Conservation Potential Review) and Terasen actual energy use statistics for building types and climate zones
All buildings except apartments >5 stories – NRCan Comprehensive Energy Use Database Apartments > 5 stories – a CMHC research paper
Residential – BC Hydro Conservation Potential Review (CPR) Commercial & Industrial – for the City of North Vancouver project, the CPR did not correlate well with energy & emission inventory data, and so that data was preferred over the CPR

FINAL REPORT
38
Buildings (continued)
Proponent HBL MKJA NRCan Stantec SSG UBC Residential units turnover rate (i.e. reselling)
N/A Flexible format, but for Metro Vancouver study, Multiple Listing Service data from the Real Estate Board of Greater Vancouver – 5% per year
N/A N/A N/A N/A
Replacement rates for buildings
2% per year – figure derived in consultation with local government staff
A figure is used, but neither the figure nor the source are specified
Percentage smaller than 1% based on Prince George demolition records. Therefore, replacement was not considered separately from retrofit schemes
N/A N/A Replacement and retrofit rates are assumed. E.g. by 2107 all residential units built before 2050 would be replaced or retrofitted (replacements and retrofits are not provided separated out from each other). No source for this figure is provided

FINAL REPORT
39
Buildings (continued)
Proponent HBL MKJA NRCan Stantec SSG UBC
Retrofit rates 1-2% per year depending on scenario – figure derived in consultation with local government staff
Determined by the model using forecasts of economic conditions and energy/climate policy. Some assumptions (e.g. high energy prices) produce more favourable conditions for retrofits In Metro Vancouver study, if policy is enacted so that retrofits are prescribed when properties are resold then 4% per year. Based on MLS data from Real Estate Board of Greater Vancouver that states 5% of all properties resold each year
For all future scenarios the percentage of retrofits occurring are in 2018 - apartment 5%, mobile home 5%, row house 10% and single family 15%; in 2028 - apartment 10%, mobile home 10%, row house 20% and single family 30%, in 2038 - apartment 15%, mobile home 15%, row house 30% and single family 45% A conservative number of retrofits were modeled for each building type at future milestones based on the initial distribution of ecoENERGY audits among various building types
N/A as input data. Subsequent scenario building allows assumption of the rate of retrofit – either natural or through action
N/A

FINAL REPORT
40
Buildings (continued)
Proponent HBL MKJA NRCan Stantec SSG UBC
Current building stock age, and number / floor space
2006 Census data for ages of residential housing types, GIS data for floor space areas of building types
Residential and commercial - Most information is from NRCan, but MKJA also uses supplemental information from Statistics Canada census data Industrial – emissions modelled by industrial output. Various means used to estimate industrial output
BC Assessment Clarifications obtained through additional enquiries to BC Assessment or in the case of apartments, to the City of Prince George Where gaps in information on floor space and number of units existed, values were derived from the building footprints layer of the Prince George GIS database
Census data for dwelling type and age distribution
Dwelling number and type information using National Census data sourced from Statistics Canada Residential – Average floor area for each building type from NRCan Comprehensive Energy Use Database
Dwelling number and type information using National Census data sourced from Statistics Canada Building footprints provided by the City of North Vancouver, with some adjustment for Comprehensive Development Zones using information from BC Assessment

FINAL REPORT
41
Buildings (continued)
Proponent HBL MKJA NRCan Stantec SSG UBC Rate of increase of residential / commercial / industrial buildings
Residential – units increase based on population growth of 0.75% per year (based on Statistics Canada census data of 30 year trend of 1% per year, and discussions with District staff), distributed into housing types based on the scenario Commercial and industrial assumed to grow at a flat annual rate for District of North Vancouver at 1% per year to corroborate with projected regional economic/job growth rates and figures used for OCP planning
Residential – growth rates estimated from population and forecasts for BC housing stocks. Information source not provided Commercial – assumption that floor space is proportional to employment in service industries and going forward, to population. Information used from “CBRE Market Views” reports provided by Metro Vancouver Industrial – estimate for floor space of each industrial type matched with sub-sector increases in GHG emissions from Lower Fraser Valley Emissions Inventory forecasts, and corroborated with a previous model conducted by MKJA for BC as a whole
Based on growth strategy conducted by Urban Strategies Two future growth trends were modeled: one that showed little increase in multifamily units and another that showed almost all new construction as multifamily Growth in commercial and industrial buildings is not currently included
Indirectly included. Rate of growth of energy and emissions is defined by population growth. Model is not specific about number or floor space of buildings. (NB model can use forecasted dwelling or floor space projections if available to forecast energy and emissions)
Residential - growth rates estimated from BCStats growth projections Commercial / Industrial – no categories for commercial or industrial buildings
Not clear how rate of increase is assumed
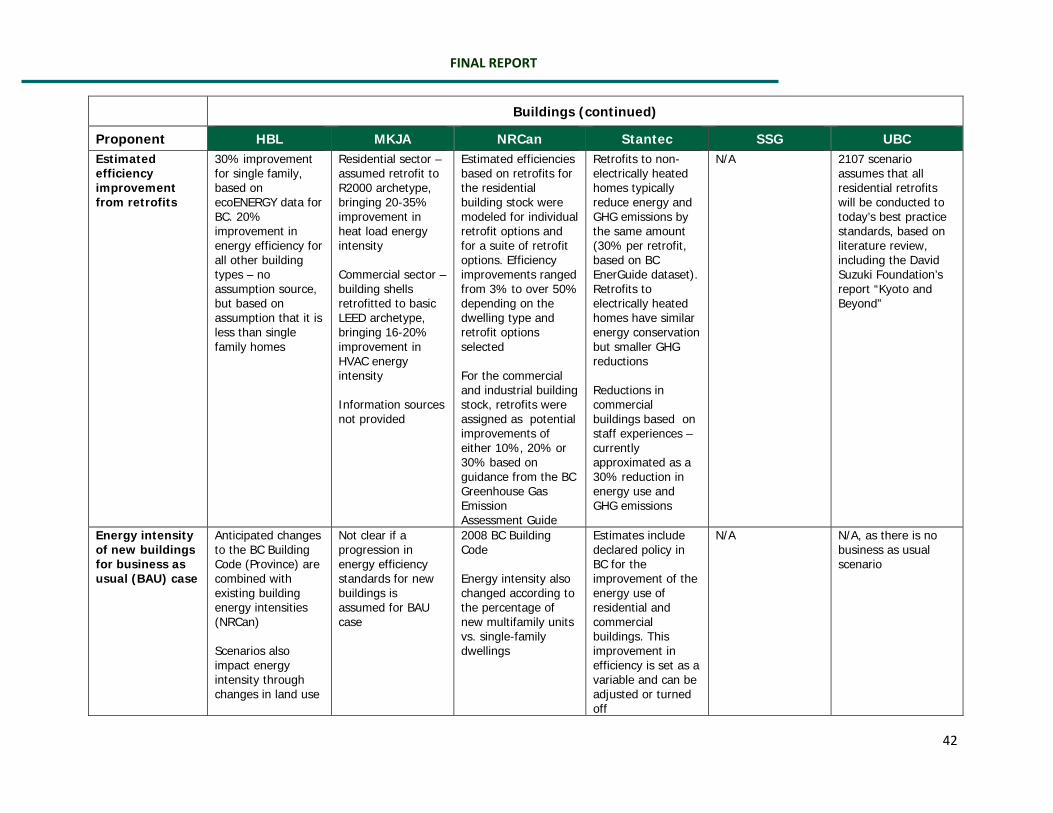
FINAL REPORT
42
Buildings (continued)
Proponent HBL MKJA NRCan Stantec SSG UBC Estimated efficiency improvement from retrofits
30% improvement for single family, based on ecoENERGY data for BC. 20% improvement in energy efficiency for all other building types – no assumption source, but based on assumption that it is less than single family homes
Residential sector – assumed retrofit to R2000 archetype, bringing 20-35% improvement in heat load energy intensity Commercial sector – building shells retrofitted to basic LEED archetype, bringing 16-20% improvement in HVAC energy intensity Information sources not provided
Estimated efficiencies based on retrofits for the residential building stock were modeled for individual retrofit options and for a suite of retrofit options. Efficiency improvements ranged from 3% to over 50% depending on the dwelling type and retrofit options selected For the commercial and industrial building stock, retrofits were assigned as potential improvements of either 10%, 20% or 30% based on guidance from the BC Greenhouse Gas Emission Assessment Guide
Retrofits to non-electrically heated homes typically reduce energy and GHG emissions by the same amount (30% per retrofit, based on BC EnerGuide dataset). Retrofits to electrically heated homes have similar energy conservation but smaller GHG reductions Reductions in commercial buildings based on staff experiences – currently approximated as a 30% reduction in energy use and GHG emissions
N/A 2107 scenario assumes that all residential retrofits will be conducted to today’s best practice standards, based on literature review, including the David Suzuki Foundation’s report “Kyoto and Beyond”
Energy intensity of new buildings for business as usual (BAU) case
Anticipated changes to the BC Building Code (Province) are combined with existing building energy intensities (NRCan) Scenarios also impact energy intensity through changes in land use
Not clear if a progression in energy efficiency standards for new buildings is assumed for BAU case
2008 BC Building Code Energy intensity also changed according to the percentage of new multifamily units vs. single-family dwellings
Estimates include declared policy in BC for the improvement of the energy use of residential and commercial buildings. This improvement in efficiency is set as a variable and can be adjusted or turned off
N/A N/A, as there is no business as usual scenario

FINAL REPORT
43
Buildings (continued)
Proponent HBL MKJA NRCan Stantec SSG UBC New buildings going beyond the code
Estimated 10% additional improvement relative to existing 2006 data. In one scenario also assumes a further strengthening of the code
Residential – equivalent of R2000 homes in 2015, and LEED in 2020. Equivalent to 10-30%, and 40-60% reduction in heat load energy intensity compared to standard Commercial – Use of the model’s archetype of LEED Silver for new buildings in 2015, Gold in 2020, and Platinum in 2025. Equivalent to 19%, 32%, & 45% improvement in HVAC energy intensity compared to existing buildings
In the current version of the model there is a low energy future that quantifies new buildings as 25% more efficient than the 2008 code standards
BAU scenario is the building code. Scenarios allow users to define a level of penetration for higher efficiencies (e.g. EnerGuide for Houses 80 or 85)
N/A 2107 scenario assumes that all new residential buildings will be built to today’s best practice standards, based on literature review, including the David Suzuki Foundation’s report “Kyoto and Beyond” Scenarios also impacted energy intensity through changes in land use Average building energy consumption assumed to be reduced by 50% by 2050, 70-90% by 2107 depending on building type

FINAL REPORT
44
Buildings (continued)
Proponent HBL MKJA NRCan Stantec SSG UBC Change to the energy mix used by buildings
Energy mix can be varied in forecasts. Options include district energy and other low carbon / renewable energy sources In North Vancouver report district energy assumed to be 25% of the emissions intensity of conventional all-gas heating, and for MURBs and commercial only
Can assume increasing use of heat pumps (air or ground source) and solar hot water systems for buildings For industrial buildings in Metro Vancouver report, assumption of no wood waste fuelled boilers
Air source heat pumps included as residential retrofit measure in high-efficiency scenario
In scenarios, users can define a change of energy source such as conversion to electric heat pumps or connection to a district energy system (renewable or not). Input parameters would be the penetration of the change, and the amount of savings achieved for adopters
Energy mix to buildings can be varied by the user, using (clean) electricity, natural gas, heating oil, “other” (e.g. propane), wood or district energy systems. Emissions factors for these energy sources can also be varied except for district energy which assumes a default reduction in energy intensity from the other energy sources
This can be varied, through both low carbon district energy implementation for high density and other low carbon energy sources for low density

FINAL REPORT
45
BC Hydro (with CEA) – CEEP Lite Background
On behalf of BC Hydro, CEA is developing a non‐spatial Excel‐based tool for assessing community greenhouse gas emissions. The tool was still undergoing development in March 2010. It is intended for use in communities with a population under 20,000, to assist with a rapid, action‐oriented approach to Community Energy and Emissions Planning, and to help communities meet community GHG targets such as those required under Bill 27. Unlike other models, CEEP‐Lite starts with what policy, regulatory, fiscal, and organizational actions a local government can take. Overview
The model is based in large part on the Community Energy and Emissions Inventories (CEEI). In summary, a user inputs the CEEI data from a particular community, confirms a population growth projection and selects a GHG reduction target. The user answers several key questions which are used to narrow the scope of specific actions. The user then identifies when specific actions will start to take place. At this point, one can accept the ‘default’ values and go directly to graphical results or fine tune the impact of actions. The model has been set up to facilitate a user in varying the actions selected, in order to understand what policies are necessary to meet or exceed their community GHG target.
A representative sample of the key questions and possible actions are shown in the table below.
RESULTS
Sectors FuelsOverview
-
1,000
2,000
3,000
4,000
5,000
6,000
7,000
8,000
2007
2009
2011
2013
2015
2017
2019
2021
2023
2025
2027
2029
2031
2033
2035
2037
2039
2041
2043
2045
2047
2049
GHG Emissions
BAU
Target
Plan
-
20,000
40,000
60,000
80,000
100,000
120,000
140,000
2007
2010
2013
2016
2019
2022
2025
2028
2031
2034
2037
2040
2043
2046
2049
BAU Energy Use (GJ) by Sector
Commercial/ Small-Medium Industrial
Residential
HDV
LDV
-
20,000
40,000
60,000
80,000
100,000
120,000
140,000
2007
2010
2013
2016
2019
2022
2025
2028
2031
2034
2037
2040
2043
2046
2049
Planned Energy Use (GJ) by Sector
Commercial/ Small-MediumIndustrial
Residential
HDV
LDV
-
20,000
40,000
60,000
80,000
100,000
120,000
140,000
2007
2009
2011
2013
2015
2017
2019
2021
2023
2025
2027
2029
2031
2033
2035
2037
2039
2041
2043
2045
2047
2049
Planned Energy Use by Fuel
Propane
Heating Oil
Wood
Natural Gas
Electricity
Mobility Fuels
-
20,000
40,000
60,000
80,000
100,000
120,000
140,000
2007
2009
2011
2013
2015
2017
2019
2021
2023
2025
2027
2029
2031
2033
2035
2037
2039
2041
2043
2045
2047
2049
Business as Usual GJ by Fuel
Propane
Heating Oil
Wood
Natural Gas
Electricity
Mobility Fuels
-
1.00
2.00
3.00
4.00
5.00
6.00
7.00
8.00
2007
2009
2011
2013
2015
2017
2019
2021
2023
2025
2027
2029
2031
2033
2035
2037
2039
2041
2043
2045
2047
2049
Per Capita Emissions
BAU
Target
Plan

FINAL REPORT
46
Results from the model are given in the form of total GHG emissions and per capita GHG emissions, allowing simple comparison between the business as usual, the target, and the planned scenarios. Results from the model are also given in energy use in GJ, by sector and by fuel, for both the business as usual scenarios and the planned scenarios. The results minimize double‐counting by applying actions in a particular sector sequentially.
Benefits and Potential for Future Development
The benefits of this model include:
1. It is easy to use, with just a few worksheets to control the variables. Measures can be easily
selected or deselected, or brought forward or delayed in time
2. Important assumptions are exposed
Sample of Key Questions Sample of Possible Actions General • Is there strong interest in clean energy in
the community? • Establish an Energy Task Force • Establish a regional energy co‐op
Buildings • Can enforcement of the energy components of the building code in all renovations and new building be improved?
• Improve building code enforcement
• Is there a source of waste heat (e.g. rink, WWTP) near to heat demand (e.g. pool, hospital) OR Are several public‐sector buildings located close to each other?
• Are new public‐sector (local government, PSO's…) buildings planned?
• District Energy/Renewable Energy Systems or Studies
Transportation • Are there major trip destinations less than 3km from a significant number of residences? (commercial services, schools, hospitals, employers, etc.)
• Are there trip destinations within 5km‐8km of a significant number of residences?
• Are there major trip destinations beyond 8km that are not sufficiently served by transit?
• Information/Education/Outreach (topic: transportation, audience: commercial)
• Ride‐Sharing and Guaranteed Ride Home Programs
• Intercommunity Transit Services
Waste • Is a significant amount of organics going to landfill that could be diverted?
• Organics Diversion

FINAL REPORT
47
3. Actions can start at different times, creating a true action plan
4. There are many measures that can be varied, including ones where the GHG reductions will be
less tangible and therefore harder to model. E.g. formation of an energy task force
5. Measures are directly related to specific policy and regulations
This model may benefit from future development to:
1. Improve the business as usual scenario emissions which are only based on per capita GHG
emissions from the CEEI reports. Other factors, such as economics, are not considered
2. Include an ability to overlay a number of different scenarios (i.e. overlaying the results of
different action plans)
3. Although the model is not aimed at larger communities, the land use component is too
simplified to be of great use to them compared to other models
HB Lanarc Background
HB Lanarc has developed a detailed spatial and temporal tool to look at the emissions from a
community, and to forecast estimated impacts that various policies will make. As of March 2010, HB
Lanarc had utilized the model in six communities inside and outside BC, with three more underway. The
District of North Vancouver modeling (used for the table of assumptions above and also referenced
below) was the first of the communities to utilize this modeling framework.
The baseline and business‐as‐usual scenario is made using CEEI, GIS data sets, assumptions, and meta‐
analysis from peer‐reviewed papers, government commissioned studies, and local government reports.
Overview
The model is detailed and requires many inputs and assumptions.
Inputs include:
• Population
• Number of and the spatial distribution of the following housing types:
− Single detached homes
− Townhouses
− Low rise apartments
FINAL REPORT
48
− High rise apartments
− Secondary suites
• Number and distribution of existing jobs
• Average energy intensity of the existing building stock using data from Natural Resources
Canada
• Information on existing transportation network including bus routes and cycle routes
• Existing rates for diversion of solid waste
The expected emissions from these parameters are compared to the baseline established with CEEI.
When forecasting into the future, changes in the variables are made at future milestone dates, e.g.
2020, 2030, and 2050. With respect to buildings, the following changes to variables are made:
• Growth and distribution of new development
− Population growth and growth of commercial/industrial floor space (projections from
recent analysis or studies are used)
− Population growth rate is converted to an estimate of unit types, the mix of these are
determined by the scenario
− Over time, some existing buildings are assumed to be replaced with new buildings
constructed to the latest building code standards, while remaining buildings are
assumed to be retrofitted for greater energy efficiency
• Buildings
− Total floor space for each building type is multiplied by an energy intensity factor,
kWh/m2/year
− In the District of North Vancouver report energy intensity was based on NRCan data for
existing buildings in BC. Forecasting into the future, the factors were varied according to
anticipated future changes to the BC Building Code. For commercial and industrial
buildings, the energy intensities were calibrated to reflect data from the CEEI report for
that community. For some scenarios, an additional 10% improvement in energy
efficiency for new buildings (relative to existing 2006 buildings) was expected, meaning
that the District would strive to go beyond the code
− Regarding retrofits and replacements to existing buildings, in the District of North
Vancouver report existing single‐family dwellings were assumed to achieve a 30%
improvement in energy efficiency retrofits (figure based on ecoENERGY data for BC). All

FINAL REPORT
49
other buildings were assumed to achieve a 20% energy efficiency improvement. Retrofit
rates for all building types were assumed to vary 1‐2% per year depending upon the
scenario, and replacement rates for existing buildings were assumed to be at 2% per
year
− Emissions factors for buildings are also based on the energy supply mix (electricity and
gas). The energy mix for forecasts can be varied through the introduction of renewable
/ low carbon energy sources, including district energy. The model can also vary the
carbon intensity of electricity
− Floor space is estimated from GIS data, and then replaced or retrofitted according to the
assumptions above
In addition to buildings, many variables are altered with respect to solid waste and transportation. (The
tool contains a large transportation component, which is based on the CMHC transportation tool.)
Buildings assumptions for each scenario conducted for District of North Vancouver are shown in the
table below. This does not imply that the same assumptions are used each time the model is utilized.
The model assumptions are configured on a project‐ and scenario‐ specific basis in consultation with
local government staff.
Variable Do a Little Do More Do a Lot Do the Most
Residential Buildings
Residential new building energy efficiency standard
As per existing green building code15 and anticipated code changes to 2020
Reduce energy consumption (relative to existing buildings16) by a further 5% beyond code requirements by 2020.
Reduce energy consumption (relative to existing buildings) by a further 10% beyond code requirements by 2020.
Reduce energy consumption (relative to existing buildings) by a further 10% beyond code requirements by 2020
Residential retrofit take up rate (per annum)
1% 1.5% 2% 2%
Residential retrofit efficiency improvements.
30% better than current average existing building for single family, 20% for multi-family.
30% better than current average existing building for single family, 20% for multi-family.
30% better than current average existing building for single family, 20% for multi-family
30% better than current average existing building for single family, 20% for multi-family
15 The “Green Building Code” refers to the energy efficiency measures introduced into the BC Building Code in 2008. 16 Building energy efficiency is measured relative to the average energy efficiency of the existing building stock.

FINAL REPORT
50
Variable Do a Little Do More Do a Lot Do the Most
Building Energy Supply
District Energy No district energy. Rely primarily on natural gas and grid electricity.
District energy (with renewables) for about 20% of all new apartment homes and commercial building stock by 2050
District energy (with renewables) for about 40% of all new apartment homes and commercial building stock by 2050
District Energy (with renewables) for about 60% of all new apartment homes and commercial building stock by 2050
Industrial/ Commercial/ Institutional (ICI) Buildings
ICI new building efficiency standard
As per existing BC green building code and anticipated code changes to 2020
Reducing energy consumption (relative to existing buildings17) by a further 5% beyond code requirements to 2020
Reducing energy consumption relative to existing buildings by a further 10% beyond code requirements to 2020
Reducing energy consumption relative to existing buildings by a further 10% beyond code requirements to 2020 and further improvements to commercial/ industrial buildings to 2030.
Commercial/ institutional retrofit take up per annum
1% 1.5% 2% 2%
Industrial retrofit take up
1% 1.5% 2% 2%
Residential retrofit efficiency improvements.
20% better than current average existing building
20% better than current average existing building
20% better than current average existing building
20% better than current average existing building
Outputs the model can produce include:
• Estimates for changes in per capita CO2 emissions for different areas of a community (down to
the neighbourhood or block level), for certain dates (e.g. 2030, 2050)
• Future forecasts of GHG emissions for a community, put into per capita emissions, compared
against other targets such as Provincial, and also split into the following categories:
− solid waste
− public transit
− private transportation
− industrial buildings
− commercial buildings
17 Ibid

FINAL REPORT
51
− residential buildings
• Energy cost forecasts
• Wedge analyses, which can be split in various different ways, and where each wedge
corresponds to a single policy or a set of policies. In the report for District of North Vancouver
the emissions reduction wedge analysis showed what components are reducing emissions
compared to the BAU case and by how much. Components making up the wedges included:
− Improved vehicle fuel efficiency
− Improvements in the BC Building Code and greening of the grid
− Increased diversion of solid waste, based on a plan by the Regional District
− Increased diversion of solid waste, going beyond a Regional District plan
− Smart growth (compact, complete community land use planning)
− Greener buildings (higher efficiency new buildings, increased uptake of retrofits, district
energy, and onsite renewable energy technologies)
− Any remaining emissions
Benefits and Potential for Future Development
The benefits of this model include:
1. It is a very comprehensive model that also includes a spatial component at the community level
2. The assumptions regarding building code changes may be incorporated as the business as usual
scenario and/or as part of other scenarios
This model may benefit from future development to:
1. Maintain robustness of the model while reducing the effort required to implement the model
MK Jaccard & Associates – CIMS and GEEM Background
MK Jaccard and Associates (MKJA) employs two energy economy models – CIMS and GEEM, which are
known by their acronyms. The CIMS model is a technologically detailed model primarily used to forecast
the effect of energy/climate policy or changing economic conditions on energy consumption,
greenhouse gas emissions, and economic costs. The GEEM model is an economic model primarily used
to estimate impacts of policies or economic conditions on economic performance (e.g. gross domestic
product) and employment among other indicators.

FINAL REPORT
52
The CIMS tool is frequently used for provincial and national analysis, but can also be calibrated for sub‐
regions within BC (it has for example been calibrated for Metro Vancouver). Although not strictly spatial,
the model includes some spatial components that are pertinent to municipal analyses. Specifically,
CIMS can simulate an explicit urban planning policy package that affects the emissions and energy
consumption of the residential, commercial and transportation sectors. Furthermore, CIMS can be used
to explore the criteria that support district energy systems while determining how the development of
the systems will affect energy consumption and emissions.
To date, GEEM has only been used for provincial and national level analyses, but it could be adapted to a
municipal level project. The current version of GEEM represents British Columbia, Alberta,
Saskatchewan, Manitoba, Ontario, Quebec, Atlantic Canada and the United States as separate regions.
CIMS
Overview
The CIMS model is a
technologically detailed
model that represents
individual technologies that
can be used to meet the
demand for energy services.
CIMS tracks existing
technology stocks, while
simulating how households
and firms select technologies,
processes or behaviour under
different economic
conditions and policy levers, and how these choices affect energy consumption and greenhouse gas
emissions. For example, in the residential model CIMS represents various building shells and space
heating technologies that can satisfy the demand for heated residential floor space. Each specific
technology archetype for a building shell has different costs, energy requirements, and emissions. The

FINAL REPORT
53
same is true for space heating technology archetypes. Energy prices, policies and consumer behaviour
determine the range of building shells and heating technologies in use as well as their resulting energy
consumptions and emissions. These are also affected by rates of building turnover, retirements,
retrofits, and new purchases. Similar competitions take place for other energy uses in the residential
sectors and for all other sectors.
The model simulates the interaction of energy supply and demand. For example, reductions in energy
use, apart from reducing emissions, can also lead to reductions in the price of that energy source if they
are large enough.
Both the costs and energy efficiency of new technologies are estimated through technical and market
literature. Consumer preferences are estimated, based upon a literature review, judgement, analysis,
and consumer surveys. The use of surveys to model behaviour is unique compared to the other models.
Considerable detail on technologies is contained in the model, in order to ensure that policies are
modelled in a realistic technological and economic context.
Projecting forwards, the baseline is based upon assumptions about how the economy may evolve in the
future, given historic trends as well as research about the evolution of technology and economics.
The baseline includes assumptions on:
• Population forecast (e.g. trend from BC stats)
• Local GHG emission inventories, supplemented by data sources such as projections from the BC
Climate Action Plan
• Technology development, as described above
• Consumer behaviour, as described above
• Energy prices – derived from reported figures from the National Energy Board, Natural
Resources Canada, BC Hydro, as well as professional judgement
• Economic activity in various sectors of the economy
• Federal policies for buildings (e.g. continuation of a federal renewable power production
incentive, and introduction of planned federal minimum energy performance standards for
household appliances)
• Provincial policies – CIMS can also include Provincial climate action policies, such as those from
the BC Climate Action Plan
FINAL REPORT
54
CIMS has the capacity to simulate a wide variety of policy options, such as carbon or energy pricing
policies, regulatory policies, market oriented regulations, and subsidy programs. With respect to policy
options open to local governments that are specific to buildings, MKJA modelled four policy options in a
report written for Metro Vancouver:
1. Retrofit standards for buildings
− Requiring that, when sold, existing residential and commercial buildings would need to
meet minimum energy efficiency standards. The report states that the annual retrofit
rate is estimated at 4% of the building stock per year, based on MLS data that states
that there is turnover of 5% of the residential building stock each year. Residential
buildings would be retrofitted to the R2000 standard (bringing a 20‐35% decrease in
heat load energy intensity), and commercial building shells would be retrofitted to the
basic LEED standard (bringing a 16‐20% decrease in HVAC energy intensity). The retrofit
regulation also assumes that new buildings will be built to these standards
− By 2020, this measure is estimated to reduce GHGs by 0.4 MTs below the baseline for
Metro Vancouver
− Of the policy measures considered in the report (including policy measures that both
relate to and are unrelated to buildings), this measure scores the lowest. MKJA also
highlight potential difficulties in implementing this policy measure, they conclude that
considerable analysis would be required before proceeding with it, and they highlight a
preference to other approaches to building energy retrofits, such as direct incentives,
and local improvement charges
2. Energy efficiency standards for new buildings
− Requiring that new buildings meet increasingly stringent energy efficiency targets. For
commercial sector LEED Silver by 2015 (reducing HVAC energy intensity by 19%), LEED
Gold by 2020 (32%), and Platinum by 2025 (45%). For residential sector, R2000
standards for homes by 2015 (reducing heat load intensity by 10‐30%), and LEED
standard by 2020 (40‐60%)
− By 2020, this measure is estimated to have reduced GHGs by 0.9 MTs below the
baseline
3. Electrification of building heating systems (low energy)

FINAL REPORT
55
− Requiring all new heating systems to use electricity, or to reduce demand using on‐site
renewable energy systems, e.g. solar water heating. This was modelled by limiting the
selection of space heating and water heating technologies after 2010. Because this is a
“low energy” option (see other option below) electric baseboard heaters are not
considered, so options are limited to heat pumps (ground‐ or air‐source) or solar water
heating (by itself or supplemented with electricity)
− By 2020, this measure is estimated to have reduced GHGs in Metro Vancouver by 2.4
MTs below the baseline and to have increased electricity consumption by 21% above
the baseline (the report states that this is approximately equivalent to the output from a
1,800 MW wind farm)
4. Electrification of building heating systems (low capital cost)
− As with the policy measure above except that electric baseboard heaters are
considered. It is assumed that existing subsidies on air source heat pumps continue and
therefore remain popular, and that the fraction of heating that is baseboard heating
remains similar to the current proportion. Adoption rates of solar water heating under
this scenario were very similar to the “low energy” scenario, and adoption rates for
ground source heat pumps were almost as high
− By 2020, this measure is estimated to have reduced GHGs in Metro Vancouver by 2.4
MTs below the baseline and to have increased electricity consumption by 23% above
the baseline
Benefits and Potential for Future Development
The benefits of this model include:
1. CIMS is perhaps the most detailed of all of the models reviewed in this report, and therefore it
should provide the most accurate estimate regarding the forecasted impact of future policies
2. In deriving its forecast, the CIMS model forecasts the actual response of households and firms,
rather than producing scenario based analysis that shows the energy consumption and
greenhouse gas emissions that would result if certain people adopted certain technologies. The
CIMS model considers the following details:
− An assessment of how financial costs affect uptake of new technology
− Modelling of non‐financial behaviour impacting the adoption of new technologies in
buildings (e.g. uncertainty around an unfamiliar technology)

FINAL REPORT
56
− Energy cost forecasting within the model, linked to expected uptake rates of new
technology
− Learning‐by‐doing, which simulates how the costs of new technologies decline over time
as households and firms accumulate experience with the technology (e.g. the cost of
plug‐in hybrid vehicles declines if they attain significant market penetration)
− Neighbour effect, which simulates how consumer preferences toward specific
technologies may improve if they are widely adopted
CIMS may benefit from future development in the following areas:
1. Maintain robustness of the model while reducing the effort required to implement the model
2. Incorporation of a spatial component
3. Consideration of a variety of renewable energy technologies including industrial conversions to
wood waste fuelled boilers
GEEM
Overview
MKJA employs a computable general equilibrium (CGE) model called GEEM, essentially a sophisticated
input‐output economic model that balances supply and demand for commodities and services in all
markets though prices. Capital is assumed to be mobile between provinces/states within each country,
while labour is assumed to be mobile within regions (inter‐region migration is not assumed to be
influenced by the policy). In the model, a representative household in each region is the owner of
primary factors (labour, capital and natural resources) which they rent to producers who combine them
with intermediate inputs to create commodities. Commodities can be sold to other producers (as
intermediate inputs), to final consumers, or to other regions and the rest of the world as exports.
Commodities can also be imported from other regions or the rest of the world.
GEEM could be utilised by a local government for a detailed forecast of the anticipated economic effects
of implementing certain policies, i.e. the impact on the bottom line for households and businesses.
GEEM could also help a local government understand if people and businesses would relocate to other
communities if they implemented certain policies.

FINAL REPORT
57
Natural Resources Canada – SCEC3 Background
The CanmetENERGY division of Natural Resources Canada, developed the Spatial Community Energy,
Carbon and Cost Characterization Model (SCEC3) for the City of Prince George, British Columbia. Created
in 2008 ‐2009 as part of the Prince George Smart Growth on the Ground process, SCEC3 was originally
limited to energy performance of the existing residential housing stock. In 2010, the model was
expanded to include commercial and industrial buildings, as well as GHGs and cost. Designed to support
the City’s ICSP/OCP process and for research purposes, the SCEC3 model, in part, uses building energy
information that is that is either not presently readily available for use by local governments or must be
generated through simulation.
A summary schematic of SCEC3 is shown below.

FINAL REPORT
58
Overview
The functionality of the SCEC3 model enables the calculation of present day energy aspects for the
building sector, including residential, commercial and industrial buildings. It strives for an accurate
accounting of the current building stock using modeled housing and building energy information, as well
as the ability to link Parcel ID (PID) numbers to BC Assessment building attribute information.
The model consists of data tables containing the results of housing and building energy simulation
connected to ArcInfo GIS software (ArcView version), custom queries developed within Access and
scenarios developed within ArcInfo GIS custom scripts.
The SCEC3 model also facilitates the exploration of energy, carbon and cost futures through the addition
of new buildings in specific locations and the retrofit of the current building stock in random locations;
retrofits can also be targeted to select neighbourhoods.
Energy modelling for homes was completed by HOT2000, using ecoENERGY Retrofit Audit records from
Prince George, obtained from NRCan’s Office of Energy Efficiency. Seven housing types were selected
for modelling for being representative of both the ecoENERGY Retrofit audit records and the overall
housing stock as described by BC Assessment data. In addition to baseline energy, GHGs and operating
energy costs, low cost and low energy retrofit scenarios were developed for individual housing types
based on information contained in the audit records. Five housing types were derived for existing
houses, and two were derived for new housing: one type was derived for new single family dwellings,
and another type for new townhouses built to the 2008 BC building code.
The model’s objective was to match the values for the residential, commercial and industrial buildings
contained in the 2007 CEEI data. To calibrate the model to the 2007 CEEI, 2007 weather year data was
used and 2006 census occupancy in housing simulations. Residential simulations also referred to BC
Hydro data for internal temperatures and lighting and appliance needs.
Commercial and industrial building categories were developed based on a relationship between BC
Assessment Manual Class and Actual Use codes as well as the archetypes contained in the Screening
Tool for New Building Design. These archetypes included commercial extended care facilities, hospital,
small office, retail – big box, retail – strip mall, retail – suburban, and schools. Industrial buildings were
divided into two classes of warehouse, one with minimal process energy and the second to which
additional process energy could be assigned. Actual buildings reflective of these categories were

FINAL REPORT
59
identified in the BC Assessment data and their attributes were used for simulation. Due to the limited
functionality of the Screening Tool, it was not possible to calibrate commercial and industrial building
simulations using the 2007 weather year. Additionally, no retrofit information corresponding to
representative buildings was available; therefore assumptions of 10, 20 and 30 % efficiency
improvements had to be assigned.
The baseline data incorporates:
• BC Assessment Jurisdiction and roll numbers and associated building attribute information. The
building stock as a whole was tailored to reflect what was in existence in 2007
• ecoENERGY Retrofit Audit records
• 2007 weather year data from Environment Canada
• 2006 census residential occupancy by building type from Statistics Canada
• Cost information including 2007 electricity and natural gas rates; capital costs of residential retrofits were also included for identified residential retrofits
• Construction of new buildings to 2008 BC Building Code
Current measures in the model that can impact emissions from buildings are:
• Low cost and low energy retrofit scenarios for residential houses based on the retrofit types found in the ecoENERGY post‐retrofit audit records
• Build‐out scenarios as guided by the Official Community Plan, in consistent time steps
Benefits and Potential for Future Development
The benefits of this model include:
1. Accurate representation of housing stock including energy, emissions and cost relevant
attributes; close calibration of residential sector with 2007 CEEI inventory
2. Calibration of the model using weather data
3. Advanced development of retrofit scenarios based on actual housing retrofit data
4. Advanced exploration of use of BC Assessment Jurisdiction and Roll data, use of this information
to inform modelling and linking of building energy information to PIDs
The model could benefit from future development in the following areas:

FINAL REPORT
60
1. Currently available data for commercial and industrial buildings limit the accuracy of this aspect
of the model. The Screening Tool for New Building design is limited in the range of building
archetypes it can model and simulations cannot be calibrated using weather year from a specific
year. Lack of retrofit and capital cost information for commercial and industrial buildings mean
that more generalized assumptions are relied upon
2. High level of complexity would currently preclude this model from being readily usable by either
consultants or municipalities; more work is required to simplify inputs, automate query
processes and standardize outputs for optimal use in municipal decision making
SHIFT Accelerator Background
SHIFT is a volunteer‐led modelling approach. The formation of the model took about 4,000 hours of
volunteer time from dedicated professionals. It is a non‐spatial, Excel‐based model that can be readily
used by a community.
Overview
The GHG baseline for a
community is taken from
its emission inventory,
and as with the majority
of the other models
reviewed, a business‐as‐
usual baseline is
projected forward based
upon trends and
professional judgement,
and reductions from that
baseline are based upon
policy decisions. SHIFT
does not address urban form changes in depth.
4©Copyright 2007 Community Energy Association
Conversion Factors
CO2e
GWh
Individual Measures (46)
Jurisdiction Baseline Data
- Past emissions- Growth Rate- Demographic Info- Other trends- CO2e- GWh
For Variable A to D:- Default/Start Date/Ramp Rate inputs and calculated values from 2005-2025
For Variable A to D:- Name- Units
Provincial Electricity Forecast
GHG Reduction Forecast
Other Impacts
Summary of +/- of electricity from implementation of measures
Summary of +/- of CO2e
from all measures
Summary of cost/embodied
energy/ air quality/ other secondary
measures
Conversion Factors
-CO2 equivalent for fuels(building & transportation)- GHG equivalency for electricity and industry- GHG equivalency for various GHGs
Control Interface
Interactions (New Provincial Carbon Intensity for Electricity)
Interactions(Linear and
Compounded Analyses)
INPUT = Baseline Data Measure Selection & Impact Analysis OUTPUTS = Forecasts/Impacts
Baseline
Updated carbon intensity of electricity resulting from measures

FINAL REPORT
61
SHIFT provides a single control sheet for all variables to facilitate “what if” analysis. There are a series of
sheets to show results, a sheet for the baseline, and separate sheets for the approximately 50 different
policy measures. The model includes emissions from waste, and Metro Vancouver point emissions.
Agriculture was intended to be included, but the current version of the model does not accommodate
this. Concurrent with IPCC methodology, the model does not include the following: international marine
or aircraft travel, emissions from forest fires or landfills, or CO2 emissions from either combustion or
degradation of biomass.
The baseline data is based on:
• Past emissions (1990‐2005 or present) in MtCO2e, by Sector/Sub‐Sector
• Baseline Electricity Use in GWh by Sector/Sub‐Sector
• Building floor area by type (millions ft2)
• Transportation baselines
• Baseline growth ratios
• Interesting trends (selected)
• Demographic Info
• Industry emissions information
Current measures within the model that can impact emissions from buildings are:
• Improved building standards for new homes to R2000
• Envelope, HVAC improvements for retrofits
• Smart growth – phasing out of single‐detached homes and moving to higher density residential
• Electrical efficiency improvements
• District heating/cooling and hot water
• Net zero buildings (new buildings)
• Solar photovoltaic installations
• Phasing out gas appliances and equipment
For the replacement of buildings there is a rate that the user can adjust by varying the assumed average
age of buildings. Conservation programs (e.g. building energy efficiency retrofit incentives) are also
modelled by applying a percentage reduction to the emissions for a sector or sub‐sector.
FINAL REPORT
62
Benefits and Potential for Future Development
The benefits of this model include:
1. It is easy to use, with just a single worksheet to control the variables. Unlike other models, it
does not require a database of the community; so t is considerably simpler and quicker to use it
to compare the relative impacts of different policy measures. The set‐up time for the model is
shorter
2. Important assumptions are exposed
3. Perhaps more measures that can be varied than any of the other models, and new measures can
be added
The model could benefit from further development in the following areas:
1. While accessible, some of the measures that can be varied require specialist knowledge that
some local governments will not have. Although users can simply select not to incorporate those
measures
2. Enhanced land‐use considerations
3. Inclusion of buildings archetypes
Stantec (formerly the Sheltair Group) – CE2 Background
The Community Energy and Emissions model (CE2) was developed by staff from The Sheltair Group (a
Vancouver based sustainability consulting firm – now part of Stantec Consulting).
This model was developed in 2009, and has been piloted in several communities. It continues to evolve,
and can be easily used by a community. The model does not have a spatial component, and uses
simplified assumptions to derive possible scenarios.
The model has evolved from an internal analysis tool to a workshop facilitation tool, used to facilitate a
“what‐if” analysis.
Overview
The inputs to the model include:

FINAL REPORT
63
• CEEI data
• Number of dwellings by type and age (census data)
• Population
The model includes a library of about 30 strategies pre‐configured for the reductions that would occur
from implementation. Users then review and discuss their desire for action and establish potential
uptake estimates.
As well, the user can define and describe up to 20 additional strategies/actions that are not in the
library. These are quantified in terms of the savings and the uptake expected. Work on the additional
strategies involves estimating:
• The emissions reduction potential of a given strategy as a percentage reduction from business‐
as‐usual (BAU) for each action or strategy that is applied to (e.g. residential retrofits save 30%)
• Uptake as a percentage of total units / or population / or energy use
• Starting year of the action / strategy and the phase in period for achievement of the action
Benefits and Potential for Future Development
The benefits of this model include:
1. Ability to rapidly deploy the model, and its ease of use and graphical representation
2. Minimal data requirements. The model can be swiftly pre‐loaded with CEEI, housing, and
population data (all available without charge on government websites). Users can begin analysis
with only one assumption – a population growth forecast value. Subsequent refinements can be
made with a small number of optional parameters if desired
The model could benefit from future development in the following areas:
1. Extending the model to address spatial components for larger communities
2. Increased linkage to specific policy
Sustainability Solutions Group (SSG) Background
Sustainability Solutions Group (SSG) has developed an open source tool for assessing community
greenhouse gas emissions and costs resulting from existing and potential land use patterns. The model

FINAL REPORT
64
uses basic GIS analysis to prepare data for the excel‐based tool. The excel‐based tool was initially
released in March 2010, and was developed with the assistance of a research grant provided by CMHC.
The model and its user guidebook can be freely accessed, edited and shared for non‐profit purposes at:
http://www.sustainabilitysolutions.ca/landuse/
Because this tool is open source, it was easier to directly assess the merits of this model compared with
some of the other tools reviewed by this report.
Overview
The projection of emissions for
future scenarios is calculated
using the following
information:
• General
− Population
− Number of
households
− People per
household
• Transportation
− Trip length
− Dwelling units
within 400m of the Central Business District
− Dwelling units within 400m of public transit
− Asphalt and gravel road lengths in the community
• Buildings
− Number of detached buildings
− Number of attached buildings
− Apartments under five stories
− Apartments over five stories
− If any of the buildings are on a district energy system
• Waste
Factor Baseline BAU Scenario 1 Scenario 2 Units
General 1. Total Households 1,920 2,920 3,018 2,940 #2. Total Population 5,376 8,176 8,176 8,176 #3. People per household 2.8 2.8 2.7 2.8 #4. Year 2006 2036 2036 2036
Transportation 5. Trip length (B. Trip length calculation) 13.9 17.3 18.9 16.7 km6. CBD, 400m 680 850 755 925 # of dwelling units7. Public transit, 400m 897 1,237 1,165 1,302 # of dwelling units8. Road length, asphalt 158 158 158 158 km9. Road length, gravel 10 10 10 10 km
Buildings 10. Detached 1,525 1,905 2,258 1,835 # of dwelling units11. Attached 180 500 315 520 # of dwelling units12. Apartments ≤ 5 stories 215 515 445 585 # of dwelling units13. Apartments > 5 stories 0 0 0 0 # of dwelling units14. Community energy- detached 0 0 0 0 # of dwelling units15. Community energy- attached 0 0 0 0 # of dwelling units16. Community energy- apt ≤ 5 0 0 0 0 # of dwelling units17. Community energy- apt > 5 0 0 0 0 # of dwelling units
Waste 18. Solid waste, no gas collection 2,688 4,088 4,088 4,088 tonnes/year19. Solid waste, gas collection 0 0 0 0 tonnes/year20. Liquid waste, tertiary treatment 839 1,163 1,002 1,235 # of households21. Liquid waste, septic 1,081 1,757 2,016 1,705 # of households
22. Agriculture, total area in crops 4,957 4,957 4,957 4,957 ha 23. Agriculture, local consumption 48% 48% 48% 48% percent 24. Agricultural land- perennial cover 298 298 298 298 ha 25. Agricultural land- till 1,759 1,759 1,759 1,759 ha 26. Agriculture no-till 72 72 72 72 ha 27. Beef and heifer cows 4,874 4,874 4,874 4,874 # of cows28. Dairy cows 4,733 4,733 4,733 4,733 # of cows29. Forest, absorption 0 0 0 0 ha 30. Forest- wood removals 0 0 0 0 m331. Forest- fuel removals 0 0 0 0 m3
12059 total forest cover1897 locally controlled forest cover
Forest and agriculture

FINAL REPORT
65
− Solid waste produced in tonnes per year, and whether or not landfill gas is collected
− Number of households connected to the sewer mains
− Number of households on septic systems
• Forest and agriculture
− Total area in crops
− Percentage of agricultural land where food is locally consumed
− Agricultural land with perennial cover
− Agricultural land where the soil is tilled or not tilled
− Number of beef and heifer cows, and number of dairy cows
− Area of forest that can absorb CO2
− m3 of wood removed from local forest
− m3 of wood for fuel removed from local forest
The tool makes 65 total assumptions for each scenario based on local trip diary data and research
studies from government, non‐government and academic sources. All the assumptions and their source
information are visible in the excel spreadsheet and can be adjusted if more localized information exists.
Assumptions include number of trips per household per day, percentage of trips taken by car, cost of
fuel and other items, the emissions factors from imported and local food, and other agricultural
emissions. With a scenario test for the SSG model conducted for the District of Kent, the sources of all
assumptions are laid out.
In order to generate the BAU scenario, the community emissions generated by the model should be
corroborated against CEEI. This can lead to tweaking the CEEI or the assumptions, ‘ground‐truthing’, and
explanation of any discrepancies. The BAU for this model can also include more than CEEI (e.g.
agriculture).
In addition, SSG has been able to use this tool to estimate the community‐wide emissions impact of
specific policies (e.g. 160 people switching to public transit, or providing district heating to 3,000
households).
Benefits and Potential for Future Development
The benefits of this model include:

FINAL REPORT
66
1. It is open source and free to download with support from a community of users. The open
source approach allows local governments who have been taken through the model to update
their baselines and monitor their greenhouse gas reduction targets over time
2. Policy‐relevant – measures the impact of individual policies on greenhouse gases
3. Easy to use – quick and straightforward to use
4. Includes both agriculture and forestry
5. Takes into account the lifecycle of asphalt and gravel roads, and how many kilometres of roads
there are in the community, and the resulting emissions from replacing that infrastructure
6. Goes beyond generally accepted carbon accounting to incorporate the transportation (supply‐
chain) emissions from food. E.g. locally grown food has lower embodied carbon
The model could benefit from further development in the following areas:
1. Inclusion of commercial or industrial buildings and related actions and projections in the model
2. Increased temporality including multiple interim targets and ability to vary start‐dates for
initiatives
UBC Design Centre for Sustainability Background
Assessment of the UBC modelling approach is based on the City of North Vancouver’s 100 Year
Sustainability Vision:
GHG Measurement and
Mapping / Technical
Paper. The work was
conducted by Nicole
Miller and Duncan
Cavens.
The UBC model
contains both spatial
components (to
forecast GHG
implications of land‐

FINAL REPORT
67
use and transportation decisions), as well as non‐spatial components (to forecast building related GHG
emissions). To calibrate the model, the City’s present conditions were forecast, and the resulting GHG
emissions were compared with currently available energy and emissions inventories.
The technical paper asserts that based upon a literature review, including BC Hydro’s Conservation
Potential Review, urban form characteristics such as density, location of jobs and services, and
availability of transportation alternatives may have the greatest impact on energy use and GHG
emissions.
Overview
Energy profiles for various categories of buildings were created. These profiles are quantitative
descriptions of energy sources and end use. The categories are:
• Single‐detached homes
• Duplex housing
• Row housing
• Units in apartment buildings < 5 stories
• Units in apartment buildings > 5 stories
• Commercial
• Institutional
• Industrial
The data for the residential unit types listed above was obtained from the BC Hydro Conservation
Potential Review, which provides energy data for building types in the Lower Mainland region. However
for commercial buildings, data from the BC Hydro report did not correlate well with reported
commercial energy demands for City of North Vancouver. Therefore, data was taken from community
energy and emissions inventories done for the City, and divided by the total areas attributed to each
building type.
For 2107, no reports or estimates were available, so the authors used professional judgement (e.g. by
2107 the authors estimated that all residential retrofits or replacement buildings would be done to the
best currently available construction practice and energy performance standard). The final energy
figures are given on a per‐unit basis for residential buildings, and a per‐ square metre basis for all other
buildings.

FINAL REPORT
68
As with other models reviewed in this report, forecasted community‐wide emissions are calibrated
against the emissions inventories that have been conducted for the community for the base year.
However, the unique feature of the UBC model is that there is no BAU projection for the future that
show what the community’s emissions would be if no further action was taken by the community. The
model only allows scenario forecasting, showing what the emissions reductions would be like compared
to the base year.
To achieve the required carbon emission reductions of 80% by 2050 and 100% by 2107 for the City of
North Vancouver, the following was necessary:
• Land use and density choices could lead to substantial reductions in energy demand
• Intensive building energy efficiency retrofits were required
• Substantially greater levels of energy efficiency in new construction (reducing building energy
consumption by approximately 50% by 2050, and 70‐90% by 2107, depending on building type)
• Adoption of zero carbon energy sources (primarily for heating by 2050, and for all energy needs
by 2107)
Benefits and Potential for Future Development
The benefits of this model include:
1. There appears to be an excellent spatial component to the model
The model could benefit from future development in the areas of:
1. While maintaining robustness of the model, reducing the effort required to implement the
model
2. Inclusion of economic aspects in the model
3. Inclusion of a business‐as‐usual baseline projection, to show what emissions would be like if no
further action was taken by the community. This can be useful to compare the results of
different policy measures and actions

FINAL REPORT
69
4. Estimating GHG Emission Reductions from Build to Zero Actions by Local Governments
This section of the report includes a measurement methodology that can be used to model / forecast
anticipated GHG emission reductions that would result from the suite of actions, policies, and initiatives
chosen by participating Lower Mainland municipalities. Articulation of this measurement methodology,
and the data required, will be invaluable to the overall 15‐month Build to Zero initiative in terms of
measuring progress and informing the iterative work being done by the local government working
groups as they select and prioritize the suite of actions appropriate for their municipalities. This
information will also be of great interest to participating staff from various Provincial ministries with an
interest in improving building energy performance and province‐wide emission reduction targets.
Note: In the tables that follow, MEMPR refers to the BC Ministry of Energy, Mines and Petroleum
Resources, MCRC refers to the Ministry of Community and Rural Development, and NRCan refers to
Natural Resources Canada. Information from BC Stats can be found at http://www.bcstats.gov.bc.ca/
and information from Statistics Canada can be found at http://www.statcan.gc.ca/start‐debut‐eng.html .

FINAL REPORT
70
Existing Buildings: Financial Incentives and Funding Programs for Building Energy Retrofits for Single Family Homes and Multi-Unit Residential Buildings 1. Single Family Homes
Explore use of local improvement charges and service area bylaws to foster retrofits in single family
dwellings and to foster district energy at the neighbourhood scale
Challenge Data Requirements / Metrics Likely Data Sources
1 What are the GHG emission reductions if __% of single family homes in Lower Mainland received an energy retrofit (i.e. thermal improvements in insulation and windows, changes in heating source, or solar H/W heating)?
Note that results will vary according depending upon combinations of retrofits in different house types. The approach that was taken in Prince George was to model low‐cost and low‐energy retrofits. Articulating a typical energy retrofit ‘package’ per building type would be useful for purposes of modelling results.
Existing building stock profile for Lower Mainland (i.e. dwelling units by type and age)
Average energy and emissions by type (class) of building
Create a Business as Usual (BAU) forecast of emissions from low‐rise homes (now and into the future)
Estimated energy efficiency improvements from ‘average’ LiveSmart retrofit
Estimate the proportion of likely single‐detached retrofits in Lower Mainland over time (i.e. annual uptake)
Estimate the number of years that each retrofit program would be in place
BC Assessment BC Stats NRCan – Existing housing
archetypes based on ecoENERGY retrofit audit records. from NRCan’s Office of Energy Efficiency, and CanmetENERGY
Research from Prince George suggests that housing archetypes can be used to model the impact of energy retrofits for existing low‐density residential
LiveSmart BC program BC Hydro Conservation
Potential Review Data from local
governments Multiple Listing Service data
from the Real Estate Board of Greater Vancouver – for data on resale rates if assuming retrofits will occur when properties resold
MK Jaccard and Associates Metro Vancouver paper for estimated improvement in energy efficiency
Policy and financial tools: Local improvement charges, supported by Official Community Plan policies and targets related to reducing energy use and GHG emissions from existing single family homes.
CEEI secondary indicator(s): Number of existing homes evaluated for EnerGuide rating through the federal ecoENERGY initiative and LiveSmart BC programs. Suggested indicator(s): Number of existing homes who have completed retrofits as part of the LIC program.

FINAL REPORT
71
Generalized algorithm for GHG emissions reduction: BAU = CEEI 2007 emissions from SF homes in lower mainland * annual % projected population increase AI = Annual Improvement = Average % improvement from retrofits (how much does one dwelling improve) * annual % uptake in lower mainland (what proportion of dwellings implement) Y = program duration in number of years OC = Outcome (GHG % reductions from BAU due to retrofits to single‐detached homes) ΣBAU * ΣAI * Y = OC
Notes: • Completing the data requirement points listed above will also benefit the ‘New Buildings’ modelling
section. • Research conducted by CanmetENERGY on characterization and mapping for the City of Prince
George explored the usefulness of BC Assessment data and the potential role of existing housing archetypes derived from ecoENERGY audit records. Results suggest that by combining aspects of these two datasets, that robust characterization of existing single family dwellings, duplexes and row houses can be achieved. Further work needs to be done however to make these datasets available more broadly for community energy and greenhouse gas characterization and mapping purposes.

FINAL REPORT
72
2. Multi‐Unit Residential Buildings
Identify and promote retrofit financing mechanisms for Multi‐Unit Residential Buildings (MURBs)
Challenge Data Requirements / Metrics Likely Data Sources
2 What are the GHG reductions if __ % of multi‐unit buildings in Lower Mainland received an energy retrofit (i.e. thermal improvements to building envelope / windows, changes in heating source, solar H/W heating, etc.)?
Existing building stock profile for Lower Mainland (i.e. dwelling units by type and age)
Average emissions by type (class) of building
Create a Business as Usual (BAU) forecast of emissions from MURBs (now and into the future)
Estimated energy efficiency improvements through ‘average’ retrofit of an existing MURB (Note: may need to look at programs from other jurisdictions to establish an estimate)
Estimate proportion of likely MURB retrofits in Lower Mainland over time (i.e. annual uptake)
Estimate the number of years each retrofit program would be in place
BC Stats Statistics Canada Census
Data NRCan – stats from Office of
Energy Efficiency or CanmetENERGY group
Need to identify other relevant energy efficiency programs for MURBs to establish proxies (archetypes). If none exist locally, look at data from Ontario or Portland / Seattle
BC Hydro Conservation Potential Review
CMHC research paper ‘Analysis of the Annual Energy and Water Consumption of Apartment Buildings in the CMHC HiSTAR Database’
MK Jaccard and Associates Metro Vancouver paper for estimated improvement in energy efficiency
Policy and financial tools: The use of public endowed funds and public loan guarantees, and OCP policies and targets supporting existing building retrofit and administrative/financial policies.
CEEI Secondary indicator(s): Number of MURB dwellings on a renewable energy district heating system. Suggested indicator(s): Number of approved applications for funding or loan guarantees.
Generalized algorithm for GHG emissions reduction: OC = (GHG emissions from MURBs in LM) * (average % improvement from retrofits * annual estimated uptake % in LM) * (program duration in number of years) OC = Outcome (GHG % reductions from BAU due to MURB retrofits) NOTE: Completing the data requirement points listed above will also benefit the ‘New Buildings’ modelling section.

FINAL REPORT
73
New Buildings: Better Enforcement of BC Building Code & Model Solar and District Energy Ready Bylaws 3. Better Enforcement of the BC Building Code
Improve enforcement of the BC Building Code by ensuring that existing energy related standards within
the building code are achieved.
Challenge Data Requirements / Metrics Likely Data Sources
3 BC Building Code EnerGuide standard is not being implemented due to lack of expertise. What if all new residential buildings actually met EnerGuide 70? What if the BC Building Code required EnerGuide 80? What would be the GHG impact on new buildings through a __% improvement in both training and capacity of local government building permit officers, builders and developers?
Create a Business as Usual (BAU) forecast of emissions from new buildings (by type) based upon current construction code requirements. Denote the mix of natural gas versus electric heating for single‐detached homes, MURBs and commercial buildings.
Estimate percentage (%) of potential training ‘reach’ into various building regulatory professions in Lower Mainland
Estimate the number of years each training program would be in place
Estimate the required increase in number of trained building code / permitting officials in Lower Mainland (i.e. capacity improvements)
Statistics Canada Census Data, to estimate projected population growth, which is proportional to the number of new residential units, for business‐as‐usual (BAU)
Future changes to BC Building Code, to define Business as Usual (BAU)
NRCan – Check if OEE has stats on effectiveness of training programs for various professions (permit officials, building inspectors, planners, architects, builders /developers). Do figures exist on the effectiveness of MNECB and R2000 training programs?
BC Hydro – See if Hydro has stats on effectiveness of PowerSmart training for regulatory officials, as well as effectiveness of Energy Manager program
CaGBC / LightHouse – May have stats on LEED training effectiveness in BC (note: LightHouse and CaGBC have a number of ongoing training programs for a variety of audiences)
The Building Officials Association of BC provides training for building officials and is a possible future source of energy efficiency training programs.

FINAL REPORT
74
Policy and financial tools: Public endowed funds to either: (a) self finance local government building inspections to ensure that Building Code targets are achieved; or (b) to provide grants to non‐profit organizations to provide third party inspections, supported by OCP and administrative policies recognizing the importance of providing appropriate resources.
CEEI Secondary indicator(s): Number of confirmed new energy efficient residential units.
Generalized algorithm for GHG emissions reduction: OC = (Number of new buildings * average GHG emissions per building) * (annual % improvement in training * annual % capacity increase) * (program duration in years) OC = Outcome (GHG reductions for new buildings because of better enforcement of the Code )

FINAL REPORT
75
4. Model Solar and District Energy Ready Bylaws
Working with the Province of BC, develop model bylaws requiring solar ready and district energy ready
homes.
Challenge Data Requirements / Metrics Likely Data Sources
4 What ‘model bylaws’ and accompanying regulatory language would encourage solar‐ready and district energy‐ready new buildings? What is the appropriate wording for development agreements (i.e. compatible with the authority implied through the Local Government Act and Community Charter)?
Create a Business as Usual (BAU) forecast of emissions from new buildings (by type) based upon current BC Building Code requirements. Denote the mix of natural gas versus electric heating for single‐detached homes, MURBs and commercial buildings.
Estimate % of new single‐detached homes, MURBs and commercial buildings that would comply with new bylaws and development agreements (i.e. the proportion of new development that would be affected).
Create a BAU estimate of the % of new development that is already DES‐ready in Lower Mainland.
Estimate percentage of GHG emission reductions based on the above assumptions.
Statistics Canada Census Data, to estimate projected population growth, which is proportional to number of new residential units, for business‐as‐usual (BAU)
Future changes to BC Building Code, to define BAU
MCRD – Obtain supporting amendment to be made to the Local Government Act and/or Community Charter allowing local governments to create a ‘solar‐ready bylaw’.
MEMPR – Check status and timing of Province of BC’s Super Efficient New Construction Program
SolarBC– Derive baseline figure on current take‐up of SolarBC residential retrofit program in BC
BC Hydro / Terasen – See if utility companies have estimates of District Energy‐ready new development in Lower Mainland (i.e. buildings of suitable density near existing or planned district energy locations that would connect)
Policy and financial tools: Development of solar‐ready and district energy‐ready bylaws (assuming Provincial framework allowing local governments to require these) and local service area (or hydronic heat energy services) bylaws requiring connection, and OCP policies supporting the use and development of renewable energy and district energy.
CEEI Secondary indicator(s): Number of dwellings on a renewable energy district heating system. Suggested indicator(s): Number of local governments who have opted to require either solar or district energy readiness by creating bylaws.

FINAL REPORT
76
Generalized algorithm for GHG emissions reduction – Solar Ready Bylaw: OC = (Average GHG emissions per building) * (annual No. of new buildings already affected by SolarBC programs – annual No. of non‐participating that would become solar ready because of bylaw) * (program duration in years)
Generalized algorithm for GHG emissions reduction – District Energy Ready Bylaw: OC = (Total GHG emissions from heating and cooling of new buildings in LM) * (1 ‐ % of new buildings in LM already DES‐ready) * (% of DES‐ready connecting ‐ % of non‐ready that would connect)
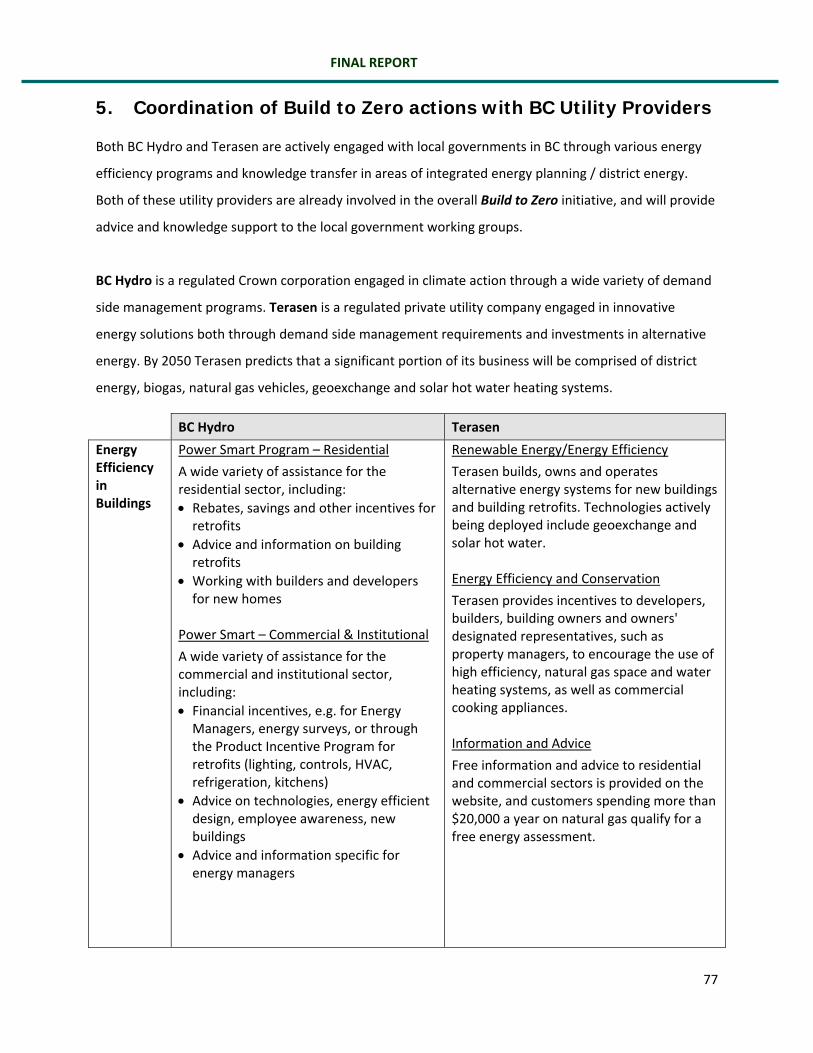
FINAL REPORT
77
5. Coordination of Build to Zero actions with BC Utility Providers
Both BC Hydro and Terasen are actively engaged with local governments in BC through various energy
efficiency programs and knowledge transfer in areas of integrated energy planning / district energy.
Both of these utility providers are already involved in the overall Build to Zero initiative, and will provide
advice and knowledge support to the local government working groups.
BC Hydro is a regulated Crown corporation engaged in climate action through a wide variety of demand
side management programs. Terasen is a regulated private utility company engaged in innovative
energy solutions both through demand side management requirements and investments in alternative
energy. By 2050 Terasen predicts that a significant portion of its business will be comprised of district
energy, biogas, natural gas vehicles, geoexchange and solar hot water heating systems.
BC Hydro Terasen
Energy Efficiency in Buildings
Power Smart Program – Residential
A wide variety of assistance for the residential sector, including: • Rebates, savings and other incentives for retrofits
• Advice and information on building retrofits
• Working with builders and developers for new homes
Power Smart – Commercial & Institutional
A wide variety of assistance for the commercial and institutional sector, including: • Financial incentives, e.g. for Energy Managers, energy surveys, or through the Product Incentive Program for retrofits (lighting, controls, HVAC, refrigeration, kitchens)
• Advice on technologies, energy efficient design, employee awareness, new buildings
• Advice and information specific for energy managers
Renewable Energy/Energy Efficiency
Terasen builds, owns and operates alternative energy systems for new buildings and building retrofits. Technologies actively being deployed include geoexchange and solar hot water. Energy Efficiency and Conservation
Terasen provides incentives to developers, builders, building owners and owners' designated representatives, such as property managers, to encourage the use of high efficiency, natural gas space and water heating systems, as well as commercial cooking appliances. Information and Advice
Free information and advice to residential and commercial sectors is provided on the website, and customers spending more than $20,000 a year on natural gas qualify for a free energy assessment.
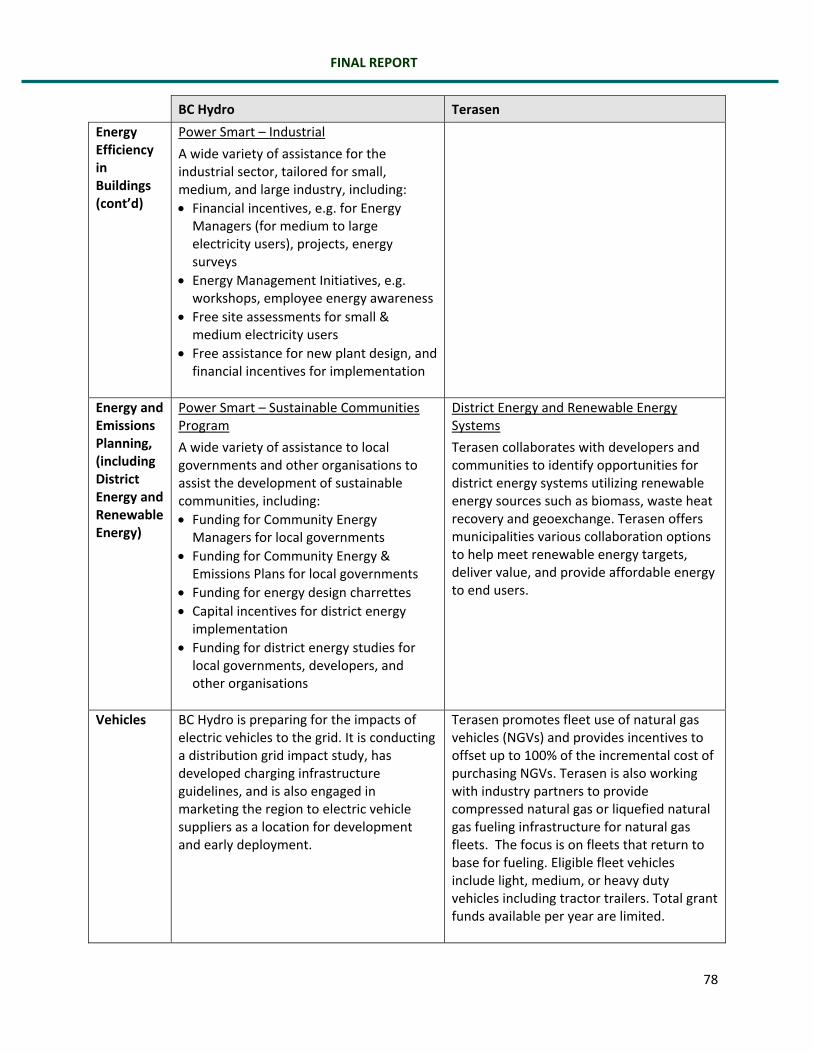
FINAL REPORT
78
BC Hydro Terasen
Energy Efficiency in Buildings (cont’d)
Power Smart – Industrial
A wide variety of assistance for the industrial sector, tailored for small, medium, and large industry, including: • Financial incentives, e.g. for Energy Managers (for medium to large electricity users), projects, energy surveys
• Energy Management Initiatives, e.g. workshops, employee energy awareness
• Free site assessments for small & medium electricity users
• Free assistance for new plant design, and financial incentives for implementation
Energy and Emissions Planning, (including District Energy and Renewable Energy)
Power Smart – Sustainable Communities Program
A wide variety of assistance to local governments and other organisations to assist the development of sustainable communities, including: • Funding for Community Energy Managers for local governments
• Funding for Community Energy & Emissions Plans for local governments
• Funding for energy design charrettes • Capital incentives for district energy implementation
• Funding for district energy studies for local governments, developers, and other organisations
District Energy and Renewable Energy Systems
Terasen collaborates with developers and communities to identify opportunities for district energy systems utilizing renewable energy sources such as biomass, waste heat recovery and geoexchange. Terasen offers municipalities various collaboration options to help meet renewable energy targets, deliver value, and provide affordable energy to end users.
Vehicles BC Hydro is preparing for the impacts of electric vehicles to the grid. It is conducting a distribution grid impact study, has developed charging infrastructure guidelines, and is also engaged in marketing the region to electric vehicle suppliers as a location for development and early deployment.
Terasen promotes fleet use of natural gas vehicles (NGVs) and provides incentives to offset up to 100% of the incremental cost of purchasing NGVs. Terasen is also working with industry partners to provide compressed natural gas or liquefied natural gas fueling infrastructure for natural gas fleets. The focus is on fleets that return to base for fueling. Eligible fleet vehicles include light, medium, or heavy duty vehicles including tractor trailers. Total grant funds available per year are limited.

FINAL REPORT
79
BC Hydro Terasen
Other BC Hydro also supports programs and organisations that help promote energy efficient communities such as Community Action on Energy and Emissions, Smart Planning for Communities, QUEST BC (Quality Urban Energy Systems for Tomorrow), and the Community Energy Association.
Terasen also supports programs and organisations that help promote energy efficient communities such as QUEST BC (Quality Urban Energy Systems for Tomorrow), and the Community Energy Association.

FINAL REPORT
80
Sources Bell, Patricia, Dale Littlejohn, and Laura Porcher: BC Initiatives: Meeting Community GHG Reduction Targets in Buildings, Municipal World, August 2009
Fraser Basin Council and Community Energy Association: Energy Efficiency & Buildings: A Resource for BC’s Local Governments, Fraser Basin Council, 2009

FINAL REPORT
81
Appendix A: Canadian Institute of Planners Climate Change Policies
CIP ENDORSES THE FOLLOWING ACTIONS TO ENSURE PLANNERS CONTRIBUTE TO MITIGATING AND ADAPTING TO CLIMATE CHANGE: 1. CIP will champion action on climate change policy nationally and internationally.
2. CIP will facilitate the exchange of information between the scientific community and professional
planners to make sure our members have access to the best available information on climate
change, in language that is easily understood.
3. CIP will empower its members to consider climate change in their actions and recommendations
within the broad ambit of planning activities (including for example, long‐range plan preparation,
development approval, planning for energy, infrastructure and transportation, resource
management ) in order to:
a. minimize risks associated with extreme events and with the cumulative effects of climate change;
b. protect natural resources and habitats; c. ensure no adverse public health effects; d. build resilience into communities; and e. take advantage of mitigation and adaptation techniques, whenever possible.
4. Given that mitigation efforts alone cannot avoid further impacts of climate change, CIP will increase
the knowledge and skills amongst its members to develop suitable adaptation strategies to enable
communities to manage the effects of climate change and minimize adverse impacts.
5. In keeping with policies 3 and 4 above, CIP will support its members by:
a. commissioning applied research that addresses climate change challenges from a planning perspective;
b. supporting demonstration projects in climate change mitigation and adaptation strategies and methods;
c. developing and disseminating best‐practice recommendations for climate change mitigation and adaptation planning; and
d. designing climate change educational resources for use in continuous professional learning (CPL) and academic programs.
6. CIP will work collaboratively with universities and other post‐secondary institutions to ensure
climate change is integrated into the curriculum for planners.
7. CIP will continue to work with Natural Resources Canada and Environment Canada for the
development and consolidation of reliable data, adaptation tools and mitigation techniques that are
usable at the regional and local level.
8. CIP will issue a Report Card to monitor how well this policy is being implemented

FINAL REPORT
82
Appendix B: Language for Solar Ready Bylaw
1. Province of BC’s Proposed Solar Hot Water Ready Requirement Options for Single Family Homes In response to interest from a number of local governments in BC, the Province is proposing an optional
requirement that would enable local governments to mandate that all new single family dwellings
within their communities be solar hot water ready. The proposed requirement would only apply in local
government jurisdictions that voluntarily adopt it. The proposed Solar Hot Water Ready requirement for
single family homes would apply in jurisdictions where required by local government bylaw. Creating a
Solar Hot Water Ready requirement that local governments can choose to adopt will provide consistent
provisions across BC. The proposed Solar Hot Water Ready requirement for single family homes would
apply in the following areas:
• Required roof space for solar collector
• Mandatory roof loading requirement
• Conduit specifications Possible Language ‐ Areas Designated for Future Installation of Solar Collectors
1) An area designated for installation of solar collectors for a Solar Domestic Hot Water System shall
allow for the installation of a solar collector that
a. has unobstructed access to sunlight when construction of the building is commenced, and
b. has an area of not less than 2.7m by 2.7m
2) Structural members of areas designated for installation of solar collectors for a Solar Domestic Hot
Water System shall be designed to accommodate the anticipated load or a minimum additional load of
0.2 kpa in addition to design loads required by the British Columbia Building Code.
Possible Language ‐ Conduit Requirements
1) One or more straight, continuous, conduits shall be provided that extend from the area directly
adjacent to each dwelling unit’s primary service water heater to
a. an accessible attic space adjacent to the roof area designated for installation of solar collectors
for a Solar Domestic Hot Water System,
b. the roof space designated for installation of solar collectors for a Solar Domestic Hot Water
System, or

FINAL REPORT
83
c. the exterior wall surface directly adjacent to the area designated for installation of solar
collectors for a Solar Domestic Hot Water System.
2) The conduit(s) described in Sentence 5.2.(1) shall
a. be accessible at both ends,
b. be capped or sealed at both ends to prevent water ingress and air leakage,
c. be identified by markings that are permanent, distinct and easily recognized,
d. have a minimum inside diameter of 50mm if two conduit runs are provided, or 100mm if only
one conduit run is provided, and
e. be able to accommodate the installation of insulated plumbing services for a Solar Domestic Hot
Water System in conformance with CAN/CSA‐F383‐87.
For more information visit BC’s Housing and Construction Standards website at:
http://www.housing.gov.bc.ca/building/consultation/shwr/index.htm
2. Vancouver’s Green Homes Program – Requirement for Pre‐piping for Roof‐mounted Solar Energy
Generation Vancouver’s Green Homes Program requires that every new house be equipped with two 50 mm (2
inch) pipes that run from the home’s service room (where the water tank is) to the attic. This will allow
for the future installation of roof‐mounted solar energy generating equipment without needing to tear
open walls and ceilings. In addition, these pipes are suitable for use with either solar hot water or solar
photovoltaic energy systems, giving the future homeowner the greatest amount of flexibility.
By‐law No. 9691 – Green Building for one family homes, one family homes with secondary suites and two family homes Pre‐piping for roof mounted solar energy generation 12.2.2.9. Vertical Service Shaft 1) A solar ready pipe run, consisting of at least two 50 mm pipes, capped at both ends and having at least a 20° angle measured above the horizontal level, shall extend from a location in close proximity to the service water heater to the attic space.
http://vancouver.ca/commsvcs/CBOFFICIAL/greenbuildings/greenhomes/

FINAL REPORT
84
Other Sources of Information: The Canadian Solar Industries Association
CanSIA has prepared guidelines for homeowners, renovators, architects, designers and builders that
outlines how homes can be made solar‐ready either during construction or major renovations. The
Solar Ready Technical Guidelines, found at the link below, outline requirements for roof orientation,
utility room size and other parameters, and piping.
http://www.cansia.ca/government‐regulatory‐issues/provincial/solar‐ready
Natural Resources Canada’s Solar Ready Homes Guidance
This guideline defines the term “solar ready” and discusses various factors associated with installation,
including costs. Oriented towards consumers, the guideline is applicable to both solar domestic hot
water systems and photovoltaic systems for new homes.
http://oee.nrcan.gc.ca/residential/personal/new‐homes/solar‐homeowner.cfm?attr=4

FINAL REPORT
85
Appendix C: CEEI Secondary Indicators Related to Buildings
Source: The Sheltair Group, Community Energy & Emissions Inventory (CEEI) Secondary Indicators for Community Inventory Interpretation, June 2008 http://www.env.gov.bc.ca/epd/climate/pdfs/ceei‐second‐indicators.pdf