build ed beattie - the national business review annual... · mdu communal ‘backbone riser ......
TRANSCRIPT

/ PAGE 24
Build – Ed Beattie

/ PAGE 25
Unprecedented scale and scope
>Chorus deploying fibre in 24 areas along ~44,000 streets
>each rollout area has varying:
▪ existing infrastructure available for re-use
▪ geotypes (premises density and terrain)
▪ local authority requirements
>chart shows scale of Chorus ramp-up in initial years
Source: Crown Fibre Holdings, Ultra Fast Broadband update, 17 April 2012

/ PAGE 26
Auckland and Wellington >60% of Chorus rollout
> Highest population density and number of narrow or busy ‘Level 2’ roads
> Already significant pressure on infrastructure
> Underground utilities close together
> Volcanic rock
> CBD and inner suburbs require mostly underground deployment
> Inner city has very high population density
> Cobbled paving in CBD areas
> Narrow roads and complex traffic management
> Hilly with access challenges

/ PAGE 27
UFB rollout now at maximum pace
>Flatter programme in FY14 as productivity increases, but still tail-end ‘hump’
▪ Target (cumulative): 255,000 premises to be passed by end of FY14
▪ Build complete for 238,000 premises at 30 April = 93% target (cumulative)
▪ Work already started on FY15 areas for 8% of premises
May
2013
July
2014
PremisesFY14 rollout phasing
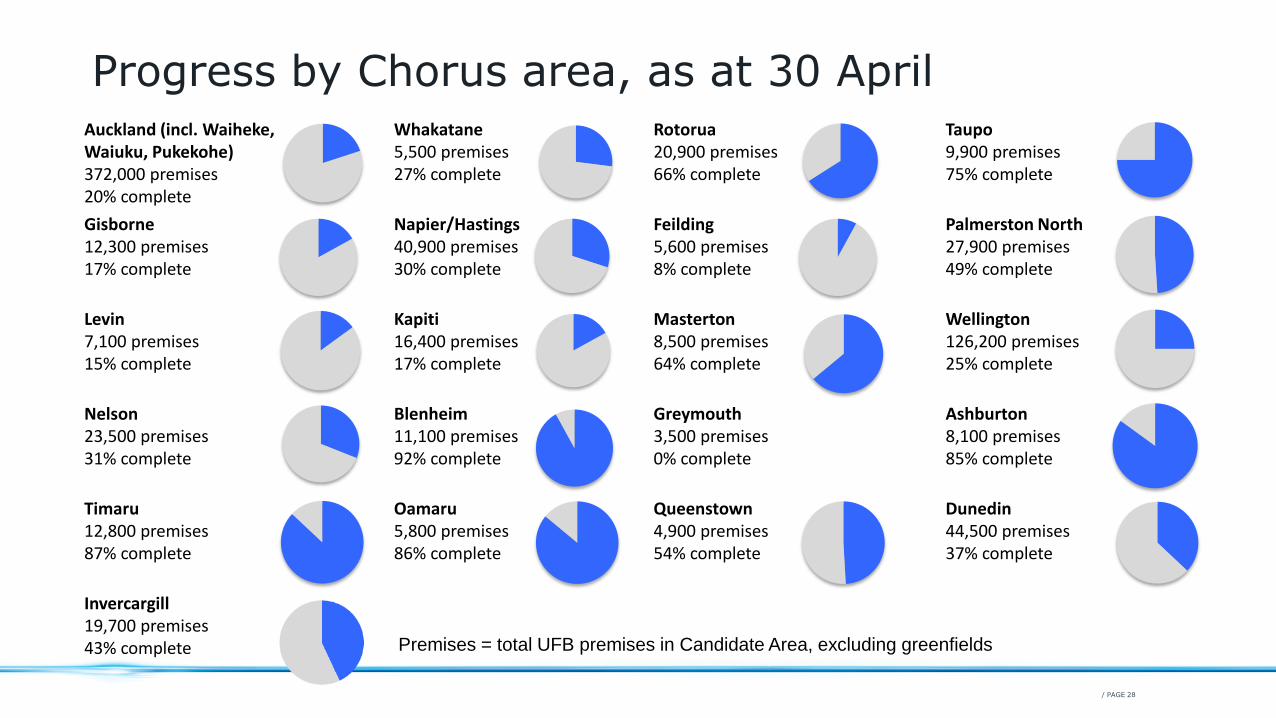
/ PAGE 28
Auckland (incl. Waiheke, Waiuku, Pukekohe)372,000 premises20% complete
Whakatane5,500 premises27% complete
Rotorua20,900 premises66% complete
Taupo9,900 premises75% complete
Gisborne12,300 premises17% complete
Napier/Hastings40,900 premises30% complete
Feilding5,600 premises8% complete
Palmerston North27,900 premises49% complete
Levin7,100 premises15% complete
Kapiti16,400 premises17% complete
Masterton8,500 premises64% complete
Wellington126,200 premises25% complete
Nelson23,500 premises31% complete
Blenheim11,100 premises92% complete
Greymouth3,500 premises0% complete
Ashburton8,100 premises85% complete
Timaru12,800 premises87% complete
Oamaru5,800 premises86% complete
Queenstown4,900 premises 54% complete
Dunedin44,500 premises37% complete
Invercargill19,700 premises43% complete
Progress by Chorus area, as at 30 April
Premises = total UFB premises in Candidate Area, excluding greenfields

/ PAGE 29
Understanding UFB communal capex
> Civil costs
▪ drilling/trenching/aerial along street
▪ laterals to boundary
▪ reinstatement of road/footpath/berm
▪ traffic management
▪ arborists
>Network specific costs
▪ materials
▪ hauling
▪ installing network components
▪ splicing and jointing
▪ testing
>Other
▪ project management
▪ consigned materials (e.g. fibre, duct)

/ PAGE 30
Step down in CPPP from FY15
CPPP expected to decrease from FY14 as deployment mix begins to move from priority premises zones into suburban areas
▪ average property frontage reduces from 30m to 20m
▪ deployment options such as aerial and rapid trenching more widely available
▪ cobbled paving areas and traffic management requirements diminish
Average
CPPP ($)

/ PAGE 31
Chorus’ communal deployment ‘toolbox’
Is existing duct available for fibre to be installed in along street?
Re-use Chorus duct where possible (40% target)OR consider third party duct, subject to conditions
Consider underground options
Consider aerial options
1. Rapid trenching2. Drilling3. Open trenching
1. Commercial access to poles?2. RMA/council consent?
YES
NO
Each option requires cost/benefit analysis of:• time required and
contract deadline• fit with existing and
required network• local body restrictions
or requirements (e.g. consents and reinstatement)
• capex vs future opex

/ PAGE 32
Options for installing underground duct
Rapid Trenching: mechanical saw enables narrow, shallow trenching
Directional drilling: enables new ducts and cables to be installed underground with just a series of ‘potholes’ along streets
Open trenching: can be most disruptive (and costly) method as requires excavation of a trench along street for ducting
/ PAGE 33
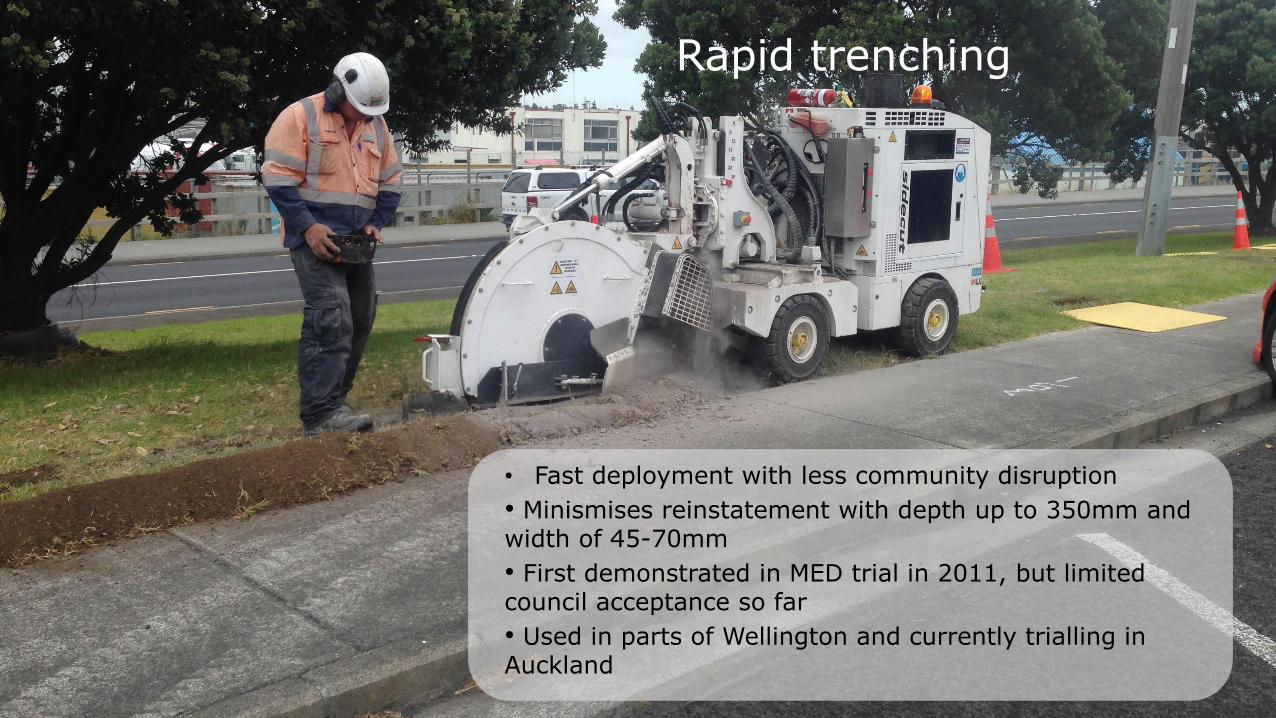
Rapid trenching
• Fast deployment with less community disruption
• Minismises reinstatement with depth up to 350mm and width of 45-70mm
• First demonstrated in MED trial in 2011, but limited council acceptance so far
• Used in parts of Wellington and currently trialling in Auckland

/ PAGE 34
Aerial deployment
Chorus target ~20% aerial communal deployment:• depends on availability and quality of pole network
• lines companies requiring new commercial agreements
• subject to council consent in some areas• potential opex trade-off over longer term

/ PAGE 35
Deployment flexibility: CFH agreement
>Chorus now has ability to determine phasing of rollout and reschedule costly areas
includes deferral of build in existing business fibre zones
savings will be subject to cheaper deployment options being found and cost to build out existing business fibre in interim
Example: Existing business fibre footprint in Courtenay Place may enable deferral of UFB build.
/ PAGE 36
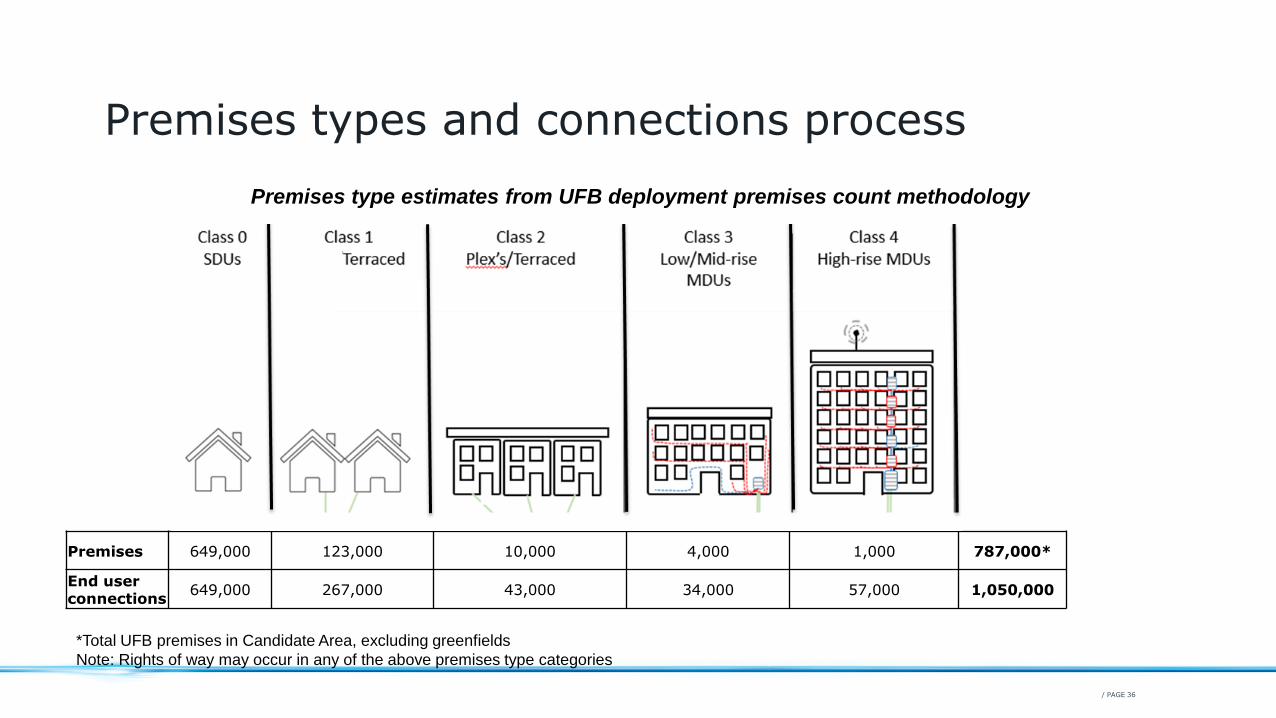
Premises types and connections process
Premises type estimates from UFB deployment premises count methodology
Premises 649,000 123,000 10,000 4,000 1,000 787,000*
End user connections
649,000 267,000 43,000 34,000 57,000 1,050,000
*Total UFB premises in Candidate Area, excluding greenfields
Note: Rights of way may occur in any of the above premises type categories

/ PAGE 37
Multi-Dwelling Units (MDUs)
SDU CPPC
Street to building entry point (outside boundary) cost
MDU communal(‘backbone riser’) cost
>premises containing more than one occupancy within the boundary
>may include apartment or office blocks
>some already fibre connected
>connection funding varies depending on height of building and number of tenancies
>general principle that Chorus funds up to $1,000 per end user from the entry point to the apartment

/ PAGE 38
Rights of way
> more than one premises with separate ownership sharing a common access to the public roads
> may include detached or semi-detached dwellings, apartment blocks, townhouses that share a common access
> general principle that end users receive ‘free’ 15m connection from Chorus

/ PAGE 39
Rights of way Single dwelling units Simple Multi-dwelling units (up to 3 stories)
Complex Multi-dwelling units (>3 stories)
Chorus funded
Note: funding policy will change at end of UFB build contract in 2020
Residential/business standard lead-in from street to building entry point at time of connection:1. New underground – up to 15m2. Existing conduit or open trench – up to 100m3. Aerial – 1 span4. In-home wiring to the ONT* *Internal cabling limited to 5m once NSI fund ends.
Entry point to Apartment (‘backbone riser’): Chorus funds up to $1k per residential/business tenancy
Non-standard install FundNote: capped at $28m funding from Chorus
Residential non-standard RoWinstallation:1.New underground 15m to 200m2.Existing Conduit open trench >100m to 200m3.Aerial > 1 span
Residential non-standard installation: NSI fund available for:1.New underground 15m to 200m2.Existing conduit or open trench up to 200m3.Aerial >1 span
Entry point to residential apartment (‘backbone riser’): NSI fund for >$1k cost
Other funding required
Residential >200m charged via RSP Building owner to pay for lead-in and backbone riser costs if exceeds Chorus fundingBusiness non-standard RoW
installation: charged via RSP1. New underground >15m2. Existing conduit or open trench >200m3. Aerial > 1 span
Business non-standard install lead-in: charged via RSP
Simple business install: charged via RSP (or building owner) to fund lead-in and backbone riser costs if exceeds Chorus funding.
UFB installation types and funding
Note: Installation is different from connection, which may be charged for business plans.

/ PAGE 40
Reducing cost to connect
> Completed ~2,200 NGA installs in March; 100 more than February
▪ no two properties the same
▪ scope of work greater than in past
▪ meeting SLAs
> Data from installs to date has provided basis to begin implementing coded rates with service companies; most apply from early FY15
> Emphasis on reducing civil costs between boundary and ETP
▪ reviewing technology options and work methods

/ PAGE 41
>Agree + Build + Connect process
full implementation end May
splits expertise into 3-step process
reduced rescheduling by better matching resources and equipment to on-site conditions
end user time on-site halved to ~4 hours
continuing to work with RSPs to enhance information/equipment coordination and end user experience
Connections process
Build
External work from boundary to premises completed without presence of end user.
Connect
Internal premises work completed with end user present to ensure service working.
Agree
Meet with end user to agree an install plan.

/ PAGE 42
Market insights – Rosalie Nelson

/ PAGE 43
Social benefits of ultra-fast broadbandTelecommunications globally is transforming
Trends in New Zealand
Exponential device growth – slow on home management
• Average # of smart devices in NZ homes increased from 2.9 to 5.2 in 3 years• Smartphones have grown from 13% penetration in 2011 to 68% in 2014• Tablets have grown from 4% penetration in 2011 to 39% in 2013
New Zealand small business yet to capture productivity and revenue gains
• Business fibre uptake has grown from 9% to 15% between 2010 and 2012• 41% of SME’s have a website; 18% use cloud services • $33 billion in identified economic benefits
IDC NZ Consumerscape Survey 2014
NZ Statistics ‘Business use of ICT 2012’; MYOB Trans-Tasman report 2014: Bell Labs UFB study,
Multiple devices and high definition video are driving bandwidth growth
• NZ video traffic grew 40% in 2 years: consumer video comprises 61% of traffic The average household generated 23GB per month in 2013, up from 10GB in June 2011
• 21% of consumer’s recent TV purchase was a ‘Smart TV’ - (Australia 18%)
Cisco VNI forecast; NZ Statistics ISP survey, IDC NZ Consumerscape Survey 2014
Early stages: cities are developing ‘digital strategies’
• Initial focus is intelligent transport platforms and enabled bus shelters• Auckland developing innovation clusters – ‘Techapuna’ and Wynard Quarter• Regional Gigatown contestants developing digital strategies
Connected Home • Multiple devices per user, per
household
• Remote home management
• Personal cloud and storage
Business data demands• Cloud services & M2M monitoring
• Teleworking and home working
• Data analytics
Ultra high-definition video• TV on demand
• Video communications
• Gaming and e-learning
• Security and surveillance
Smart Cities• Utility asset management
• Intelligent public transport
• CCTV cameras and public safety
• Education and health services
Internet of ‘things’
/ PAGE 44
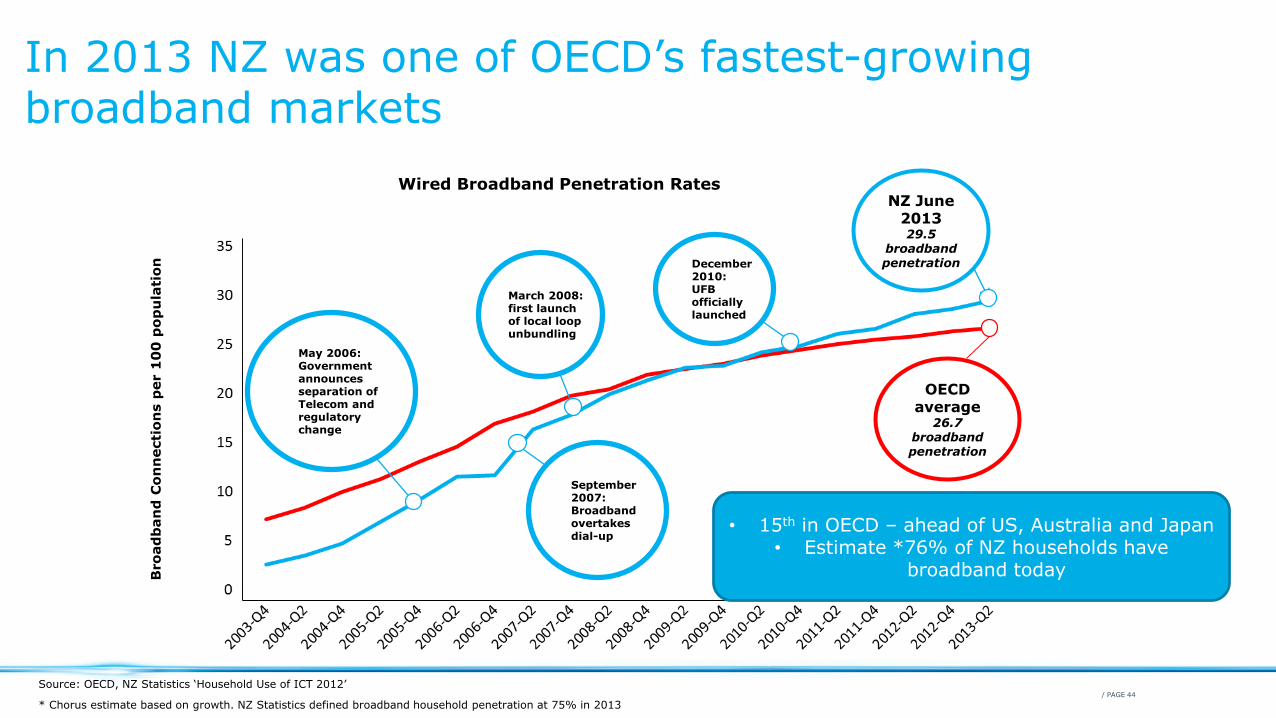
In 2013 NZ was one of OECD’s fastest-growing broadband markets
Wired Broadband Penetration Rates
Bro
ad
ban
d C
on
necti
on
s p
er 1
00
po
pu
lati
on
Source: OECD, NZ Statistics ‘Household Use of ICT 2012’
NZ June 201329.5
broadband penetration
May 2006:Governmentannouncesseparation ofTelecom andregulatory change
March 2008:first launchof local loopunbundling
December2010:UFBofficially launched
September2007:Broadbandovertakesdial-up
OECD average
26.7 broadband penetration
• 15th in OECD – ahead of US, Australia and Japan• Estimate *76% of NZ households have
broadband today
* Chorus estimate based on growth. NZ Statistics defined broadband household penetration at 75% in 2013

/ PAGE 45
0.0%0.1%0.1%0.5%0.8%1.0%1.6%1.7%1.8%2.0%2.0%2.2%2.8%3.4%3.9%4.7%5.2%
6.7%6.8%7.2%7.7%
10.7%14.9%15.8%16.7%
17.8%18.3%19.0%
21.0%23.8%
31.0%32.7%
35.8%62.8%
68.4%
IsraelBelgiumGreeceIreland
GermanyNew Zealand
AustriaFrance
ChileAustralia
CanadaItaly
FinlandPoland
SpainMexico
LuxembourgSwitzerland
NetherlandsUnited Kingdom
United StatesTurkey
HungaryOECD
PortugalCzech Republic
DenmarkSlovenia
IcelandNorway
Slovak RepublicEstonia
SwedenKoreaJapan
Percentage of fibre connections in total broadband subscriptions, June 2013
Fibre penetration showing good growth from low base
-50
0
50
100
150
200
250
300
Me
xic
o
Lu
xe
mbo
urg
Un
ite
d K
ing
dom
Ch
ile
Ne
w Z
eala
nd
Austr
alia
Austr
ia
Spain
Turk
ey
Sw
itzerl
and
Fra
nce
Ne
therl
and
s
Fin
land
Port
ug
al
Germ
any
Czech R
epu
blic
Ca
nad
a
Pola
nd
No
rwa
y
De
nm
ark
Sw
ede
n
OE
CD
Hu
nga
ry
Slo
ven
ia
Icela
nd
Un
ite
d S
tate
s
Esto
nia
Kore
a
Slo
vak R
epub
lic
Japa
n
Ita
ly
Irela
nd
Belg
ium
Gre
ece
Annual growth of fibre connections, June 2012-2013
%
Developed markets with longstanding fibre programmes (~8 – 10 years)
Source: OECD, June 2013

/ PAGE 46
Target of 75% coverage will put NZ into leadership quadrant
100% -
95% -
90% -
85% -
80% -
75% -
70% -
65% -
60%
Sta
nd
ard
Fix
ed
Bro
ad
ban
d
-10% 10% 30% 50% 70% 90% 110%
Fibre to the home/Building Coverage
Source: Point Topic, iDate, Chorus, OECD
- - - - - - -
Poland
Slovakia
Slovenia
MalaysiaLatvia
Hungary
US
Europe
SpainGermany
Australia
UK FranceNetherlands
Denmark Sweden
Portugal
PortugalTarget
South KoreaSingapore
Japan target
Japan HongKong
NZ today NZ 2020
Estonia
A goal of 100% fibre coverage is only realistic in high-density Asian markets
However by 2020 New Zealand will be among the global leaders for FTTH coverage
Australia

/ PAGE 47
Industry in transition > Industry grappling with price/value propositions
Cost management remains a focus
> But also see innovation activity
‘ShowMeTV’, cloud gaming, integrated WiFi, multicast TV
> Merger and aggregation activity for growth/scale
Strong trend amongst smaller RSPs
> Chorus has ~100 customers – many niche providers
New customers focussing on sector or region
> Some local providers are expanding for scale
SNAP (Christchurch based) expanding from Christchurch to other markets
NOW (Hawkes Bay) expanding into lower North Island
> Activity from new types of provider
Trustpower expanding nationally with voice, broadband, power, gas offer
MyRepublic – Singapore-based fibre-only entrant focussed on cost
leadership
Fixed Voice -9%
Broadband +0.1%
Fixed Data -2%
Mobile Voice -1%
Mobile data +3%
Total revenues forecast to fall 3% per year from $4.5b to $3.9b by (2013-2018)
IDC New Zealand Telecommunications
Forecasts March 2014
*Dial up features only to 2013 (marked in red)
/ PAGE 48
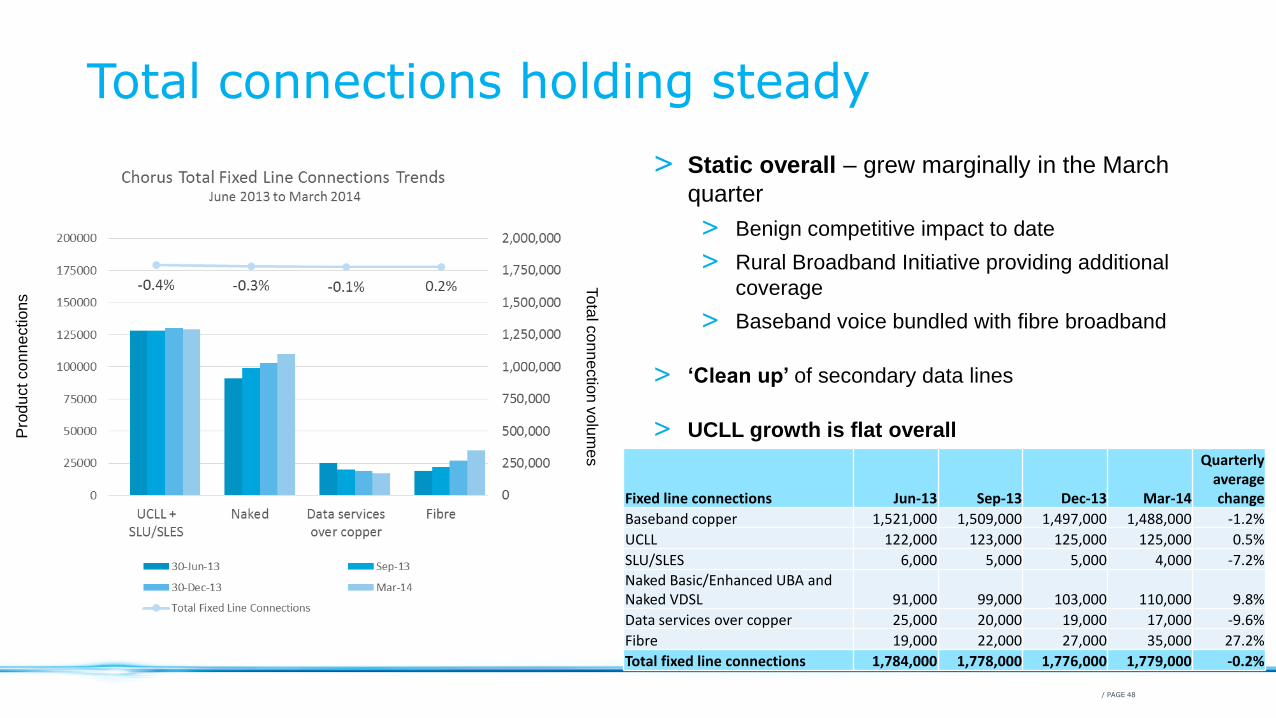
Total connections holding steady
Pro
du
ct co
nn
ections
To
tal c
on
ne
ctio
n v
olu
me
s
> Static overall – grew marginally in the March
quarter
> Benign competitive impact to date
> Rural Broadband Initiative providing additional
coverage
> Baseband voice bundled with fibre broadband
> ‘Clean up’ of secondary data lines
> UCLL growth is flat overall
Fixed line connections Jun-13 Sep-13 Dec-13 Mar-14
Quarterly average change
Baseband copper 1,521,000 1,509,000 1,497,000 1,488,000 -1.2%
UCLL 122,000 123,000 125,000 125,000 0.5%
SLU/SLES 6,000 5,000 5,000 4,000 -7.2%
Naked Basic/Enhanced UBA and Naked VDSL 91,000 99,000 103,000 110,000 9.8%
Data services over copper 25,000 20,000 19,000 17,000 -9.6%
Fibre 19,000 22,000 27,000 35,000 27.2%
Total fixed line connections 1,784,000 1,778,000 1,776,000 1,779,000 -0.2%

/ PAGE 49
Broadband growth continues
> Seasonal factors affected December broadband connections – but growth resumed in March
> Basic UBA migration to Enhanced-UBA continues
> Seeing a stronger shift from mass market UBA products to high-speed VDSL and fibre
> VDSL growing from a low base: 13k adds in last quarter
> *Fibre broadband: 7k adds
-10000
-5000
0
5000
10000
15000
20000
25000
Total fixed line additions Total broadband additions
Total fixed & Broadband ConnectionsQuarterly Net Additions
Jun-13 Sep-13 Dec-13 Mar-14
Qu
art
erly c
on
nectio
ns
-15000
-10000
-5000
0
5000
10000
15000
20000
UBA (Basic and Enhanced) VDSL Fibre
Migration to higher speed capabilityQuarterly Net Additions
Jun-13 Sep-13 Dec-13 Mar-14
Qu
art
erly c
on
nectio
ns
* Fibre broadband excludes P2P fibre and business data circuits
Broadband Connections Jun-13 Sep-13 Dec-13 Mar-14
Quarterly average change
Basic UBA 331,000 268,000 246,000 211,000 -13.9%
Naked Basic UBA 11,000 11,000 11,000 8,000 -10.1%
Enhanced UBA 680,000 737,000 747,000 767,000 4.1%
Naked Enhanced UBA 78,000 84,000 87,000 93,000 6.0%
VDSL 2,000 9,000 20,000 33,000 154.6%
Naked VDSL 2,000 4,000 5,000 9,000 65.1%
Fibre GPON (Bitstream 2 & 3, fibre subdivisions) 8,000 11,000 16,000 23,000 42.2%
Total Broadband Connections 1,112,000 1,124,000 1,132,000 1,144,000 1.0%

/ PAGE 50
Appetite for better broadband is increasing
> Data caps become unlimited
> In 2013, 79% of broadband lines offered more than 20GB
> RSP marketing focus is shifting to speed/capability
> We have good high speed coverage
> VDSL available for ~60% of Chorus copper lines
> By end of March, 228k premises had UFB build complete and 297k end users within reach.
> High speed services = 5% of Chorus broadband connections
> VDSL = 3%; *fibre 2%
> Bandwidth demand is growing exponentially
Cisco Visual Networking Forecasts NZ Total Monthly Traffic by Application
Cisco Visual Networking Forecasts NZ Total Monthly Traffic by Application
*Includes all Chorus fibre connections
** New Zealand Cisco VNI Forecast Data (http://www.ciscovni.com/forecast-widget/index.html)
Source: NZ Statistics ‘ISP Survey 2013’
/ PAGE 51
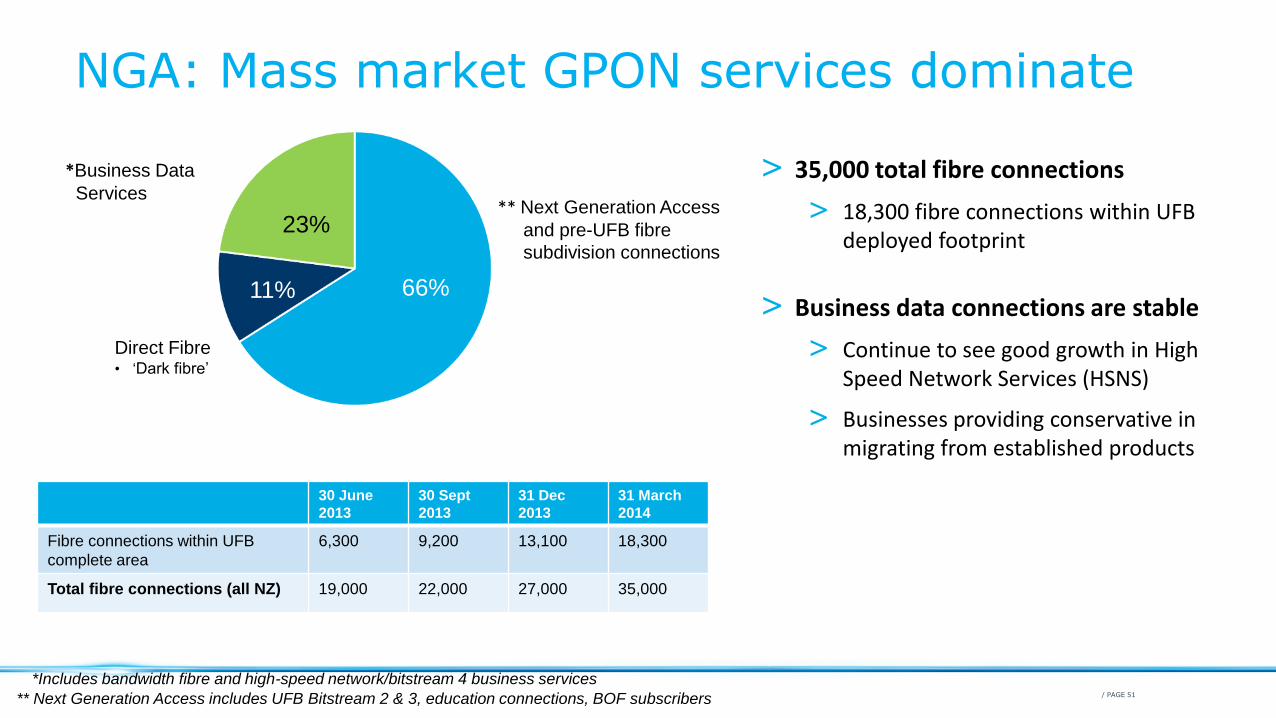
> 35,000 total fibre connections
> 18,300 fibre connections within UFB deployed footprint
> Business data connections are stable
> Continue to see good growth in High Speed Network Services (HSNS)
> Businesses providing conservative in migrating from established products
NGA: Mass market GPON services dominate
*Business Data
Services
Direct Fibre • ‘Dark fibre’
** Next Generation Access
and pre-UFB fibre
subdivision connections
*Includes bandwidth fibre and high-speed network/bitstream 4 business services
** Next Generation Access includes UFB Bitstream 2 & 3, education connections, BOF subscribers
23%
11% 66%
30 June
2013
30 Sept
2013
31 Dec
2013
31 March
2014
Fibre connections within UFB
complete area
6,300 9,200 13,100 18,300
Total fibre connections (all NZ) 19,000 22,000 27,000 35,000

/ PAGE 521: Includes Auckland North, Auckland South, Pukekohe, Waiuku & Waiheke Island.
* UFB Services
not yet
available for
order
Up
tak
e r
ela
tive
to
cap
ab
le
ad
dre
ss
es
% o
f b
uil
d c
om
ple
ted
Regional uptake reflects activity of local RSPs
> Local competition is still growing
> There are between 2 and 14 RSPs
able to deliver UFB in all areas
where deployment has started
> UFB uptake reflects local activity of
RSPs
> Auckland and Wellington are highly
competitive
> Palmerston North and Napier have
active local RSPs
> Also reflects regional demand
> Urban areas statistically have higher
broadband penetration
> Gigatown competition creating
growing awareness and local
demand potential

/ PAGE 53
Consumer fibre uptake is on low end plans
> Percentage of users adopting 100Mbps
plans is stabilising at ~23%
> RSP promotions are centred on 30Mbps
> Wholesale differential of $17.50
translates to a retail price difference of
~$30
> Significant price differential for consumers
> Forces a very binary decision
> New commercial fibre plans provide
incremental options and support higher
value uptake
80.4%
48.7%
36.9%
25.4% 23.4%
0%
10%
20%
30%
40%
50%
60%
70%
80%
90%
% of NGA fibre customers that are on 100Mbps+
$0.00$10.00$20.00$30.00$40.00$50.00$60.00$70.00$80.00$90.00
$100.00$110.00$120.00$130.00$140.00$150.00
Lowest Price Highest Price
Fibre retail pricing
30/10Mbps 100/50Mbps
$55 $55$37.50$37.50
$30
$26
$69
$95
$139
$109
Chorus wholesale
Retail Pricing

/ PAGE 54
NZ market aligning to international practices
Note: Tariffs collected from Singtel and Starhub. 1Gbps plans have been available since Q3 2010, however have been left off the chart to enable a view of the shift in entry level speeds
> In Q4 2013, a global review of 5,228 global broadband plans shows:
> 96% were sold on speed or inherent capability; only 17% had an associated data cap
> Consumers in Singapore have at least four different downstream bandwidth options
> Entry level speeds have increased from 6Mbps to 100Mbps but price relativities have been retained
> Singapore’s revenues have increased with connections growthSource: Point Topic, Ovum
Q3
2010
Q4
2010
Q1
2011
Q2
2011
Q3
2011
Q4
2011
Q1
2012
Q2
2012
Q3
2012
Q4
2012
Q1
2013
Q2
2013
6Mbps
100Mbps
0
50
100
150
200
250
300
350M
bp
s (D
ow
nlo
ad
)FTTx Bandwidth speeds available in
residential packages

/ PAGE 55
Implications> Underlying demand drivers are strong
End users want better broadband
RSPs have mixed incentives and will focus on margin gain in addition to new opportunities
Potential for higher ARPU through mixed commercial and regulatory portfolio
> Fibre represents a unique opportunity for RSPs to reinvent their portfolio
Move from price-based strategies to targeted, higher value propositions
New entrants are attracted to open access fibre – represents a new type of service opportunity
> However transition may lead to more consolidation and disruption
Copper pricing uncertainty will continue to shape RSP focus
Structural separation of the industry plus technology shifts is changing business models
Acquisition and consolidation is occurring as RSPs seek to reposition and gain scale
> New Zealand has yet to fully recognise the potential of a national fibre platform
Focus to date is on infrastructure and technology
Opportunity for industry and stakeholders to collectively engage on how to get better economic and social outcomes

/ PAGE 56
Any questions?