budget strategy and outlook
TRANSCRIPT

BUDGET STRATEGY AND OUTLOOK BUDGET PAPER NO. 1 2012-13
CIRCULATED BY
THE HONOURABLE WAYNE SWAN MP DEPUTY PRIME MINISTER AND TREASURER OF THE COMMONWEALTH OF AUSTRALIA
AND
SENATOR THE HONOURABLE PENNY WONG MINISTER FOR FINANCE AND DEREGULATION OF THE COMMONWEALTH OF AUSTRALIA
FOR THE INFORMATION OF HONOURABLE MEMBERS ON THE OCCASION OF THE BUDGET 2012-13
8 MAY 2012

© Commonwealth of Australia 2012
ISBN 978-0-642-74802-7
This publication is available for your use under a Creative Commons BY Attribution 3.0 Australia licence, with the exception of the Commonwealth Coat of Arms, third party content and where otherwise stated. The full licence terms are available from http://creativecommons.org/licenses/by/3.0/au/legalcode.
Use of Treasury material under a Creative Commons BY Attribution 3.0 Australia licence requires you to attribute the work (but not in any way that suggests that the Treasury endorses you or your use of the work).
Treasury material used 'as supplied'
Provided you have not modified or transformed Treasury material in any way including, for example, by changing the Treasury text; calculating percentage changes; graphing or charting data; or deriving new statistics from published Treasury statistics — then Treasury prefers the following attribution:
Source: The Treasury
Derivative material
If you have modified or transformed Treasury material, or derived new material from those of the Treasury in any way, then Treasury prefers the following attribution:
Based on Treasury data
Use of the Coat of Arms
The terms under which the Coat of Arms can be used are set out on the It’s an Honour website (see www.itsanhonour.gov.au)
Other Uses
Inquiries regarding this licence and any other use of this document are welcome at:
Manager Communications The Treasury Langton Crescent Parkes ACT 2600 Email: [email protected]
Internet
A copy of this document is available on the central Budget website at: www.budget.gov.au.
Printed by CanPrint Communications Pty Ltd

iii
Notes
(a) The following definitions are used in this Budget Paper:
– ‘real’ means adjusted for the effect of inflation;
– real growth in expenses and payments is calculated using the Consumer Price Index (CPI) as the deflator;
– the Budget year refers to 2012-13, while the forward years refer to 2013-14, 2014-15 and 2015-16; and
– one billion is equal to one thousand million.
(b) Figures in tables and generally in the text have been rounded. Discrepancies in tables between totals and sums of components are due to rounding:
– estimates under $100,000 are rounded to the nearest thousand;
– estimates $100,000 and over are generally rounded to the nearest tenth of a million;
– estimates midway between rounding points are rounded up; and
– the percentage changes in statistical tables are calculated using unrounded data.
(c) For the budget balance, a negative sign indicates a deficit while no sign indicates a surplus.
(d) The following notations are used:
- nil
na not applicable (unless otherwise specified)
$m millions of dollars
$b billions of dollars
nfp not for publication
(e) estimates (unless otherwise specified)
(p) projections (unless otherwise specified)
NEC/nec not elsewhere classified

iv
(e) The Australian Capital Territory and the Northern Territory are referred to as ‘the Territories’. References to the ‘States’ or ‘each State’ include the Territories. The following abbreviations are used for the names of the States, where appropriate:
NSW New South Wales
VIC Victoria
QLD Queensland
WA Western Australia
SA South Australia
TAS Tasmania
ACT Australian Capital Territory
NT Northern Territory
(f) In this paper the term Commonwealth refers to the Commonwealth of Australia. The term is used when referring to the legal entity of the Commonwealth of Australia.
The term Australian Government is used when referring to the Government and the decisions and activities made by the Government on behalf of the Commonwealth of Australia.
Budget Paper No. 1: Budget Strategy and Outlook 2012-13 is one of a series of Budget Papers that provides information to supplement the Budget Speech. A full list of the series is printed on the inside cover of this paper.

v
CONTENTS
STATEMENT 1: BUDGET OVERVIEW .................................................................. 1-1 Introduction ................................................................................................................... 1-5
Economic outlook ......................................................................................................... 1-7
Fiscal strategy and outlook ........................................................................................ 1-10
Budget priorities ......................................................................................................... 1-16
Spreading the benefits of the boom ........................................................................... 1-17
Australia’s future workforce ........................................................................................ 1-23
First stage of the National Disability Insurance Scheme ........................................... 1-25
Living Longer. Living Better: aged care reform .......................................................... 1-26
Investing in key health services ................................................................................. 1-29
Transitioning to a clean energy future ........................................................................ 1-31
Education — delivering our reform agenda ............................................................... 1-32
Building the infrastructure we need ............................................................................ 1-33
Advancing Australia’s national security interests ....................................................... 1-34
Providing assistance in our region and beyond ......................................................... 1-36
Commemorating the Centenary of Anzac .................................................................. 1-37
Stronger futures in the Northern Territory .................................................................. 1-37
Remote jobs and communities program .................................................................... 1-38
STATEMENT 2: ECONOMIC OUTLOOK ............................................................... 2-1 Overview ...................................................................................................................... 2-3
The outlook for the international economy ................................................................. 2-13
The outlook for the domestic economy ...................................................................... 2-17
STATEMENT 3: FISCAL STRATEGY AND OUTLOOK ............................................ 3-1 Overview of fiscal position ............................................................................................ 3-3
Fiscal outlook ............................................................................................................... 3-9

vi
STATEMENT 4: BUILDING RESILIENCE THROUGH NATIONAL SAVING ................. 4-1 Introduction ................................................................................................................... 4-3
The benefits of higher saving ....................................................................................... 4-4
Building a high saving economy ................................................................................... 4-5
Higher national saving improves macroeconomic resilience ..................................... 4-13
Government saving promotes macroeconomic stability and fiscal sustainability .......................................................................................................... 4-16
Conclusion .................................................................................................................. 4-22
References ................................................................................................................. 4-24
STATEMENT 5: REVENUE ................................................................................. 5-1 Overview ...................................................................................................................... 5-3
The tax-to-GDP ratio .................................................................................................... 5-5
Variations in the receipts estimates ........................................................................... 5-10
Receipts growth by head of revenue ......................................................................... 5-19
Revenue variations since MYEFO ............................................................................. 5-28
Appendix A: Receipts and revenue forward estimates .............................................. 5-29
Appendix B: Changes since 2011-12 MYEFO ........................................................... 5-31
Appendix C: Receipts and revenue history and forecasts ......................................... 5-35
Appendix D: Forecast methodology and performance ............................................... 5-42
Appendix E: Taxation receipts and revenue recognition............................................ 5-46
Appendix F: Tax expenditures ................................................................................... 5-49
STATEMENT 6: EXPENSES AND NET CAPITAL INVESTMENT ............................... 6-1 Overview ...................................................................................................................... 6-3
General government sector expenses ......................................................................... 6-3
General government net capital investment .............................................................. 6-50
STATEMENT 7: ASSET AND LIABILITY MANAGEMENT ........................................ 7-1 Overview of the Australian Government’s balance sheet ............................................ 7-3
The Australian Government’s major assets and liabilities ........................................... 7-8
The Commonwealth Government Securities Market ................................................. 7-16

vii
STATEMENT 8: STATEMENT OF RISKS .............................................................. 8-1 Risks to the Budget — overview .................................................................................. 8-3
Economic and other parameters .................................................................................. 8-4
Fiscal risks .................................................................................................................... 8-5
Contingent liabilities and assets ................................................................................... 8-6
Contingent liabilities — quantifiable ............................................................................. 8-8
Contingent liabilities — unquantifiable ....................................................................... 8-12
Contingent assets — unquantifiable .......................................................................... 8-27
STATEMENT 9: BUDGET FINANCIAL STATEMENTS .............................................. 9-1 Notes to the financial statements ............................................................................... 9-13
STATEMENT 10: HISTORICAL AUSTRALIAN GOVERNMENT DATA ..................... 10-1


1-1
STATEMENT 1: BUDGET OVERVIEW
The Government is returning the budget to surplus in 2012-13, on time and as promised, with surpluses growing over the forward estimates. This Budget delivers on the Government’s fiscal strategy while also spreading the benefits of the mining boom to help families on low and middle incomes and small business.
A return to surplus, ahead of any major advanced economy, sends a strong message to international investors on the Government’s commitment to fiscal discipline, and provides a buffer in uncertain global economic times. While global financial stresses eased somewhat in the early months of 2012, after the period of acute instability in late 2011, conditions remain weak and fragile, with many advanced economies still facing a significant task of generating growth and placing public finances on a sustainable footing.
A small surplus in 2012-13 is appropriate given domestic economic conditions and will provide ongoing scope for monetary policy to respond to economic developments. Australia’s economy is expected to outperform the major advanced economies over the next two years. The economy is forecast to grow around trend, with low unemployment, contained inflation, record levels of mining investment, and very low levels of Government debt.
The Australian economy continues to be affected by the dramatic structural changes underway in the global economy, as the weight of economic activity moves towards Asia. Resource prices and the Australian dollar are expected to remain elevated by historical standards. However, the high dollar, cautious consumer and ongoing global uncertainty are expected to weigh heavily on some parts of the economy outside of the resources-related sectors.
In response to these challenges, this Budget spreads the benefits of the mining boom to help low and middle-income families, through increased payments to families, and an allowance for eligible income support recipients. It also supports businesses to meet the challenges and opportunities of the mining boom through a loss carry-back reform which builds on the instant asset write-off due to start on 1 July 2012.
This Budget also launches the first stage of the historic National Disability Insurance Scheme, strengthens the aged care system, and improves dental services.
Notwithstanding a further write-down in tax receipts, the Government is delivering these priorities while still returning the budget to surplus by making $33.6 billion in targeted and responsible savings. Following a revised underlying cash deficit of $44.4 billion (3.0 per cent of GDP) in 2011-12, a surplus of $1.5 billion (0.1 per cent of GDP) is expected in 2012-13, growing to $7.5 billion (0.4 per cent of GDP) in 2015-16.
This Budget delivers on the Government’s fiscal strategy, assists families and sectors of the economy in responding to current challenges, and gets the long-term settings right so that the entire Australian community can take advantage of the significant opportunities of the Asian Century from a position of strength.


1-3
CONTENTS
Introduction ................................................................................................................ 1-5
Economic outlook ...................................................................................................... 1-7
Fiscal strategy and outlook ..................................................................................... 1-10 Fiscal strategy ............................................................................................................ 1-10 Why returning the budget to surplus is appropriate ................................................... 1-11 Fiscal outlook — delivering on the Government’s fiscal strategy .............................. 1-12 A strong balance sheet .............................................................................................. 1-14
Budget priorities ....................................................................................................... 1-16
Spreading the benefits of the boom ....................................................................... 1-17 Additional support to help households with the costs of living ................................... 1-18 Supporting businesses during a time of transition ..................................................... 1-21
Australia’s future workforce ................................................................................... 1-23 Delivering on our skills commitments ......................................................................... 1-23 Strengthening vocational education and training ....................................................... 1-23 Investing in training to support growth ....................................................................... 1-24 Assisting workers with children .................................................................................. 1-24
First stage of the National Disability Insurance Scheme ..................................... 1-25 Roll-out of the first stage ............................................................................................ 1-25 Funding for the first stage .......................................................................................... 1-25
Living Longer. Living Better: aged care reform .................................................... 1-26 More aged care services, especially those delivered in the home ............................ 1-26 Addressing workforce pressures ................................................................................ 1-27 Making aged care services more consumer-centred ................................................. 1-27 Opportunities of an ageing population ....................................................................... 1-28
Investing in key health services ............................................................................. 1-29 Delivering additional dental services .......................................................................... 1-29 Expanding hospitals and health services for regional Australia ................................. 1-30 Further improving health services .............................................................................. 1-30 Improving the sustainability of the Health Budget ...................................................... 1-31
Transitioning to a clean energy future ................................................................... 1-31
Education — delivering our reform agenda .......................................................... 1-32 Early childhood ........................................................................................................... 1-32 Schools ....................................................................................................................... 1-32 Higher education ........................................................................................................ 1-33
1-4
Building the infrastructure we need ....................................................................... 1-33 Duplicating the Pacific Highway ................................................................................. 1-34 Strengthening our commitment to road safety ........................................................... 1-34 Improving the flow of freight to lift productivity ........................................................... 1-34
Advancing Australia’s national security interests ................................................ 1-34 Supporting global security .......................................................................................... 1-35 Enhancing defence capabilities .................................................................................. 1-35 Enhancing law enforcement ....................................................................................... 1-36 Biosecurity .................................................................................................................. 1-36
Providing assistance in our region and beyond ................................................... 1-36
Commemorating the Centenary of Anzac ............................................................. 1-37
Stronger futures in the Northern Territory ............................................................ 1-37
Remote jobs and communities program ............................................................... 1-38

1-5
STATEMENT 1: BUDGET OVERVIEW
INTRODUCTION
The Government is returning the budget to surplus in 2012-13 and will build growing surpluses over the forward estimates, while also spreading the benefits of the mining boom to help families on low and middle incomes and small business.
A return to surplus, which will be achieved ahead of any major advanced economy, will sustain confidence in the strength of Australia’s public finances, by demonstrating the Government’s commitment to fiscal discipline and by providing a buffer at a time when the global economy remains fragile.
A return to surplus is appropriate given domestic economic conditions and will provide ongoing scope for monetary policy to respond to economic developments. The economy is forecast to grow around trend over the next two years, with low unemployment, contained inflation, and record levels of mining investment.
While global financial market tensions eased in the early months of 2012, after the period of acute instability in late 2011, there are still substantial downside risks to the global economic outlook. In particular, many advanced economies still face the significant task of generating growth while at the same time placing public finances on a sustainable footing.
The global economy is also undergoing dramatic structural changes, as the weight of economic activity moves towards Asia. Successfully adapting to changes in the global economy will allow Australia to convert the significant opportunities of the Asian Century into lasting prosperity over the medium and long term.
The Australian economy continues to be affected by the fragile and changing nature of the global economy. However, Australia’s success in supporting the economy and jobs during the global financial crisis means the economy faces these transitions from a position of strength.
The Australian economy has grown significantly above its pre-crisis level of output and continues to perform solidly against this weak and uncertain global backdrop. Australia’s medium-term prospects are healthy, with continued strength in business investment, particularly in the resource sector, expected to drive overall growth in the economy.
Strong growth in the resources sector will directly and indirectly support growth in other parts of the economy. However, conditions in some parts of the economy are likely to remain challenging, with unsettled global conditions, the high Australian dollar, ongoing consumer caution and changes in expenditure patterns all expected to weigh heavily on some sectors.

Statement 1: Budget Overview
1-6
While these forces are placing considerable pressure on some businesses, many are successfully adapting to the changing economic landscape, identifying and exploiting opportunities to grow and prosper.
Overall, Australia’s economic outlook remains positive, with the economy forecast to grow around trend over the next two years, the unemployment rate expected to remain low and inflation likely to remain well contained.
While tax receipts continue to recover from their post-crisis trough, the recovery has not matched that of nominal GDP. This reflects a number of factors including structural changes in the tax base and the unsustainable peaks in tax receipts reached prior to the global financial crisis. Tax as a proportion of GDP in 2011-12 and the previous two years is the lowest it has been since 1993-94.
Since the Mid-Year Economic and Fiscal Outlook 2011-12 (MYEFO), the impact of the uncertain global economy on asset prices, lower than expected company tax collections relating to the 2010-11 income year and consumer caution have resulted in further write-downs to tax receipts of $28.0 billion over the four years from 2011-12.
Despite the write-down in revenue, the Government is returning to surplus, and creating room for new investments, by making $33.6 billion of savings.
The savings in this Budget are targeted and responsible, protecting the most vulnerable and frontline services.
The underlying cash surplus is expected to be $1.5 billion (0.1 per cent of GDP) in 2012-13, rising to $7.5 billion (0.4 per cent of GDP) by 2015-16. This follows a revised deficit of $44.4 billion (3.0 per cent of GDP) in 2011-12 (Table 1).
Table 1: Budget aggregates Actual Estimates Projections2010-11 2011-12 2012-13 2013-14 2014-15 2015-16
Underlying cash balance ($b)(a) -47.7 -44.4 1.5 2.0 5.3 7.5Per cent of GDP -3.4 -3.0 0.1 0.1 0.3 0.4
Fiscal balance ($b) -51.5 -42.0 2.5 2.6 7.0 9.5Per cent of GDP -3.7 -2.8 0.2 0.2 0.4 0.5
(a) Excludes expected Future Fund earnings. This Budget spreads the benefits of the mining boom to help over 1.5 million families on low and middle incomes with the costs of living, through measures including targeted increases to family payments, and supports low-income earners with a new Supplementary Allowance for eligible income support recipients. It will also help provide much needed help for businesses struggling with an economy in transition.
It provides more timely and accessible education payments to parents, so that all eligible families will receive assistance with their children’s education costs.

Statement 1: Budget Overview
1-7
It supports businesses to adapt to the high dollar by introducing loss carry-back reforms for companies to help them finance the investment, training and restructuring needed to improve competitiveness. This builds on the instant asset write-off which will support all small businesses, driving investment and productivity.
It commits to the first stage of a National Disability Insurance Scheme, which will fund reasonable and necessary care and support for people in launch locations who suffer significant and permanent disability.
It reforms the aged care system, by improving access to services, providing greater incentives for investment in the sector, and directing resources to those most in need.
It invests in dental services to treat those on public dental waiting lists and strengthens the dental workforce in the public sector and in areas of need to ensure those on low incomes will have better access to dental health care.
It builds on past investments in education to improve outcomes for students from early childhood to university.
It invests in high-quality infrastructure projects, to expand capacity and boost productivity.
It invests around $3.4 billion over ten years to work in partnership with Aboriginal people and the Northern Territory Government to continue efforts to Close the Gap in Indigenous disadvantage.
The Budget delivers on these priorities while returning the budget to surplus in order to further strengthen confidence in Australia’s economy, and to ensure the Government can continue to make important investments for the future.
ECONOMIC OUTLOOK
The fundamentals of the Australian economy remain strong and the outlook remains positive, with the economy forecast to grow around trend, the unemployment rate expected to remain low and inflation likely to be well-contained. Prospects continue to be underpinned by strong growth in our regional trading partners and an unprecedented pipeline of mining investment.
The Australian economy’s level of output is well above pre-global financial crisis levels and the economy is expected to grow around its trend rate over the next two years. Since the global financial crisis the Australian economy has outperformed every major advanced economy and is expected to continue to perform more strongly than these economies over the next two years (Chart 1).

Statement 1: Budget Overview
1-8
Chart 1: GDP and Employment International Comparison GDP Employment
90
95
100
105
110
90
95
100
105
110
Jun-08 Mar-10 Dec-11
Australia
euro area
United States
Japan
Index (Jun-08=100)
90
95
100
105
110
90
95
100
105
110
Jun-08 Sep-09 Dec-10 Mar-12
Index (Jun-08=100)
Australia
Japan
euro area
United States
Note: Euro area employment data are quarterly. Employment data for Japan from March 2011 to August 2011 are not available due to the impacts of the Japanese earthquake and tsunami. Source: ABS cat. no. 5206.0, 6202.0, national statistical agencies, Thomson Reuters and Treasury.
The economy is forecast to grow around trend over the next two years, driven by strong growth in the resources sector. Real GDP is forecast to grow 3 per cent in 2011-12, 3¼ per cent in 2012-13 and 3 per cent in 2013-14 (Table 2). The impact of the Government’s fiscal consolidation, particularly in 2012-13, should be more than offset by growth in private demand.
Table 2: Major economic parameters(a)
2011-12 2012-13 2013-14 2014-15 2015-16Real GDP 3 3 1/4 3 3 3Employment 1/2 1 1/4 1 1/2 1 1/2 1 1/2Unemployment rate 5 1/4 5 1/2 5 1/2 5 5Consumer price index 1 1/4 3 1/4 2 1/2 2 1/2 2 1/2Nominal GDP 5 1/2 5 5 1/4 5 1/4 5 1/4
Forecasts Projections
(a) Real and nominal GDP are year-average growth. Employment and CPI are through-the-year growth to
the June quarter. The unemployment rate is the rate for the June quarter.
Global financial market tensions eased in the early months of 2012, after the period of acute instability in late 2011, but there are still substantial downside risks to the global economic outlook. Many advanced economies are yet to return to pre-global financial crisis output levels and face the substantial task of putting public finances on a sustainable footing while simultaneously supporting growth. While there have been some encouraging signs in the United States, the euro area appears to have re-entered recession and there have been renewed concerns regarding its fiscal and financial stability. In addition, the United Kingdom has re-entered recession.
Against this backdrop, there are dramatic structural changes underway in the global economy, with the weight of economic activity shifting towards Asia. Emerging

Statement 1: Budget Overview
1-9
economies, particularly China and India, are expected to account for a large part of global growth over the next two years.
This pattern of growth has significant implications for Australia. Strong demand from Asia, particularly China, is expected to continue to support historically high commodity prices, drive record levels of investment in resources projects in Australia and underpin solid growth in non-rural commodity export volumes. Strong growth in emerging Asia will also increasingly provide opportunities for Australia’s services sector and other parts of the economy.
Businesses expect to invest a record $120 billion in the resources sector in 2012-13. The resources investment pipeline is currently over $450 billion, with more than half of these projects already committed or under construction. Over the forecast period, new business investment as a proportion of GDP is expected to reach the highest level since records were kept.
Strong growth in the resources sector is expected to continue to spill over into other sectors, including parts of the construction sector, parts of manufacturing and parts of the services sector.
Nonetheless, the outlook for some other parts of Australia’s patchwork economy is uneven with unsettled global conditions, the high Australian dollar, ongoing consumer caution and changes in expenditure patterns all expected to weigh heavily on some sectors. While some of the headwinds outside of the resources sector are likely to be temporary, some are structural, reflecting the broad structural transition that is currently underway across the economy.
The pattern of growth in the Australian economy is uneven with the resources and resources-related parts of the economy growing strongly, but some other parts of the economy facing challenging conditions. However, the patchwork economy is multifaceted. While growth in the resources parts of the economy has been exceptional in recent years, there has also been strong growth in a number of other sectors including, for example, health care and social assistance and professional scientific and technical services. There have also been pockets of strength in sectors such as manufacturing and elsewhere, even though many businesses in these sectors have been facing challenging conditions. There is a complex structural transition occurring in the economy and it is having wide-ranging effects on many sectors and regions.
Notwithstanding the challenging conditions being experienced by some parts of the economy, Australia’s unemployment rate has been relatively stable and at just above 5 per cent, is lower than most other advanced countries. The unemployment rate is around half that in Europe and significantly below that in the United States. In aggregate, employment is expected to grow 1¼ per cent through the year to the June quarter of 2013 and 1½ per cent through the year to the June quarter of 2014. The unemployment rate is expected to drift up to 5½ per cent by the June quarter of 2013.

Statement 1: Budget Overview
1-10
With the economy expected to grow around trend, inflation is expected to be well-contained. Headline inflation is forecast to be 1¼ per cent through the year to the June quarter of 2012, and 3¼ per cent through the year to the June quarter of 2013, including a one-off ¾ of a percentage point increase due to the introduction of the carbon price, before declining to 2½ per cent through the year to the June quarter of 2014.
The commencement of the carbon price on 1 July 2012 is not expected to have a material impact on the domestic economic outlook with real GDP growth and employment growth expected to be reduced by less than ¼ of a percentage point in 2012-13, with no discernible impact on the forecast unemployment rate.
Although the outlook for the Australian economy is positive, substantial downside risks remain. The key international risk is the potential for a re-escalation of the euro area sovereign debt crisis. The capacity of many advanced economies to respond is limited and any further weakness could flow through to the emerging economies of Asia and to Australia.
FISCAL STRATEGY AND OUTLOOK
Consistent with an economy forecast to grow around trend, the Government will return the budget to a surplus in 2012-13, notwithstanding the challenges imposed by a further substantial write-down in revenue.
Fiscal strategy
The Government’s fiscal strategy is designed to ensure fiscal sustainability, while providing the necessary flexibility for the budget position to vary in line with economic conditions.
The medium-term fiscal strategy, which has remained unchanged since the Government’s first budget in 2008-09, is to:
• achieve budget surpluses, on average, over the medium term;
• keep taxation as a share of GDP, on average, below the level for 2007-08 (23.7 per cent); and
• improve the Government’s net financial worth over the medium term.

1-11
To ensure a timely return to surplus and recovery in the fiscal position, since the beginning of the global financial crisis the Government has further committed to:
• allow the level of tax receipts to recover naturally as the economy improves, while maintaining the Government’s commitment to keep taxation as a share of GDP below the 2007-08 level on average; and
• build growing surpluses by holding real growth in spending to 2 per cent a year, on average, until the budget surplus is at least 1 per cent of GDP, and while the economy is growing at or above trend.
Why returning the budget to surplus is appropriate
The Government’s medium-term fiscal strategy guided the Government’s successful response to the global financial crisis and provides the basis for the Government’s determination to return the budget to surplus.
Consistent with the strategy, the Government delivered a timely, targeted and temporary fiscal stimulus at the height of the global financial crisis to support economic growth and jobs at a time when the private sector was in retreat, and charted a clear path to return the budget to surplus at the same time.
Returning the budget to surplus in 2012-13 remains appropriate given domestic economic conditions. The economy is forecast to grow around trend over the next two years, the unemployment rate is expected to remain low and mining investment is expected to reach record highs.
The return to surplus also recognises that fiscal policy should be set in a medium-term framework. In normal circumstances monetary policy should play the primary role in managing demand to keep the economy growing at close to capacity consistent with achieving its medium-term inflation target.
Importantly, the Budget forecast of around-trend growth takes account of the impact of the substantial fiscal consolidation in 2012-13. Returning the budget to surplus now will provide ongoing scope for monetary policy to respond to economic developments, if needed.
A return to surplus is also important for sustaining confidence in the strength of Australia’s public finances. The European sovereign debt crisis has underscored that maintaining strong fiscal discipline and credibility is now more important than ever, with financial markets punishing those economies without it.
Global credit rating agencies have highlighted the importance of the Government’s strategy of returning to surplus, which, along with Australia’s very low level of public debt, is a key reason behind the Government receiving the AAA credit rating from all three major rating agencies for the first time in Australia’s history.
Statement 1: Budget Overview

Statement 1: Budget Overview
1-12
The savings made to return the budget to surplus will also contribute to the sustainability of Australia’s public finances and support Australia’s capacity to respond to unanticipated events in uncertain global economic times.
Fiscal outlook — delivering on the Government’s fiscal strategy
Consistent with the fiscal strategy, the return to surplus is being achieved through a combination of targeted and responsible savings and allowing the natural increase in tax receipts associated with a strengthening economy to flow through to the budget.
An underlying cash deficit of $44.4 billion (3.0 per cent of GDP) is expected in 2011-12, with a surplus of $1.5 billion (0.1 per cent of GDP) expected in 2012-13 and growing to $7.5 billion (0.4 per cent of GDP) in 2015-16.
Slower than expected recovery in revenue
While tax receipts continue to recover from their post-crisis lows, the recovery is weaker than previously expected, and tax receipts remain well below the unsustainable peaks reached in the period leading up to the crisis.
Continued weakness in capital gains receipts, lower than expected company tax collections relating to the 2010-11 income year, and consumer caution have resulted in a write-down to tax receipt estimates of $5.7 billion in 2011-12 compared with expectations at MYEFO.
Most of these downgrades will flow through to 2012-13 and the remainder of the forward estimates, with tax receipts revised down by $28.0 billion over the four-year period from 2011-12.
Tax receipts are projected to reach 22.9 per cent of GDP in 2015-16, around 1 percentage point below the unsustainable levels reached in the mid-2000s. This means that tax as a proportion of GDP in 2011-12 and the previous two years is the lowest it has been since 1993-94.
Prior to the global financial crisis, tax receipts were benefitting from a combination of factors that created buoyant revenue growth. These factors included a commodity price boom combined with higher production largely driven by the expansion of existing projects, very strong equity and house price growth, significant growth in household consumption expenditure, and a relatively low Australian dollar.
Since the global financial crisis there has been a fundamental change in structure of the domestic economy that is expected to affect tax receipts for some years to come.
While commodity prices remain high, the current phase in the mining boom is centred more on investment in new projects. As these projects typically have higher depreciation deductions, growth in mining gross profits is not translating into a commensurate rise in mining company tax receipts.
Statement 1: Budget Overview
1-13
At the same time, house and equity price growth is much weaker than it was, and capital gains tax receipts are lower. Furthermore, a combination of consumer caution and shifting spending patterns, partly as a result of the higher Australian dollar, is weighing on GST and company tax receipts from the retail sector.
Targeted and responsible savings
Notwithstanding the further write-down in tax receipts, targeted and responsible savings have ensured that the budget returns to surplus in 2012-13 and beyond.
This Budget makes $33.6 billion in savings, building on the $11.5 billion of savings identified in MYEFO and over $100 billion of savings identified in the four Budgets since 2008-09.
Less than half of the savings in this Budget are from changes in tax receipts. The overall impact of savings and new spending in this Budget is a net saving of $17.0 billion over the forward estimates.
In making these difficult savings decisions the Government has applied a targeted and responsible approach, with a view to fairness, placing the budget on firmer ground and getting more value for taxpayers’ money.
For example, the Government will limit access to Family Tax Benefit Part A to children under 18 or in full-time secondary school with young adults having access to Youth Allowance subject to normal participation requirements. The Government is also improving the sustainability of the Pharmaceutical Benefits Scheme (PBS) through lower prices on medicines, improving the safety net arrangements under the Medicare Benefits Schedule by capping high cost consultations, and making the Net Medical Expenses Tax Offset fairer by introducing an income test.
The Government has also sought greater efficiencies from the Australian Public Service. As announced at MYEFO, an additional efficiency dividend of 2.5 per cent will apply to the majority of Commonwealth agencies for 2012-13.
Spending is projected to fall to 23.5 per cent of GDP in 2012-13 and remain around this level across the forward estimates. This would be the longest sustained run of payments below 24 per cent since the early 1980s. Real growth in spending averages 1.8 per cent per annum over the five years from 2011-12.
The recovery in revenue is also being supported by measures to improve the integrity, fairness and sustainability of the tax system, including reforming the tax concessions for golden handshakes and living-away-from-home allowances and benefits. The Government is also making the superannuation system fairer by reducing the tax concession received by very high income earners on their superannuation contributions, so it is more in line with the concession received by average income earners.

Statement 1: Budget Overview
1-14
Additional measures include not proceeding with the standard deduction for work-related expenses and the tax discount on interest income, in light of the simplification benefits of tripling the tax-free threshold and freeing over a million taxpayers from needing to lodge a return, feedback from public consultation and significant growth in household savings.
The Government is also reforming the company tax system to support businesses during a time of transition by introducing a loss carry-back reform which builds on the instant asset write-off due to start on 1 July 2012. This is part of the Government’s reforms to boost productivity to help businesses invest, innovate and take sensible risks.
A strong balance sheet
The Government’s ongoing commitment to fiscal discipline, and the return to surplus in 2012-13, will ensure Australia’s balance sheet remains one of the strongest in the developed world.
The strength of Australia’s public finances is a key reason behind Australia being one of only 8 countries to have a AAA rating with a stable outlook from all three major rating agencies.
Net debt is expected to peak at 9.6 per cent of GDP in 2011-12 and decline over the remainder of the forward estimates. The peak is higher than previously expected, reflecting an increase in the market value of the existing stock of Commonwealth Government Securities on issue, and a further increase in issuance owing to the weaker fiscal outlook in 2011-12.
Still, the Australian Government’s net debt position remains very low by international standards, with the average net debt position of the major advanced economies expected to be around 93 per cent of GDP in 2016 and 2017 (Chart 2). A return to surplus in 2012-13 will be achieved ahead of any major advanced economy (Chart 3).

Statement 1: Budget Overview
1-15
Chart 2: Comparison of Government net debt for selected economies, 2011-2017
0
25
50
75
100
125
150
175
0
25
50
75
100
125
150
175
Australia euro area Japan US UK
Per cent of GDPPer cent of GDP
Note: Australian data are for the Australian Government general government sector and refer to financial years beginning 2011-12. Data for all other economies are total government and refer to calendar years beginning 2011. Source: IMF Fiscal Monitor April 2012 and Treasury.
Chart 3: Comparison of Budget balances for selected economies, 2011-2017
-12
-10
-8
-6
-4
-2
0
2
-12
-10
-8
-6
-4
-2
0
2
Australia euro area Japan US UK
Per cent of GDPPer cent of GDPPer cent of GDP Per cent of GDP
Note: Australian data are for the Australian Government general government sector underlying cash balance and refer to financial years beginning 2011-12. Data for all other economies are total government and refer to calendar years beginning 2011. Source: IMF Fiscal Monitor April 2012 and Treasury.

Statement 1: Budget Overview
1-16
BUDGET PRIORITIES
The 2012-13 Budget spreads the benefits of the mining boom to help families on low and middle incomes with the cost of living and provide much needed help to small business, while still returning the budget to surplus as is appropriate given domestic and global economic conditions.
Support to families on low and middle incomes is being provided through measures including increases to family payments, more timely and accessible education payments, and a new Supplementary Allowance for eligible income support recipients.
This Budget also supports businesses to meet the challenges and opportunities of the mining boom through a loss carry-back reform which builds on the instant asset write-off due to start on 1 July 2012.
This Budget further converts Australia’s economic success and the opportunities of the mining boom into tangible benefits for more Australians through:
• commits to the first stage of a National Disability Insurance Scheme to ensure Australians with significant and permanent disability in launch locations receive a reasonable and necessary level of ongoing care and support;
• building an aged care system for the future — more supply, higher quality of care, enhanced access, more responsive to the needs of older Australians, and financially sustainable over the long term; and
• delivering additional funding for dental services to help reduce public waiting lists and building the capacity of the dental workforce in the public system and in areas of need.
Other priorities in this Budget, which build on policies that support jobs, underpin front-line services in areas like health and education, and grow the productive capacity of the economy, include:
• helping job seekers adapt to an economy in transition through reforms to the national training system and delivering the most effective employment services possible;
• continuing the transition to a clean energy future;
• ensuring the Government’s $32.5 billion increase in the investment in schooling since coming to office continues to improve outcomes for students;
• providing an extra $225.1 million to assist a total of 130,000 people on income support over four years with their child care costs as they transition into the workforce;
Statement 1: Budget Overview
1-17
• investing in high-quality infrastructure projects, to expand capacity and boost productivity;
• investing around $3.4 billion over ten years to work in partnership with Aboriginal people and the Northern Territory Government to continue efforts to Close the Gap in Indigenous disadvantage; and
• ensuring the Australian Defence Force (ADF) is adequately equipped to uphold its commitments to ongoing Defence operations, and to respond to humanitarian and disaster crises both at home and in our region.
The Government has applied a targeted and responsible approach to make the $33.6 billion of savings needed to return the budget to surplus and pay for new spending. The Government’s savings strategy has protected low and middle income families and safeguarded the key drivers of productivity, including the Government’s investments in skills, schools, higher education and research.
SPREADING THE BENEFITS OF THE BOOM
Strong demand for Australia’s natural resources and record profits for resource companies continue to provide great opportunity for the Australian economy and people. The Minerals Resource Rent Tax (MRRT) is an historic economic reform which means that the benefits of the boom can be invested in Australia’s future and spread to all Australians.
The Government is investing the proceeds of the resources boom from the MRRT to strengthen our whole economy. The Government will invest a total of $6.0 billion from the Regional Infrastructure Fund to address urgent infrastructure needs, and will pay for the tax concessions associated with the superannuation guarantee rate rises from 9 per cent to 12 per cent.
The Government was also going to use the proceeds of the MRRT to cut the company tax rate. However, the Government was not able to secure the necessary parliamentary support and for that reason will now adopt a different approach to spread the benefits of the boom to families and businesses.
The Government’s Spreading the Benefits of the Boom package will deliver much-needed help for over 1.5 million families on low and middle incomes (Table 3). It also supports businesses through a loss carry-back reform which builds on the instant asset write-off due to start on 1 July 2012.

Statement 1: Budget Overview
1-18
Table 3: Spreading the Benefits of the Boom 2011-12 2012-13 2013-14 2014-15 2015-16 Total
$m $m $m $m $m $mCompany tax cut - do not proceed 50 317 1,232 1,596 1,561 4,756Company loss carry-back 0 -7 -155 -251 -301 -714Increasing the rate of
Family Tax Benefit Part A 0 0 -603 -615 -626 -1,844Supplementary Allowance 0 -153 -299 -306 -313 -1,070
Total 50 157 175 424 321 1,127 This package, combined with a new Schoolkids Bonus, will help families, students and those on low and middle incomes make ends meet. It will provide $5 billion in support to low and middle-income households which will in turn support consumption and spending in businesses, including small businesses, across the country. The loss carry-back measure will further support the economy by helping businesses struggling with the economy in transition to invest in a productive future.
The business community is engaging with the Government on future reforms through the Business Tax Working Group, and the Government continues to support future business tax reform that is paid for by savings from business and has the support of the Parliament. The final report of the Business Tax Working Group is due to be provided to the Treasurer by the end of 2012.
Additional support to help households with the costs of living
The Government is introducing new measures to help families on low and middle incomes with the costs of raising children through increases in family payments and a more timely and accessible payment to assist with educational costs. The Government is also introducing a new Supplementary Allowance to help individuals in receipt of income support, such as Newstart and Youth Allowance, with the cost of essential bills.
This builds on past substantial reforms the Government has made since 2007, including changes to the tax system to reward hard work, and increases to pensions, family payments and the Child Care Rebate. The Government is also providing substantial household assistance as part of the Clean Energy Future package, which will ensure all low-income households will receive assistance that fully offsets their average expected price impact. Middle-income households will also receive some assistance.
Targeted increase in family payments
The Government is committed to helping families with the costs of raising children and supporting families to keep children in school.
From 1 July 2013 Family Tax Benefit Part A (FTB-A) will increase for all eligible families. The maximum rate for FTB-A will increase by $300 per annum for families with one child and $600 per annum for families with two or more children. For

Statement 1: Budget Overview
1-19
families receiving the base rate, the increase will be $100 per annum for families with one child and $200 per annum for families with two or more children. The Government is providing $1.8 billion over four years for this measure.
This builds on the increase in FTB-A for families with children aged 16 to 19 years in full-time secondary school of up to $4,208 per year that came into effect on 1 January 2012. This will help families to meet the extra costs of raising teenagers and help them to support their children to stay at school.
Supplementary Allowance
The Government is investing $1.1 billion to create a new Supplementary Allowance for eligible recipients on income support to help them meet the costs of essential bills.
Recipients of Newstart Allowance, Youth Allowance, Austudy, ABSTUDY, Special Benefit and Parenting Payment will qualify for the Income Support Supplement. Transitional Farm Family Payment and Exceptional Circumstances Relief Payment recipients will also qualify.
Singles will receive an additional yearly allowance of $210 and couples will receive $350 combined, paid in two instalments in March and September, with the first payment commencing in March 2013. The payment will also be indexed by CPI twice a year.
The Supplementary Allowance will assist Australians who are hardest hit by the increases in costs of living — the unemployed, students, parents with young children and farmers.
In addition, the Government is doubling the liquid assets test to allow people with modest levels of savings to access income support sooner. The change doubles the threshold for liquid assets to $5,000 for singles without dependent children or $10,000 for all others, from 1 July 2013. This will allow newly unemployed people to have more assets (for example, money in a bank account) and still qualify for income support without a waiting period.
Previously, newly unemployed people who had liquid assets above a threshold amount of $2,500 if single and without dependent children, or $5,000 for all others would be forced to run down their savings before receiving government assistance.
Supporting parents with education costs
The Government will also provide an additional $2.1 billion over five years to introduce a new Schoolkids Bonus. The Bonus will replace the Education Tax Refund (ETR), and be paid directly to all eligible recipients. It will mean that all eligible families receive assistance with their children’s education costs, and that many families receive increased assistance. Eligible families will also no longer need to keep receipts in order to claim the ETR several months later at tax time.

Statement 1: Budget Overview
1-20
The Schoolkids Bonus will be $410 for primary school students and $820 for secondary school students, per year. From 2013 it will be paid in two equal instalments in January and July, at times when families are likely to incur extra costs. It will be paid to recipients of FTB-A and other eligible payments. As a transitional arrangement, the full 2011-12 ETR payment will be automatically paid to eligible families in June 2012, prior to the introduction of the new Bonus, so that they receive timely assistance equal to the full value of their entitlement.
This will provide families with more flexible and timely support. Furthermore, making the payment automatic ensures that no eligible families will miss out. In respect of the 2010-11 ETR claims to date, 774,000 eligible families have missed out on the full amount of ETR, and 284,000 families have not claimed at all.
Tripling the tax-free threshold
The Government has delivered $47 billion in personal income tax cuts since coming into office, and will deliver an additional $8 billion package of new structural reforms to the personal tax system that target additional tax cuts to low and middle income individuals over the next three years. From 1 July 2012 all taxpayers with incomes of up to $80,000 will get a tax cut, with most receiving at least $300 per year to assist with the cost-of-living impact of the carbon price.
From 1 July 2012, the tax-free threshold will be more than tripled from $6,000 to $18,200, and the Low Income Tax Offset (LITO) will be reduced to $445. From 1 July 2015, further tax cuts will increase the tax-free threshold to $19,400, with a reduction in the LITO to $300. The first two marginal tax rates will also increase; however, the combined changes mean that the statutory rates will more closely match the effective rates that people actually face. No-one will pay more tax as a result of these reforms and, from 2015-16, more than a million people will no longer need to lodge a tax return and around 700,000 fewer people will pay tax.
Payment increases
In addition to tax cuts, families will benefit from $6.3 billion of increases to government payments as part of the Clean Energy Future household assistance package. The annual maximum rates of pensions, allowances and Family Tax Benefit, and the base rate of FTB-A, will be increased by 1.7 per cent. Assistance will first be delivered through the Clean Energy Advance from May 2012, before the carbon price is introduced.
Nine out of ten households will receive assistance through tax cuts and/or increases to payments, with over four million households receiving assistance that is at least 20 per cent more than their average expected price impact.
Secure and sustainable pensions
In addition to the assistance received through the Clean Energy Future household assistance package, around 3.4 million pensioners have also benefited from the Secure

Statement 1: Budget Overview
1-21
and Sustainable Pension Reforms the Government announced in 2009. These historic reforms provided an increase to the single and couple rates and improved the indexation arrangements of the pension. Since 2009, the maximum rate of the pension has increased by $154 per fortnight for singles and $156 per fortnight for couples combined. Pensioners will continue to benefit from the improved indexation arrangements announced as part of the reforms.
Supporting businesses during a time of transition
The Government will reduce the tax burden on companies, in sectors such as manufacturing, tourism and retail that are struggling with an economy in transition, to help them invest and innovate.
The Government understands how vital the small business sector is to the Australian economy, with 2.7 million businesses employing millions of people, and that many of these small businesses are facing challenges such as those flowing from a higher dollar.
The Government is introducing a range of measures from the 2012-13 income year that will simplify taxation for small business and free up cash flow to enable small businesses to make investments they need to be competitive, support productivity and promote employment.
Loss carry-back
As a first step to reforming the current company tax arrangements the Government will introduce a loss carry-back reform for losses incurred in the 2012-13 income year.
Mining Boom Mark II is generating record levels of investment in the resources sector. However, the historically high dollar is making trading conditions challenging for sectors of the economy outside resources and resources-related parts of the economy, including the manufacturing, tourism and retail sectors.
This reform will support businesses struggling with an economy in transition, helping them make investments and take sensible risks to be able to adapt and restructure. It is particularly important that companies that are experiencing losses are able to make changes to their business to return them to profitability. That may mean undertaking investment in plant and equipment or retraining staff.
In 2012-13, companies will be able to carry back losses incurred in that year of up to $1.0 million so they get a refund against tax previously paid. From 2013-14 companies will be able to carry back losses for two years. It will be available to companies and entities that are taxed like companies, be subject to integrity rules, apply to revenue losses, and be limited to a company’s franking account balance.
This means that a manufacturing, tourism, education, retail or construction business, which is currently profitable and paying tax, will know that if it undertakes

Statement 1: Budget Overview
1-22
investments in 2012-13 that initially result in a loss, they will get a refund of up to $300,000 of tax they have previously paid when they lodge their 2012-13 tax return.
This measure will cost $714 million over the forward estimates, and in its first four years of operation is estimated to provide assistance to nearly 110,000 companies.
Small business instant asset write-off and simplified pooling
From the 2012-13 income year, the Government will allow small businesses to immediately write off eligible business assets costing less than $6,500 — an increase from $1,000 under the old arrangements. This will benefit small business whether they are run through a sole trader, partnership, trust or company.
For example, a small business company that purchases four items of equipment costing $6,000 each will be able to get a tax deduction of $24,000 in the first year (rather than a deduction of $3,600 under the old arrangements). As a result, small business companies will pay around $6,120 less tax in the 2012-13 income year. If the small business operates as a sole trader with a higher marginal tax rate, they may be able to get a bigger tax saving.
The Government is also introducing simplified depreciation pooling arrangements from the 2012-13 income year to save time and improve cash flow for small businesses.
Small business depreciation — accelerated initial deduction for motor vehicles
The Government recognises that motor vehicles are important assets for many of Australia’s small businesses and is introducing accelerated depreciation from the 2012-13 income year to improve cash flow for small businesses. This will benefit small businesses whether they are run by sole traders, partnerships, trusts or companies.
Small businesses will be able to claim up to $5,000 as an immediate deduction for new or used motor vehicles acquired from the 2012-13 income year.
The remainder of the motor vehicle’s cost will be pooled in the general small business pool (depreciated at 15 per cent in the purchase year and then 30 per cent in other years).
A new Manufacturing Technology Innovation Centre
The Government will invest $30 million over four years to establish a Manufacturing Technology Innovation Centre to bring our brightest researchers and manufacturers together to drive innovation through new and improved industrial products and processes. It will establish sectoral collaboration to support major manufacturers, small and medium enterprises, industry bodies, and research agencies to create solutions in their production lines. It will also help them realise new market opportunities particularly in the Asian market through harnessing new technologies, business processes and technical knowledge. The Manufacturing Technology Innovation Centre is consistent with the Prime Minister’s Taskforce on Manufacturing.

Statement 1: Budget Overview
1-23
Advocacy and business support
The new Australian Small Business Commissioner will provide a one-stop shop for small business services and information and ensure that the interests of small business remain at the forefront of Government policy-making. Furthermore, the elevation of the Minister for Small Business to a Cabinet-level position ensures Government decision-making will take full account of the interests of Australia’s small businesses.
The highly successful Small Business Advisory Service will be made an ongoing program, with an additional $28 million in funding over the next four years; and the Small Business Support Line, which provides information and referral services, will be extended to 2015-16.
AUSTRALIA’S FUTURE WORKFORCE
The Government is implementing its $3 billion Building Australia’s Future Workforce skills package, delivering systematic reform through the National Partnership signed with states and territories, and is making additional investments in this Budget to fund new initiatives and support the Government’s ongoing skills reform agenda.
In this Budget, the Government is also acting to reduce barriers that limit Australians from gaining the benefits of participating in the workforce, including by ensuring child care is accessible for all. This is in recognition that the right incentives and programs need to be in place for all Australians to build a skilled, flexible and diverse workforce.
A highly skilled and productive workforce, engaged in the labour market, ensures that our businesses are resilient, innovative and competitive in the global economy and that individuals can secure a job and earn a decent income.
Delivering on our skills commitments
The Government is rolling out significant reform in vocational education and training (VET) through the $3 billion Building Australia’s Future Workforce skills package. The National Workforce Development Fund, delivered as part of this package, has already committed funding for over 50,000 training places, with business contributing around one third of the cost, and mentoring support for 12,000 young apprentices.
Strengthening vocational education and training
As a key part of these reforms, the Government recently signed the five-year, $1.75 billion National Partnership Agreement on Skills Reform with the States and Territories to deliver greater access to affordable high-quality training through the VET system.
The reforms will provide training to individuals who need skills to participate and be productive in the labour market and skills for which there is strong business demand or which are in short supply.

Statement 1: Budget Overview
1-24
Reforms will focus on creating a more accessible and equitable VET system through including a national entitlement to training at a minimum of the first Certificate III qualification and expanding access to student loans to reduce upfront cost barriers to study at the diploma and advanced diploma levels and for certain Certificate IV qualifications.
The wide-reaching reforms will also create a more transparent VET system through increased availability of information on the new My Skills website, and improve the quality of VET teaching and training, including through trials of external validation of training provider assessments. The reforms will also promote equity through additional incentives to improve completion rates, particularly for disadvantaged students.
Investing in training to support growth
In this Budget, the Government is providing an additional $101 million package of measures to support the Government’s ongoing skills reform agenda.
The Government is supporting the up-skilling and re-skilling of mature-age workers including through an additional $35.0 million over four years in the National Workforce Development Fund, and $26.0 million for a new Silver Service employment program for mature-age jobseekers aged 55 years and over.
The Government is also actively supporting recently qualified tradespeople to establish and manage their own business through subsidised business skills training and mentoring ($19.4 million over four years).
In this Budget, the Government is establishing three Australian Skills Centres of Excellence to advance innovation and promote excellence across Australian industry by supporting innovative production processes and teaching and learning methods in the VET sector ($18.1 million over four years).
Assisting workers with children
The Government is helping to ensure child care is more accessible, assisting parents to participate in the workforce and community, by investing an additional $225.1 million over four years for Jobs, Education and Training Child Care Fee Assistance (JETCCFA). Around 130,000 income support recipients will receive assistance with child care costs to participate in work, study, training or job-search activities. This additional funding will address a growing demand for JETCCFA, which is occurring as an increasing number of income support recipients are accessing assistance for child care costs to enable them to participate in the workforce or undertake further study or training. This follows the Government’s efforts to make it easier for working families to meet the costs of child care by increasing the Child Care Rebate from 30 per cent to 50 per cent of out of pocket costs, up to a maximum of $7,500 per year for each child.

Statement 1: Budget Overview
1-25
FIRST STAGE OF THE NATIONAL DISABILITY INSURANCE SCHEME
The Government will provide $1.0 billion over four years for the first stage of a National Disability Insurance Scheme (NDIS) in up to four launch locations. The NDIS will fund reasonable and necessary lifetime care and support for people who suffer significant and permanent disability.
The Government’s commitment responds to the Productivity Commission’s (PC) report into disability care and support released last year. The PC found that the current disability care and support system is underfunded, unfair, fragmented and inefficient.
The Government is rolling out the first stage of an NDIS a year earlier than proposed by the PC.
Roll-out of the first stage
From July 2013, assessments will begin in up to four launch locations to provide an initial 10,000 people who suffer significant and permanent disability with reasonable and necessary care and support. This will be expanded to 20,000 from 2014-15. The launch of the first stage will test key design features and inform the scale and pace of the expansion to a full scheme. Negotiations with States and Territories will begin immediately with launch locations expected to be announced in late 2012.
The Government will continue to work with the States and Territories to develop the launch and plan for the roll-out of a full NDIS.
As part of the first stage, people in launch locations who have a significant and permanent disability will have access to an assessment process that develops an individual support plan with funding allocated for reasonable and necessary support.
Funding for the first stage
The $1.0 billion of funding for the first stage includes:
• $342.5 million over three years to fund individualised supports in the launch locations;
• $213.4 million over four years to properly evaluate and assess people’s needs and those of their carers and provide case management services through Local Area Co-ordinators;
• $122.6 million over four years to increase the capacity of the disability services sector to deliver NDIS services and supports. The disability support workforce will undergo a fundamental change and will expand significantly under an NDIS. This funding will assist the sector to make the transition; and

Statement 1: Budget Overview
1-26
• $240.3 million over four years to develop and implement an information communication technology system that will effectively monitor, track and evaluate the operation of the first stage, and provide a platform for future national roll-out.
The NDIS will fundamentally change the way disability care and support is provided. It will provide peace of mind for people with significant and permanent disability and those who care for them.
LIVING LONGER. LIVING BETTER: AGED CARE REFORM
The Government is delivering much needed reform of Australia’s aged care system, including more home-based services, greater incentives for investment in new residential aged care facilities, and making the system fairer, more transparent and more responsive to the needs of older Australians.
Australia’s aged care system is coming under growing pressure from structural weaknesses as well as the growing number of older Australians. Our aged care system is complex and difficult to navigate; services are limited, as is consumer choice; and there are inequities in subsidies and user contributions which undermine the financial sustainability of the system.
The Government will address these issues with a comprehensive, ten-year plan for reform of the sector. The first five years of reform will include a $3.7 billion package to address the most pressing areas of need and lay the foundations for longer term reform. This includes a net Government investment of $576.9 million, with the balance of the package to be funded from within the aged care system and by introducing fairer means testing arrangements.
The Government is also working together with industry and community organisations to enable senior Australians to actively contribute to all aspects of society, including through responding to the recommendations of the Final Report of the Advisory Panel on the Economic Potential of Senior Australians.
More aged care services, especially those delivered in the home
To make it easier for older Australians to stay in their home while they receive care, the Government will provide $880.1 million over five years (including $454.0 million redirected from residential aged care) to increase the number of Home Care packages. There will be an additional 40,000 Home Care packages over the next five years, taking the total number of packages to almost 100,000. The introduction of two new levels of home care packages will make it easier for older Australians to move between care levels as their needs increase. Government subsidies for home care places will be means tested to protect those most in need, while making the financing of community care services more sustainable.

Statement 1: Budget Overview
1-27
Basic home support services will be streamlined and expanded through the creation of a national Home Support program, at a cost of $75.3 million over five years. This includes merging a number of existing home support programs. The Government will also review the Home Support program to inform a move to more consistent and equitable service delivery arrangements and more national consistency in user contributions to the cost of these services.
The Government is providing improved incentives for residential aged care providers to invest in new facilities, including those in regional and remote areas, and greater choice in the level of accommodation services that aged care residents can purchase, at a cost of $660.3 million over five years. Means testing of Government subsidies for residential care and accommodation costs will also be tightened to make the system more equitable and financially sustainable.
To support the growth in aged care services, the Government will invest $54.8 million over five years to streamline and expand support for personal carers.
Addressing workforce pressures
The Government will provide $1.2 billion over five years to establish an Aged Care Workforce Compact between the Government, aged care providers, unions and workforce training stakeholders. The Compact will include measures to improve the recruitment and retention of qualified staff, including wage increases; the development of a national workforce strategy; improving the quality of aged care training in vocational education and training; and increasing the focus on aged care in nursing curricula.
The Aged Care Workforce Compact will be funded by redirecting funds currently provided through the Aged Care Funding Instrument so that the funding claimed by aged care providers better matches the level of care being offered.
Making aged care services more consumer-centred
The Government will enhance consumer choice and transparency in accessing aged care services, including by:
• streamlining and strengthening front-end information and access to aged care services by providing $198.2 million over five years (including $123.0 million in redirected funding from other related programs) for an ‘aged care gateway’, including a new My Aged Care website and national call centre;
• developing a national assessment framework and quality indicators to increase the transparency of aged care service provision. Quality indicators will be published on the My Aged Care website;

Statement 1: Budget Overview
1-28
• ensuring that aged care prices, including accommodation bonds, reflect the value of the service an individual receives, through the establishment of an Aged Care Financing Authority; and
• protecting and supporting older Australians receiving aged care services by investing $30.8 million over five years for aged care advocacy and community visitors programs.
The Government will also assist the aged care sector in better meeting the needs of aged care recipients, with investments including:
• $268.4 million to tackle dementia (including $135.1 million redirected from residential and home care), by increasing Government subsidies for the provision of aged care for people with dementia and enhancing the skills of aged care, primary care and acute care staff in working with people with dementia, including those with early onset dementia;
• $192 million (including $61.6 million redirected from residential and home care), to support the needs of older Australians from diverse backgrounds, including veterans and Indigenous Australians; and
• $80.2 million to improve palliative care services within the aged care sector, and to create better linkages between the aged care system and broader health system.
Opportunities of an ageing population
The Government has also recognised that the ageing of Australia’s population presents great opportunities for our community and economy. Seniors are not only living longer, they are generally better educated, healthier and more financially secure.
The Government is responding positively to the Final Report of the Advisory Panel on the Economic Potential of Senior Australians. The $41 million package focuses on the opportunities presented by maintaining the skills and experience of older Australians in the workforce.
The Government response includes $10 million for new Jobs Bonuses to help tackle age discrimination and encourage businesses to employ seniors who want to stay in the workforce. The new $1,000 Jobs Bonus will be introduced for employers who recruit and retain a mature-age jobseeker for three months.
The Government will also be providing $4.7 million to establish a new ongoing Advisory Panel on Positive Ageing, to consult with communities and to lead the national conversation on ageing issues.
The Government is also providing additional funding to the Age Discrimination Commissioner to undertake projects to address the stereotyping of older Australians

Statement 1: Budget Overview
1-29
through the media and within the broader Australian community, which manifests itself in the workplace.
INVESTING IN KEY HEALTH SERVICES
In August 2011, the Commonwealth and all States and Territories signed the historic $16.4 billion National Health Reform Agreement. This historic deal delivers funding certainty for hospitals with the Commonwealth guaranteeing 50 per cent of growth funding for hospitals. This funding is scaled up over time starting at 45 per cent in 2014-15 and moving to 50 per cent in 2017-18. These reforms are critical to ensuring Australia’s hospitals have the funding certainty they need into the future.
In addition, last year’s Budget announced $2.2 billion in funding for mental health reform across Australia.
Building on this investment, this Budget delivers key funding for dental health, provides access to new medicines and delivers on the Government’s regional health infrastructure commitments.
Delivering additional dental services
The Government is investing $515.3 million over four years in dental services to provide better access to dental care for those in need. This dental health package builds on commitments made in the 2011-12 Budget.
Dental health is an important part of general health but the treatment Australians receive varies across the population according to income. For some, the cost of dental treatment or long wait times for public dental services mean those on low incomes do not get dental care when they need it.
In this Budget, the Government is improving access to dental services and strengthening the future dental workforce by providing:
• $345.9 million over three years in funding to the States and Territories to provide treatment for those on public dental waiting lists including ensuring support for Indigenous Australians;
• $35.7 million over three years to expand the successful dentists’ graduate program;
• a $45.2 million investment over four years in oral health therapists to boost capacity in the public sector and in areas of need;
• $77.7 million over four years to encourage dentists to relocate to regional, rural and remote areas and set up practices; and
• $10.5 million over three years for national oral health promotion activities.

Statement 1: Budget Overview
1-30
In addition, funding will be provided to support the delivery of pro bono dental services for the most disadvantaged in our community.
The Government will redirect currently unallocated Commonwealth Dental Health Program funding towards this Budget’s dental health package. This funding was intended to replace the Chronic Disease Dental Scheme (CDDS) but has been redirected to boost dental services before the CDDS is closed and any new scheme commences. It still remains Government policy to close the CDDS.
Expanding hospitals and health services for regional Australia
The Government is investing $475 million to support the development of regional health infrastructure. This delivers on the Government’s $1.8 billion commitment to the Health and Hospitals Fund (HHF) Regional Priority Round.
This latest HHF round will fund 76 new projects across Australia. The funding will support upgrades to regional health infrastructure, expand regional hospitals, and support the clinical training capacity of regional hospitals into the future.
This investment will help improve the provision of health care in regional Australia and brings the total commitment in health and hospitals infrastructure under the HHF to $5.0 billion since 2009-10, across a total of 224 projects around Australia.
Further improving health services
This Budget makes important investments in Australia’s health system to improve health services for all Australians. Key investments include:
• $49.7 million over four years to expand the bowel cancer screening program to phase in increased frequency of bowel cancer screening over time to all Australians aged between 50 and 74 years. When fully implemented, this program is expected to help detect around 12,000 cancers and adenomas each year and significantly reduce deaths from colorectal cancer;
• an additional $233.7 million to progress the national e-Health agenda, including to enable the operation of the Personally Controlled Electronic Health Record (PCEHR) system. This builds on the Government’s $466.7 million investment from the 2010-11 Budget to establish the key components of the PCEHR system; and
• $49.3 million to ensure the National Medical Stockpile (NMS) is well placed for use in response to any emergency situation. The NMS supplements existing medical stocks held in the Australian hospital system and by states and territories.
In addition, since MYEFO, the Government has approved new listings or amendments to listings listed on the PBS, resulting in an overall saving of around $32.5 million.

Statement 1: Budget Overview
1-31
The total number of new medicines or brands of medicines approved by the Government for the PBS, Life Saving Drugs Program, and National Immunisation Program over the last four years is approximately 700, at a cost of around $4.5 billion.
Improving the sustainability of the Health Budget
As part of the Government’s commitment to responsible economic management, the Government has reprioritised health expenditure to ensure the funding is appropriately targeted to where it is most needed. This builds on past measures to ensure a sustainable health system, including the means testing of the private health insurance rebate, which will commence on 1 July 2012. These include:
• savings of around $163.5 million have been made to the PBS, arising from more competitively priced medicines, including the angiotensin II receptor antagonist therapeutic group and new indications for a number of medicines including dasatinib (Sprycel®), niliotinib (Tasigna®), and tocilizumab (Actemra®), as they can be used in place of more expensive medicines;
• making changes to the Medicare Benefits Schedule safety net including by reducing opportunities for practitioners to charge excessive fees. This will provide savings of $96.5 million over four years; and
• more effective targeting of the Practice Incentives Program worth $83.5 million over four years by ceasing the General Practice Immunisation Incentive, revising the e-Health Incentive eligibility requirements and increasing selected outcomes targets.
TRANSITIONING TO A CLEAN ENERGY FUTURE
The Australian Government has developed a comprehensive plan to move to a clean energy future. This is part of our long-term plan to reshape Australia’s economy, cut carbon emissions, drive innovation, and help avoid the increased costs of delaying action on climate change.
Central to that plan is the introduction of a carbon price that will cut emissions in the cheapest and most effective way. It will unleash innovation and spur around $100 billion of investment in new clean energy sources such as solar, geothermal and wind. The Carbon Pricing Mechanism will begin on 1 July 2012.
As part of the Clean Energy Future Package the Government is also making a significant commitment to environmental resilience through the $946 million Biodiversity Fund. In conjunction with the Caring for our Country initiative, the Fund is building greater environmental resilience across the Australian landscape by empowering land managers to restore, manage and protect biodiversity and to benefit from a low carbon future.

Statement 1: Budget Overview
1-32
The Government is also investing a further $2.2 billion over five years (from 2013-14) to support its Caring for our Country program. The funding will deliver the second phase of the program and ensure environmental and stakeholder needs are met.
By acting now, Australians can look forward to long-term prosperity, while protecting our environment for ourselves and for future generations.
EDUCATION — DELIVERING OUR REFORM AGENDA
The Government’s ambitious education reform agenda has entered the implementation phase and benefits are beginning to flow to students from early childhood through to university.
Early childhood
Research shows that a child’s first five years sets the course for the rest of their lives. The Australian Government, in partnership with state and territory governments, is making a record investment in early childhood, ensuring every child gets the best start in life.
Under these reforms, every child will have access to a quality early childhood education program, for at least 15 hours per week in the year before they start school. The new National Quality Agenda for early childhood education and care will also introduce improved, nationally-consistent educator-to-child ratios and staff qualification requirements.
Schools
The Government has invested record amounts in schooling, almost doubling Commonwealth expenditure on schooling since coming to office. This investment has delivered a computer for every secondary student in the country, rejuvenated school buildings across Australia, and contributed to improving the quality of our school teachers.
This Budget includes extra funding of $17.0 million for the Australian Curriculum, Assessment and Reporting Authority, to allow them to deliver on the national reform priorities agreed by Commonwealth, State and Territory education ministers.
The Government is currently working in a considered and collaborative way with the States and Territories, the non-government school sector and other stakeholders to consider future funding arrangements following the Review of Funding for Schooling Final Report. The Budget includes $5.8 million to conduct further policy and technical work, as recommended in the Final Report. This work will inform future school funding arrangements.

Statement 1: Budget Overview
1-33
Higher education
The Government is delivering on its substantial commitment to increasing funding to universities. Over the four years from 2012-13, the Government will invest $38.8 billion in higher education teaching and learning. Additionally, Government funding to the university sector in 2011 was around 30 per cent higher than in 2007. This is as a result of the Government’s response to the Bradley Review.
From 1 January 2012, the Government uncapped the number of Commonwealth supported places for undergraduate courses, resulting in a significant increase in university places. To implement this new demand-driven funding system, the 2012-13 Budget will provide an additional $1 billion for Commonwealth supported places at public universities. This brings the total additional demand-driven funding provided by the Government to $5.2 billion.
In this Budget, the Government is introducing a $54.0 million package of measures that aims to encourage participation, improve quality and supply of mathematics and science teachers, and reward high performing students to encourage them to continue on with their studies and ultimately to consider a career in maths and science.
Training more students in these fields will help Australia meet emerging skills shortages and deliver a highly skilled, productive and innovative workforce.
The Government is also re-affirming its commitment to helping disadvantaged students succeed at university, increasing investment for the Higher Education Participation and Partnerships Program and other equity measures to more than $1.0 billion over the forward estimates. In 2012, a record 40,000 university offers were made to disadvantaged students.
BUILDING THE INFRASTRUCTURE WE NEED
The 2012-13 Budget includes measures that invest in high-quality infrastructure projects, in order to expand capacity and boost productivity. This builds on the Government’s nation building programs, which is rolling out around $36 billion of funding over six years to 2013-14, and also the Government’s reforms to infrastructure financing which were announced in the 2011-12 Budget. The Government has now contributed funding towards all of the projects assessed as ‘ready to proceed’ on Infrastructure Australia’s 2009 Priority List.
Key measures in this Budget include $3.6 billion to duplicate the Pacific Highway, additional funding for the Roads to Recovery and Black Spots programs, a commitment to develop the Moorebank Intermodal Terminal and $232.1 million towards the Torrens and Goodwood rail project in Adelaide.

Statement 1: Budget Overview
1-34
Duplicating the Pacific Highway
The Australian Government will provide $3.6 billion between 2013-14 and 2016-17 towards the duplication of the Pacific Highway, conditional on a 50:50 funding share arrangement with the New South Wales Government. This will enable the Australian Government to meet its commitment to duplicate the Highway by 2016. A fully duplicated Pacific Highway will improve freight efficiency and transport safety, enhancing the nation’s economic development.
Strengthening our commitment to road safety
The Government will provide funding for key programs that focus on achieving road safety outcomes through its Nation Building 2 Program. This includes:
• $350.0 million a year for the Roads to Recovery program, which focuses on repairing and upgrading local roads to improve safety and access to services in our communities; and
• $60.0 million a year for the Black Spots program, which targets those road locations where crashes are occurring.
The Government remains committed to improving road infrastructure to ensure Australians have access to safe roads.
Improving the flow of freight to lift productivity
In this Budget, the Government has made a commitment to develop the Moorebank Intermodal Terminal in conjunction with the private sector, as a way to improve the movement of freight to and from Port Botany. The terminal will provide a much-needed integrated transport solution for the movement of freight to and within the Sydney basin, which will boost national productivity, reduce business costs and relieve bottlenecks and urban congestion. Importantly, the project will deliver on the Government’s commitment at the last Budget to seek opportunities for increased involvement by the private sector in nationally significant infrastructure projects.
The Government is also providing $232.1 million towards the Torrens and Goodwood rail project, which will help ease congestion on Adelaide’s suburban and freight rail networks.
ADVANCING AUSTRALIA’S NATIONAL SECURITY INTERESTS
This Budget reaffirms the Government’s long-standing commitment to protecting Australia and our national security interests. The 2012-13 Budget maintains Australia’s efforts in confronting global security challenges, including maintaining our presence in Afghanistan and supporting stability in East Timor and Solomon Islands.
The Government is funding new defence capabilities that are expected to be in high demand now and into the future. These investments include vital air and sea transport

Statement 1: Budget Overview
1-35
platforms, which support current operations and build on Australia’s capacity to respond to humanitarian crises and natural disasters domestically and in our region.
These investments are balanced by deferring some Defence acquisitions, adjusting the Defence capital equipment program and delivering further operating efficiencies while delivering priority 2009 Defence White Paper capabilities.
The Government has announced it will deliver a new Defence White Paper in 2013.
The 2012-13 Budget also provides enhanced law enforcement and border protection capabilities, which will maintain a strong surveillance presence in Australia’s northern waters, and provide cutting-edge forensic capabilities to the Australian Federal Police (AFP).
Supporting global security
Australia remains committed to efforts to improve global security. The Government is providing $1.3 billion in the 2012-13 Budget to continue operations in Afghanistan.
Australia’s military and civilian efforts in Afghanistan will support the Afghan Government to promote and sustain stability, and help ensure that Afghanistan never again becomes a safe haven and training ground for global terrorism.
The Government’s enduring commitment to the security of countries in our region is continued in this Budget, by providing $78.8 million to maintain the ADF operations in East Timor as important national elections are held this year, and $45.6 million to support stability in the Solomon Islands.
Enhancing defence capabilities
The Government is taking a balanced approach to upgrading the capabilities of the ADF to ensure that Australia is well-positioned to support our domestic and international commitments. The 2012-13 Budget includes:
• $123 million for an Offshore Support Vessel, the MSV Skandi Bergen, to supplement the ADF’s amphibious fleet. The MSV Skandi Bergen will be transferred to the Australian Customs and Border Protection Service on the introduction into service of the first Landing Helicopter Dock;
• $280.4 million for an additional C-17A Globemaster III heavy-lift aircraft, which will increase Australia’s heavy-lift fleet to six aircraft; and
• $39.8 million for an additional two CH-47D Chinook medium-lift transport helicopters, which will bring Australia’s total Chinook fleet to seven.
The Department of Defence will also contribute to broader government savings. There will be no adverse impact on operations in Afghanistan, East Timor and Solomon

Statement 1: Budget Overview
1-36
Islands. The provision of equipment to Defence personnel deployed or deploying overseas will not be adversely affected. There will be no adverse impact on the number of military personnel in the ADF.
Enhancing law enforcement
The Government will continue to maintain a strong surveillance presence in Australia’s northern waters, including through the purchase of a dedicated patrol boat to replace the leased Customs and Border Protection vessel ACV Ashmore Guardian. This will allow a near permanent surveillance and enforcement presence at Ashmore Reef to combat illegal fishing and people-smuggling.
The Government will also strengthen Australia’s national forensics and intelligence capabilities by building a new forensics facility for the AFP. This facility will ensure the AFP can continue to respond to major investigations of terrorism, transnational crime, people-smuggling and disaster victim identification.
Biosecurity
The Government is committed to ensuring Australia has a strong biosecurity system that facilitates trade and manages biosecurity risks to the environment, agriculture and human health. The 2012-13 Budget continues this commitment through $620 million for delivery of new post-entry quarantine infrastructure to maintain frontline operations and support eradication programs.
The Government will invest:
• $379.9 million over seven years to construct a new Commonwealth-operated post-entry quarantine station to replace existing stations as leases expire. The facility will commence operations in 2015-16 and be fully operational on completion in 2018-19;
• $144.3 million over four years to support frontline operations; and
• $95.9 million over seven years to support eradication programs for nationally significant agricultural and environmental pests and diseases.
PROVIDING ASSISTANCE IN OUR REGION AND BEYOND
The Government will provide $5.2 billion in 2012-13 to assist development in our region and beyond. This includes $384.5 million over four years to the Pacific to increase rates of child immunisation and improve access to education. A further $208.6 million over four years will be provided to improve development outcomes in East Asia, including expanded assistance to Burma and Cambodia for programs addressing maternal and child health and for climate change mitigation programs in Vietnam.

Statement 1: Budget Overview
1-37
The Government will continue to increase its Official Development Assistance (ODA) but delay meeting our 0.5 per cent ODA to Gross National Income target by one year to 2016-17. This will contribute to broader government savings. This will ensure our aid will still grow every year and remain on track to double between 2007-08 and 2014-15. Australia’s projected ODA contribution could see Australia rank as high as sixth in the OECD’s ODA donor ranking by 2015-16, up from tenth in 2011. The Government’s decision will ensure that ODA continues to grow.
COMMEMORATING THE CENTENARY OF ANZAC
Australia will commemorate the Centenary of Anzac from 2014 to 2018. The Government will spend $83.5 million over seven years on a package of measures to commemorate the Centenary.
Major measures in the Centenary of Anzac funding package include $27.0 million for the refurbishment of the Australian War Memorial’s First World War galleries, $8.1 million for honouring Australia’s war dead by developing and protecting war graves and memorials, and $9.5 million for local community grants to support activities in communities. The Government is also providing $5.6 million for the development of an Anzac Interpretative Centre at Albany, $4.7 million for Australian artists and cultural institutions to explore and contribute to the Anzac story, and $14.4 million to safely manage increased visitor demand to attend Anzac Day services during the Centenary.
STRONGER FUTURES IN THE NORTHERN TERRITORY
The Australian Government, in partnership with the Northern Territory Government, will provide a stronger future for Indigenous Australians in the Northern Territory through health services, education, employment, housing, nutrition and community safety, including by tackling drug and alcohol misuse.
The Commonwealth will continue efforts to Close the Gap in the Northern Territory through a ten-year commitment of around $3.4 billion, including:
• $713.5 million for primary health care and improved access to allied health services;
• $694.9 million for community safety, remote policing, and tackling alcohol abuse;
• $602.5 million to boost jobs and improve access to and quality of education;
• $442.4 million to strengthen the safety and wellbeing of Aboriginal children, youth and their families; and
• $427.4 million to improve remote engagement and coordination.

Statement 1: Budget Overview
1-38
REMOTE JOBS AND COMMUNITIES PROGRAM
The Government is introducing an over $1.5 billion new integrated Remote Jobs and Communities Program from 1 July 2013. It will establish a permanent provider presence in each region to deliver improved services that drive structural improvements to communities and individuals. This will result in improved employment outcomes. Key features include the:
• demand-driven ‘jobs first’ Remote Participation and Employment Service that directly responds to concerns raised by people in remote areas and helps people build the foundational life skills they need to take up available jobs;
• new Remote Youth Leadership and Development Corps, the flagship program for youth, aiming to promote a culture of change and provide a formalised pathway into employment for up to 12,000 young people; and
• Community Development Fund worth $237.5 million over five years to provide funding for larger community development activities and capacity-building.
Funding from Job Services Australia, Disability Employment Services, the Indigenous Employment Program, and the Community Development Employment Projects Program will be amalgamated in remote Australia into a single streamlined service.
The provision of Community Development Employment Projects wages for grandfathered recipients will also be extended for a further five years. The new Service aligns with the Stronger Futures in the Northern Territory initiative and the Government’s Closing the Gap agenda.

2-1
STATEMENT 2: ECONOMIC OUTLOOK
This statement presents the economic forecasts that underlie the Budget estimates.
Overview ....................................................................................................... 2-3 Summary of forecasts .................................................................................................. 2-9
The outlook for the international economy ............................................. 2-13
The outlook for the domestic economy ................................................... 2-17 Demand and output .................................................................................................... 2-17 Household consumption ............................................................................................. 2-20 Dwelling investment ................................................................................................... 2-22 Business investment .................................................................................................. 2-23 Public final demand .................................................................................................... 2-26 Exports and imports ................................................................................................... 2-26 Terms of trade ............................................................................................................ 2-29 Current account balance ............................................................................................ 2-30 Labour market ............................................................................................................ 2-32 Wages ........................................................................................................................ 2-34 Consumer prices ........................................................................................................ 2-34 Incomes ...................................................................................................................... 2-37 Medium-term projections ............................................................................................ 2-37


2-3
STATEMENT 2: ECONOMIC OUTLOOK
The Australian economy is forecast to grow around trend in 2012-13 and 2013-14, outperforming most of the developed world. While global financial market tensions eased in the early months of 2012 following the acute bout of instability in late 2011, global conditions remain weak, particularly in the major advanced economies, and financial markets are fragile.
Against this backdrop, the global economy is undergoing dramatic structural change as the weight of economic activity shifts towards Asia and this has significant implications for Australia. Strong demand from Asia is expected to continue to support historically high commodity prices, drive record levels of investment in resources and resources-related projects in Australia and underpin solid growth in export volumes.
Nonetheless, conditions in some parts of the economy are likely to remain challenging, with unsettled global conditions, the high Australian dollar, ongoing consumer caution and changes in expenditure patterns all expected to weigh heavily on some sectors.
Despite this, Australia’s economic outlook remains positive, with economic growth expected to be solid, the unemployment rate expected to remain low and inflation likely to be well contained.
OVERVIEW
The fundamentals of the Australian economy remain strong and the outlook is favourable, with solid growth, low unemployment and well-contained inflation.
The level of output is well above pre-global financial crisis levels and the economy is expected to grow around its trend rate over the next two years. GDP growth is forecast to be 3¼ per cent in 2012-13 and 3 per cent in 2013-14, with the economy expected to outperform every major advanced economy over this period (Chart 1).
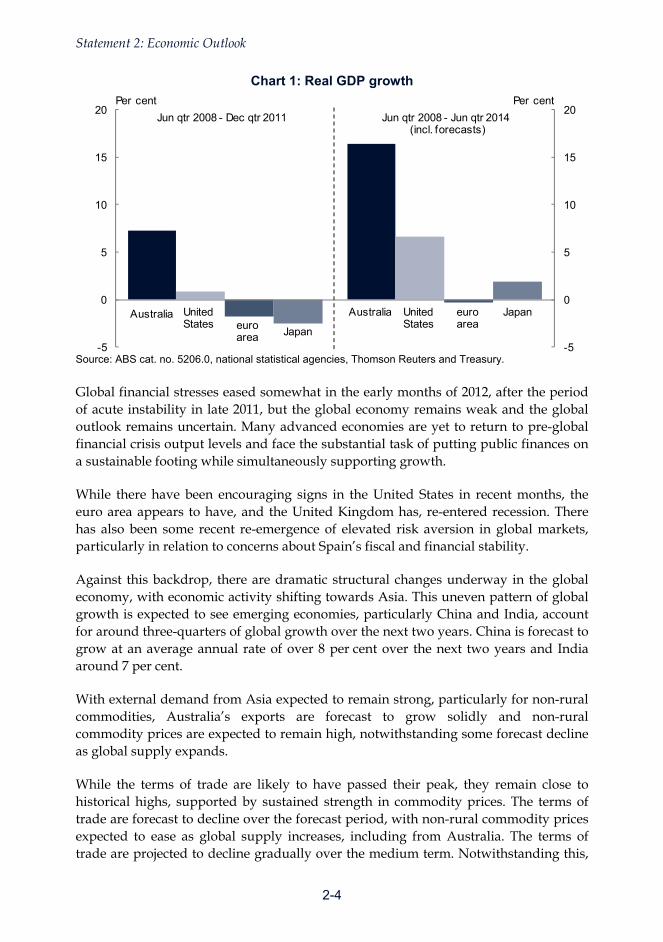
Statement 2: Economic Outlook
2-4
Chart 1: Real GDP growth
-5
0
5
10
15
20
-5
0
5
10
15
20
Australia United States euro
area Japan
Australia United States
euro area
Japan
Per cent Per cent
Jun qtr 2008 - Dec qtr 2011 Jun qtr 2008 - Jun qtr 2014(incl. forecasts)
Source: ABS cat. no. 5206.0, national statistical agencies, Thomson Reuters and Treasury.
Global financial stresses eased somewhat in the early months of 2012, after the period of acute instability in late 2011, but the global economy remains weak and the global outlook remains uncertain. Many advanced economies are yet to return to pre-global financial crisis output levels and face the substantial task of putting public finances on a sustainable footing while simultaneously supporting growth.
While there have been encouraging signs in the United States in recent months, the euro area appears to have, and the United Kingdom has, re-entered recession. There has also been some recent re-emergence of elevated risk aversion in global markets, particularly in relation to concerns about Spain’s fiscal and financial stability.
Against this backdrop, there are dramatic structural changes underway in the global economy, with economic activity shifting towards Asia. This uneven pattern of global growth is expected to see emerging economies, particularly China and India, account for around three-quarters of global growth over the next two years. China is forecast to grow at an average annual rate of over 8 per cent over the next two years and India around 7 per cent.
With external demand from Asia expected to remain strong, particularly for non-rural commodities, Australia’s exports are forecast to grow solidly and non-rural commodity prices are expected to remain high, notwithstanding some forecast decline as global supply expands.
While the terms of trade are likely to have passed their peak, they remain close to historical highs, supported by sustained strength in commodity prices. The terms of trade are forecast to decline over the forecast period, with non-rural commodity prices expected to ease as global supply increases, including from Australia. The terms of trade are projected to decline gradually over the medium term. Notwithstanding this,

Statement 2: Economic Outlook
2-5
high commodity prices and activity in the resources sector should continue to support incomes and activity in the broader economy.
Robust demand in Asia should continue to underpin the strong outlook for the resources sector, where investment has reached unprecedented levels. Businesses expect to invest a record $120 billion in the resources sector in 2012-13, around 150 per cent higher than its level just two years before, and 13 times the level of investment before the first phase of the boom. The resources investment pipeline is currently over $450 billion, with more than half of these projects already committed or under construction. Over the forecast period, new business investment as a proportion of GDP is expected to reach its highest level on record.
Strong growth in the resources sector is expected to continue to spill over into other sectors, including parts of the construction sector, parts of manufacturing and parts of the services sector. Together, the resources and the resources-related sectors of the economy are expected to account for 15 to 20 per cent of total GDP over the forecast horizon and grow by an average of nearly 9 per cent per year (Chart 2). However, conditions remain difficult for those sectors not benefiting directly or indirectly from the resources boom. Many sectors are facing challenging conditions from the high Australian dollar, ongoing global instability and uncertainty, and consumer caution.
The high Australian dollar is weighing particularly heavily on trade-exposed sectors of the economy such as manufacturing and tourism. Ongoing global uncertainty has also reinforced the cautious behaviour that consumers have shown since the global financial crisis and they remain reluctant to take on more debt. This is particularly challenging for the retail sector and other sectors linked to the retail sector such as wholesale trade and road transport. Weak demand and tight credit conditions are also making conditions challenging in parts of the construction sector. While some of the headwinds outside the resources sector are likely to be temporary, some are structural, reflecting the transition that is currently underway across the economy. Overall, the non-resources part of the economy is forecast to grow at a below-trend average annual rate of 2 per cent over the next two years.

Statement 2: Economic Outlook
2-6
Chart 2: Growth in resources/resources-related and non-resources activity
0
2
4
6
8
10
12
0
2
4
6
8
10
12
2003-04 to2005-06
2005-06 to2007-08
2007-08 to2009-10
2009-10 to2011-12
2011-12 to2013-14
Non-resources Resources and resources-related
Per cent, average annual grow th Per cent, average annual grow th
Forecasts
Note: Bars are the average annual growth rate over the two financial years. Growth in 2011-12 is an estimate. Source: ABS cat. no. 5206.0, 5209.0 and Treasury.
Within the non-resources part of the economy, there is also considerable divergence between sectors and even within sectors. Indeed a complex transition is taking place in the economy, only part of which is driven by the resources boom and the high Australian dollar. Further dimensions of this transition are being driven by shifts in household spending patterns towards services, changed attitudes towards debt, broader competitive pressures and technological change, which are leading to shifts in the patterns of domestic and external demand.
These forces are being reflected in significant shifts in the sectoral composition of growth and employment which have more dimensions than suggested by the simple resources/non-resources divide. The patchwork economy is multifaceted. While growth in the resources part of the economy has been exceptional in recent years, there has also been strong growth in sectors such as health care and social assistance, professional scientific and technical services, and education and training. At the same time, conditions have been particularly challenging in retail trade, manufacturing and non-resources related construction. However, even within the slower growing sectors there have been pockets of strength. More generally there is ongoing product and process innovation right across the economy as businesses adjust their business models to take advantage of emerging opportunities.
The complexity of the transition is also reflected in the labour market. While employment growth has been weak in some non-resources sectors, there has been strong growth in others. Despite the geographic concentration of resources activity and employment, the aggregate unemployment rate has remained low and the dispersion

Statement 2: Economic Outlook
2-7
of regional unemployment rates has continued to decline since the start of the mining boom. The continued fall in the regional dispersion of unemployment over this period shows that, despite the uneven pattern of growth in the economy and across regions, the benefits of the strong economy are being spread broadly across Australia.
Employment growth is expected to remain solid over the forecast period, but reflect the uneven growth pattern across the economy. While employment in the resources sector and parts of the services sector has grown solidly over the past year, aggregate employment growth has slowed after robust growth in 2010, as continued global weakness and instability, the high dollar, cautious consumer behaviour and shifting patterns of domestic spending have seen employers reluctant to take on new workers.
Notwithstanding the unevenness in the patchwork economy, the unemployment rate has remained low and been relatively stable. At close to 5 per cent, it is also lower than in most other advanced countries. The unemployment rate is around half that in the euro area and significantly below that in the United States. In aggregate, employment is expected to grow 1¼ per cent through the year to the June quarter of 2013 and 1½ per cent through the year to the June quarter of 2014. The unemployment rate is expected to drift up to 5½ per cent by the June quarter of 2013. With the economy growing around trend, inflation is expected to remain contained, notwithstanding a temporary increase associated with the introduction of a carbon price in 2012-13.
The outlook for trend growth in the economy over the next two years is consistent with the fiscal consolidation being undertaken by the Commonwealth and state governments. As is standard practice, the forecasts assume policy interest rates move broadly in line with market expectations at the time that the forecasts are finalised, with the market expectation at that time being that policy interest rates would be lower over the coming year. The planned fiscal consolidation should continue to provide scope for monetary policy to be eased, if appropriate, without generating price and wage pressures. The impact of the fiscal consolidation, particularly in 2012-13, should be more than offset by growth in private demand, particularly from the resources sector, with the aggregate economy growing around trend.
Although the outlook for the Australian economy is positive, substantial downside risks remain. The key international risk is the potential for a re-escalation of the euro area sovereign debt crisis. The capacity of many advanced economies to respond is limited and any further weakness could flow through to the emerging economies of Asia and to Australia. The prospect of a sharp rise in oil prices in the event of escalating tensions in the Middle East is also a risk to the global outlook.
Domestically, the transition taking place in the economy poses a risk for the labour market as these transitional frictions could see a temporary rise in the unemployment rate while businesses adjust to the evolving patterns of demand.

Statement 2: Economic Outlook
2-8
Box 1: International comparisons
Australia’s economy continues to outperform most other advanced economies. Australia has outperformed nearly all advanced economies since the global financial crisis with both economic growth and employment growth much stronger.
The Australian economy has grown by over 7 per cent on its pre-GFC levels. By contrast, the United States economy has grown by around 1½ per cent, and both the euro area and Japan have not made up lost ground (Chart A).
Chart A: GDP international comparison
90
95
100
105
110
90
95
100
105
110
Jun-08 Mar-10 Dec-11
Australia
euro area
United States
Japan
Index (Jun-08=100)
Source: ABS cat. no. 5206.0, national statistical agencies, Thomson Reuters and Treasury.
Australia’s outperformance is expected to continue. By the end of the forecast period, cumulative growth of Australian GDP since the GFC is expected to have been around 16½ per cent. This is well above that expected from the United States (around 6½ per cent), Japan (around 2 per cent) and the euro area (which is expected to have not made up the lost ground by the end of the period).
This outperformance has also been reflected in much stronger labour market outcomes in Australia.
Australia’s labour market has performed strongly since the onset of the global financial crisis in September 2008.
While many advanced economies experienced significant rises in their unemployment rates during the global financial crisis, the unemployment rate rose less than 2 percentage points in Australia — from 4.0 to 5.9 per cent (Chart B).
Chart B: Unemployment rates
2
4
6
8
10
12
2
4
6
8
10
12
Jun-08 Sep-09 Dec-10 Mar-12
Per cent Per cent
Australia
Canada
euro area
United States
Source: ABS cat. no. 6202.0, national statistical agencies, Thomson Reuters and Treasury.
Following the global financial crisis, strong employment growth saw the Australian unemployment rate fall to around 5 per cent.

Statement 2: Economic Outlook
2-9
Box 1: International comparisons (continued)
More recently, in Australia, the high dollar and global weakness and instability have unsettled consumers and made businesses more hesitant in their hiring decisions, which has led to much slower employment growth over the past year. The slowdown follows particularly strong employment growth in 2010, reflecting pre-emptive hiring in some sectors.
In contrast, employment in the United States and euro area is yet to return to pre-crisis levels (Chart C).
While Australia has added more than 750,000 jobs since the end of 2007, more than 25 million jobs have been lost around the world, including more than 3 million in the euro area and around 5 million in the United States. There are now around 200 million unemployed people worldwide.
Chart C: Employment
90
95
100
105
110
90
95
100
105
110
Jun-08 Sep-09 Dec-10 Mar-12
Australia US
Japan euro area
Index (Jun-08=100)
Note: Data for the euro area are quarterly. Employment data for Japan from March 2011 to August 2011 are not available due to the impacts of the Japanese earthquake and tsunami. Source: ABS cat. no. 6202.0, national statistical agencies, Thomson Reuters and Treasury.
However, despite a range of pressures, the Australian unemployment rate has remained low, and at 5.2 per cent is lower than in every major advanced economy except Japan.
Summary of forecasts
World GDP growth is expected to pick up over the forecast period, albeit from a position of considerable weakness, as strong growth in emerging market economies moderates slightly and recoveries in the large advanced economies slowly gather momentum. The world economy is forecast to grow 3½ per cent in 2012, 4 per cent in 2013 and 4¼ per cent in 2014.
Australia’s major trading partners (export weighted) as a group are expected to grow strongly over the forecast period, reflecting the rapid growth of emerging Asia, particularly China. Major trading partner growth is forecast to be 4¼ per cent in 2012 and 5 per cent in both 2013 and 2014.
Australia's real GDP is forecast to grow 3¼ per cent in 2012-13 and 3 per cent in 2013-14 (Chart 3). The main drivers of economic growth are expected to be business investment and exports.

Statement 2: Economic Outlook
2-10
Chart 3: Growth in real GDP
-4
-2
0
2
4
6
8
-4
-2
0
2
4
6
8
1993-94 1998-99 2003-04 2008-09 2013-14
Per centPer cent
30-year average
Fore
cast
s
Source: ABS cat. no. 5206.0 and Treasury.
Household consumption is expected to grow moderately over the forecast period, broadly in line with household income growth. Nevertheless, consumers remain cautious and the household saving rate is expected to remain elevated. Household consumption is expected to grow 3 per cent in both 2012-13 and 2013-14.
Dwelling investment is expected to remain subdued over the forecast period, with households reluctant to take on more debt and some investors hesitant because of the prospect of continued subdued house price growth. Dwelling investment growth is expected to be flat in 2012-13 before rising to 2½ per cent in 2013-14.
New business investment is expected to continue growing strongly over the forecast period, reaching a record share of GDP in 2013-14. This reflects an expectation of unprecedented investment in the resources sector, with investment elsewhere in the economy expected to be more subdued. New business investment growth is expected to be a strong 12½ per cent in 2012-13 and 8 per cent in 2013-14.
Public final demand is expected to fall in 2012-13 and remain flat in 2013-14, with falling Commonwealth Government spending in 2012-13 partially offset by modest increases in state spending, consistent with recent state budget updates, notwithstanding the fiscal consolidation plans announced by most state governments.
Exports are expected to grow 4½ per cent in each of 2012-13 and 2013-14 as non-rural commodity export capacity continues to expand to meet global demand. However, the high Australian dollar is expected to weigh on growth of exports of manufactures and services, notwithstanding the positive outlook for major trading partner growth.
Imports are expected to grow 7½ per cent in 2012-13 and 5½ per cent in 2013-14, underpinned by record levels of investment in the resources sector and the high

Statement 2: Economic Outlook
2-11
Australian dollar. While import growth is expected to be broad-based, capital goods imports associated with the booming liquefied natural gas sector are expected to be a key driver of the increase.
The terms of trade are expected to decline 5¾ per cent in 2012-13 and 3¼ per cent in 2013-14, as increases in global supply, led by Australia, place downward pressure on non-rural commodity prices. Despite these forecast falls, the terms of trade are expected to remain close to their highest sustained levels in 140 years.
The current account deficit is expected to widen to 4¾ per cent of GDP in 2012-13 and 6 per cent of GDP in 2013-14. This largely reflects the forecast shift of the trade balance from surplus in 2011-12 to deficit in both 2012-13 and 2013-14 because of a strong rise in resources investment-related imports and the expected decline in the terms of trade.
Employment growth is expected to be 1¼ per cent through the year to the June quarter of 2013 and 1½ per cent through the year to the June quarter of 2014, reflecting solid overall economic growth, notwithstanding the challenging conditions in some sectors of the economy. The unemployment rate is expected to drift up to 5½ per cent by the end of 2012-13 and remain there through 2013-14. The participation rate is forecast to remain close to historical highs at around 65¼ per cent.
Wages growth is expected to remain around trend over the forecast period, in line with expected subdued labour market conditions and the moderate inflation outlook. The Wage Price Index is expected to grow 3¾ per cent through the year to the June quarters of both 2013 and 2014.
Underlying inflation is expected to be 2¾ per cent through the year to the June quarter of 2013, including a ¼ of a percentage point increase from the introduction of the carbon price in 2012-13. Underlying inflation is expected to ease to 2½ per cent through the year to the June quarter of 2014.
Headline inflation is expected to be 3¼ per cent through the year to the June quarter of 2013, including a ¾ of a percentage point increase from the introduction of the carbon price. Headline inflation is expected to ease to 2½ per cent through the year to the June quarter of 2014.
Nominal GDP is expected to grow 5 per cent in 2012-13 and 5¼ per cent in 2013-14, reflecting forecast close-to-trend growth in the real economy and the expected decline in the terms of trade.

Statement 2: Economic Outlook
2-12
Table 1: Domestic economy forecasts(a)
Outcomes(b)
2010-11 2011-12 2012-13 2013-14
Panel A - Demand and output(c)Household consumption 3.1 3 1/4 3 3Private investment Dwellings 3.0 -1 0 2 1/2 Total business investment(d) 5.6 18 12 1/2 8 Non-dwelling construction(d) 8.8 25 14 7 1/2 Machinery and equipment(d) 3.0 16 1/2 12 1/2 8 1/2Private final demand(d) 3.3 6 5 4 1/4Public final demand(d) 3.4 1 1/2 - 1/2 0Total final demand 3.3 5 3 3/4 3 1/4Change in inventories(e) 0.5 0 0 0Gross national expenditure 3.8 5 4 3 1/2Exports of goods and services 0.2 4 4 1/2 4 1/2Imports of goods and services 10.4 12 1/2 7 1/2 5 1/2 Net exports(e) -2.0 -2 - 3/4 - 1/2Real gross domestic product 2.0 3 3 1/4 3 Non-farm product 1.9 3 1/4 3 1/4 3 Farm product 7.1 -6 2 1Nominal gross domestic product 8.3 5 1/2 5 5 1/4Panel B - Other selected economic measuresExternal accounts Terms of trade 20.6 3 1/4 -5 3/4 -3 1/4 Current account balance (per cent of GDP) -2.4 -3 -4 3/4 -6Labour market Employment (labour force survey basis)(f) 2.2 1/2 1 1/4 1 1/2 Unemployment rate (per cent)(g) 4.9 5 1/4 5 1/2 5 1/2 Participation rate (per cent)(g) 65.5 65 1/4 65 1/4 65 1/4Prices and wages Consumer price index(h) 3.6 1 1/4 3 1/4 2 1/2 Gross non-farm product deflator 6.0 2 1/2 1 3/4 2 1/4 Wage price index(f) 3.8 3 1/2 3 3/4 3 3/4
Forecasts
(a) Percentage change on preceding year unless otherwise indicated. (b) Calculated using original data unless otherwise indicated. (c) Chain volume measures except for nominal gross domestic product which is in current prices. (d) Excluding second-hand asset sales from the public sector to the private sector. (e) Percentage point contribution to growth in GDP. (f) Seasonally adjusted, through-the-year growth rate to the June quarter. (g) Seasonally adjusted rate in the June quarter. (h) Through-the-year growth rate to the June quarter. Note: The forecasts for the domestic economy are based on several technical assumptions. The exchange rate is assumed to remain around its recent average level — a trade-weighted index of around 77 and a US$ exchange rate of around 103 US cents. Interest rates are assumed to move broadly in line with market expectations at the time the forecasts were finalised. World oil prices (Malaysian Tapis) are assumed to remain around US$126 per barrel. The farm sector forecasts are based on a return to average seasonal conditions over 2012-13 and 2013-14. Source: ABS cat. no. 5206.0, 5302.0, 6202.0, 6345.0, 6401.0, unpublished ABS data and Treasury.

Statement 2: Economic Outlook
2-13
THE OUTLOOK FOR THE INTERNATIONAL ECONOMY
Global financial stresses eased somewhat in the early months of 2012, after the period of acute instability in late 2011, but the global outlook remains weak and uncertain, and substantial downside risks remain. It is likely that the uncertainty and associated volatility in financial markets will continue for some time. Economic conditions in the United States are looking more promising, but many advanced countries, including the euro area and the United States, face the significant task of rebuilding after the global financial crisis, while the euro area is also managing the effects of the sovereign debt crisis.
Output is well below potential in many advanced economies and these countries face a significant task of setting public finances on a sustainable footing, while supporting growth. The euro area appears to have, and the United Kingdom has, re-entered recession, and while the downturn is expected to be moderate in the absence of a re-intensification of the sovereign debt crisis, the recovery is also expected to be moderate at best.
Growth in the emerging economies as a whole remains relatively robust. While growth in China has moderated to a more sustainable pace in line with policy makers’ intentions, the Chinese economy is expected to continue to grow solidly. This should provide some support for other emerging Asian economies which have been affected by weakness in the euro area and the subdued recovery in the United States.
Chart 4: World GDP growth
-2
0
2
4
6
8
-2
0
2
4
6
8
1984 1989 1994 1999 2004 2009 2014
Fore
cast
sPer cent Per cent
Source: IMF World Economic Outlook April 2012, Thomson Reuters and Treasury.
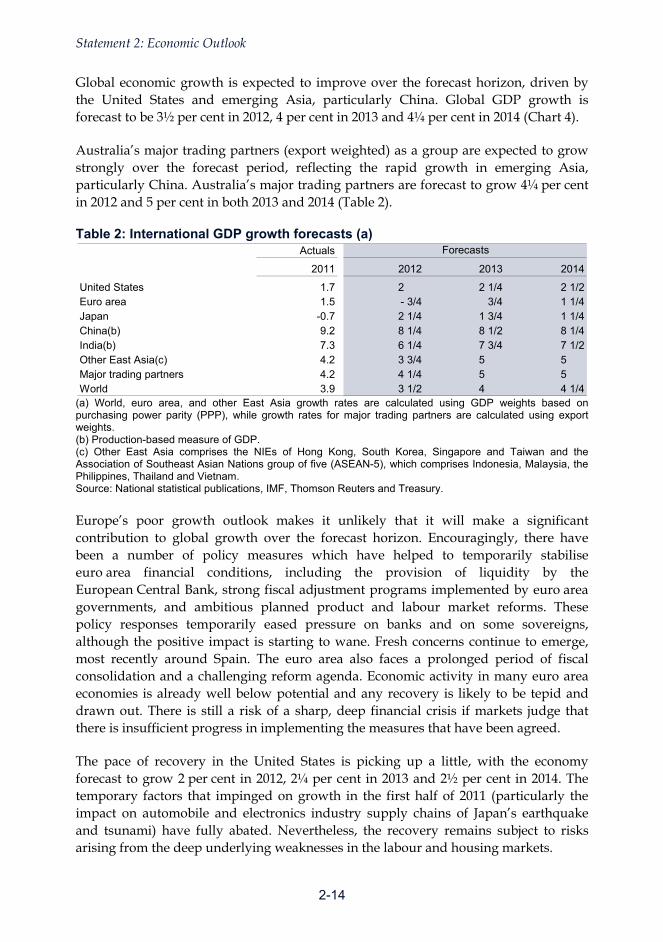
Statement 2: Economic Outlook
2-14
Global economic growth is expected to improve over the forecast horizon, driven by the United States and emerging Asia, particularly China. Global GDP growth is forecast to be 3½ per cent in 2012, 4 per cent in 2013 and 4¼ per cent in 2014 (Chart 4).
Australia’s major trading partners (export weighted) as a group are expected to grow strongly over the forecast period, reflecting the rapid growth in emerging Asia, particularly China. Australia’s major trading partners are forecast to grow 4¼ per cent in 2012 and 5 per cent in both 2013 and 2014 (Table 2).
Table 2: International GDP growth forecasts (a) Actuals
2011 2012 2013 2014
United States 1.7 2 2 1/4 2 1/2Euro area 1.5 - 3/4 3/4 1 1/4Japan -0.7 2 1/4 1 3/4 1 1/4China(b) 9.2 8 1/4 8 1/2 8 1/4India(b) 7.3 6 1/4 7 3/4 7 1/2Other East Asia(c) 4.2 3 3/4 5 5Major trading partners 4.2 4 1/4 5 5World 3.9 3 1/2 4 4 1/4
Forecasts
(a) World, euro area, and other East Asia growth rates are calculated using GDP weights based on purchasing power parity (PPP), while growth rates for major trading partners are calculated using export weights. (b) Production-based measure of GDP. (c) Other East Asia comprises the NIEs of Hong Kong, South Korea, Singapore and Taiwan and the Association of Southeast Asian Nations group of five (ASEAN-5), which comprises Indonesia, Malaysia, the Philippines, Thailand and Vietnam. Source: National statistical publications, IMF, Thomson Reuters and Treasury.
Europe’s poor growth outlook makes it unlikely that it will make a significant contribution to global growth over the forecast horizon. Encouragingly, there have been a number of policy measures which have helped to temporarily stabilise euro area financial conditions, including the provision of liquidity by the European Central Bank, strong fiscal adjustment programs implemented by euro area governments, and ambitious planned product and labour market reforms. These policy responses temporarily eased pressure on banks and on some sovereigns, although the positive impact is starting to wane. Fresh concerns continue to emerge, most recently around Spain. The euro area also faces a prolonged period of fiscal consolidation and a challenging reform agenda. Economic activity in many euro area economies is already well below potential and any recovery is likely to be tepid and drawn out. There is still a risk of a sharp, deep financial crisis if markets judge that there is insufficient progress in implementing the measures that have been agreed.
The pace of recovery in the United States is picking up a little, with the economy forecast to grow 2 per cent in 2012, 2¼ per cent in 2013 and 2½ per cent in 2014. The temporary factors that impinged on growth in the first half of 2011 (particularly the impact on automobile and electronics industry supply chains of Japan’s earthquake and tsunami) have fully abated. Nevertheless, the recovery remains subject to risks arising from the deep underlying weaknesses in the labour and housing markets.

Statement 2: Economic Outlook
2-15
Two years after the end of the recession there have been some encouraging signs that the long-awaited recovery in the United States’ labour market may be underway. Employment growth is strengthening and the unemployment rate has been falling since the end of 2011. However, unemployment is still historically high, and includes a large number of long-term unemployed. An historically low participation rate (around a 30-year low) suggests that the labour market still has a long way to go before it returns to pre-global financial crisis conditions. In addition, the depressed housing market remains a constraint on growth, with a recovery still some way off due to the need to absorb the large housing inventory.
A key risk for the United States’ outlook beyond 2012 is the ability to strike the appropriate balance between short-term fiscal support and medium-term fiscal consolidation. While Congress delayed a fiscal contraction earlier this year by extending the payroll tax cut and unemployment benefits that were originally legislated to expire at the end of 2011, it will face some difficult fiscal policy decisions in late 2012 that will have a large bearing on subsequent years. Markets continue to be sanguine about the ability of the United States to meet its sovereign debt obligations, with the yield on 10-year United States’ Treasuries around a 60-year low. However, there is a risk that market concerns will emerge in the absence of a credible and substantive medium-term fiscal consolidation plan.
Economic conditions in China are expected to remain solid, despite some slowing in domestic activity and the deterioration in external demand, especially from the euro area. China is forecast to grow a little over 8 per cent in each of 2012, 2013 and 2014. Activity is generally moderating in line with the Chinese Government’s intentions, with inflation having eased noticeably since mid-2011. With inflationary pressure likely to continue easing, policy makers are turning their attention to supporting sustainable growth.
Should external or domestic conditions deteriorate, China has the capacity to use macroeconomic policy to stimulate growth. However, the Chinese Government is likely to be more cautious in funding stimulus through the banking system than at the time of the GFC. Monetary policy has already tentatively shifted towards supporting growth. Selective monetary easing and an increase in credit to relieve stress amongst small and medium-sized enterprises are already underway. Furthermore, the extension of new loans is likely to be somewhat higher than last year, supported by government regulation to increase the funds available for banks to make loans.
Elsewhere in Asia, the outlook remains positive, with the region showing signs of recovery after being affected by weakness in the euro area last year. Japan’s post-disaster recovery stalled in the December quarter, due largely to external factors, but is expected to get back on track as 2012 progresses. India’s economy experienced a policy-induced slowing in 2011, but growth is expected to remain solid. Thailand’s unprecedented floods led to sharply lower production in late 2011, but the economy, and affected regional production chains, are expected to recover strongly in 2012.

Statement 2: Economic Outlook
2-16
Global growth forecasts are for sustained, albeit below-trend, growth this year. However, risks to the outlook remain firmly to the downside. A re-escalation of the euro area sovereign debt crisis remains the key risk to the global recovery. Actions by the European Central Bank to inject liquidity into the European financial system in December 2011 and February 2012 have lessened the risk of a near-term European banking crisis, providing some necessary breathing space for reforms. The recent agreement of the IMF membership to boost the institution’s lending capacity by more than US$430 billion is also a positive development, helping to bolster the global firewall to better guard against contagion. Nevertheless, with uncertainty over the sustainability of agreed austerity and structural reform measures in a number of euro area countries, the threat of further contagion from the euro area sovereign debt crisis persists.
Conditions in Europe, and in global financial markets, are fragile. Indeed, the actions of the European Central Bank have wedded many financial institutions even more closely to the euro area’s sovereign debt. Substantial fiscal and structural reforms are needed to resolve the euro area sovereign debt crisis and boost growth and employment. There is still the potential for events to derail the progress achieved to date and for this to happen quickly.
Global oil prices have been drifting upwards since mid-February 2012, although it is difficult to disentangle how much of this reflects political tensions surrounding the Middle East, and how much stems from other factors. For example, improving sentiment over the economic prospects for the United States and the global economy, and oil supply disruptions in Syria, Yemen and Sudan have all played a role in pushing oil prices higher since the start of 2012. If tensions in the Middle East escalate, a sharp rise in oil prices could occur. A significant and sustained oil price shock would pose a major risk to global economic growth prospects.

Statement 2: Economic Outlook
2-17
THE OUTLOOK FOR THE DOMESTIC ECONOMY
Demand and output
The Australian economy is expected to grow at around trend over the next two years, with real GDP growth forecast to be 3¼ per cent in 2012-13 and 3 per cent in 2013-14.
Growth is expected to be driven by surging resources sector investment and growth in non-rural commodity exports. Growth is also expected to be supported by moderate growth in household consumption. However, there is expected to be little contribution from either dwelling investment or public spending (Chart 5).
Economic conditions are expected to remain uneven across sectors over the forecast period. The resources and resources-related parts of the economy are expected to grow strongly, but activity in other parts of the economy is likely to be uneven. While some parts of the services sector are expected to continue performing solidly, pressures from the ongoing global uncertainty, the high Australian dollar, consumer caution and changes in expenditure patterns (Box 4) are all expected to continue to weigh heavily on other sectors, particularly retailing, manufacturing and tourism.
Chart 5: Contributions to real GDP growth
-3
-2
-1
0
1
2
3
4
5
-3
-2
-1
0
1
2
3
4
5
2011-12 2012-13 2013-14
Household consumption
Dw elling investment
Business investment
Public expenditure
Inventories
Exports
Imports
GDP
Percentage points Percentage points
Note: Business investment and public expenditure are adjusted for second-hand asset sales from the public sector to the private sector. Source: ABS cat. no. 5206.0 and Treasury.

Statement 2: Economic Outlook
2-18
Box 2: Direct spillovers from the resources boom
The mining sector (which includes liquefied natural gas) directly produces over 9 per cent of the economy’s output and employs around 2 per cent of the workforce. While the mining sector is still relatively small, it is contributing both directly and indirectly to higher activity across a range of other sectors in the economy.
A substantial part of resources-related activity is occurring in the construction sector. The construction sector supports the mining sector through the construction of mines and plants, road and rail infrastructure, and through dwelling construction. With other areas of construction weak, mining sector demand is providing timely support for the sector. Around 60 per cent of capital expenditure on buildings and other structures over the past year has been mining related, up from 29 per cent at the start of the mining boom in 2003-04 (Chart A).
Chart A: Buildings and other structures (capital expenditure)
0
100
200
300
400
500
600
700
800
900
0
100
200
300
400
500
600
700
800
900
2002-03 2006-07 2010-11
Index (2002-03=100)
Mining construction
Non-mining construction
Source: ABS cat. no. 5625.0 and Treasury.
There is also resources-related activity occurring in the manufacturing sector, especially in that part which makes specialised machinery for mining. The mining sector also generates investment in research and development and mineral and petroleum exploration, which have grown strongly in recent years.
The resources sector supports activity in the transport sector as a significant user of road and rail networks, port facilities and shipping.
The resources sector also has direct spillovers to the services sector, including, for example, the financial and insurance services sector, and the professional, scientific and technical services sector, which has grown strongly in recent years (Chart B).
Chart B: Professional, scientific and technical services
100
110
120
130
140
150
100
110
120
130
140
150
2002-03 2006-07 2010-11
Gross value added -professional, scientif ic,and technical services sector GDP
Index (2002-03=100)
Source: ABS cat. no. 5206.0 and Treasury.
The Government is also helping spread the benefits of the boom, for example, through the Minerals Resource Rent Tax and other targeted policy initiatives.
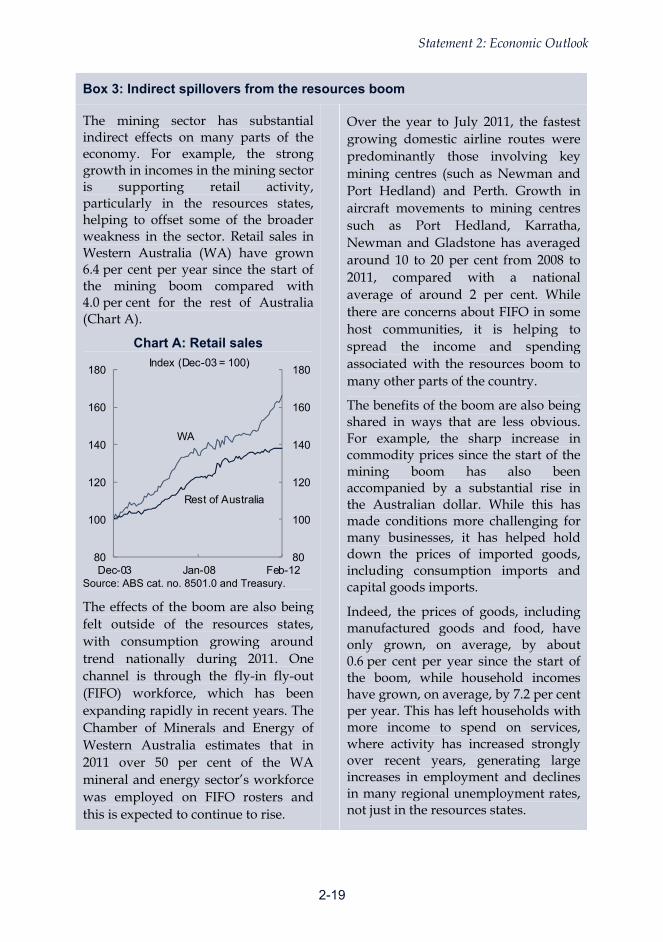
Statement 2: Economic Outlook
2-19
Box 3: Indirect spillovers from the resources boom
The mining sector has substantial indirect effects on many parts of the economy. For example, the strong growth in incomes in the mining sector is supporting retail activity, particularly in the resources states, helping to offset some of the broader weakness in the sector. Retail sales in Western Australia (WA) have grown 6.4 per cent per year since the start of the mining boom compared with 4.0 per cent for the rest of Australia (Chart A).
Chart A: Retail sales
80
100
120
140
160
180
80
100
120
140
160
180
Dec-03 Jan-08 Feb-12
Rest of Australia
WA
Index (Dec-03 = 100)
Source: ABS cat. no. 8501.0 and Treasury.
The effects of the boom are also being felt outside of the resources states, with consumption growing around trend nationally during 2011. One channel is through the fly-in fly-out (FIFO) workforce, which has been expanding rapidly in recent years. The Chamber of Minerals and Energy of Western Australia estimates that in 2011 over 50 per cent of the WA mineral and energy sector’s workforce was employed on FIFO rosters and this is expected to continue to rise.
Over the year to July 2011, the fastest growing domestic airline routes were predominantly those involving key mining centres (such as Newman and Port Hedland) and Perth. Growth in aircraft movements to mining centres such as Port Hedland, Karratha, Newman and Gladstone has averaged around 10 to 20 per cent from 2008 to 2011, compared with a national average of around 2 per cent. While there are concerns about FIFO in some host communities, it is helping to spread the income and spending associated with the resources boom to many other parts of the country.
The benefits of the boom are also being shared in ways that are less obvious. For example, the sharp increase in commodity prices since the start of the mining boom has also been accompanied by a substantial rise in the Australian dollar. While this has made conditions more challenging for many businesses, it has helped hold down the prices of imported goods, including consumption imports and capital goods imports.
Indeed, the prices of goods, including manufactured goods and food, have only grown, on average, by about 0.6 per cent per year since the start of the boom, while household incomes have grown, on average, by 7.2 per cent per year. This has left households with more income to spend on services, where activity has increased strongly over recent years, generating large increases in employment and declines in many regional unemployment rates, not just in the resources states.

Statement 2: Economic Outlook
2-20
Household consumption
Household consumption growth is expected to be moderate over the next two years in line with slower, albeit still-solid growth in household income.
Global instability and ongoing global uncertainty have dampened consumer confidence and reinforced the cautious consumer attitudes to borrowing and spending that have persisted since the global financial crisis. Borrowing is unlikely to provide much support for consumption. With consumers reluctant to take on new loans and having a greater propensity to pay down existing debt, credit growth is likely to be much lower than it has been over recent decades.
Difficult global conditions have reduced real household net worth, which is considerably lower than a year ago and well below pre-GFC levels, despite the cautious recovery in share prices and stabilisation in house prices in recent months. Households are expected to continue to save at elevated rates, rebuilding wealth and strengthening their balance sheets.
In this environment, consumption growth is likely to be more closely tied to income growth. Consumption growth is forecast to be 3¼ per cent in 2011-12, before easing to 3 per cent in both 2012-13 and 2013-14.

Statement 2: Economic Outlook
2-21
Box 4: Changing patterns of consumer spending
The past decade has seen ongoing changes in the pattern of consumer spending, with the services share of nominal household consumption continuing to rise and the goods share continuing to decline (Chart A).
Chart A: Services and goods shares of nominal household consumption
30
32
34
36
38
40
60
62
64
66
68
70
2001 2006 2011
Services (LHS)
Goods (RHS)
Per cent Per cent
Source: ABS cat. no. 5206.0 and Treasury.
The solid growth in the share of consumption of services reflects a range of factors, particularly the strong growth in real household income, which grew by an average of around 4 per cent per year over the past decade.
This has seen increased demand, particularly for some services such as overseas travel and recreation, the consumption of which has grown relatively rapidly as households have become wealthier.
Trends in consumer tastes and the rise of new products in areas such as cultural and entertainment services, have also supported services demand.
Services demand has also been supported by household preferences to maintain similar levels of consumption of ‘essentials’, like housing and utilities, even in the face of substantial price rises over the past decade.
The declining share of household spending on goods has contributed to particularly challenging conditions for Australian retailers in recent years.
Retailers have also been affected by higher rates of household saving and a reluctance of households and businesses to take on more debt. The high dollar has also seen Australian consumers spend more on overseas travel.
These factors have seen subdued growth in domestic retail volumes and prices, with aggregate turnover growing well below trend over recent years (Chart B).
Chart B: Retail trade turnover
-4
-2
0
2
4
6
8
10
-4
-2
0
2
4
6
8
10
Dec-01 Dec-06 Dec-11
PricesVolumes20-year trend in turnover
Per cent, tty Per cent, tty
Source: ABS cat. no. 8501.0.

Statement 2: Economic Outlook
2-22
Box 4: Changing patterns of consumer spending (continued)
Within retail, the pattern of demand has been uneven. While sales growth has been especially subdued for clothing and book retailing and department stores, other retail segments such as food and beverages, and pharmaceuticals retailing have fared considerably better.
While the internet has opened up new opportunities for businesses to expand their customer base, it has also contributed to easier price discovery and a compression of some retailers’ margins. However, it does not appear to be responsible for the recent slowdown in retail sales.
The Productivity Commission estimates that, despite strong growth, total internet sales account for only 6 per cent of total retail sales in Australia, and that only around 2 per cent of total retail sales (or $4.2 billion) are sourced from overseas internet retailers.
As in the rest of the economy, patterns of demand are changing, even within the retail sector, challenging some businesses and providing opportunities for others.
Dwelling investment
The outlook for dwelling investment is subdued, reflecting weak demand (due in part to households’ cautious attitude towards taking on new debt, notwithstanding the prospect of lower mortgage interest rates) and ongoing supply constraints in some areas.
Over the past three years dwelling investment has been supported by particularly strong growth in Victoria’s new housing market, but that market is now returning to more normal levels of activity, while demand in other markets is expected to remain weak. Outside Victoria, ongoing supply constraints associated with state and local planning and approval processes, as well as high costs of development and land release restrictions are also expected to continue to restrain dwelling investment growth.
Dwelling investment is expected to contract by 1 per cent in 2011-12. This reflects very weak recent outcomes and the ongoing deterioration in near-term forward indicators, with dwelling approvals and commencements both declining in 2011, also led by Victoria. (Chart 6).
Dwelling investment is forecast to be flat in 2012-13 before recovering a little in 2013-14.

Statement 2: Economic Outlook
2-23
Chart 6: Forward indicators of dwelling investment
Dwelling approvals (qrtly) Dwelling commencements (qrtly)
15
20
25
30
35
8
10
12
14
16
Dec-01 Dec-06 Dec-11
Victoria (LHS)
Rest of Australia (RHS)
'000'000
15
20
25
30
35
8
10
12
14
16
Dec-01 Dec-06 Dec-11
Victoria (LHS)
Rest of Australia (RHS)
'000 '000
Source: ABS cat. no. 8731.0 and 8750.0.
Business investment
An expectation of strong ongoing demand for Australia’s non-rural commodity exports over the next decade, particularly from Asia, continues to underpin robust growth in new business investment in the resources sector and record investment intentions. Growth in resources investment has rapidly gathered momentum over the past year and this is expected to continue in 2012-13 and 2013-14. Total resources investment, including exploration and research and development, is expected to reach around 9 per cent of GDP in 2013-14. However, elsewhere in the economy, the investment outlook is more subdued, with investment in non-resources-related machinery and equipment and non-residential building expected to record only modest growth. New business investment is expected to grow a robust 12½ per cent in 2012-13 and 8 per cent in 2013-14, taking it to record levels as a share of GDP.
Investment in the resources sector continues to be strong despite global uncertainty. The most recent ABS Private New Capital Expenditure and Expected Expenditure survey reported record highs in both actual and expected expenditure levels in the resources sector, with investment intentions jumping to a record $120 billion in 2012-13 from an expected $95 billion in 2011-12. Despite ongoing global uncertainty, the resources sector has committed to, or commenced construction on, over half of the estimated $456 billion resources investment pipeline. The strength of investment in the resources sector is expected to continue to be largely related to new engineering construction investment. Engineering construction investment has surged over the past year, up nearly 50 per cent in through-the-year terms, and is expected to continue to grow rapidly over the next two years. New engineering construction is forecast to grow 20½ per cent in 2012-13 and 9 per cent in 2013-14 (Chart 7).

Statement 2: Economic Outlook
2-24
Chart 7: New engineering construction (volumes)
0
20
40
60
80
100
120
0
20
40
60
80
100
120
2003-04 2005-06 2007-08 2009-10 2011-12 2013-14
Forecasts
$billion (2009-10 prices) $billion (2009-10 prices)
Source: ABS cat. no. 5206.0 and Treasury.
The surge is underpinned by large-scale investment in the liquefied natural gas sector, although the iron ore and coal sectors will also make significant contributions. Over $80 billion of liquefied natural gas investment has received final investment approval in the past year, despite challenging global conditions.
New machinery and equipment investment is also expected to grow solidly over the next two years, driven by investment in the resources and resources-related sectors. Investment is also expected to be supported by taxation reforms commencing in the 2012-13 income year that will allow small businesses to immediately write off assets costing less than $6,500 and claim up to $5,000 as an immediate deduction on the purchase of any new or used motor vehicle costing $6,500 or more. Investment in new machinery and equipment is forecast to grow 12½ per cent in 2012-13 and 8½ per cent in 2013-14.
Investment in new non-residential building is expected to remain subdued over the next two years, despite some recent improvement. Underlying demand in the sector, particularly for new office and retail floor space, continues to be weighed down by the moderate employment outlook and weakness in some non-resources related sectors of the economy. Investment in new non-residential buildings is expected to fall ½ of a percentage point in 2012-13 before growing a modest 3½ per cent in 2013-14.

Statement 2: Economic Outlook
2-25
Box 5: Manufacturing
Manufacturing output has grown over the long term, but as a share of total output it has been trending down for many years, consistent with the experience of most advanced economies. Recently, the sustained high Australian dollar has placed additional pressure on the sector, accelerating the transition.
Over the past decade, manufacturing’s share of output has fallen from over 12 per cent to around 8½ per cent, while its share of employment has fallen from over 11 per cent to around 8½ per cent.
However, these high-level trends mask important differences, with some parts of manufacturing struggling while other parts are doing well.
Those industries that are linked to Australia’s resources sector, or are higher up the value chain and more reliant on human capital, are generally performing better than others.
Chart A: Manufacturing export volumes
0
2
4
6
8
10
0
2
4
6
8
10
2001 2003 2005 2007 2009 2011
$billion $billion
Machinery
Professional & scientificequipment
Transport equipment
Chemicals & related products
Source: ABS cat. no. 5302.0.
Over the past decade, professional and scientific equipment exports have tripled, while chemicals and
related-products exports have increased by around 60 per cent. Exports of machinery have also grown solidly (Chart A).
Despite a difficult backdrop, there is evidence that manufacturing firms continue to look to become more competitive, both by bringing new products to market, as well as by driving productivity gains through improved processes and systems.
Around 25 per cent of manufacturing firms reported introducing new or significantly improved goods in 2009-10, with manufacturing exceeding the economy-wide average, as it has done for many years.
Manufacturing firms have also been more likely to innovate in the way they do business. In 2009-10, almost 30 per cent of manufacturers reported making process innovations such as in methods of manufacturing, logistics and distribution and back-office functions — almost twice the proportion for the economy as a whole (Chart B).
Chart B: Manufacturing innovation (2009-10)
0
5
10
15
20
25
30
35
0
5
10
15
20
25
30
35
Manufacturing Total
Goods and services
Operational process
Per cent Per cent
Source: ABS cat. no. 8167.0.

Statement 2: Economic Outlook
2-26
Public final demand
Public final demand is expected to fall in 2012-13 and remain flat in 2013-14. Falling Commonwealth Government spending in 2012-13 is expected to be partially offset by weak, albeit positive growth in state spending, consistent with recent state budget updates, notwithstanding the planned fiscal consolidations announced by most states.
Exports and imports
Export volumes are forecast to increase solidly in 2012-13 and 2013-14, as the current resources investment boom translates into significant new production and export capacity in the resources sector. Exports are expected to continue to be supported by the strong outlook for Australia’s major trading partners (Box 6), which is offsetting some of the drag caused by the high Australian dollar. Exports are forecast to increase by 4½ per cent in each of 2012-13 and 2013-14.
Non-rural commodity exports are expected to grow strongly over the next two years as ongoing expansions in mines, ports and rail capacity facilitate greater production and export volumes. There are currently a number of major expansions underway in Western Australia and along the east coast, which are expected to significantly boost iron ore and coal exports over the next two years, notwithstanding some expected delays, particularly in regard to metallurgical coal. Non-rural commodity exports are expected to grow 7½ per cent in 2012-13 and 5½ per cent in 2013-14.
Rural exports are expected to increase 8 per cent in 2011-12 and remain at historically high levels over the next two years, in line with a strong outlook for farm production. Favourable seasonal conditions for the winter crop, particularly in Western Australia, are expected to result in a record crop, notwithstanding lower yields in the eastern states associated with adverse weather conditions. Recent rainfall is bringing increased availability of irrigation water and improved sub-soil moisture levels and is expected to support a strong summer crop in 2012-13.
Elaborately transformed manufactures exports are expected to rise modestly over the next two years. While demand is expected to rise in line with the strong outlook for Australia’s major trading partners, the high exchange rate is expected to continue to weigh on growth. Elaborately transformed manufactures exports are expected to increase 2½ per cent in 2012-13 and 3 per cent in 2013-14.
Services exports have been trending downwards for the past two years, and this weakness is expected to continue in the near term. The high Australian dollar is weighing heavily on some sectors, particularly tourism and exports of education-related travel services. Exports of services are expected to fall 5½ per cent in 2011-12 before recovering slowly, growing 1½ per cent in 2012-13 and 3 per cent in 2013-14.

Statement 2: Economic Outlook
2-27
Box 6: The impact of emerging Asia on Australian exporters
The global economy is undergoing a dramatic structural change with the weight of economic activity shifting quickly towards Asia.
Emerging economies, particularly in Asia, have become a key driver of global growth (Chart A). Emerging economies are expected to contribute around three quarters of the world’s economic growth over the next five years.
Australia’s natural resource base and location in the Asian region have allowed our exporters to take advantage of the expanding markets of emerging Asia at a time of relative weakness in the world’s advanced economies.
Chart A: Contributions to global growth (5-yr annual average)
0
1
2
3
0
1
2
3
1982-86 1992-96 2002-06 2012-16
Advanced economies
Emerging Asia
Percentage points
(f)
Note: IMF forecasts 2012-16. Source: IMF and Treasury.
While China has been a significant contributor due to its size and strong growth, all the key emerging economies of Asia (including India, Indonesia, Malaysia and Vietnam) have grown more rapidly than the advanced economies.
Australian businesses have been re-orientating their exports toward emerging Asia for many years and this shift has been even more marked since the global financial crisis (Chart B).
Chart B: Merchandise export shares
0
10
20
30
40
50
60
70
80
90
0
10
20
30
40
50
60
70
80
90
1990-91 2000-01 2010-11
Advanced economies
Emerging Asia
Per cent Per cent
Source: ABS cat. no. 5368.0 and Treasury.
The re-alignment is most stark for commodities but is evident in all major export classes (Chart C).
Chart C: Emerging Asia’s share of major export classes
0
10
20
30
40
50
0
10
20
30
40
50
2000-01 2005-06 2010-11
Primary products
Manufactures
Services
Per cent Per cent
Source: Department of Foreign Affairs and Trade and ABS cat. no. 5368.0.55.003.

Statement 2: Economic Outlook
2-28
Box 6: The impact of emerging Asia on Australian exporters (continued)
The emergence of Asia is likely to provide increasing opportunities for Australia’s manufacturing and service sectors. With large populations and strong incomes growth, China and India are expected to experience a surge in middle income consumers in coming years. By 2030 there are expected to be over 3 billion people in the middle income bracket in the Asia Pacific region. As their incomes increase they will spend more on high-value manufactured goods (such as medical and pharmaceutical products) and services (such as health, education, finance and tourism), and food, providing opportunities for Australian businesses.
These changes are already underway. For example, over the past decade Chinese visitor arrivals have increased from around 160,000 per year to around 540,000 per year and Indian visitor arrivals have increased from around 50,000 per year to around 150,000 per year (Chart D).
Chart D: Overseas arrivals
0
200
400
600
800
0
200
400
600
800
2001 2003 2005 2007 2009 2011
Japan
United States
China
India
'000 '000
Note: Includes visitors for purposes of education and employment who intend to stay in Australia for less than one year. Source: ABS cat. no. 3401.0.
The strong growth in Asia is providing strong support for exporters at a time of a high exchange rate and weakness in the advanced economies. These opportunities will continue to expand — for resources companies, high-end manufacturers, service providers and rural commodity producers — as the Asian Century proceeds.
Imports are forecast to increase strongly over the next two years, underpinned by record levels of import-intensive investment in the resources sector and the high Australian dollar. The resources investment boom is fuelling significant demand for imports, particularly capital goods imports for the liquefied natural gas sector where around two-thirds of capital investment is imported. Outside the resources sector, imports of consumption goods and travel services are also expected to record solid growth as consumers continue to take advantage of the high Australian dollar. Total import volumes are forecast to grow 7½ per cent in 2012-13 and 5½ per cent in 2013-14.

Statement 2: Economic Outlook
2-29
Terms of trade
The terms of trade are likely to have peaked in the September quarter of 2011 and are expected to fall over the next two years as prices for Australia’s key commodity exports ease in line with growing world supply (Chart 8). Despite the forecast decline in prices, the terms of trade are expected to remain close to historical highs over the forecast period. The terms of trade are expected to decline gradually over the medium term.
Chart 8: Terms of trade
40
60
80
100
120
140
40
60
80
100
120
140
Jun-64 Jun-74 Jun-84 Jun-94 Jun-04 Jun-14
Index (2009-10 = 100) Index (2009-10 =100)
(f)
Source: ABS cat. no. 5206.0 and Treasury.
The prices of Australia’s key non-rural commodity exports experienced significant falls during the financial turmoil in the second half of 2011. However, since then, iron ore and coal prices have been relatively stable (Chart 9).
Strong growth in Asia, particularly China, is expected to continue to support strong demand for iron ore and coal. However, increasing global supply, led by Australia, is expected to weigh on prices over the next two years. Accordingly, despite the continued positive outlook, the terms of trade are forecast to fall 5¾ per cent in 2012-13 and 3¼ per cent in 2013-14.

Statement 2: Economic Outlook
2-30
Chart 9: Bulk commodity prices
Iron ore Thermal coal
0
40
80
120
160
200
0
40
80
120
160
200
Apr-06 Apr-08 Apr-10 Apr-12
US$/tonne US$/tonne
0
40
80
120
160
200
0
40
80
120
160
200
Apr-06 Apr-08 Apr-10 Apr-12
US$/tonne US$/tonne
Source: Bloomberg.
Current account balance
The current account deficit is expected to widen to 4¾ per cent of GDP in 2012-13 and 6 per cent of GDP in 2013-14 (Chart 10), as the trade balance moves into deficit, driven by declining non-rural commodity prices and surging import volumes associated with the resources investment boom (Box 7).
Chart 10: Current account balance
-8
-6
-4
-2
0
2
4
-8
-6
-4
-2
0
2
4
2003-04 2005-06 2007-08 2009-10 2011-12 2013-14
Per cent of GDPPer cent of GDP
Current account balance Net income balance Trade balance
Forecasts
Source: ABS cat. no. 5206.0, 5302.0 and Treasury.

Statement 2: Economic Outlook
2-31
Box 7: Resources investment and the current account
The resources boom is driving unprecedented levels of investment in Australia. This is leading to a surge in capital goods imports and an expected temporary widening of the current account deficit. High levels of investment are boosting Australia’s production capacity.
Historically, Australia has been a large net importer of capital, running current account deficits for most of its history, driven by our very high investment rates. Both Australia’s investment rate and saving rate are high compared with the major advanced economies (Chart A).
Chart A: Gross saving/investment
15
20
25
30
35
15
20
25
30
35
1993 2003 2013
(f)
Per cent of GDP Per cent of GDP
Aus (I)
Aus (S)
G7 (I)
G7 (S)
Note: Australia data refer to financial years beginning 1993-94. Data for G7 refer to calendar years beginning 1993. Source: ABS cat. no. 5206.0 IMF and Treasury.
After a temporary GFC-related decline, resources investment is now growing strongly. As resources investment is highly import-intensive, imports have also surged, with imports of capital goods more than doubling since the start of the boom (Chart B).
Chart B: Investment and imports
0
50
100
150
200
250
300
350
400
0
50
100
150
200
250
300
350
400
2003-04 2008-09 2013-14
(f)Index (2003-04 =100)
Capital imports
Business investment
GDP
Source: ABS cat. no. 5206.0, 5302.0 and Treasury.
Over the next two years, new business investment and capital imports are expected to reach record highs as a percentage of GDP and the current account deficit is expected to widen (Chart C).
Chart C: The current account
-8
-6
-4
-2
0
2
-8
-6
-4
-2
0
2
1983-84 1993-94 2003-04 2013-14
Per cent of GDP Per cent of GDP
(f)
Source: ABS cat. no. 5206.0, 5302.0 and Treasury.
As the boom matures, exports should strengthen in line with the increased productive capacity of the resources sector and capital imports should ease, returning the current account to more normal levels.

Statement 2: Economic Outlook
2-32
Labour market
Despite ongoing global weakness and uncertainty, Australia’s unemployment rate has remained low and stable and is well below rates in most advanced economies. At close to 5 per cent, it is currently half that in Europe and significantly less than in the United States (Box 1). Employment growth has averaged around 1¾ per cent per year over the past three years and over 500,000 jobs have been created.
However global uncertainty, the impact of the high exchange rate, consumer caution, and shifting patterns of demand have all made employers more hesitant to hire new workers. Following strong employment growth in 2010, there was little employment growth in 2011.
Instead, employers have responded to increased labour demand by increasing the average number of hours employees work each week. Had average hours not increased, there would have been around 66,000 additional jobs created in the 12 months to March 2012.
Aggregate employment outcomes conceal the ongoing transition in employment that is occurring at a sectoral level. Resources-related sectors (such as mining and mining-related construction) and public, social and some service-related sectors (such as health care and social assistance, professional, scientific and technical services, and rental, hiring and real estate services) all recorded significant increases in their shares of employment over the past three years. However, other sectors (such as manufacturing, retail trade, and transport, postal and warehousing) recorded substantial declines in their shares over the same period (Chart 11).
Chart 11: Change in employment share — February 2009 to February 2012
-1.5 -1.0 -0.5 0.0 0.5 1.0 1.5
-1.5 -1.0 -0.5 0.0 0.5 1.0 1.5
Manufacturing
Retail Trade
Transport, Postal and Warehousing
Agriculture, Forestry and Fishing
Construction
Public Administration and Safety
Rental, Hiring and Real Estate Services
Mining
Professional, Scientific and Technical Services
Health Care and Social Assistance
Percentage points
Percentage points
Note: This chart shows the five industry categories with the largest increase in employment share over the past three years and the five categories with the largest decrease over the same period. Source: ABS cat. no. 6291.0.55.003.

Statement 2: Economic Outlook
2-33
With patterns of demand changing and the economy in a long-term transition, the shift in resources towards the fast-growing sectors of the economy is likely to continue with solid, albeit weaker, employment growth expected in the services sector and strong employment growth in the rapidly expanding but less labour-intensive resources and resources-related sectors over coming years (Chart 12).
Chart 12: Employment share by activity over time
0
25
50
75
100
0
25
50
75
100
1900 1954 1971 2000 2009
Services Agriculture Industry
Per cent Per cent
Source: Feinstein (1999), OECD Statistics and Treasury.
The solid growth in the services sector and other sectors benefiting from the resources boom is expected to be partly offset by the continued movement of resources out of some of the labour-intensive sectors such as retail and manufacturing. Nevertheless, overall employment growth is expected to strengthen, though remain modest. Employment is forecast to grow 1¼ per cent through the year to the June quarter of 2013 and 1½ per cent through the year to the June quarter of 2014. Over 360,000 jobs are expected to be created over the forecast period. This builds on the more than 750,000 jobs created since late 2007.
The unemployment rate is expected to drift up slightly over coming quarters, in line with the modest growth in employment, reaching 5½ per cent in the June quarters of both 2013 and 2014. However, the uneven pattern of sectoral growth is expected to continue to pose a downside risk to the labour market, with the possibility that frictional unemployment could temporarily rise as businesses adjust to changing patterns of demand and workers look to find new opportunities in emerging parts of the economy.
The labour force participation rate has declined over the past year, falling around ½ of a percentage point, partly reflecting the first baby boomers leaving the workforce. Despite these falls, the national participation rate continues to be high in historical terms, and is expected to remain at around 65¼ per cent over the next two years.
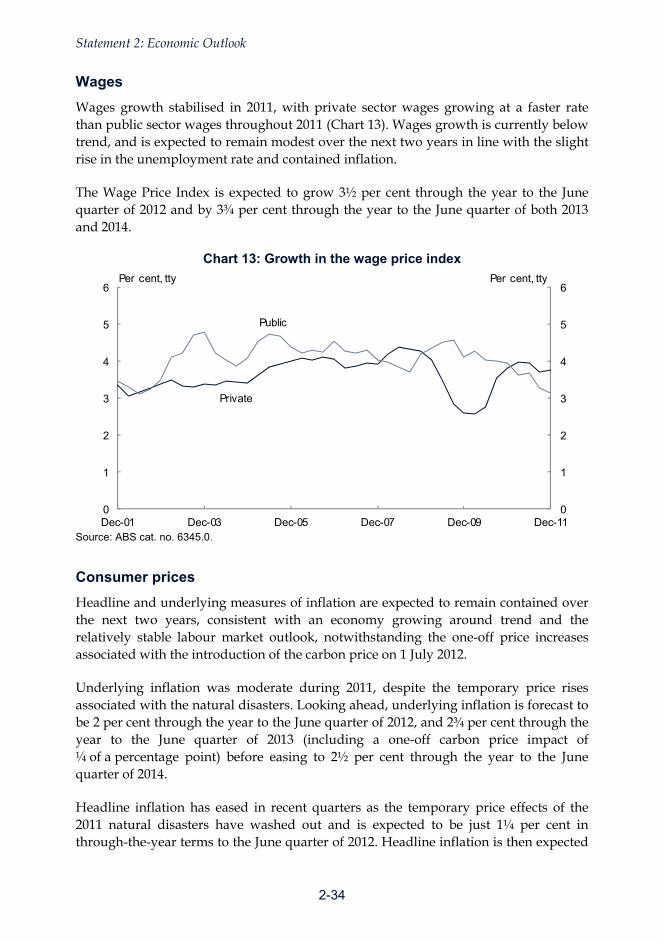
Statement 2: Economic Outlook
2-34
Wages
Wages growth stabilised in 2011, with private sector wages growing at a faster rate than public sector wages throughout 2011 (Chart 13). Wages growth is currently below trend, and is expected to remain modest over the next two years in line with the slight rise in the unemployment rate and contained inflation.
The Wage Price Index is expected to grow 3½ per cent through the year to the June quarter of 2012 and by 3¾ per cent through the year to the June quarter of both 2013 and 2014.
Chart 13: Growth in the wage price index
0
1
2
3
4
5
6
0
1
2
3
4
5
6
Dec-01 Dec-03 Dec-05 Dec-07 Dec-09 Dec-11
Private
Public
Per cent, tty Per cent, tty
Source: ABS cat. no. 6345.0.
Consumer prices
Headline and underlying measures of inflation are expected to remain contained over the next two years, consistent with an economy growing around trend and the relatively stable labour market outlook, notwithstanding the one-off price increases associated with the introduction of the carbon price on 1 July 2012.
Underlying inflation was moderate during 2011, despite the temporary price rises associated with the natural disasters. Looking ahead, underlying inflation is forecast to be 2 per cent through the year to the June quarter of 2012, and 2¾ per cent through the year to the June quarter of 2013 (including a one-off carbon price impact of ¼ of a percentage point) before easing to 2½ per cent through the year to the June quarter of 2014.
Headline inflation has eased in recent quarters as the temporary price effects of the 2011 natural disasters have washed out and is expected to be just 1¼ per cent in through-the-year terms to the June quarter of 2012. Headline inflation is then expected

Statement 2: Economic Outlook
2-35
to rise temporarily to 3¼ per cent in through-the-year terms to the June quarter of 2013, (including a one-off carbon price impact of ¾ of a percentage point) before easing back to 2½ per cent in through-the-year terms to the June quarter of 2014 (Chart 14).
Chart 14: Headline and underlying inflation
0
1
2
3
4
5
6
0
1
2
3
4
5
6
Jun-04 Jun-06 Jun-08 Jun-10 Jun-12 Jun-14
Per cent, tty Per cent, tty
Headline Underlying
Forecasts
Note: The underlying inflation measure is the average of the trimmed mean and weighted median. Source: ABS cat. no. 6401.0 and Treasury.

Statement 2: Economic Outlook
2-36
Box 8: The effect of carbon pricing on the economy
The carbon price modelling, outlined in the update to the Strong growth, low pollution report issued by the Treasury on 21 September 2011, shows the Australian economy will continue to prosper as Australia moves to a clean energy future. It shows that GDP and Gross National Income will continue to grow solidly under the policy.
The forecasts incorporate the impact of the carbon price as outlined in the modelling. The carbon price is not expected to have a material impact on the domestic economic outlook with real GDP growth and employment growth expected to be reduced by less than ¼ of a percentage point in 2012-13, with no discernible impact on the forecast unemployment rate.
After the initial introduction of the scheme, smaller changes in the carbon price are expected to result in correspondingly smaller impacts on GDP growth in subsequent years.
The carbon price is expected to result in a one-off 0.7 per cent increase in consumer prices in 2012-13. Nine out of 10 households will receive assistance to help with the cost of living impact of the carbon price through increases in Government payments and/or tax cuts.
For almost 6 million households the assistance will be sufficient to cover their average expected price impact.
Assistance through Government payments will begin to be delivered with the Clean Energy Advance to be paid in May and June, and tax cuts will take effect from 1 July 2012.
Lower and middle income families typically have higher marginal propensity to consume than high income earners, so the targeted household compensation payments to this group should support aggregate consumption spending. Accordingly, the policy change is expected to have only minimal effects on aggregate household real consumption.
A carbon price is the cheapest and most efficient means of gradually transforming the economy to a clean energy future. It creates incentives for business to invest in clean technology or find smarter, less energy-intensive way of operating. Around $100 billion of investment in new clean energy sources such as solar, wind and geothermal will be unleashed over the period to 2050.

Statement 2: Economic Outlook
2-37
Incomes
Nominal GDP is forecast to grow 5 per cent in 2012-13 and 5¼ per cent in 2013-14. This reflects the expected decline in the terms of trade over the period, combined with around-trend real GDP and domestic prices growth (Chart 15). Nominal GDP is distributed throughout the economy mainly as compensation of employees, gross operating surplus and gross mixed income.
Chart 15: Components of nominal GDP growth
-2
0
2
4
6
8
10
-2
0
2
4
6
8
10
1993-94 1998-99 2003-04 2008-09 2013-14
Real GDP Terms of trade contribution GNE deflator contribution Nominal GDP
Percentage points Percentage points
Forecasts
Note: The small discrepancy between nominal GDP and the sum of its components is due to interactions which cannot be attributed to individual components. Source: ABS cat. no. 5206.0 and Treasury.
Gross operating surplus is forecast to grow 4¾ per cent in 2012-13 and 5¼ per cent in 2013-14. Growth is expected to slow from the robust rates experienced over recent years as the softening terms of trade and patchiness in the non-resources economy weigh on profit growth. Compensation of employees is forecast to grow 5 per cent in 2012-13 and 5½ per cent in 2013-14, reflecting the more subdued outlook for wages and employment over the period. The decline in the terms of trade is expected to result in a decline in the profits share (and a corresponding rise in the wages share) of income over the next two years.
Gross mixed income, which includes the wages and profits of farms and other unincorporated enterprises, is forecast to grow 3¼ per cent in 2012-13 and 4¼ per cent in 2013-14.
Medium-term projections
The fiscal aggregates in the Budget are underpinned by a set of forward estimates consisting of short-term economic forecasts and projections based on medium-term assumptions.

Statement 2: Economic Outlook
2-38
The economy is projected to operate at capacity over the projection period. Real GDP is projected to grow at its trend rate of around 3 per cent per year over the two projection years of the forward estimates (Chart 16).
Beyond the forward estimates, GDP is projected to grow at around 3 per cent until 2018-19, when trend growth is projected to slow as population ageing generates a gradually falling participation rate.
The unemployment rate is projected to be 5 per cent over the medium term. This assumption has long been used for medium-term projections and is near current estimates of the non-accelerating inflation rate of unemployment.1 Inflation is projected to be 2½ per cent, consistent with the Reserve Bank of Australia’s medium-term target band.
The terms of trade are projected to decline by a total of around 20 per cent over a 15-year period, settling around their 2006-07 level. This reflects an expectation that current levels of commodity prices will not be sustained in the longer term, as supply increases gradually bring down prices over time.
The exchange rate is assumed to remain around its recent average level during the forecast period. Over the projection period, the exchange rate is assumed to move in line with the long-term historical relationship between the terms of trade and the real effective exchange rate. This technical assumption was introduced in the 2011-12 Budget to provide greater internal consistency during the projection period. The current terms of trade projections imply a fall in the real exchange rate of 0.9 per cent per annum over the projection period.
1 The Treasury’s estimates are based on a methodology detailed in Gruen, Pagan and Thompson (1999), ‘The Phillips curve in Australia’, Journal of Monetary Economics, and updated in Kennedy, Luu and Goldbloom (2008), ‘Examining full employment in Australia using the Phillips and Beveridge Curves’, The Australian Economic Review.

Statement 2: Economic Outlook
2-39
Chart 16: Real GDP growth over the forward estimates period
-4
-2
0
2
4
6
8
-4
-2
0
2
4
6
8
1985-86 1990-91 1995-96 2000-01 2005-06 2010-11 2015-16
30-year average
Forw ard estimates
Per centPer cent
Source: ABS cat. no. 5206.0 and Treasury.


3-1
STATEMENT 3: FISCAL STRATEGY AND OUTLOOK
The Government is returning the budget to surplus in 2012-13, with surpluses growing across the forward estimates.
This delivers on the Government’s fiscal strategy, first set out in 2009, to return the budget to surplus as the economy recovers. The fiscal consolidation will strengthen the long-term position of the budget and provide a buffer against an uncertain global economic outlook.
Returning the budget to surplus in 2012-13 is appropriate given domestic economic conditions and provides ongoing scope for monetary policy to respond to economic developments, if needed. A return to surplus, ahead of any major advanced economy, sends a strong message to international investors on the Government’s commitment to fiscal discipline.
The economy is forecast to grow around trend, with low unemployment, contained inflation, record levels of mining investment and very low levels of government debt.
Government revenues continue to be affected by structural changes in the economy and the lingering effects of the global financial crisis. This has led to weaker-than-expected tax receipts compared to those anticipated at the Mid-Year Economic and Fiscal Outlook 2011-12 (MYEFO). Write-downs in total tax receipts since the global financial crisis are now around $150 billion over the five years to 2012-13.
In response, the Government has made $33.6 billion in targeted savings to: return the budget to surplus; spread the benefits of the resources boom to help low and middle-income families and help businesses struggling with the economy in transition; and improve the long-term position of the budget.
Following a revised underlying cash deficit of $44.4 billion (3.0 per cent of GDP) in 2011-12, a surplus of $1.5 billion (0.1 per cent of GDP) is expected in 2012-13, growing to $7.5 billion (0.4 per cent of GDP) in 2015-16.
The Government’s ongoing commitment to fiscal discipline will ensure Australia’s balance sheet remains one of the strongest in the developed world. Net debt is expected to peak at 9.6 per cent of GDP in 2011-12, reducing to 7.3 per cent of GDP by 2015-16.

3-2
CONTENTS
Overview of fiscal position .......................................................................... 3-3 The Government’s fiscal strategy ................................................................................. 3-4 A strong rationale for returning to surplus in 2012-13 .................................................. 3-5 Weaker tax receipts have made returning to surplus harder ....................................... 3-6 Achieving surpluses through targeted savings and disciplined spending .................... 3-6
Fiscal outlook ............................................................................................... 3-9 Underlying cash balance estimates ............................................................................. 3-9 Fiscal balance estimates ............................................................................................ 3-18 Net debt, net financial worth and net worth ................................................................ 3-19 Medium-term fiscal outlook ........................................................................................ 3-21
Appendix A: Sensitivity of budget estimates to economic developments ............................................................................................. 3-23

3-3
STATEMENT 3: FISCAL STRATEGY AND OUTLOOK
OVERVIEW OF FISCAL POSITION
The Government is returning the budget to surplus in 2012-13, with surpluses growing across the forward estimates. This delivers on the Government’s fiscal strategy, first set out in the Updated Economic and Fiscal Outlook in 2009, to return the budget to surplus as the economy recovers.
The return to surplus in 2012-13 reflects a fiscal consolidation of 4.3 per cent of GDP since 2009-10. This is appropriate in the context of an economy where the fundamentals remain strong and the outlook remains positive.
The challenge in returning to surplus has increased since MYEFO with the recovery in tax receipts weaker than anticipated. Tax receipts (excluding GST) in 2012-13 have been revised down by $4.6 billion since MYEFO. The return to surplus in 2012-13 is being achieved by the Government making net savings of $3.0 billion and lower payments than expected at MYEFO.
The fiscal consolidation across the forward estimates is being supported by the post-global financial crisis recovery in tax receipts. Notwithstanding this rebound, tax receipts as a share of GDP are expected to reach around 1 percentage point below the unsustainable levels reached in the mid-2000s. This means that tax as a proportion of GDP in 2011-12 and the previous two years is the lowest it has been since 1993-94.
In response, the Government has made $33.6 billion in savings in this Budget to make room for priority spending and to improve fiscal sustainability. The net budget impact of policy decisions is a $17.0 billion improvement to the underlying cash balance over the forward estimates.
The Government is funding initiatives to spread the benefits of the resources boom to families and businesses struggling with the economy in transition, and to assist families with the costs of educating their children. The Government also has been able to support key social reforms such as the first stage of a National Disability Insurance Scheme and reforms to aged care.
Table 1: Budget aggregates Actual Estimates Projections2010-11 2011-12 2012-13 2013-14 2014-15 2015-16
Underlying cash balance ($b)(a) -47.7 -44.4 1.5 2.0 5.3 7.5Per cent of GDP -3.4 -3.0 0.1 0.1 0.3 0.4
Fiscal balance ($b) -51.5 -42.0 2.5 2.6 7.0 9.5Per cent of GDP -3.7 -2.8 0.2 0.2 0.4 0.5 (a) Excludes expected Future Fund earnings.

Statement 3: Fiscal strategy and outlook
3-4
In 2012-13 and each subsequent year across the forward estimates, payments as a percentage of GDP, are expected to be at their lowest level since the onset of the global financial crisis. This Budget is also delivering payments below 24 per cent of GDP across the forward estimates from 2012-13, the longest period since the early 1980s.
Following a revised underlying cash deficit of $44.4 billion (3.0 per cent of GDP) in 2011-12, a surplus of $1.5 billion (0.1 per cent of GDP) is expected in 2012-13, growing to $7.5 billion (0.4 per cent of GDP) in 2015-16.
Net debt is expected to peak at 9.6 per cent of GDP in 2011-12, reducing to 7.3 per cent of GDP by 2015-16. Although the peak is higher than previously expected, the Australian Government’s net debt position remains low by international standards. The Government’s commitment to fiscal discipline will ensure Australia’s balance sheet remains one of the strongest in the developed world.
The Government’s fiscal strategy
The Government’s fiscal strategy is designed to ensure fiscal sustainability while providing the necessary flexibility for the budget to vary in line with economic conditions to support macroeconomic stability.
The medium-term fiscal strategy has remained unchanged since 2008-09, the Government’s first budget.
The Government’s medium-term fiscal strategy is to:
• achieve budget surpluses, on average, over the medium term;
• keep taxation as a share of GDP below the level for 2007-08 (23.7 per cent of GDP), on average; and
• improve the Government’s net financial worth over the medium term.
Following its response to the global financial crisis, the Government committed to ensuring a timely return to surplus as the economy recovered to grow above trend by:
• allowing the level of tax receipts to recover naturally as the economy improves, while maintaining the Government’s commitment to keep taxation as a share of GDP below the 2007-08 level on average; and
• holding real growth in spending to 2 per cent a year until the budget returns to surplus.
With the budget returning to surplus, the Government remains committed to allowing tax receipts to recover naturally as the economy improves, and to maintaining a 2 per cent annual cap on real spending growth, on average, until surpluses are at least 1 per cent of GDP and while the economy is growing at or above trend.
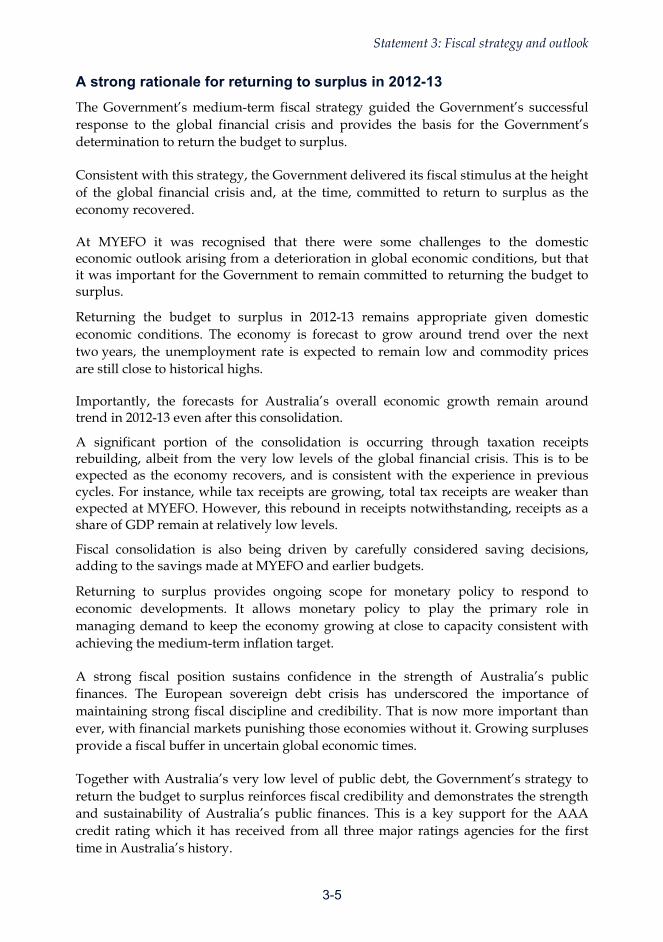
Statement 3: Fiscal strategy and outlook
3-5
A strong rationale for returning to surplus in 2012-13
The Government’s medium-term fiscal strategy guided the Government’s successful response to the global financial crisis and provides the basis for the Government’s determination to return the budget to surplus.
Consistent with this strategy, the Government delivered its fiscal stimulus at the height of the global financial crisis and, at the time, committed to return to surplus as the economy recovered.
At MYEFO it was recognised that there were some challenges to the domestic economic outlook arising from a deterioration in global economic conditions, but that it was important for the Government to remain committed to returning the budget to surplus.
Returning the budget to surplus in 2012-13 remains appropriate given domestic economic conditions. The economy is forecast to grow around trend over the next two years, the unemployment rate is expected to remain low and commodity prices are still close to historical highs.
Importantly, the forecasts for Australia’s overall economic growth remain around trend in 2012-13 even after this consolidation.
A significant portion of the consolidation is occurring through taxation receipts rebuilding, albeit from the very low levels of the global financial crisis. This is to be expected as the economy recovers, and is consistent with the experience in previous cycles. For instance, while tax receipts are growing, total tax receipts are weaker than expected at MYEFO. However, this rebound in receipts notwithstanding, receipts as a share of GDP remain at relatively low levels.
Fiscal consolidation is also being driven by carefully considered saving decisions, adding to the savings made at MYEFO and earlier budgets.
Returning to surplus provides ongoing scope for monetary policy to respond to economic developments. It allows monetary policy to play the primary role in managing demand to keep the economy growing at close to capacity consistent with achieving the medium-term inflation target.
A strong fiscal position sustains confidence in the strength of Australia’s public finances. The European sovereign debt crisis has underscored the importance of maintaining strong fiscal discipline and credibility. That is now more important than ever, with financial markets punishing those economies without it. Growing surpluses provide a fiscal buffer in uncertain global economic times.
Together with Australia’s very low level of public debt, the Government’s strategy to return the budget to surplus reinforces fiscal credibility and demonstrates the strength and sustainability of Australia’s public finances. This is a key support for the AAA credit rating which it has received from all three major ratings agencies for the first time in Australia’s history.

Statement 3: Fiscal strategy and outlook
3-6
Weaker tax receipts have made returning to surplus harder
The global financial crisis affected all aspects of the economy — production, consumption, profits and employment. As a result, all revenue heads were hit, and the tax-to-GDP ratio fell 3.6 percentage points from its pre-crisis level in 2007-08 to 20.1 per cent in 2010-11. This was the biggest decline in the ratio since the 1950s. Relative to the forecasts made at the 2008-09 Budget, total tax receipts have been written down by around $150 billion over the five years to 2012-13.
Combined with the write down in revenues across the forward estimates, tax receipts, as a percentage of GDP, are expected to be significantly lower than their 2007-08 level across the forward estimates.
In 2012-13, the tax-to-GDP ratio is expected to be 1.6 percentage points lower than the 2007-08 level, which equates to around $24.1 billion of tax in that year. Tax receipts are projected to reach 22.9 per cent of GDP in 2015-16, around 1 percentage point below the unsustainable levels reached in the mid-2000s. This means that tax as a proportion of GDP in 2011-12 and the previous two years is the lowest it has been since 1993-94.
Since the post-crisis trough, receipts have begun to recover, but at a slower pace than expected at MYEFO. Tax receipts are expected to be around $18.4 billion lower over the four years to 2014-15 than projected at MYEFO. The downward revisions since MYEFO principally reflect sluggish asset prices, consumer caution, weak profitability outside the resources and resources-related sectors, and high levels of investment-related tax deductions within the mining sector.
In the mid-2000s, strong growth in asset prices combined with a maturing capital gains tax system resulted in strong capital gains tax receipts. With asset markets currently sluggish, capital gains tax receipts are expected to remain much lower than their pre-crisis levels. Also affecting capital gains tax is the larger-than-anticipated stock of losses generated during the global financial crisis, which will take a number of years to be fully utilised against future gains.
Consumers remain cautious which is damping GST and other indirect tax collections.
This ongoing consumer caution and the sustained high dollar continue to put pressure on the profitability of industries outside the resources and resources-related sectors, such as manufacturing, retail and tourism, affecting company tax receipts from these sectors. Tax receipts from the mining sector are being affected by the substantial pipeline of investment which means depreciation deductions will remain high.
Achieving surpluses through targeted savings and disciplined spending
The downward revision in tax receipts since MYEFO has meant that to deliver on the Government’s commitment to return to surplus and build surpluses across the forward estimates it has had to make further targeted savings.

Statement 3: Fiscal strategy and outlook
3-7
Table 2 shows the effect of spending and savings decisions since MYEFO. The net budget impact of policy decisions takes into account amounts that previously have been provisioned for in the Contingency Reserve (and as a result have no net impact on the budget position) and which principally relate to the Nation Building 2 Program and Official Development Assistance.
Table 2: Effect of spending and savings decisions in the 2012-13 Budget(a)
2011-12 2012-13 2013-14 2014-15 2015-16 Total$m $m $m $m $m $m
Effect of policy decisions since MYEFO
Spends -2,917 -1,744 -4,278 -6,695 -6,801 -22,435
Saves 216 4,668 8,212 9,187 11,323 33,605
Payments 140 2,606 4,531 4,144 4,949 16,370Non-tax Receipts 6 466 194 312 316 1,294Tax Receipts 70 1,596 3,487 4,730 6,058 15,941
Total effect of policy decisions -2,701 2,924 3,934 2,491 4,522 11,170since MYEFO
Add Contingency Reserve offsets to policy decisions 27 126 191 2,425 3,080 5,849
Net budget impact of policy decisions -2,674 3,050 4,125 4,916 7,603 17,019
Estimates Projections
(a) On an underlying cash basis.
The net budget impact of policy decisions is a $17.0 billion improvement to the underlying cash balance over the forward estimates.
The Government has made $33.6 billion in savings in the budget to return to surplus and pay for new spending of $22.4 billion (of which $5.8 billion had been provisioned for in the Contingency Reserve). The savings in this Budget build on the $11.5 billion of savings in MYEFO and more than $100 billion of savings identified in the four budgets since 2008-09. Less than half of the savings in this Budget are from changes in tax receipts.
The budget contains decisions not to proceed with (or defer) some previously announced measures that otherwise would have reduced tax receipts. The decisions in this Budget not to proceed with some measures will maintain tax liabilities at present levels.
The tax reforms in this Budget build on past measures to improve the integrity and fairness of the tax system, such as the reforms to car fringe benefits and the Dependent Spouse Tax Offset announced in the 2011-12 Budget.
Payments
A continuing focus on restraining growth in payments remains an important element of the Government’s fiscal strategy. Given the range of factors that can affect payments

Statement 3: Fiscal strategy and outlook
3-8
in any one year, looking at payments over a number of years is a better indicator of spending restraint.
The discipline imposed on real spending growth has reduced payments as a proportion of GDP to 23.5 per cent in 2012-13, a fall of 1.6 percentage points from 2011-12. Payments as a share of GDP then remain broadly constant over the forward estimates. This is the longest period that payments have remained below 24 per cent of GDP since the early 1980s.
The budget also sees a fall in nominal payments in 2012-13 compared to 2011-12, the first fall in the 42 years for which data are available. The fall in payments in 2012-13 highlights the key role disciplined spending is playing in the fiscal consolidation.
Assessing payments over a number of years to judge spending restraint is reflected in the fiscal strategy that commits to maintaining a 2 per cent annual cap on real spending growth, on average, until surpluses are at least 1 per cent of GDP and while the economy is growing at or above trend.
Average real growth in payments across the forward estimates is 1.8 per cent (Table 3).
Table 3: Real growth in payments 2011-12 2012-13 2013-14 2014-15 2015-16
Real payment growth 4.8 -4.3 3.7 2.0 2.9Average real growth in payments 1.8 Real growth in payments is estimated to be 4.8 per cent in 2011-12 and -4.3 per cent in 2012-13, averaging 0.3 per cent over these two years. There are a number of common factors which have contributed to the real growth rates in payments in 2011-12 and 2012-13.
MYEFO outlined a number of one-off factors affecting real growth in payments in 2011-12, including the significant assistance to households and businesses in delivering the Clean Energy Future package and addressing the effects of the most expensive natural disasters in Australia’s history. These factors reduce real growth in payments in 2012-13. Since MYEFO, increased payments have further contributed to the increase in real growth in payments in 2011-12 and will detract from real growth in 2012-13. These increased payments include: the Schoolkids Bonus; the bring forward of payments for local government services; and earlier-than-expected payment for the Ipswich Motorway upgrade (Dinmore to Goodna), which is expected to be completed ahead of schedule.
The commitment to restrain real growth in spending to 2 per cent, on average, until surpluses are at least 1 per cent of GDP and while the economy is growing at or above trend will continue to restrain government expenditure.

Statement 3: Fiscal strategy and outlook
3-9
The sustainability of Government finances has also been improved as many of the budget savings identified deliver continuing benefits to the bottom line beyond the forward estimates.
FISCAL OUTLOOK
An underlying cash surplus of $1.5 billion (0.1 per cent of GDP) is expected in 2012-13, largely unchanged from the estimate at MYEFO. In accrual terms, a fiscal surplus of $2.5 billion (0.2 per cent of GDP) is expected for 2012-13.
Table 4: Australian Government general government sector budget aggregates Actual Estimates Projections2010-11 2011-12 2012-13 2013-14 2014-15 2015-16
$b $b $b $b $b $bReceipts(a) 302.0 330.0 368.8 392.5 413.6 438.4Per cent of GDP 21.6 22.3 23.8 24.0 24.0 24.2
Payments(b) 346.1 371.3 364.2 387.3 404.9 427.3Per cent of GDP 24.7 25.1 23.5 23.7 23.5 23.6
Future Fund earnings 3.7 3.0 3.0 3.2 3.4 3.7
Underlying cash balance(c) -47.7 -44.4 1.5 2.0 5.3 7.5Per cent of GDP -3.4 -3.0 0.1 0.1 0.3 0.4
Revenue(a) 309.9 336.4 376.1 402.2 424.8 449.6Per cent of GDP 22.1 22.8 24.2 24.6 24.7 24.8
Expenses 356.1 373.7 376.3 398.5 416.4 439.0Per cent of GDP 25.4 25.3 24.3 24.4 24.2 24.2
Net operating balance -46.2 -37.3 -0.2 3.7 8.4 10.5Net capital investment 5.3 4.7 -2.7 1.0 1.4 1.1
Fiscal balance -51.5 -42.0 2.5 2.6 7.0 9.5Per cent of GDP -3.7 -2.8 0.2 0.2 0.4 0.5
Memorandum item:Headline cash balance -51.1 -48.4 -8.7 -6.8 -0.1 2.0 (a) Includes expected Future Fund earnings. (b) Equivalent to cash payments for operating activities, purchases of non-financial assets and net
acquisition of assets under finance leases. (c) Excludes expected Future Fund earnings.
Underlying cash balance estimates
The increase in the estimated 2011-12 underlying cash deficit since MYEFO is largely a result of changes in economic circumstances reducing tax receipts, as well as new policy decisions that have increased payments including the Schoolkids Bonus and the bring forward of payments for local government services.
A small underlying cash surplus of $1.5 billion is expected in 2012-13. The downward revision to total parameter and other variations of just under $2.9 billion since MYEFO has been offset by policy decisions of just over $2.9 billion.
Table 5 provides a reconciliation of the variations in the underlying cash balance since the 2011-12 Budget.

Statement 3: Fiscal strategy and outlook
3-10
Table 5: Reconciliation of underlying cash balance estimates Estimates Projections
2011-12 2012-13 2013-14 2014-15$m $m $m $m
2011-12 Budget underlying cash balance(a) -22,618 3,498 3,672 5,795Per cent of GDP -1.5 0.2 0.2 0.3
Changes from 2011-12 Budget to 2011-12 MYEFOEffect of policy decisions(b) -4,860 2,857 3,701 4,676Effect of parameter and other variations -9,634 -4,876 -5,509 -7,363Total variations -14,495 -2,019 -1,808 -2,687
2011-12 MYEFO underlying cash balance(a) -37,113 1,479 1,864 3,108Per cent of GDP -2.5 0.1 0.1 0.2
Changes from 2011-12 MYEFO to 2012-13 BudgetEffect of policy decisions(b)(c)
Receipts 76 2,021 3,680 4,915Payments 2,777 -903 -253 2,424
Total policy decisions impact on underlying cash balance -2,701 2,924 3,934 2,491
Effect of parameter and other variations(c)Receipts(d) -6,117 -7,825 -7,797 -7,288Payments -1,529 -4,958 -4,043 -7,007
Total parameter and other variations impact on underlying cash balance -4,588 -2,867 -3,754 -281
2012-13 Budget underlying cash balance(a) -44,402 1,536 2,044 5,318
Per cent of GDP -3.0 0.1 0.1 0.3 (a) Excludes expected Future Fund earnings. (b) Excludes secondary impacts on public debt interest of policy decisions and offsets from the contingency
reserve for decisions taken. (c) A positive number for receipts indicates an increase in the underlying cash balance, while a positive
number for payments indicates a decrease in the underlying cash balance. (d) Receipts will differ from the cash receipts reconciliation published in Budget Statement 5 because they
exclude Future Fund earnings.
Receipt estimates
Since MYEFO, receipts have been revised down by $6.1 billion in 2011-12 and $7.8 billion in 2012-13, largely reflecting changes in economic circumstances.
This largely reflects a downward revision to tax receipts. Tax receipts (excluding GST) have declined by $3.8 billion in 2011-12 and $4.6 billion in 2012-13. The main downward revisions have been to company and superannuation taxes, principally reflecting high levels of investment-related tax deductions with the mining sector, weak profitability outside the resources and resources-related sectors, and sluggish asset prices.
New policy decisions have increased receipts by $76 million in 2011-12 and $2.0 billion in 2012-13. Around a third of these savings in 2012-13 relate to decisions taken not to proceed with (or defer) some previously announced tax measures that would otherwise have reduced tax receipts. The decisions in this Budget not to proceed with some measures will maintain tax liabilities at present levels.
Statement 3: Fiscal strategy and outlook
3-11
Major policy decisions that have increased receipts from 2011-12 to 2015-16 include:
• not proceeding with lowering the company tax rate, which was due to commence from the 2013-14 income year, nor the early start to lowering the company tax rate for small businesses, which was due to commence from 2012-13. The Government was not able to secure the necessary Parliamentary support and for this reason the decision not to proceed with the company tax cut will now help fund initiatives to spread the benefits of the resources boom to help families on low and middle incomes and support business investment. This measure is expected to increase cash receipts by $4.6 billion over the five years to 2015-16, which includes a reduction in receipts from the unwinding of the associated growth dividend;
• not proceeding with the standard deduction for work-related expenses and the cost of managing tax affairs, which was scheduled to commence on 1 July 2013, as the Government is pursuing other simplification measures, such as trebling the tax free threshold. This will increase cash receipts by $1.6 billion over the four years to 2015-16;
• deferring the higher concessional contribution caps for individuals over 50 with superannuation balances below $500,000 to 1 July 2014, which was due to start on 1 July 2012, increasing cash receipts by $1.4 billion over the four years to 2015-16;
• increasing cash receipts by $1.1 billion over the four years to 2015-16 by providing $106 million over four years to the Australian Taxation Office (ATO) to increase the ATO’s collections of outstanding taxation debts and superannuation guarantee charges. This has no impact in fiscal balance terms;
• further reform to the fringe benefits tax concessions for living-away-from-home allowances and benefits by limiting access to the concessions. This measure increases cash receipts by $1.0 billion over the four years to 2015-16;
• reducing the higher tax concession for superannuation contributions of very high income earners, increasing cash receipts by $1.0 billion over the four years to 2015-16;
• extending the 2010-11 Budget measure to fund additional GST compliance activities to promote voluntary compliance by a further two years, increasing cash receipts by $1.1 billion over the four years to 2015-16; and
• not proceeding with the 50 per cent tax discount for interest income which was due to commence on 1 July 2013, saving $795 million over the four years to 2015-16.

Statement 3: Fiscal strategy and outlook
3-12
The impact of these policy decisions on receipts has been partially offset by a number of decisions that have reduced receipts, including:
• allowing companies to carry back tax losses so they receive a refund against tax previously paid, decreasing receipts by $700 million over the four years to 2015-16; and
• increasing the Medicare levy low-income thresholds to $19,404 for individuals and $32,743 for families for the 2011-12 income year, with effect from 1 July 2011, with a cost to the budget of $85 million over the four years to 2015-16.
The effect of the carbon price on the budget is outlined in Box 1.

Statement 3: Fiscal strategy and outlook
3-13
Box 1: Effect of the carbon price on the budget
The Carbon Pricing Mechanism will commence from 1 July 2012, with a fixed price period of three years (commencing at $23 in 2012-13). The 2012-13 Budget includes for the first time carbon price estimates for the 2015-16 projection year, when the scheme will transition to a flexible price and be linked to the international market. In the flexible price period, international carbon prices are expected to set the domestic carbon price.
The Carbon Pricing Mechanism is expected to raise $24.7 billion in receipts over the forward estimates. The receipt estimates incorporate a carbon price for 2015-16 of $29, based on Treasury modelling in Strong Growth, Low Pollution. Budget projection year parameters generally rely on longer-term factors such as those captured in the Strong Growth, Low Pollution modelling.
Over the four years to July 2011, daily international carbon prices traded in the range of $14 to $50. Trading in the futures markets, however, is thin and sporadic for contracts as far out as 2015. More recently, traded international prices have fallen, in part due to the downturn in Europe. The unsettled global economic outlook is contributing to uncertainty around the future path of carbon prices.
Potential policy and regulatory change, particularly in the European Union Emissions Trading Scheme (EU ETS), has added to uncertainty around future carbon prices at this time. The EU recently brought forward a scheduled report on their scheme to 2012, which is now expected in coming months. Following this, the EU may consider policy options to increase the current low prices in the EU ETS, with implications for international carbon prices.
These circumstances indicate that the most suitable long-run carbon price projection remains the Treasury projections in Strong Growth, Low Pollution.
Any change in international carbon prices would have an impact on the estimates of the Clean Energy Future package included in the Budget. As well as affecting carbon price receipts, a different carbon price would also affect the cost of assistance provided under the Clean Energy Future package. Assistance under the Jobs and Competitiveness Program and permit-based assistance under the Energy Security Fund will move in line with the carbon price. Household assistance is permanent and will not be reduced.
To the extent that the carbon price is different than that modelled, it will have a different impact on consumer prices. For example, a lower carbon price would lead to a lower impact on consumer prices which would benefit households given the Government’s household assistance package remains fixed.
Statement 3: Fiscal strategy and outlook
3-14
Box 1: Effect of the carbon price on the budget (continued)
While forward auctions of carbon permits will be conducted in 2013-14 and 2014-15, changes in the international carbon price parameter would have only a small impact on total budget revenues in those years. In 2015-16, the budget would be firmly in surplus even if the price floor of $15 were to bind.
Payment estimates
Since MYEFO, total cash payments for 2012-13 have decreased by $5.9 billion, comprised of new policy decisions which have reduced payments by a net $903 million and parameter and other variations which have reduced payments by $5.0 billion.
Major policy decisions since MYEFO that have increased cash payments in 2012-13 and over the four years to 2015-16 include:
• spreading the benefits of the resources boom by: increasing the maximum rate of Family Tax Benefit Part A (FTB-A) by $300 per annum for families with one child and $600 per annum for families with two or more children from 1 July 2013. For families receiving the base rate of FTB-A, the increase will be $100 for families with one child and $200 for families with two or more children; and introducing a new supplement for eligible income support recipients to assist with cost of living pressures. These measures are expected to increase cash payments by $153 million in 2012-13 ($2.9 billion over the four years to 2015-16);
• continuing Australia’s military contribution to international stabilisation in East Timor, in Afghanistan and the wider Middle East Area of Operations, and Solomon Islands. These measures are expected to increase payments by $1.0 billion in 2012-13 ($1.4 billion over the four years to 2015-16);
• replacing the Education Tax Refund with a new Schoolkids Bonus provided through the transfer system at a cost of $2.4 billion over five years to 2015-16. This measure increases payments by $1.3 billion in 2011-12 and reduces costs by $105 million in 2012-13 because of differences in the timing of payments under the new arrangements;
• the first stage of a National Disability Insurance Scheme which will provide support to people with a significant and permanent disability in up to four launch locations around Australia from 2013-14. This measure is expected to increase payments by $84 million in 2012-13 ($1.0 billion over the four years to 2015-16);
• funding for the Government’s Aged Care Reform package, which includes initiatives to increase the number of home care services, funding to attract and retain staff and improve the quality of care for older Australians, and increase support to people with dementia. These measures are expected to increase payments by $55 million in 2012-13 ($284 million over the four years to 2015-16);

Statement 3: Fiscal strategy and outlook
3-15
• support for a range of Dental Health measures including funding to alleviate pressure on public dental waiting lists, increasing the size and capacity of the dental workforce, and funding for national oral health promotion activities. These measures are expected to increase payments by $85 million in 2012-13 ($515 million over four years to 2015-16). This funding is partially offset by the decision not to proceed with the Commonwealth Dental Health Program (saving $94 million in 2012-13 and $290 million over three years to 2014-15); and
• funding to construct a new Commonwealth-operated Post-Entry Quarantine facility, commencing operations in 2015-16, to replace existing facilities as leases expire. The funding will also cover maintenance of core biosecurity operations and continue progress on reforming Australia’s biosecurity system. These measures are expected to increase payments by $67 million in 2012-13 ($365 million over the four years to 2015-16).
The impact of these policy decisions on payments has been partially offset by a number of decisions that have reduced cash payments, including:
• changing the eligibility for Parenting Payment from 1 January 2013 for all recipients who were receiving the payment prior to 1 July 2006 to align eligibility for all parents receiving parenting payments. This measure is expected to decrease payments by $97 million in 2012-13 ($687 million over four years to 2015-16);
• limiting eligibility for FTB-A to young people under 18 years of age, or where a young person remains in secondary school, the end of the calendar year in which they turn 19. This change will focus payments in the family assistance system on families with children who are at school, while Youth Allowance will become the primary form of assistance to eligible young adults. This measure is expected to decrease cash payments by $25 million in 2012-13 ($312 million over the four years to 2015-16);
• restructuring apprenticeship incentive payments for existing workers in occupations not on the National Skills Needs List, by removing the $1,500 commencement payment and increasing the completion payment by $500, which is expected to save $60 million in 2012-13 ($354 million over the four years to 2015-16);
• improving the targeting of the Extended Medicare Safety Net to help manage Medicare expenditure whilst continuing to provide support for people with high out-of-pocket costs. This measure is expected to decrease cash payments by $8 million in 2012-13 ($95 million over the four years to 2015-16);
• deferring the commitment to spend 0.5 per cent of Gross National Income on Official Development Assistance by one year to 2016-17 which is expected to decrease payments by $447 million in 2012-13 ($2.9 billion over the four years to 2015-16);
Statement 3: Fiscal strategy and outlook
3-16
• deferring some Defence acquisitions, adjusting the Defence capital equipment program and delivering further operating efficiencies, while delivering priority 2009 White Paper capabilities. This is expected to reduce payments by $971 million in 2012-13 ($5.5 billion over the four years to 2015-16); and
• accelerating funding for Local Government Financial Assistance Grants to assist in the response to challenges arising from natural disasters in 2010-11 and 2011-12. This measure is expected to reduce payments by $1.1 billion in 2012-13 and increase cash payments by the same amount in 2011-12.
Further details of Government policy decisions are provided in Budget Paper No. 2, Budget Measures 2012-13. The expense estimates provided in Budget Paper No. 2 are in accrual terms and may not align exactly with the underlying cash payments figures provided in this Statement.
Major increases in expected payments in 2012-13, as a result of parameter and other variations since MYEFO, include:
• natural disaster relief payments to the States under the Natural Disaster Relief and Recovery Arrangements, which are expected to be $324 million higher in 2012-13 largely reflecting increased costs and changed timing for the submission of State claims;
• Disability Support Pension (DSP) payments which are expected to be $353 million higher in 2012-13 ($1.5 billion over the four years to 2015-16) due to an increase in the estimated number of DSP recipients, partly offset by slightly lower than anticipated average pension rates;
• offshore asylum seeker management costs, which are expected to be $378 million higher in 2012-13 ($1.3 billion over the four years to 2015-16) due to increased estimates of expected costs for holding irregular maritime arrivals in detention;
• Medicare Services payments which are expected to be $232 million higher in 2012-13 mainly reflecting the extension of the Chronic Disease Dental Scheme (CDDS) to 30 September 2012 as a result of the Senate disallowing the determination to close the program. The closure of the CDDS remains government policy;
• employee assistance payments which are expected to be $115 million higher in 2012-13 ($469 million over four years to 2015-16) mainly due to an increase in demand for the General Employee Entitlements and Redundancy Scheme. This scheme provides assistance to employees of bankrupt businesses who are owed certain employee entitlements; and
• Commonwealth Grants Scheme payments to universities which are expected to be $103 million higher in 2012-13 ($993 million over the four years to 2015-16) due to

Statement 3: Fiscal strategy and outlook
3-17
faster-than-expected growth in university enrolments following the Government’s decision in 2009 to uncap enrolment numbers from 2012. The uncapping of enrolment numbers also affects tertiary student assistance payments which are expected to be $278 million higher in 2012-13 ($1.2 billion over the four years to 2015-16).
Major reductions in expected payments in 2012-13 as a result of parameter and other variations since MYEFO include:
• GST payments to the States and Territories consistent with a reduction in GST receipts ($2.9 billion in 2012-13 and $13.8 billion over the four years to 2015-16);
• reprofiling infrastructure spending ($927 million in 2012-13 and $957 million over four years to 2015-16). This reflects the earlier-than-expected completion of some projects, reprofiling rail payments to the States and Territories to better align funding with the delivery of projects, and the slippage in the Regional Infrastructure Fund payments due to the need for comprehensive project evaluations;
• Income Support for Seniors payments which are expected to be $229 million lower in 2012-13 ($1.2 billion over the four years to 2015-16) because of lower than previously forecast growth in payment rates as a result of lower forecasts for indexation parameters than those expected at MYEFO;
• defence force superannuation benefits which are expected to be $130 million lower in 2012-13 ($457 million over the four years to 2015-16) due to lower exit rates and a higher proportion of benefits taken as a pension in place of a lump sum payment. These factors will lead to higher superannuation costs beyond the forward estimates for defence force personnel; and
• Income Support for Carers payments which are expected to be $56 million lower in 2012-13 ($348 million over the four years to 2015-16) due to a lower-than-projected number of recipients partially offset by an increase in average payment rates.
As a consequence of the weaker fiscal outlook in the near term, and lower interest rates, net interest payments have increased by $158 million in 2012-13 but decreased by $1.1 billion over the four years to 2015-16.
Consistent with previous budgets, the underlying cash balance has been improved by the regular draw down of the conservative bias allowance. Details of this draw down are provided in Appendix B of Statement 6, Expenses and Net Capital Investment.

Statement 3: Fiscal strategy and outlook
3-18
Fiscal balance estimates
The fiscal surplus is expected to be $2.5 billion (0.2 per cent of GDP) in 2012-13, a decrease of $2.2 billion since MYEFO.
Table 6 provides a reconciliation of the variations in the fiscal balance since the 2011-12 Budget.
Table 6: Reconciliation of fiscal balance estimates Estimates Projections
2011-12 2012-13 2013-14 2014-15$m $m $m $m
2011-12 Budget fiscal balance -20,262 3,966 3,166 8,539Per cent of GDP -1.4 0.3 0.2 0.5
Changes from 2011-12 Budget to 2011-12 MYEFOEffect of policy decisions(a) -5,589 4,958 2,820 3,555Effect of parameter and other variations -6,599 -4,210 -1,828 -5,700Total variations -12,188 748 993 -2,144
2011-2012 MYEFO fiscal balance -32,450 4,714 4,159 6,395Per cent of GDP -2.2 0.3 0.3 0.4
Changes from 2011-12 MYEFO to 2012-13 BudgetEffect of policy decisions(a)(b)
Revenue 76 1,722 3,362 4,763Expenses 1,951 201 773 3,095Net capital investment 46 -532 -930 -648
Total policy decisions impact on fiscal balance -1,921 2,053 3,519 2,316
Effect of parameter and other variations(b)Revenue -7,768 -8,415 -8,707 -8,084Expenses -27 -3,864 -2,893 -5,509Net capital investment -110 -285 -781 -884
Total parameter and other variations impact on fiscal balance -7,631 -4,267 -5,032 -1,691
2012-13 Budget fiscal balance -42,002 2,500 2,646 7,020Per cent of GDP -2.8 0.2 0.2 0.4 (a) Excludes secondary impacts on public debt interest of policy decisions and offsets from the contingency
reserve for decisions taken. (b) A positive number for revenue indicates an increase in the fiscal balance, while a positive number for
expenses and net capital investment indicates a decrease in the fiscal balance.
Revenue estimates
Changes in revenue are generally driven by the same factors as receipts, though differences arise where revenue raised in a given year is not received in that year (see Appendix E of Statement 5, Revenue, for further information on the difference between accrual and cash estimates).

Statement 3: Fiscal strategy and outlook
3-19
Expense estimates
Movements in accrual expenses over the forward estimates are broadly similar to the movements in cash payments. The key exceptions include:
• superannuation benefits where there are differences between timing of cash payments and accrued expenses; and
• the Natural Disaster Relief and Recovery Arrangements, where expenses are being recognised at a different time to cash payments.
More detailed information on expenses can be found in Statement 6, Expenses and Net Capital Investment.
Net capital investment estimates
Forecast net capital investment for 2011-12 is largely unchanged since MYEFO.
In 2012-13 net capital investment is forecast to be $816 million lower than forecast in MYEFO, largely reflecting adjustments in the Defence capital equipment program, including deferring some Defence acquisitions, and water purchases under the Restoring the Balance in the Murray-Darling Basin program.
Fluctuations in the exchange rate since MYEFO have also resulted in the forecasts of net capital investment being reduced across the forward estimates.
More detailed information on net capital investment can be found in Statement 6.
Net debt, net financial worth and net worth
The further write down to tax receipts has contributed to higher estimated net debt, and lower net worth and net financial worth than was expected at MYEFO.
The Australian Government’s net debt continues to remain very low by international standards. While the average net debt for major advanced economies is expected to peak at around 93 per cent of GDP in 2016 and 2017, Australia’s net debt will peak at 9.6 per cent of GDP in 2011-12. It is expected to reduce to 7.3 per cent of GDP by 2015-16.
Net debt for the Australian Government general government sector is forecast to be $143.3 billion (9.2 per cent of GDP) in 2012-13, $10.1 billion higher than forecast at MYEFO.
The change in the projected level of net debt in 2012-13 since MYEFO is driven primarily by an increase in the value of the existing stock of Commonwealth Government Securities (CGS) on issue owing to lower interest rates. It also reflects an increase in issuance owing to the weaker fiscal outlook in 2011-12, partially offset by an increase in the value of certain investments held by the Future Fund.

Statement 3: Fiscal strategy and outlook
3-20
The changes to net debt described above also impact on net financial worth and net worth.
• Net financial worth is estimated to be –$248.6 billion in 2012-13, compared to the MYEFO estimate of -$228.3 billion.
• Net worth is forecast to be –$137.8 billion in 2012-13, compared to the MYEFO estimate of -$115.9 billion.
In addition to factors driving the change in the net debt position, the change in net financial worth and net worth also reflect the upward revaluation of the Australian Government’s superannuation liability.
Further details on the balance sheet are outlined in Statement 7, Asset and Liability Management.
Table 7 provides a summary of Australian Government general government sector net financial worth, net worth, net debt and net interest payments.
Table 7: Australian Government general government sector net financial worth, net worth, net debt and net interest payments
Estimates Projections2011-12 2012-13 2013-14 2014-15 2015-16
$b $b $b $b $bFinancial assets 216.3 238.5 255.4 269.6 283.4Non-financial assets 109.5 110.9 111.5 112.2 114.0Total assets 325.8 349.4 366.8 381.9 397.4
Total liabilities 467.6 487.2 499.6 505.5 509.1
Net worth -141.8 -137.8 -132.8 -123.6 -111.8
Net financial worth(a) -251.3 -248.6 -244.3 -235.9 -225.8Per cent of GDP -17.0 -16.0 -15.0 -13.7 -12.4
Net debt(b) 142.5 143.3 144.9 140.1 131.6Per cent of GDP 9.6 9.2 8.9 8.1 7.3
Net interest payments 6.5 7.0 6.8 7.0 8.2Per cent of GDP 0.4 0.5 0.4 0.4 0.4 (a) Net financial worth equals total financial assets minus total liabilities. (b) Net debt equals the sum of deposits held, government securities, loans and other borrowing, minus the
sum of cash and deposits, advances paid, and investments, loans and placements.
CGS on issue subject to the current legislative limit is projected to be below $250 billion at the end of each financial year across the forward estimates. The volume of CGS on issue at various times throughout the year is projected to exceed this level due to within-year fluctuations of CGS on issue. To manage most efficiently this normal within-year financing task, and to ensure flexibility in meeting the Government’s objective of maintaining a deep and liquid CGS market, an amendment will be sought to the Commonwealth Inscribed Stock Act 1911 to increase the legislative limit on CGS to $300 billion.

Statement 3: Fiscal strategy and outlook
3-21
Medium-term fiscal outlook
On current projections, the underlying cash surplus is expected to reach 1 per cent of GDP in 2017-18, the same year as projected in MYEFO (Chart 1). Net debt is projected to return to zero in 2020-21, also unchanged from MYEFO (Chart 2).
Towards the end of the medium term the projected surplus is slightly lower than expected at MYEFO. This reflects a downward revision to the projected participation rate which has flowed through to projections for GDP, tax receipts, and the surplus.
Chart 1: Underlying cash balance projected to 2022-23
-4
-3
-2
-1
0
1
2
-4
-3
-2
-1
0
1
2
2011-12 2013-14 2015-16 2017-18 2019-20 2021-22
Per cent of GDPPer cent of GDP
2012-13 Budget 2011-12 MYEFO
Source: Treasury projections.

Statement 3: Fiscal strategy and outlook
3-22
Chart 2: Government net debt projected to 2022-23
-4
-2
0
2
4
6
8
10
-4
-2
0
2
4
6
8
10
2011-12 2013-14 2015-16 2017-18 2019-20 2021-22
Per cent of GDPPer cent of GDP
2012-13 Budget 2011-12 MYEFO
Source: Treasury projections.

Statement 3: Fiscal strategy and outlook
3-23
APPENDIX A: SENSITIVITY OF BUDGET ESTIMATES TO
ECONOMIC DEVELOPMENTS
The estimates contained in the 2012-13 Budget are based on forecasts of the economic outlook. Changes to the economic assumptions underlying the estimates will impact on receipts and payments, and hence the size of the underlying cash balance.
This section examines the effects on receipts and payments of altering some of the key economic assumptions. Tables A2 and A4 illustrate the sensitivity of key components of receipts and payments to possible variations in the economic outlook. The two scenarios considered are:
• Scenario 1: a 1 per cent reduction in nominal GDP owing to a fall in the terms of trade.
• Scenario 2: a 1 per cent increase in real GDP driven by an increase in labour productivity and labour force participation, with each contributing equally.
The economic scenarios provide a rule of thumb indication of the impact on receipts, payments and the underlying cash balance of changes in the economic outlook. They represent a partial economic analysis only and do not attempt to capture all the economic feedback and other policy responses related to changed economic conditions. In particular, the analysis assumes no change in the exchange rate, interest rates or policy over the forecast period. The impact of the two scenarios on the economic parameters would be different if the full feedback response on economic variables and likely policy actions were taken into account. The analysis does not aim to provide an alternative picture of the economic forecasts under these scenarios, but instead gives an indication of the sensitivity associated with different components of receipts and payments to changes in the economy. As such, the changes in the economic variables and their impact on the fiscal outlook are merely illustrative.
The impacts shown in the tables below are broadly symmetrical. That is, impacts of around the same magnitude, but in the opposite direction, would apply if the terms of trade were to increase or if real GDP were to decrease.
Scenario 1
The first scenario involves a permanent fall in world prices of non-rural commodity exports in 2012-13 consistent with a fall in the terms of trade of around 4 per cent, which causes a 1 per cent fall in nominal GDP by 2013-14. The sensitivity analysis evaluates the flow-on effects on the economy, the labour market and prices. The impacts in Table A1 are stylised and refer to per cent deviations from the baseline levels of the economic parameters.

Statement 3: Fiscal strategy and outlook
3-24
Table A1: Illustrative impact of a permanent non-rural commodity price fall consistent with a 1 per cent fall in nominal GDP by 2013-14 (per cent deviation from the baseline level)
2012-13 2013-14per cent per cent
Real GDP 0 - 1/4Non-farm GDP deflator - 3/4 - 3/4Employment - 1/4 - 1/2Wages 0 - 1/4CPI 0 - 1/4Company profits -3 -3 Consumption - 1/4 - 1/2 Assuming no change in exchange rates or interest rates, the fall in export prices leads directly to a lower non-farm GDP deflator (from the export component of GDP) and lower domestic incomes. Lower domestic incomes cause both consumption and investment to fall, resulting in lower real GDP, employment and wages. The fall in aggregate demand puts downward pressure on domestic prices.
In reality, a fall in the terms of trade would be expected to lead to a fall in the exchange rate, although the magnitude is particularly uncertain in the short term. In the event of a fall in the exchange rate, the impacts on the external sector would dampen the real GDP effects, and there would be some offsetting upward pressure on domestic prices.
Given these assumptions, the overall impact of the fall in the terms of trade is a decrease in the underlying cash balance of around $3.4 billion in 2012-13 and around $7.1 billion in 2013-14 (see Table A2).
Table A2: Illustrative sensitivity of the budget balance to a 1 per cent decrease in nominal GDP due to a fall in the terms of trade
2012-13 2013-14$b $b
ReceiptsIndividuals and other withholding taxation -0.6 -2.0Superannuation taxation 0.0 -0.2Company tax -2.1 -3.9Resource rent taxes -0.5 -0.6Goods and services tax -0.1 -0.2Excise and customs duty 0.0 -0.1Other taxation 0.0 0.0
Total receipts -3.3 -7.0Payments
Income support -0.1 -0.2Other payments 0.0 0.1Goods and services tax 0.1 0.2
Total payments 0.0 0.1PDI -0.1 -0.2
Underlying cash balance impact -3.4 -7.1
Statement 3: Fiscal strategy and outlook
3-25
On the receipts side, a fall in the terms of trade results in a fall in nominal GDP which reduces tax collections. The largest impact is on company tax receipts as the fall in export income decreases company profits. Owing to lags in the tax system, the effect on company tax is larger in 2013-14. Lower company profits are assumed to flow through to lower Australian equity prices, therefore reducing capital gains tax from individuals, companies and superannuation funds.
The weaker economy results in lower aggregate demand, which flows through to lower employment and wages, reducing individuals’ income tax receipts. The decrease in disposable incomes leads to lower consumption, which in turn results in a decrease in GST receipts (decreasing GST payments to the states by the same amount) and other indirect taxes.
On the payments side, a significant proportion of government expenditure is partially indexed to movements in costs (as reflected in various price and wage measures). Some forms of expenditure, in particular income support payments, are also driven by the number of beneficiaries.
The overall estimated expenditure on income support payments (including pensions and allowances) increases in both years because of a higher number of unemployment benefit recipients. The increase in unemployment benefits in 2013-14 is partly offset by reduced expenditure on pensions and allowances reflecting lower growth in benefit rates resulting from lower wages growth and lower inflation. At the same time other payments linked to inflation fall in line with the reduced growth in prices.
The reduction in the underlying cash balance results in a higher borrowing requirement and a higher public debt interest cost.
As noted above, under a floating exchange rate, the fall in the exchange rate would damp the effects of the fall in the terms of trade on real GDP, meaning the impact on the fiscal position could be substantially more subdued. Also, to the extent that the fall in the terms of trade is temporary rather than permanent, the impact on the economic and fiscal position would be more subdued.
Scenario 2
The second scenario involves a permanent 0.5 per cent increase in both the participation rate and labour productivity, resulting in a 1 per cent increase in real GDP in 2012-13. Once again, the sensitivity analysis evaluates the flow-on effects on the economy, the labour market and prices. The impacts in Table A3 are stylised and refer to per cent deviations from the baseline levels of the parameters.
The 1 per cent increase in real GDP increases nominal GDP by slightly less but the magnitude of the effects on receipts, payments and the underlying cash balance differ from the first scenario because different parts of the economy are affected in different ways.

Statement 3: Fiscal strategy and outlook
3-26
Table A3: Illustrative impact of an ongoing equal increase in both labour productivity and participation consistent with a 1 per cent increase in real GDP in 2012-13 (per cent deviation from the baseline level)
2012-13 2013-14per cent per cent
Nominal GDP 3/4 3/4Non-farm GDP deflator - 1/4 - 1/4Employment 1/2 1/2Wages 1/4 1/4CPI - 1/4 - 1/4Company profits 1 3/4 1 3/4Consumption 1 1 The increases in labour force participation and labour productivity have the same impact on output, but different impacts on the labour market. Higher productivity leads to higher real GDP and higher real wages, while an increase in the participation rate increases employment and real GDP. Imports are higher in this scenario, reflecting higher domestic incomes.
Since the supply side of the economy expands, inflation falls relative to the baseline. The lower domestic prices make exports more attractive to foreigners, with the resulting increase in exports offsetting higher imports, leaving the trade balance unchanged. The exchange rate is assumed to be unchanged.
The overall impact of the increase in labour productivity and participation is an increase in the underlying cash balance of around $3.3 billion in 2012-13 and around $4.4 billion in 2013-14 (see Table A4).
Table A4: Illustrative sensitivity of the budget balance to a 1 per cent increase in real GDP due to an equal increase in both productivity and participation
2012-13 2013-14$b $b
ReceiptsIndividuals and other withholding taxation 1.7 1.3Superannuation taxation 0.1 0.2Company tax 1.2 2.5Goods and services tax 0.5 0.4Excise and customs duty 0.2 0.2Other taxation 0.1 0.1
Total receipts 3.8 4.7Payments
Income support -0.1 -0.1Other payments 0.0 0.0Goods and services tax -0.5 -0.4
Total payments -0.6 -0.5PDI 0.1 0.2
Underlying cash balance impact 3.3 4.4 On the receipts side, individuals’ income tax collections increase because of the rise in the number of wage earners and, additionally, higher real wages. The stronger labour

Statement 3: Fiscal strategy and outlook
3-27
market also increases tax collections from superannuation funds because contributions (including compulsory contributions) are higher. The increase in personal incomes leads to higher consumption which results in an increase in GST receipts (with the corresponding receipts passed on in higher GST payments to the states). In addition, the stronger economy results in higher levels of corporate profitability, increasing company taxes.
On the payments side, overall estimated expenditure on income support payments (including pensions and allowances) is slightly higher primarily reflecting growth in benefit rates through their indexation to wages. Lower inflation has a partially offsetting effect.
On balance, the rise in estimated tax collections is only partially offset by increased payments. This improves the underlying cash position, which results in a lower borrowing requirement and lower public debt interest cost.
To the extent that the increases in productivity and participation are temporary rather than permanent, the impact on the economic and fiscal position would be more subdued.


4-1
STATEMENT 4: BUILDING RESILIENCE THROUGH
NATIONAL SAVING
The statement discusses Australia’s path to building its national saving and the role of Government policy in continuing this transition.
Higher national saving in recent years reflects the maturing of the compulsory superannuation system introduced in the mid-1980s and a rise in household saving, particularly following the global financial crisis. The Government’s increase in the superannuation guarantee and structural changes in household saving behaviour mean that high levels of saving will likely be maintained over coming years.
Consistent with the Government’s medium-term fiscal strategy, further improvements in government saving are desirable with the economy forecast to grow around trend. In line with this, the Government will return the budget to surplus in 2012-13 and beyond.
Delivering surpluses, along with a further boost to superannuation, will foster fiscal sustainability in the context of an ageing population, and ensure the Government is not contributing to price pressures in the economy, providing scope for monetary policy to respond to economic developments. Higher national saving will also improve economic resilience by reducing Australia’s vulnerability to external shocks.
Introduction .................................................................................................. 4-3
The benefits of higher saving ..................................................................... 4-4
Building a high saving economy ................................................................ 4-5 Australia compares well against advanced economies ............................................... 4-5 Superannuation and changed household behaviour have driven higher national saving ............................................................................................................. 4-6
Higher national saving improves macroeconomic resilience ................ 4-13 Superannuation is a growing source of domestic finance ......................................... 4-13 Our reliance on external debt has fallen .................................................................... 4-14
Government saving promotes macroeconomic stability and fiscal sustainability .............................................................................................. 4-16 Responsible fiscal policy requires the budget to be returned to surplus .................... 4-17 Government saving is important for managing demographic challenges .................. 4-18 Government saving will help in managing the high terms of trade ............................ 4-19
Conclusion .................................................................................................. 4-22
References .................................................................................................. 4-24


4-3
STATEMENT 4: BUILDING RESILIENCE THROUGH
NATIONAL SAVING
INTRODUCTION
The compulsory superannuation system has made an important contribution to national saving since it began to be phased-in from the mid-l980s.
More recently, the significant increase in national savings likely reflects a combination of a return to more sustainable rates of consumption growth and cautious households consolidating their financial position — particularly by reducing the pace of their debt accumulation. This increase in saving is important for a number of reasons.
• A higher level of national saving helps moderate price pressures in the economy, providing scope for monetary policy to respond to economic developments.
• While the terms of trade are likely to remain at high levels for some time yet, some portion of our current national income is likely to be temporary and so it is prudent to save more now for the future.
• With the international economic environment more uncertain, borrowing less and saving more makes Australia more resilient to possible external shocks.
• The ageing of Australia’s population means that there are benefits to saving more as a country now to support a progressively older population, before the impacts of population ageing become increasingly important from around the end of the decade.
The Government’s planned increases in compulsory superannuation contributions will consolidate and build on the increase in national saving in the second half of the 2000s, with the revenue cost of this measure funded from the proceeds of the Minerals Resource Rent Tax. Further, delivering on the Government’s fiscal strategy of budget surpluses on average over the medium-term ensures that the Government will make a positive contribution to national saving.
Consistent with this strategy, returning the Budget to surplus from 2012-13 will contribute to national saving and maintain confidence in the strength of Australia’s public finances. This will support Australia’s capacity to respond to unexpected adverse events.
Delivering surpluses will also improve medium-term fiscal sustainability and macroeconomic stability by helping to manage the challenges of demographic change and the high terms of trade.

Statement 4: Building Resilience Through National Saving
4-4
THE BENEFITS OF HIGHER SAVING
Households can maximise welfare by using part of their current income to fund increased future, rather than current, consumption; that is, by saving. This is achieved by investing in assets that raise future income and can be drawn on to finance consumption at a later date.
From a household perspective, saving serves three broad objectives:
• allowing consumption to be smoothed over time;
• increasing future consumption possibilities, including for future generations; and
• improving resilience, by providing a buffer against unanticipated adverse events (precautionary saving).
Increasing saving can improve welfare by helping households better manage their consumption over time, including their exposure to risks.
Government policies that encourage saving normally reflect the objectives outlined above. This may require governments to correct for factors that can lead households to insufficiently provide for their retirement and other needs. In this regard Australia’s superannuation system is important in improving retirement income adequacy and putting government finances on a sustainable long-term footing. This contrasts starkly with many advanced countries which have failed to put such reforms in place.
Saving undertaken by governments can also help households to achieve these objectives. In particular, prudent fiscal policy focused on fiscal sustainability allows households to maintain stable incomes and assists the private sector in making sound saving and investment decisions by lowering uncertainty. Higher government saving creates a fiscal buffer for uncertain times and, by reducing demand, takes pressure off monetary policy.
Higher national saving has other macroeconomic implications. Higher saving can be expected to raise future national income over the medium-to-long term through some combination of two channels. Higher national saving may lead to higher investment, which underpins higher GDP. Alternatively, higher national saving results in higher investment income being retained in Australia or earned from overseas rather than being paid to foreign investors; that is, it helps reduce our reliance on foreign saving to drive the development of the economy.
An important example of this occurred during the global financial crisis (GFC) when Australia’s superannuation savings provided a funding source which could be drawn on by both the financial and corporate sectors.

Statement 4: Building Resilience Through National Saving
4-5
BUILDING A HIGH SAVING ECONOMY
Australia’s gross saving rate (gross national saving as a proportion of GDP) fell significantly from the mid-1970s to the early-1990s, reaching a low of 18.4 per cent in 1991-92. The gross national saving rate remained broadly steady between 1992-93 and 2004-05 at around 21 per cent, before beginning to rise in 2005-06. The advent of the GFC resulted in a sharp increase in the national saving rate, which reached 24.2 per cent in 2010-11 (Chart 1).
The net national saving rate (which is gross saving less depreciation) has followed the same trend and is currently around 9 per cent of GDP, up from around 5 per cent of GDP in the early 2000s.
Chart 1: Net and gross saving
0
5
10
15
20
25
30
35
0
5
10
15
20
25
30
35
1960-61 1970-71 1980-81 1990-91 2000-01 2010-11
Per cent of GDPPer cent of GDP
Gross
Depreciation
Net
Source: ABS cat. no. 5260.0.
Australia compares well against advanced economies
After being below average for much of the 1990s, Australia’s gross national saving rate in calendar year 2011 (24.8 per cent) was significantly above the advanced economy average (18.5 per cent) and slightly above the world average (24.0 per cent) (Chart 2).
The recent decline in advanced economy saving rates largely reflects cyclical economic weakness in other countries since the GFC. It is notable, however, that a significant gap between saving rates in Australia and other advanced economies had already opened up prior to the GFC. This suggests the difference in national saving trends has in part been due to other factors, including the long history of prudent fiscal policy outcomes and the maturation of Australia’s compulsory superannuation system.

Statement 4: Building Resilience Through National Saving
4-6
Chart 2: International comparison of gross national saving
15
18
21
24
27
15
18
21
24
27
1981 1986 1991 1996 2001 2006 2011
Per cent of GDPPer cent of GDP
Australia
World
Advanced
Note: All data based on calendar years. Source: ABS cat. no. 5206.0 and IMF World Economic Outlook April 2012.
The increase in saving has had important benefits for the economy. For example, in the context of an economy with low unemployment and a massive pipeline of mining investment, had the rise in national saving not occurred, tighter monetary policy would have been required to maintain macroeconomic stability.
Superannuation and changed household behaviour have driven higher national saving
Saving by households and corporations (which together make up private saving) accounts for the bulk of national saving. In particular, household saving has been the major driver of shifts in national saving over the past several decades. The household saving rate declined steadily from the mid-1970s to the mid-2000s, although this fall was exaggerated by the shift to incorporation of small businesses during this period (Chart 3).
In the second half of the 2000s, the gross household saving rate increased significantly and is currently 11.5 per cent of GDP, up from a low of 5.8 per cent in 2002-03.
The compulsory superannuation system has made an important contribution to household saving since it began to be phased-in from the mid-l980s. More recently, the increase in household saving likely reflects a combination of increased consumer caution following the GFC and a return to more sustainable rates of consumption growth, after a 30-year period in which declining saving rates and strong credit growth meant that consumption grew faster than incomes.

Statement 4: Building Resilience Through National Saving
4-7
Chart 3: Gross private saving by sector
0
5
10
15
20
25
0
5
10
15
20
25
1960-61 1970-71 1980-81 1990-91 2000-01 2010-11
Per cent of GDPPer cent of GDP
Household saving
Corporate saving
Source: ABS cat. no. 5206.0, 5232.0, 5204.0 and Treasury.
Superannuation and demographic changes have boosted national saving
The introduction of award-based superannuation in 1985 and Australia’s compulsory superannuation guarantee system in 1992 represents a key structural driver of Australia’s national saving rate.
The three-pillar structure of the Australian retirement income system — the age pension, compulsory saving through the superannuation guarantee and voluntary superannuation saving — is unique among developed countries, but has considerable strengths.1 In particular, it provides a system that satisfies the needs of all older Australians, provides the capacity for individuals to enhance their retirement income, and spreads risks between the public and private sectors in a fiscally responsible way (Australia’s Future Tax System 2009).
The introduction of the superannuation guarantee required employers to make superannuation contributions on behalf of their employees. The minimum contribution rate was increased gradually from 3 per cent in 1992 to 9 per cent over 10 years. This policy has significantly increased retirement income adequacy for Australian workers and boosted national saving — underscoring the importance of the compulsory superannuation system as a major long-term economic reform (Box 1).
1 The retirement income system in many Organisation for Economic Cooperation and Development (OECD) countries provides a taxpayer or contribution funded retirement income based on a proportion of an individual’s pre-retirement income. These countries also provide a minimum retirement income to alleviate poverty for those with a limited working life.
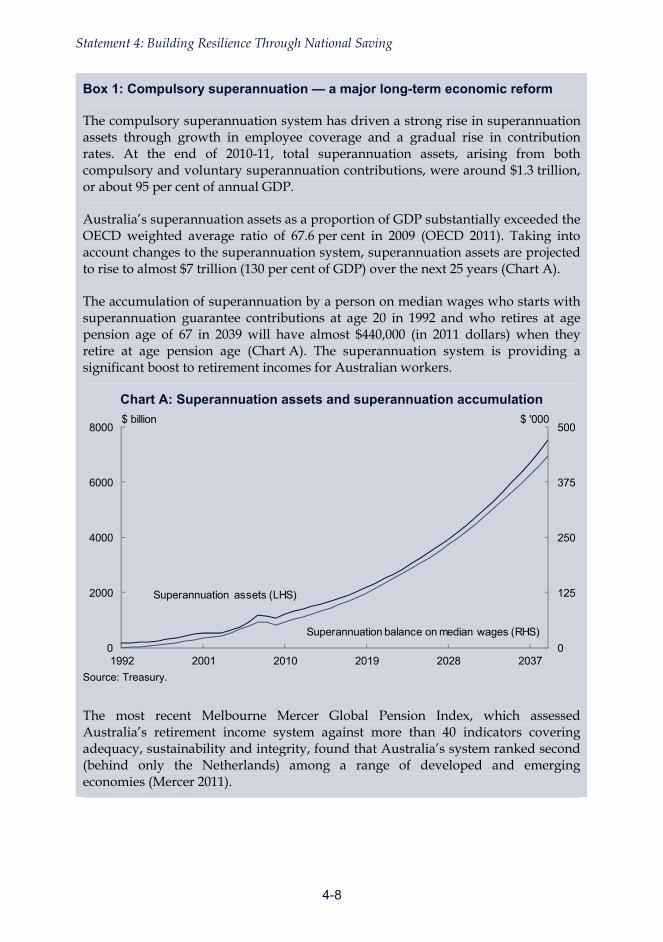
Statement 4: Building Resilience Through National Saving
4-8
Box 1: Compulsory superannuation — a major long-term economic reform
The compulsory superannuation system has driven a strong rise in superannuation assets through growth in employee coverage and a gradual rise in contribution rates. At the end of 2010-11, total superannuation assets, arising from both compulsory and voluntary superannuation contributions, were around $1.3 trillion, or about 95 per cent of annual GDP.
Australia’s superannuation assets as a proportion of GDP substantially exceeded the OECD weighted average ratio of 67.6 per cent in 2009 (OECD 2011). Taking into account changes to the superannuation system, superannuation assets are projected to rise to almost $7 trillion (130 per cent of GDP) over the next 25 years (Chart A).
The accumulation of superannuation by a person on median wages who starts with superannuation guarantee contributions at age 20 in 1992 and who retires at age pension age of 67 in 2039 will have almost $440,000 (in 2011 dollars) when they retire at age pension age (Chart A). The superannuation system is providing a significant boost to retirement incomes for Australian workers.
Chart A: Superannuation assets and superannuation accumulation
0
125
250
375
500
0
2000
4000
6000
8000
1992 2001 2010 2019 2028 2037
Superannuation balance on median wages (RHS)
Superannuation assets (LHS)
$ billion $ '000
Source: Treasury.
The most recent Melbourne Mercer Global Pension Index, which assessed Australia’s retirement income system against more than 40 indicators covering adequacy, sustainability and integrity, found that Australia’s system ranked second (behind only the Netherlands) among a range of developed and emerging economies (Mercer 2011).

Statement 4: Building Resilience Through National Saving
4-9
The Government’s decision in 2010 to progressively increase compulsory superannuation contributions from 9 per cent to 12 per cent by 2019-20 will further support the shift in household behaviour towards higher saving. That increase, in conjunction with the maturing of the existing superannuation system, is projected to add 1.5 per cent of GDP to national saving over the next 25 years with most of this increase expected to occur over the next decade (Chart 4).2
Chart 4: Estimated contribution of compulsory superannuation to national saving
0.0
0.5
1.0
1.5
2.0
2.5
3.0
3.5
0.0
0.5
1.0
1.5
2.0
2.5
3.0
3.5
1992 1997 2002 2006 2011 2016 2021 2026 2031 2035 2040 2045 2050
Per cent of GDPPer cent of GDPProjections
12 per cent
9 per cent
Note: Estimated contribution in history has been smoothed. Estimated contribution starts to decline approaching mid-century due to the indirect effects of population ageing. The 9 per cent line incorporates the gradual phase-in from 3 per cent in 1992 to 9 per cent in 2002-03, while the 12 per cent line incorporates the gradual increase from 9 to 12 per cent by 2019-20. Source: Treasury.
Today, Australia’s pool of superannuation savings stands at over $1.3 trillion (around 95 per cent of GDP), and is projected to rise to almost $7 trillion by 2037 (around 130 per cent of GDP). This significant increase in Australia’s national saving will help build economic resilience by reducing reliance on external financing, and help create room for the terms of trade and investment boom in the resources sector.
The increase of the superannuation guarantee from 9 per cent to 12 per cent, the revenue cost of which is funded from the proceeds of the Minerals Resource Rent Tax, will significantly increase the future retirement incomes for many Australian workers. For example, a 30 year old today earning average full‐time wages will have around an extra $118,000 (in real terms) in retirement savings. In this way, government policy is distributing the benefits of the mining boom more equitably.
2 The estimates assume that governments adhere to the medium-term fiscal objective so that the budgetary costs of superannuation are offset elsewhere in the budget (Gruen and Soding 2011).

Statement 4: Building Resilience Through National Saving
4-10
Demographic factors are also likely to have contributed to higher household saving over recent years. Most members of the post-war ‘baby boomer’ generation are currently in the peak life-cycle period for saving as they near the end of their working lives. It is appropriate that household saving be higher over the period before the major part of this group retires and labour force participation starts to fall, which is expected to occur from around the end of the current decade (Australian Government 2010).
By building a stock of income-producing assets, higher saving will help households maintain future living standards in the face of prospective declines in labour force participation. Combined with the effect of the baby boomers’ saving over their remaining working lives, increases in the superannuation guarantee will help maintain retirement incomes at a significantly higher level than would otherwise occur.
The Budget measure reducing the tax concession received by very high income earners on their superannuation contributions is expected to have only a small effect on national saving but will increase the fairness of the superannuation system.
The rise of the cautious consumer
While household saving began to recover in the early-2000s, the largest increase in the saving rate occurred during the GFC, and has been reinforced by ongoing global uncertainty.
During the early to mid-2000s, rapid increases in asset prices, particularly property prices, made households feel wealthier and as a result, they used debt to fund increased consumption (Chart 5). Prior to the GFC, capital gains were consistently positive, albeit much more volatile than net disposable income.
However, the GFC resulted in households suffering capital losses of nearly 100 per cent of annual net disposable income over the two years 2007-08 and 2008-09. Therefore, the recent increase in household saving is likely to reflect an attempt by Australian households to offset the impact of asset price falls on their balance sheets and as a precaution against further external shocks. These wealth losses may also explain households’ reluctance to take on debt since the GFC.
As the persistently strong capital gains seen in the pre-GFC period are unlikely to be repeated in the near future, it seems unlikely that households will revert to the very low saving rates seen in the first half of the 2000s (Freestone et. al. 2011). Bouts of global instability and ongoing global uncertainty may continue to reinforce cautious household behaviour for some time. However, if global instability moderates households may begin to feel more secure, which could lead to some decline in household discretionary saving.

Statement 4: Building Resilience Through National Saving
4-11
Chart 5: Net saving plus capital gains and losses
-80
-60
-40
-20
0
20
40
60
80
100
-80
-60
-40
-20
0
20
40
60
80
100
1990-91 1994-95 1998-99 2002-03 2006-07 2010-11
Net saving Other
Capital gains Saving + other changes in real net worth
Per cent of net disposable incomePer cent of net disposable income
Source: ABS cat. no. 5204.0 and Treasury.
The high terms of trade has boosted incomes and saving
The unprecedented rise in the terms of trade, which began in the mid-2000s, is likely to have also contributed to an increased saving rate. This rise in the terms of trade has boosted Australia’s national income and resulted in a period of above-trend growth in household income.
Strong demand from Asia is expected to support the terms of trade remaining at high levels over a long period, however, the terms of trade are expected to decline gradually over time as new sources of supply come on stream here and abroad. As a result, the current boost to income should be expected to raise the rate of national saving for both consumption smoothing and precautionary reasons.
A measure of the income gain from the terms of trade is the difference between cumulative growth in real incomes and cumulative growth in real GDP. Growth in real household disposable income from the start of the mining boom in 2002-03 to 2010-11 has exceeded growth in real GDP by 17 percentage points, while real consumption growth has exceeded real GDP growth by only 4¼ percentage points. This implies a significant proportion of the additional income from the mining boom has been saved (Chart 6).
Part of the rise in saving has also occurred because the high terms of trade have resulted in strong growth in profits, particularly in the mining sector, allowing mining companies to finance high levels of investment through retained earnings. This factor has been largely responsible for the recent rise in the corporate saving rate. With commodity prices expected to fall only gradually across the forward estimates, mining profits should continue to support a relatively high corporate saving rate for some time.

Statement 4: Building Resilience Through National Saving
4-12
Chart 6: Household real disposable income and real consumption gain
0
3
6
9
12
15
18
0
3
6
9
12
15
18
2002-03 2004-05 2006-07 2008-09 2010-11
Real income
Real consumption
Percentage points Percentage points
Note: The lines represent the cumulative difference between growth in these variables and growth in real GDP since 2002-03. Source: ABS cat. no. 5206.0 and Treasury.
The structural adjustment to financial deregulation and low inflation may have come to an end
The fall in household saving up to the mid-2000s reflected primarily a prolonged, but ultimately one-off, structural adjustment to financial deregulation from the early-1980s and the transition to a low inflation and interest rate environment from the early-1990s.
The combination of these two factors led to greater access to credit, rising house prices and high levels of confidence, all of which allowed households to borrow more, both to finance purchases of housing and financial assets, and to bring forward consumption.
As a consequence, from the early-1990s up until the mid-2000s, households increased their accumulation of debt (Chart 7), which was used in part to help fund strong growth in consumption. This led to a significant fall in the household saving rate (net household saving as a share of disposable income) from around 5.5 per cent in the early-1990s to 0.5 per cent by the mid-2000s.
This adjustment to financial deregulation and lower borrowing costs is likely to have been a significant structural driver of change in household saving. From the second half of the 2000s, however, households began to slow their accumulation of debt, and as a result the household saving rate began to rise. With its likely completion, households in aggregate can be expected to consolidate their financial position over coming years by returning to more normal levels of saving and borrowing (Stevens 2011). However, government policy plays an important role in securing this transition.

Statement 4: Building Resilience Through National Saving
4-13
Chart 7: Contributions to changes in household net saving
Change relative to 1989-90 Change relative to 2002-03
-15
-10
-5
0
5
10
15
-15
-10
-5
0
5
10
15
1990-91 1994-95 1998-99 2002-03
Net liabilitiesNet financial assetsNet investmentNet saving
Per cent of net disposable income
-15
-10
-5
0
5
10
15
-15
-10
-5
0
5
10
15
2003-04 2006-07 2009-10
Net liabilitiesNet financial assetsNet investmentNet saving
Per cent of net disposable income
Note: Components may not add to net saving as errors and omissions are excluded. Increased net incurrence of liabilities is shown as a negative. Source: ABS cat. no. 5204.0 and Treasury.
HIGHER NATIONAL SAVING IMPROVES MACROECONOMIC RESILIENCE
Increases in national saving help improve the economy’s resilience to economic shocks. Part of the recent rise in saving, especially by households, is likely to represent a response to increased risks in the post-GFC economic environment.
Higher saving can help increase macroeconomic resilience by reducing financial vulnerability to adverse shocks. This vulnerability can arise from three main sources:
• financing risk — the risk that the ability to issue new debt or roll over maturing debt is disrupted and forces a sharp contraction in spending;
• debt servicing risk — the risk that debt cannot be serviced in the event of a fall in incomes, resulting in defaults and forced asset sales; and
• balance sheet risk — the risk (magnified by leverage) of wealth losses due to falls in asset prices, resulting in falls in spending.
Superannuation is a growing source of domestic finance
Superannuation is an increasing source of financing to the rest of the economy, which has helped to reduce financing risks, particularly since the GFC. By contributing to higher national saving, superannuation also increases national income either through higher investment or by earning more investment income for Australians.

Statement 4: Building Resilience Through National Saving
4-14
Since 2008 there has been a substantial shift in superannuation funds’ asset acquisition away from foreign equities and debt securities towards domestic equities (Chart 8). Around 50 per cent of net equity financing for both banks and non-financial corporations over this period has come from superannuation funds. Holdings of domestic deposits by superannuation funds have also increased since the early-2000s. This has helped Australian banks and non-financial firms shift toward safer forms of financing in an environment where debt financing is less readily available and is seen as more risky than prior to the GFC. This was particularly important when global debt markets were impaired during the GFC.
Chart 8: Superannuation funds’ net acquisition of financial assets
0
1
2
3
4
5
6
7
8
0
1
2
3
4
5
6
7
8
1989-92 1993-97 1998-02 2003-07 2008-11
Per cent of GDPPer cent of GDP
Domestic deposits Domestic equities Other domestic Foreign equities Other foreign
Note: Years ending 31 December. Source: ABS cat. no. 5206.0, 5232.0 and Treasury.
Our reliance on external debt has fallen
The rise in national saving has also reduced Australia’s reliance on external financing to fund domestic investment. In Australia, most of this external financing has historically come in the form of debt, so higher national saving can reduce aggregate financing risk. After rising from around 42 per cent of GDP at the start of 2002, Australia’s net foreign debt (public and private) has remained flat at around 52 per cent of GDP since the start of 2008.
Had private saving behaviour remained unchanged, Australia’s exposure to international financial shocks would have increased at a time when global financial markets have become much more volatile.
Moreover, it is likely that any additional external borrowing would have been channelled primarily through the banking system, as was the case before the GFC.
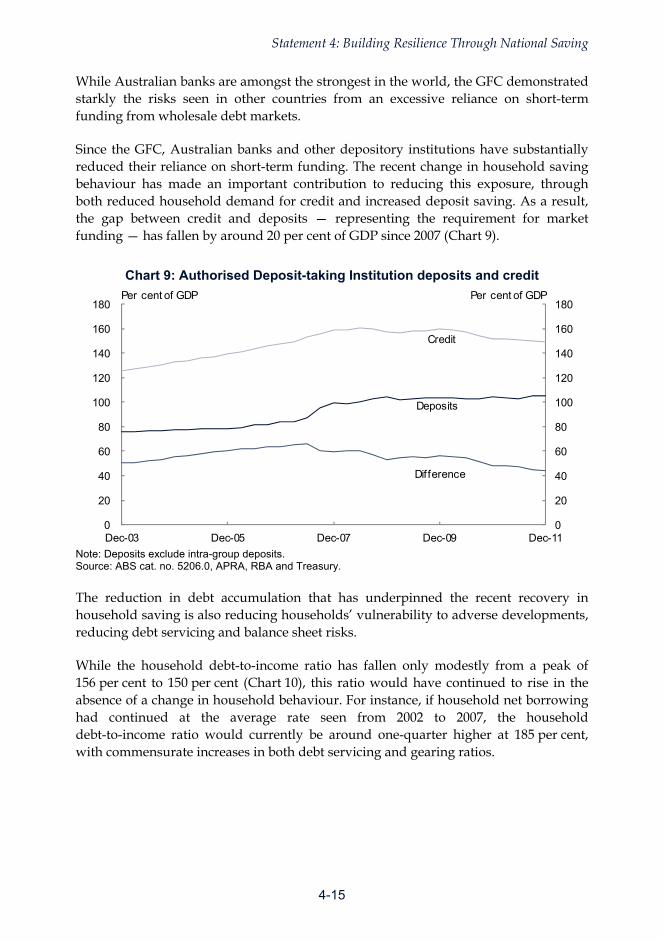
Statement 4: Building Resilience Through National Saving
4-15
While Australian banks are amongst the strongest in the world, the GFC demonstrated starkly the risks seen in other countries from an excessive reliance on short-term funding from wholesale debt markets.
Since the GFC, Australian banks and other depository institutions have substantially reduced their reliance on short-term funding. The recent change in household saving behaviour has made an important contribution to reducing this exposure, through both reduced household demand for credit and increased deposit saving. As a result, the gap between credit and deposits — representing the requirement for market funding — has fallen by around 20 per cent of GDP since 2007 (Chart 9).
Chart 9: Authorised Deposit-taking Institution deposits and credit
0
20
40
60
80
100
120
140
160
180
0
20
40
60
80
100
120
140
160
180
Dec-03 Dec-05 Dec-07 Dec-09 Dec-11
Per cent of GDPPer cent of GDP
Deposits
Credit
Difference
Note: Deposits exclude intra-group deposits. Source: ABS cat. no. 5206.0, APRA, RBA and Treasury.
The reduction in debt accumulation that has underpinned the recent recovery in household saving is also reducing households’ vulnerability to adverse developments, reducing debt servicing and balance sheet risks.
While the household debt-to-income ratio has fallen only modestly from a peak of 156 per cent to 150 per cent (Chart 10), this ratio would have continued to rise in the absence of a change in household behaviour. For instance, if household net borrowing had continued at the average rate seen from 2002 to 2007, the household debt-to-income ratio would currently be around one-quarter higher at 185 per cent, with commensurate increases in both debt servicing and gearing ratios.

Statement 4: Building Resilience Through National Saving
4-16
Chart 10: Household finance ratios
0
5
10
15
20
25
30
35
0
30
60
90
120
150
180
210
Dec-88 Oct-92 Aug-96 Jun-00 Apr-04 Feb-08 Dec-11
Per centPer cent
Debt to income (LHS) Debt to income counterfactual (LHS)
Interest payments to income (RHS) Interest payments to income counterfactual (RHS)
Debt to assets (RHS) Debt to assets counterfactual (RHS)
Source: RBA and Treasury.
Another aspect of the increase in household saving that assists in reducing vulnerability to macroeconomic risks is that around one-half of households with mortgages have been making substantial repayments in excess of the minimum required. Indeed, excess repayments, on average, have been almost as large as the required debt-servicing payments, implying that these borrowers have sizeable buffers to draw on should their incomes fall (RBA 2012).
GOVERNMENT SAVING PROMOTES MACROECONOMIC STABILITY AND
FISCAL SUSTAINABILITY
Fiscal policy plays an important role in helping to stabilise the economy through the operation of the automatic stabilisers and during exceptional circumstances where monetary policy alone may not be able to respond with sufficient speed and force. The Government’s fiscal stimulus during the GFC is a prime example of this important role. The Government stepped in to support aggregate demand when the private sector retreated, with a credible strategy for returning the budget to surplus as the economy recovered to trend growth.
Another crucial objective of fiscal policy is fiscal sustainability. Maintaining fiscal sustainability is particularly important at this time of ongoing global economic uncertainty and when fiscal deficits and high national debt have been a proximate cause of distress in many countries around the world. Fiscal sustainability is essential to maintaining macroeconomic stability, reducing economic vulnerabilities, and achieving sustained growth in living standards.

Statement 4: Building Resilience Through National Saving
4-17
The Government gives effect to promoting fiscal sustainability through its objective of achieving budget surpluses on average over the medium-term. Government saving is the difference between revenue and recurrent spending. This means that investment financed from current revenue adds to government saving, even though it does not add to the underlying cash balance. As a result, a surplus objective implies a larger positive level of gross government saving.
As well as directly affecting fiscal sustainability, the overall budget position can affect expectations and confidence. Public finances that are viewed as unsustainable generate uncertainty, as governments are expected to act to secure finances by reducing expenditure or increasing taxes, or face the risk of default. A credible strategy to maintain fiscal sustainability, therefore, provides a positive foundation for long-term decision-making by households and businesses.
Fiscal sustainability is also important because of the longer-term challenges arising from population ageing and climate change. These challenges result substantially from decisions made by preceding generations from which they benefitted: in the former case, establishing spending programs with unsustainable future fiscal costs; in the latter case, burning of fossil fuels with unsustainable future environmental costs.
Responsible fiscal policy requires the budget to be returned to surplus
Under the Government’s macroeconomic policy framework, the primary objective of fiscal policy is to maintain the budget in a sustainable position from a medium-term perspective. Monetary policy has primary responsibility for managing the level of demand to keep the economy on a stable growth path consistent with low inflation over the medium-term.
There are circumstances in which fiscal policy needs to support monetary policy in managing short-term changes in demand, beyond the automatic stabilisers. This may be either because the effectiveness of monetary policy is impeded or, as occurred during the GFC, adverse shocks affecting the economy are sufficiently large, and arrive sufficiently quickly, that a monetary policy response alone would be insufficient to respond to them. Outside of these circumstances, fiscal policy should revert to its medium-term focus.
In current circumstances, fiscal policy should be concerned with restoring the budget to a position consistent with the Government’s objective of achieving budget surpluses on average over the medium-term. With the economy forecast to grow around trend, a low unemployment rate and commodity prices still close to historical highs, it is appropriate to bring the budget back to surplus in 2012-13.
By returning to surplus at this time, the Budget recognises that in normal circumstances, with fiscal policy focussed on the medium-term, monetary policy should play the primary role in managing demand to keep the economy stable.

Statement 4: Building Resilience Through National Saving
4-18
Importantly, the Budget forecast of around-trend growth takes account of the impact of the substantial fiscal consolidation in 2012-13. Returning the budget to surplus ensures that monetary policy has scope to respond to economic developments, as appropriate and consistent with the medium-term inflation target.
Against a backdrop of continuing global uncertainty, it is also prudent to strengthen the government’s balance sheet while economic conditions remain favourable to support Australia’s capacity to respond to future adverse shocks.
Returning the budget to surplus will also help maintain confidence in the strength of Australia’s public finances as reflected in Australia’s AAA credit rating by all three major rating agencies. Financial markets and international organisations are strongly focused on fiscal credibility, which places a premium on meeting the commitment to return the budget to surplus and adhering to the medium-term fiscal strategy.
Return to surplus achieved despite revenue weakness
However, the return to surplus has been made more difficult by the weakness in revenues. In the years prior to the GFC, rapidly rising commodity prices provided a major boost to company profits and wage growth in resources and resources-related industries. Combined with strong asset price growth, a maturing capital gains tax system, and strong household consumption growth, this resulted in robust growth in tax receipts. However, tax receipts are now expected to remain well below their mid-2000s level relative to GDP over the forward estimates. This lower tax take reflects both the ongoing impacts of the GFC and structural factors such as the investment intensive nature of the current phase of the mining boom (see Statement 5 for more details).
Despite these challenges, the Government is returning the Budget to surplus in 2012-13, with surpluses growing over the forward estimates. The return to surplus is being achieved by the Government making net savings and lower payments than expected at the Mid-Year Economic and Fiscal Outlook 2011-12 (see Statement 3 for more details).
In total, the Government’s fiscal consolidation is expected to improve total government saving by around 3 per cent of GDP over the next three years.
Government saving is important for managing demographic challenges
Higher government saving over the medium-term, consistent with the medium-term fiscal strategy, will also mean the government is better placed to deal with the budgetary pressures arising from population ageing by ensuring that public finances start from a strong position.
The 2010 Intergenerational Report projected that with unchanged policies Australian government spending on health, age-related pensions and aged care would increase by 5.3 per cent of GDP over the following 40 years. To avoid exacerbating these

Statement 4: Building Resilience Through National Saving
4-19
pressures, it will be important to maintain fiscal discipline while demographic influences remain favourable.
Government saving will help in managing the high terms of trade
Government saving can also play a role in ensuring that the benefits of the high terms of trade are sustained over a longer period, as well as helping to manage its immediate macroeconomic impacts.
A key lesson from Australia’s experience during the initial phase of the mining boom is the importance of increasing government saving as revenues increase due to the impacts of high commodity prices. The period prior to the GFC saw very strong revenue growth, but rather than being saved, these revenues were in substantial part channelled back into the economy, which fed into increased household spending (Box 2).
In an economy that entered the boom with relatively limited spare capacity, this added to demand pressures associated with the massive expansion in mining investment. This contributed to the significant rise in inflation that occurred in 2007-08. It also meant that monetary policy had to be significantly tighter than otherwise.
The Government’s fiscal strategy is consistent with ensuring a further rise in government saving in the event that the high terms of trade support strong economic activity and incomes over the medium-term. This would continue to reduce pressures on interest rates and temper the pace of structural adjustment.

Statement 4: Building Resilience Through National Saving
4-20
Box 2: Revenue changes and the underlying cash balance
The initial phase of the mining boom delivered a surge in tax revenue that was in substantial part channelled back into the economy. This led to increased household consumption, adding to demand pressures associated with the terms of trade boom and contributing to the significant rise in inflation that occurred in 2007-08.
The revenue surge increased each year from the beginning of the mining boom and reached almost 6 per cent of GDP by 2007-08. Over this period the underlying cash balance rose from 0.9 in 2003-04 to 1.7 per cent of GDP (Chart A). Had the entire surge been saved, the underlying cash balance, and therefore government saving, would have increased substantially more over the period.
Chart A: Revenue write-ups and write-downs and the underlying cash balance
-6
-4
-2
0
2
4
6
8
-6
-4
-2
0
2
4
6
8
2003-04 2005-06 2007-08 2008-09 2010-11 2012-13Parameter and other variations Underlying cash balance
Write-ups from the 2003-04 Budget to 2007 PEFO
Write-downs from the 2008-09 Budget to 2012-13 Budget
Per cent of GDP Per cent of GDP
Note: Revenue write-ups and write-downs reflect parameter and other variations and exclude GST. Source: Treasury.
In contrast to the around 18 per cent of GDP revenue write-ups (parameter variations only) in the five years prior to the GFC, revenue write-downs since the GFC have amounted to around 10 per cent of GDP.
Proposals for saving through a sovereign wealth fund
With the return to surplus, the Government’s first priority is to strengthen its balance sheet by reducing net debt from already very low levels.
The Government is committed to maintaining a liquid and efficient Commonwealth Government Securities market. This means that continued surpluses will require the Government to accumulate financial assets in some form once gross debt is reduced sufficiently, while continuing to reduce the level of net debt outstanding.

Statement 4: Building Resilience Through National Saving
4-21
Some commentators have argued that ensuring the benefits of the high terms of trade are sustained, as well as managing its immediate macroeconomic impacts, may be best achieved by investing some portion of government revenues arising from the high terms of trade in financial assets through a sovereign wealth fund that operates at arms-length from government, thereby quarantining these revenues from spending.
What matters in this regard is not the establishment of such a fund per se, but whether national (and not just government) saving rises in response to unusually high resource revenues. From the perspective of the government balance sheet, establishing a sovereign wealth fund without a change in fiscal objectives would not alter either current or future levels of government saving and net financial worth, as accumulating financial assets has the same effect as repaying borrowings (Garton and Gruen 2012).
There are two broad types of sovereign wealth funds. The first involves building a stock of financial assets for long-term saving. This is the type of fund established in Norway, which has invested all government petroleum revenues in its sovereign wealth fund since 1996.
Superannuation performs the function of a long-term savings fund
The superannuation system already serves as a decentralised means of accumulating financial assets on a large scale.
Australia’s compulsory superannuation system has some similarity to Norway’s sovereign wealth fund as they both involve increasing saving via the accumulation of financial assets over a long period of time. As a share of GDP, Australia’s superannuation assets are of a similar order of magnitude to Norway’s sovereign wealth fund and private pension assets combined, and are set to increase further with the increase in the superannuation guarantee from 9 per cent to 12 per cent. Instead of saving through a centrally managed fund, however, superannuation assets are kept in individual retirement accounts that cannot be accessed until individuals reach their preservation age.
There are also a number of important differences between Australia’s circumstances and those of Norway (Garton and Gruen 2012). First, the remaining life of Norway’s oil and gas reserves is much more limited than for reserves of Australia’s key commodities (iron ore and coal). Second, Norway’s economy and government revenues are far more dependent on revenues from the resources sector than is the case in Australia. Finally, Norway faces greater long-term fiscal challenges than Australia. This implies a stronger case for Norway to save these revenues to smooth consumption over time and for intergenerational equity.
In terms of intergenerational equity, the Minerals Resource Rent Tax is central to the Government’s plan to spread the benefits of the mining boom and help ensure the gains provide benefits for generations to come. In particular, revenue from the Minerals Resource Rent Tax will help fund critical investment in roads, bridges and

Statement 4: Building Resilience Through National Saving
4-22
other infrastructure, relieving capacity constraints particularly in mining regions. Furthermore, revenue from the tax will also contribute to funding the revenue cost of the increase in the superannuation guarantee.
Australia’s fiscal rules and institutions mean a stabilisation fund is not warranted at this time
The second type of fund is a stabilisation fund that involves setting aside revenues in a fund during periods in which commodity prices are unusually high, which can then be drawn down to support the budget in the event that commodity prices fall. The purpose of this type of fund is to enhance the government’s capacity to implement counter-cyclical fiscal policy, thereby helping to moderate the macroeconomic impacts of commodity price fluctuations. This type of fund has been in place in Chile since 2000.
The Government’s fiscal rules mean that it is able to implement counter-cyclical fiscal policy without the need for a mechanism of the kind adopted in Chile. The medium-term fiscal strategy provides the Government with scope to increase government saving during periods of steady economic growth while allowing government saving to fall during economic downturns, as it did to support demand and jobs during the GFC.
Government saving over coming years will occur through a combination of debt repayment from already very low levels, accumulation of financial assets and investments in infrastructure. The Government will also contribute to national saving through its superannuation policies. As decisions are made over coming years on how to use the proceeds from continued high terms of trade, it will be important to consider which allocation of saving between these forms will best contribute to maintaining prosperity into the future.
CONCLUSION
Since the mid-2000s there has been a significant increase in Australia’s national saving rate. Australia’s system of compulsory superannuation has made a substantial contribution to national saving since its introduction in mid-1980s. More recently, national saving has been boosted by a marked shift to more cautious saving and borrowing behaviour by households, particularly since the GFC.
This represents a reversal following a long period in which household saving declined and household borrowing rose. As this period of household debt accumulation appears to have come to an end, much of the recent increase in saving is likely to be sustained for some time to come, with the boost to the superannuation guarantee progressively from 9 to 12 per cent helping to secure the gains in national saving.

Statement 4: Building Resilience Through National Saving
4-23
The increase in the superannuation guarantee, the revenue cost of which is funded by the Minerals Resource Rent Tax, helps ensure the benefits of the boom are spread fairly across the economy.
In the period prior to the GFC very strong revenue growth was in substantial part channelled back into the economy, rather than being saved. This fed into increased household spending, which added to demand pressures and contributed to a significant rise in inflation that occurred in 2007-08 and significantly tighter monetary policy than otherwise.
Returning the Budget to surplus from 2012-13 will add to national saving, ensure fiscal policy is not generating price pressures in the economy and will continue to provide monetary policy with scope to respond to economic developments. It will also maintain confidence in the strength of Australia’s public finances.
Delivering surpluses, along with further improvements to superannuation will foster fiscal sustainability which will assist in managing the high terms of trade while helping meet the challenges of population ageing. Higher national saving will also improve economic resilience by reducing Australia’s vulnerability to adverse shocks.

Statement 4: Building Resilience Through National Saving
4-24
REFERENCES
Australian Government 2010, Australia to 2050: Future Challenges, Intergenerational Report, Commonwealth of Australia.
Australia’s Future Tax System (AFTS) 2009, The retirement income system: Report of strategic issues, The Treasury, Canberra.
Freestone, O, Gaudry, D, Obeyesekere, A and Sedgwick, M 2011, The rise in household saving and its implications for the Australian economy, Economic Roundup, Issue 2.
Garton, P and Gruen, D 2012, The role of sovereign wealth funds in managing resource booms: a comparison of Australia and Norway, paper at the Third Annual Asia Central Bank and Sovereign Wealth Fund Conference.
Gruen, D and Soding, L 2011, Compulsory Superannuation and National Saving, paper presented to the 2011 Economic and Social Outlook Conference.
Mercer 2011, Melbourne Mercer Global Pension Index, Melbourne Centre for Financial Studies, Melbourne.
OECD 2011, Pensions at a Glance 2011: Retirement Income Systems in OECD and G20 Countries, OECD Publishing, Paris.
RBA 2012, Financial Stability Review, March 2012.
Stevens, G 2011, The Cautious Consumer, Address to The Anika Foundation Luncheon.
5-1
STATEMENT 5: REVENUE
While Government receipts are recovering from the global financial crisis trough, their growth is slower than previously expected.
Owing to economic circumstances and other factors (that is, abstracting from policy measures), tax receipts excluding GST have been revised down from the 2011-12 Mid-Year Economic and Fiscal Outlook (MYEFO) by $3.8 billion in 2011-12 and $16.5 billion over the four years to 2014-15. This has been partly offset by policy measures.
Total receipts are expected to grow by 11.8 per cent in 2012-13. This represents a downward revision since the 2011-12 MYEFO of $5.8 billion in 2012-13 and $18.7 billion over the four years to 2014-15.
It is expected that tax receipts as a share of GDP will remain well below pre-global financial crisis levels over the entire forward estimates period. Structural factors are acting to constrain the tax-to-GDP ratio beyond the forecast period.
Overview ....................................................................................................... 5-3
The tax-to-GDP ratio .................................................................................... 5-5
Variations in the receipts estimates ......................................................... 5-10
Receipts growth by head of revenue ........................................................ 5-19
Revenue variations since MYEFO ............................................................ 5-28 Appendix A: Receipts and revenue forward estimates .............................................. 5-29 Appendix B: Changes since 2011-12 MYEFO ........................................................... 5-31 Appendix C: Receipts and revenue history and forecasts ......................................... 5-35 Appendix D: Forecast methodology and performance ............................................... 5-42 Appendix E: Taxation receipts and revenue recognition............................................ 5-46 Appendix F: Tax expenditures ................................................................................... 5-49


5-3
STATEMENT 5: REVENUE
OVERVIEW
Government receipts are recovering from their post-financial crisis lows, but their recovery is weaker than expected, with more write-downs in tax receipts since the 2011-12 MYEFO. Receipts remain low by recent historical standards. Total receipts are expected to grow by 11.8 per cent in 2012-13, with tax receipts growing by 10.8 per cent (Table 1). Tax as a proportion of GDP in 2011-12 and the previous two years is the lowest it has been since 1993-94. Relative to GDP, tax receipts across the forward estimates are expected to remain well below their mid-2000s levels (Chart 1).
Table 1: Australian Government general government receipts Estimates Projections
2009-10 2010-11 2011-12 2012-13 2013-14 2014-15 2015-16Total taxation receipts ($b) 261.0 280.8 309.7 343.1 371.4 392.9 415.5Growth on previous year (%) -4.3 7.6 10.3 10.8 8.2 5.8 5.8Per cent of GDP 20.2 20.1 21.0 22.1 22.7 22.8 22.9
Tax receipts excluding GST ($b) 217.0 235.0 264.1 294.9 320.5 339.4 359.4Growth on previous year (%) -6.3 8.3 12.4 11.7 8.7 5.9 5.9Per cent of GDP 16.8 16.8 17.9 19.0 19.6 19.7 19.8
Non-taxation receipts ($b) 23.7 21.2 20.3 25.7 21.1 20.8 22.9Growth on previous year (%) 18.6 -10.6 -4.1 26.3 -17.7 -1.7 10.3Per cent of GDP 1.8 1.5 1.4 1.7 1.3 1.2 1.3
Total receipts ($b) 284.7 302.0 330.0 368.8 392.5 413.6 438.4Growth on previous year (%) -2.7 6.1 9.3 11.8 6.4 5.4 6.0Per cent of GDP 22.0 21.6 22.3 23.8 24.0 24.0 24.2
Actuals
Chart 1: Tax-to-GDP ratio
15
17
19
21
23
25
27
15
17
19
21
23
25
27
2000-01 2003-04 2006-07 2009-10 2012-13 2015-16
Per cent of GDPPer cent of GDP
Total receipts Tax receipts Tax receipts excl. GST
Source: Treasury estimates.

Statement 5: Revenue
5-4
Relative to the 2011-12 MYEFO, tax receipts have been revised down by $5.6 billion in 2011-12, $6.1 billion in 2012-13, and $18.4 billion over the four years to 2014-15 (Table 2).
Table 2: Reconciliation from the 2011-12 Budget and 2011-12 MYEFO estimates of Australian Government general government taxation receipts
Estimates Projection2011-12 2012-13 2013-14 2014-15
$m $m $m $mTax receipts at 2011-12 Budget 321,103 353,426 375,298 395,366
Changes from 2011-12 Budget to 2011-12 MYEFO -5,804 -4,265 160 128
Tax receipts at 2011-12 MYEFO 315,299 349,161 375,458 395,493
Changes from 2011-12 MYEFO to 2012-13 Budget -5,646 -6,054 -4,049 -2,641
Tax receipts at 2012-13 Budget 309,653 343,107 371,409 392,852 Relative to the 2011-12 MYEFO, changes in economic circumstances and other factors (excluding policy decisions) have resulted in a downward revision to tax receipts excluding GST of $3.8 billion in 2011-12, $4.6 billion in 2012-13 and $16.5 billion over the four years to 2014-15 (Table 3). The main downward revisions have been to company and superannuation taxes, principally reflecting high levels of investment-related tax deductions within the mining sector, weak profitability outside the resources and resources-related sectors, and sluggish asset prices.
Table 3: Reconciliation from the 2011-12 MYEFO estimates of Australian Government general government taxation receipts excluding GST
Estimates Projection2011-12 2012-13 2013-14 2014-15
$m $m $m $m
Tax receipts excluding GST at 2011-12 MYEFO 267,799 298,111 321,458 338,843
Changes from 2011-12 MYEFO to 2012-13 BudgetEffect of policy decisions 70 1,415 3,332 4,257Effect of parameter and other variations -3,816 -4,619 -4,281 -3,748Total variations -3,746 -3,204 -949 509
Tax receipts excluding GST at 2012-13 Budget 264,053 294,907 320,509 339,352 The budget position has been enhanced by a range of measures, including not proceeding with previously announced tax cuts, as well as better targeting tax expenditures. Collectively, policy measures add $1.4 billion to tax receipts excluding GST in 2012-13 and $9.1 billion over the four years to 2014-15.
Overall, relative to the 2011-12 MYEFO, tax receipts excluding GST have been revised down by $3.7 billion in 2011-12, $3.2 billion in 2012-13 and $7.4 billion over the four years to 2014-15.
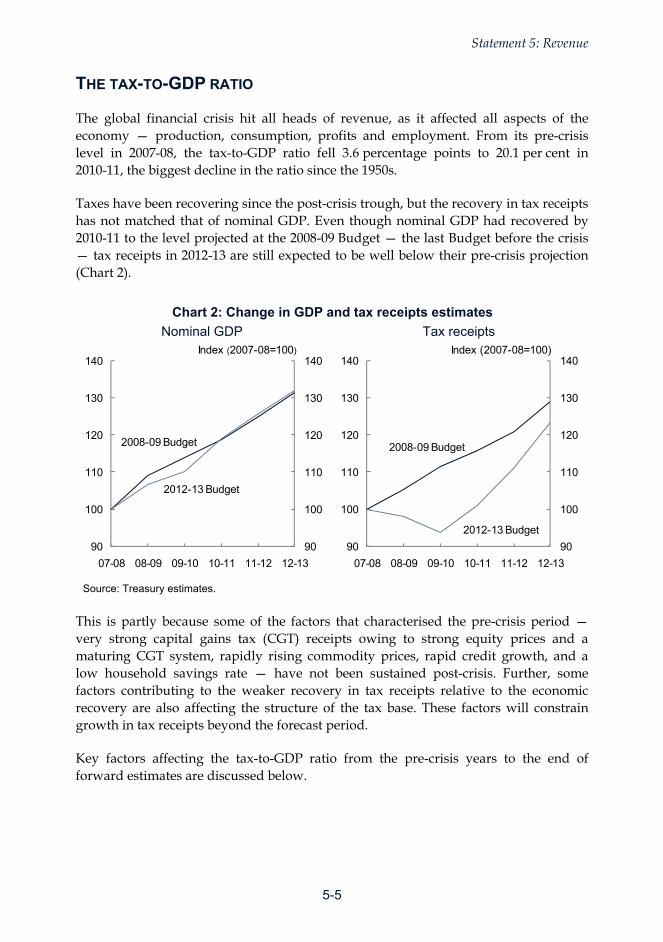
Statement 5: Revenue
5-5
THE TAX-TO-GDP RATIO
The global financial crisis hit all heads of revenue, as it affected all aspects of the economy — production, consumption, profits and employment. From its pre-crisis level in 2007-08, the tax-to-GDP ratio fell 3.6 percentage points to 20.1 per cent in 2010-11, the biggest decline in the ratio since the 1950s.
Taxes have been recovering since the post-crisis trough, but the recovery in tax receipts has not matched that of nominal GDP. Even though nominal GDP had recovered by 2010-11 to the level projected at the 2008-09 Budget — the last Budget before the crisis — tax receipts in 2012-13 are still expected to be well below their pre-crisis projection (Chart 2).
Chart 2: Change in GDP and tax receipts estimates
Nominal GDP
90
100
110
120
130
140
90
100
110
120
130
140
07-08 08-09 09-10 10-11 11-12 12-13
Index (2007-08=100)
2008-09 Budget
2012-13 Budget
Source: Treasury estimates.
Tax receipts
90
100
110
120
130
140
90
100
110
120
130
140
07-08 08-09 09-10 10-11 11-12 12-13
Index (2007-08=100)
2008-09 Budget
2012-13 Budget
This is partly because some of the factors that characterised the pre-crisis period —very strong capital gains tax (CGT) receipts owing to strong equity prices and a maturing CGT system, rapidly rising commodity prices, rapid credit growth, and a low household savings rate — have not been sustained post-crisis. Further, some factors contributing to the weaker recovery in tax receipts relative to the economic recovery are also affecting the structure of the tax base. These factors will constrain growth in tax receipts beyond the forecast period.
Key factors affecting the tax-to-GDP ratio from the pre-crisis years to the end of forward estimates are discussed below.

Statement 5: Revenue
5-6
Capital gains tax
Capital gains tax is paid by individuals, companies and superannuation funds on the realisation of assets held (Box 1). Reflecting strong asset price growth in the period before the financial crisis, CGT receipts reached a peak relative to GDP of 1.5 per cent in 2007-08. Following the crisis, CGT receipts are expected to be only 0.5 per cent of GDP in 2011-12. Had CGT receipts remained at 1.5 per cent of GDP, tax collections would be around $14.8 billion higher in 2011-12.
The weakness in CGT is partly related to equity prices (Chart 3). While nominal GDP has increased by a third in the past half-decade, the ASX 200 has fallen by a fifth over the same time.
Chart 3: Capital gains tax(a) and the ASX 200
0.0
0.4
0.8
1.2
1.6
0
2,000
4,000
6,000
8,000
Jun-94 Jun-96 Jun-98 Jun-00 Jun-02 Jun-04 Jun-06 Jun-08 Jun-10 Jun-12
Per cent of GDPIndex
CGT (RHS)
ASX 200 (LHS)
(a) Yearly CGT amounts have been ascribed to the mid-point of each fiscal year (January 1). Source: RBA, Treasury estimates.
Even as equity prices recover, other factors will continue to subdue CGT receipts over the forward years. A large stock of capital losses was generated during the crisis (Box 2, Statement 5, 2011-12 Budget), which is expected to affect future CGT receipts until at least 2014-15. In addition, the housing market is expected to remain soft.

Statement 5: Revenue
5-7
Box 1: Capital gains tax
When the price of an asset changes, this leads to a capital gain (or loss). CGT, however, is only paid when the gains are ‘realised’ (that is, when the asset is sold). CGT is not itself a separate tax. Instead, a net capital gain, which can be realised by individuals, companies and super funds, is assessed as a component of taxable income.
The CGT forecast is derived by applying an effective tax rate to the projected net capital gain. The net capital gain is determined by tracking the stock of assets that are subject to CGT and their price movements, while making assumptions about the ‘realisation rate’ of those capital gains (or losses). Realisation rates (the proportion of assets sold each year) vary considerably from year to year, depending on the type of asset, movements in relevant prices and the nature of investors. Asset price changes also vary considerably.
For forecasting purposes, it is assumed that the yearly change in asset prices equates to around 5.3 per cent over the projection period — the same as nominal GDP growth.
Forecasting CGT is further complicated by the fact that capital losses may be used to offset capital gains. A net capital loss in one year must be ‘carried forward’ into a later year when it can be used to offset a later net capital gain. The forecasting methodology must, therefore, track the stock of capital losses and the rate at which they are used over later years. In addition, many of these losses may never be used. For example, if a business goes bankrupt, any losses incurred by the business may be extinguished.
Consumer caution
A further significant development dampening the tax-to-GDP ratio is the greater share of household income that is being saved, rather than consumed (see Statement 4). The household savings rate, already rising before the global financial crisis, has remained elevated in recent years (Chart 4), while growth in personal and housing finance has slowed significantly.
The continuing consumer caution partly reflects sluggish asset prices and global instability and uncertainty. The effect of weaker consumer sentiment has been particularly evident in retail trade, but its effects on other activity can be pervasive, with flow-on effects for tax receipts, especially for consumption taxes like excise duty and the GST.

Statement 5: Revenue
5-8
Chart 4: Household savings ratio
-3
0
3
6
9
12
15
-3
0
3
6
9
12
15
Jun-94 Jun-96 Jun-98 Jun-00 Jun-02 Jun-04 Jun-06 Jun-08 Jun-10 Jun-12
Per centPer cent
Source: ABS National Accounts.
In addition to the effect of generalised consumer caution on tax receipts, households have been allocating a larger share of consumption towards goods and services not subject to the GST, such as education, rent, health and food, as their prices have increased substantially compared with the prices of goods and services that are subject to GST (Box 4, Statement 5, 2011-12 Budget).
Increasing importance of the mining sector and the investment boom
High commodity prices and the mining boom have contributed to higher levels of nominal GDP. However, the shift in profits to the mining sector, and the dampening effect of the high exchange rate on some other parts of the economy, have also acted to dampen tax receipts as a share of GDP.
Tax receipts from the mining sector are being affected by high levels of tax deductions related to capital expenditure, reflecting the unprecedented scale of mining investment over the forward estimates. Total mining investment as a percentage of GDP is expected to double to nearly 9 per cent in 2013-14 from its 2008-09 level, which was already markedly higher than its historical share of around 1 to 2 per cent of GDP. This will result in continued high depreciation deductions, affecting tax paid relative to gross operating surplus (GOS) in the sector (Box 2).
In recent years, the mining sector has accounted for around 30 per cent of private corporate gross operating surplus, but only 15 per cent of company tax. The introduction of the minerals resource rent tax (MRRT) and higher expected petroleum resource rent tax (PRRT) receipts towards the end of the projection period will increase tax receipts from the mining sector.

Statement 5: Revenue
5-9
Box 2: The mining sector and tax
The increasing importance of the mining sector to the Australian economy is reflected in the share of gross profits accruing to mining. Mining GOS accounted for 16 per cent of total corporate GOS in 2002-03. By 2011-12, it had risen to 29 per cent. Because the ratio of corporate income tax to GOS has been lower for mining compared to other industries (Chart A), a consequence of the compositional change in the economy is that corporate tax as a share of GOS declines over time. Total tax as a share of GDP also declines, all other things remaining equal.
Importantly, the expected massive increase in mining investment over the next three years, to nearly 9 per cent of GDP in 2013-14, will generate very large tax deductions. This high investment is in contrast to the characteristics of the mining boom during the mid-2000s, which was largely driven by increasing commodity prices and the expansion of existing projects. While existing projects are still expanding, there is an increase in new projects. In addition, the mining sector can deduct some forms of investment immediately rather than over the life of the asset. This will reduce the tax-to-GOS ratio during high investment periods. This is illustrated in Chart B, which shows that the mining sector’s share of corporate tax is expected to remain below its share of GOS. The chart also shows that the introduction of the MRRT will increase the share of tax paid by the mining sector, such that the sector’s share of tax increases towards its share of GOS.
Chart A: Corporate tax-to-GOS ratio (average 2000-01 to 2009-10)
Chart B: The mining sector’s share of relevant corporate indicators(a)
0
8
16
24
32
40
0
8
16
24
32
40
Mining Finance Other Total
Per centPer cent
0
11
22
33
44
55
0
11
22
33
44
55
2001-02 2004-05 2007-08 2010-11 2013-14
Per centPer cent
Depreciation
GOS
Investment
Corporate income tax
+MRRT
Source: Treasury estimates, Taxation Statistics, ABS. (a) Tax and depreciation are sourced from ATO taxation statistics, which is reported on an income year basis. ‘Depreciation’ is calculated as the ‘deduction for decline in depreciable assets’ plus ‘immediate deduction for capital expenditure’. Taxes include company tax, PRRT, and MRRT but do not include state royalties. Although GOS is conceptually different to taxable income (Clark, J, Pridmore, B and Stoney, N (2007), ‘Trends in aggregate measures of Australia’s corporate tax level’, Economic Roundup, Winter), it is the component of profits in GDP and is therefore the most appropriate economic base to analyse movements in the tax-to-GDP ratio.

Statement 5: Revenue
5-10
Patchwork economy
Subdued growth in many sectors in the economy is also affecting tax collections. While the mining sector has grown strongly, the high Australian dollar together with global uncertainty and challenging credit conditions in some sectors of the economy have dampened consumer sentiment and reduced company profits and employment growth in the non-mining sectors. This has resulted in weaker growth in company tax receipts from the non-mining sector, which is likely to continue to weigh on the tax-to-GDP ratio over the forecast period.
VARIATIONS IN THE RECEIPTS ESTIMATES
Table 4 reconciles the 2012-13 Budget’s total receipts estimates with those at the 2011-12 Budget and the 2011-12 MYEFO. Since the 2011-12 MYEFO, total receipts have been revised down by $18.7 billion in the four years to 2014-15, reflecting a downward revision of $29.4 billion from parameter and other variations, partly offset by $10.7 billion of policy measures (Chart 5).
Table 4: Reconciliation of Australian Government general government receipts estimates from the 2011-12 Budget and the 2011-12 MYEFO
Estimates Projection2011-12 2012-13 2013-14 2014-15
$m $m $m $mReceipts at 2011-12 Budget 342,390 378,520 395,935 415,453
Changes from 2011-12 Budget to 2011-12 MYEFOEffect of policy decisions -979 1,898 6,777 7,729Effect of parameter and other variations -4,979 -5,859 -6,079 -7,223Total variations -5,958 -3,961 698 506
Receipts at 2011-12 MYEFO 336,432 374,559 396,634 415,959
Changes from 2011-12 MYEFO to 2012-13 BudgetEffect of policy decisions 76 2,021 3,680 4,915Effect of parameter and other variations -6,532 -7,806 -7,770 -7,256Total variations -6,457 -5,785 -4,090 -2,341
Receipts at 2012-13 Budget 329,976 368,774 392,544 413,618 Since the 2011-12 MYEFO, tax receipts have been revised down by $6.1 billion in 2012-13 and $18.4 billion over the four years to 2014-15. Excluding GST, tax receipts have been revised down by $3.2 billion in 2012-13 and by $7.4 billion over the four years to 2014-15.

Statement 5: Revenue
5-11
Chart 5: Revisions to total receipts estimates since the 2011-12 MYEFO
-12
-6
0
6
-12
-6
0
6
2011-12 2012-13 2013-14 2014-15
$billion$billion
Policy decisions Parameter and other variations Total variations Source: Treasury estimates.
Effect of parameter and other variations
Variations in receipts can stem from either policy changes or parameter and other variations — that is, recent economic conditions, the updated economic outlook, year-to-date collections, and other non-policy factors. This section discusses variations in receipts from parameter and other variations, while policy changes are covered in the next section.
The receipts forecasts are based on the economic outlook presented in Statement 2, with changes in nominal incomes and spending, including changes in their composition, having consequential impacts on expected tax receipts. The key economic parameters that influence revenue are shown in Table 5. Analysis of the sensitivity of the tax receipts estimates to changes in the economic outlook is provided in Statement 3 (Appendix A).

Statement 5: Revenue
5-12
Table 5: Key economic parameters(a)
2011-12 2012-13 2013-14 2014-15 2015-16Revenue parameters at 2012-13 Budget
Nominal gross domestic product (non-farm) 5.8 5.1 5.4 5 1/4 5 1/4Change since 2011-12 MYEFO -0.6 -0.3 0.2 0 na
Compensation of employees (non-farm)(b) 6.5 5.0 5.4 5 1/2 5 1/2Change since 2011-12 MYEFO 0.1 -0.4 -0.1 0 na
Corporate gross operating surplus(c) 6.1 4.1 4.8 5 1/4 5Change since 2011-12 MYEFO 0.3 -0.4 -0.5 1/4 na
Unincorporated business income 2.9 5.3 5.3 5 1/4 5 1/4Change since 2011-12 MYEFO -3.2 0.3 -0.2 - 1/4 na
Property income(d) 3.9 6.5 6.7 5 1/2 5 1/2Change since 2011-12 MYEFO -1.4 2.6 1.2 1/4 na
Consumption subject to GST 5.1 5.3 4.8 5 1/2 5 1/2Change since 2011-12 MYEFO 0.6 -0.6 -0.7 0 na
Estimates Projections
(a) Current prices, per cent change on previous years. Changes since the 2011-12 MYEFO are percentage
points and may not reconcile due to rounding. (b) Compensation of employees measures total remuneration earned by employees. (c) Corporate GOS is an Australian National Accounts measure of company profits, gross of depreciation. (d) Property income measures income derived from rent, dividends, and interest. na not applicable.
Relative to the 2011-12 MYEFO, parameter and other variations have reduced tax receipts by $5.7 billion in 2011-12, $7.6 billion in 2012-13, and $28.0 billion over the four years to 2014-15 (Chart 6). Parameter and other variations have reduced tax receipts excluding GST by $3.8 billion in 2011-12, $4.6 billion in 2012-13, and $16.5 billion over the four years to 2014-15.
Chart 6: Parameter and other variations to tax receipts since the 2011-12 MYEFO
-9
-6
-3
0
3
-9
-6
-3
0
3
2011-12 2012-13 2013-14 2014-15
$billion$billion
Personal income tax Companies Other income taxes
Goods and Services Tax Other indirect taxes Total
Source: Treasury estimates.

Statement 5: Revenue
5-13
Income tax receipts from companies and superannuation funds account for around three-quarters of the revision to total tax receipts in 2011-12, with collective downward revisions of $4.2 billion.
• Of this, company tax receipts account for $2.6 billion, reflecting the weakness in CGT as well as weaker-than-expected tax collections relating to the 2010-11 and earlier income years. In addition, the larger-than-anticipated losses incurred during the global financial crisis continue to weigh on company tax receipts.
• Superannuation funds’ tax receipts are also expected to be lower by $1.6 billion, reflecting lower capital gains.
In contrast, individuals’ taxes have been revised up by $1.4 billion, partly reflecting weaker-than-expected refunds (which boost tax collections).
Indirect taxes have been revised down by $2.5 billion, largely reflecting a $1.9 billion write-down of GST and a $1.1 billion downgrade in excise receipts, partly offset by higher customs duties.
Detail on the parameter and other variations to individual heads of revenue in 2011-12 and in 2012-13 since the 2011-12 MYEFO is described below.
• Gross income tax withholding receipts are expected to be around $320 million lower in 2011-12 and $590 million lower in 2012-13, reflecting softness in the labour market.
• Gross other individuals’ receipts are expected to be $700 million higher in 2011-12, and $680 million higher in 2012-13. Stronger non-wage income, particularly relating to the 2010-11 income year, is driving the upward revision, partly offset by the slow recovery in asset prices (affecting CGT).
• Stronger incomes relating to the 2010-11 income year also have resulted in downward revisions to individuals’ refunds (which have the effect of increasing total individuals’ taxes) by $1.0 billion in both 2011-12 and 2012-13.
• Superannuation funds’ receipts are expected to be $1.6 billion lower in 2011-12 and $1.5 billion lower in 2012-13, reflecting weakness in collections relating to the 2010-11 income year as well as the sluggish recovery in asset prices (affecting CGT).
• Company tax receipts have been revised down by $2.6 billion in 2011-12, reflecting weakness in tax collections relating to the 2010-11 income year, and the tepid recovery in asset prices. Company tax receipts have been revised down by $2.7 billion in 2012-13, reflecting a weaker capital gains tax outlook, partly offset by stronger corporate profits in 2011-12.

Statement 5: Revenue
5-14
• Capital gains tax, which is an important component of individuals, companies and superannuation funds’ tax, is expected to be lower by $600 million in 2011-12 and $800 million in 2012-13, reflecting the sluggish recovery in asset prices.
• Resource rent tax receipts are estimated to be $420 million lower in 2011-12, reflecting higher investment costs (which lower tax payable) in a number of offshore oil fields. Resource rent taxes are expected to be $850 million lower in 2012-13, reflecting weaker coal prices and the dampening effect of a higher assumed exchange rate.
• GST receipts have been revised down by $1.9 billion in 2011-12 and $3.0 billion in 2012-13, reflecting weakness in year-to-date collections, the softer outlook for consumption subject to GST, as well as subdued dwelling investment.
• Excise duties have been revised down by $1.1 billion in both 2011-12 and 2012-13. The downgrade is broadly-based across most excisable products.
• Customs duty receipts have been revised up by $470 million in 2011-12 and by $250 million in 2012-13. The increase reflects higher imports of automobiles following increased supply coming on stream following the tsunami in Japan, and the offshore relocation of a major tobacco producer — which has the effect of reducing tobacco excises but raising custom duties.
• The carbon pricing mechanism takes effect from 2012-13. Estimates of receipts from the mechanism are unchanged from the 2011-12 MYEFO.
• Non-tax receipts have been revised down by $820 million in 2011-12, reflecting lower interest and other receipts. Non-tax receipts have been revised down by $240 million in 2012-13, reflecting lower interest receipts and lower sales of non-financial assets.
Effect of policy decisions
Policy decisions since the 2011-12 MYEFO are expected to increase receipts by $2.0 billion in 2012-13, 3.7 billion in 2013-14, $4.9 billion in 2014-15 and $6.2 billion in 2015-16.
The Budget contains decisions not to proceed with (or defer) some previously announced measures that would have otherwise reduced tax receipts. The decisions in this Budget not to proceed with some measures will maintain tax liabilities at present levels. These measures include the following.
• Not proceeding with lowering the company tax rate, from the 2013-14 income year, nor implementing an early start to the company tax rate cut for small businesses from the 2012-13 income year. The Government was not able to secure the necessary parliamentary support and for this reason the decision not to proceed with the company tax cut will now help fund initiatives to spread the benefits of the

Statement 5: Revenue
5-15
resources boom to help families on low- and middle-incomes and support business investment. This measure will increase estimated tax receipts by $4,600 million over the forward estimates period, including the removal of the growth dividend associated with the company tax rate cut.
• Not proceeding with the standard deduction for work-related expenses and for the cost of managing tax affairs, which was due to commence on 1 July 2013. This measure is expected to increase tax receipts by $1,612 million over the forward estimates.
• Deferring to 1 July 2014 the increase in the concessional contributions cap for individuals aged 50 and over with superannuation balances below $500,000, increasing tax receipts by $1,430 million over the forward estimates period.
• Not proceeding with the 50 per cent discount for interest income, which was due to commence on 1 July 2013. This measure is expected to increase tax receipts by $795 million over the forward estimates.
The Budget also contains revenue savings measures that better target tax expenditures, including the following.
• Making the superannuation system fairer by reducing the higher tax concession that very high income earners receive on their concessional contributions, so it is more in line with the concession received by average income earners, increasing receipts by $1,030 million over the forward estimates period.
• Further reforming the tax concession for living-away-from-home allowances and benefits, by better targeting it at people who are legitimately maintaining a second home in addition to their actual home for an initial period, increasing receipts by $1,019 million over the forward estimates.
• Reducing the personal allowance for duty free tobacco from 250 cigarettes to 50 cigarettes or 50 grams of other tobacco products from 1 September 2012. This measure is expected to increase receipts by $660 million over the forward estimates.

Statement 5: Revenue
5-16
Table 6: Revenue policy decisions since the 2011-12 MYEFO (receipts basis)
2011-12 2012-13 2013-14 2014-15 2015-16 Total$m $m $m $m $m $m
Company tax cut - do not proceed 50.0 300.0 1,200.0 1,550.0 1,500.0 4,600.0
Personal income tax – do not proceed with standard deduction
- - - 402.6 1,209.7 1,612.3
Superannuation – deferral of higher concessional contributions cap
- 580.0 730.0 130.0 -10.0 1,430.0
Tax compliance – managing tax debt in challenging times: a balanced and differentiated approach
- 311.7 393.3 272.4 147.6 1,125.0
GST – compliance program – two year extension
- - - 462.9 613.2 1,076.1
Superannuation – reduction of higher tax concession for contributions of very high income earners
- - 200.0 355.0 475.0 1,030.0
Fringe benefits tax – further reform to living-away-from-home allowances and benefits
- 50.0 217.0 353.0 399.0 1,019.0
Personal income tax – do not proceed with 50 per cent tax discount for interest income
- - - 280.0 515.0 795.0
Spreading the benefits of the boom – company loss carry-back
- - -150.0 -250.0 -300.0 -700.0
Duty free allowances - cigarettes and tobacco
0.0 127.0 165.0 176.0 192.0 660.0
Passenger movement charge – increase
- 85.0 140.0 175.0 210.0 610.0
Tax Breaks for Green Buildings – closure
- - 10.0 100.0 280.0 390.0
Stronger Super – implementation of SuperStream reforms
- 121.5 111.1 83.1 69.3 385.0
Personal income tax – changes to the net medical expenses tax offset
- .. 115.0 125.0 130.0 370.0
Australian Reinsurance Pool Corporation – dividend
- 75.0 75.0 75.0 75.0 300.0
International tax - increase in managed investment trust final withholding tax rate
- 50.0 65.0 70.0 75.0 260.0
Personal income tax – mature age worker tax offset phase out
- - 40.0 85.0 130.0 255.0
Tax compliance – maintaining the cross agency approach to preventing abuse of secrecy jurisdictions (Project Wickenby)
- 3.8 46.5 84.8 75.0 210.1
Personal income tax – better targeting of the employment termination payment tax offset
20.0 20.0 50.0 55.0 60.0 205.0
Export Finance and Insurance Corporation – special dividend
- 200.0 - - - 200.0
Other measures 5.8 97.4 272.2 330.3 345.2 1,051.0
Total impact of revenue measures 75.8 2,021.4 3,680.1 4,915.1 6,191.0 16,883.5

Statement 5: Revenue
5-17
The Government is also increasing Australian Taxation Office (ATO) resources to undertake tax compliance activities through the following measures.
• Increasing cash receipts by $1,125 million over the four years to 2015-16 by providing $106 million over four years to the ATO to increase the ATO’s collections of outstanding taxation debts and superannuation guarantee charges. This has no impact in fiscal balance terms.
• Increasing cash receipts by $1076.1 million over the forward estimates, including a GST component of $554.1 million that will be paid to the States and Territories, by providing $195.3 million in 2014-15 and 2015-16 to continue a range of activities that promote voluntary GST compliance and provide a level playing field for Australian businesses.
• Increasing cash receipts by $210.1 million over the forward estimates period by providing $76.8 million over three years to the ATO and other Project Wickenby agencies to continue the Government’s fight against tax evasion, avoidance and related crimes.
There are also a small number of policy measures since MYEFO which reduce tax receipts. The most significant is the introduction of loss carry-back for companies that allows them to carry back tax losses so they receive a refund against tax previously paid. This will improve their access to tax losses, which will help them invest and innovate. The measure commences in 2012-13 and is expected to reduce receipts by $700 million over the forward estimates.

5-18
Statement 5: Revenue
Tab
le 7
: P
erso
nal
inco
me
tax
rate
s(a
)
Tax
abl
e in
com
eP
er c
ent
Tax
abl
e in
com
eP
er c
ent
Ta
xabl
e in
com
eP
er c
ent
Tax
able
inco
me
Per
cen
t
Res
iden
ts$0
–$6,
000
Nil
$0–$
6,00
0N
il$0
–$18
,20
0N
il$
0–$1
8,2
00N
il$6
,00
1–$3
7,00
015
$6,0
01–$
37,0
0015
$18,
201–
$37
,000
19$
18,2
01–
$37,
000
19$3
7,0
01–$
80,0
0030
$37,
001–
$80,
000
30$3
7,00
1–$
80,0
0032
.5$
37,0
01–
$80,
000
32.5
$80,
001
–$18
0,00
037
$80,
001–
$180
,000
37$8
0,00
1–$
180,
000
37$
80,0
01–
$180
,000
37>
$18
0,00
045
> $
180
,000
45>
$18
0,00
045
> $
180,
000
45
No
n-r
esid
ents
$0–$
37,0
0029
$0–$
37,0
0029
$37,
001
–$80
,000
30$3
7,00
1–$8
0,00
030
$0–$
80,0
00
32.5
$0–
$80,
000
32.5
$80,
001
–$18
0,00
037
$80,
001–
$180
,000
37$8
0,00
1–$
180,
000
37$
80,0
01–
$180
,000
37>
$18
0,00
045
> $
180
,000
45>
$18
0,00
045
> $
180,
000
45
Me
dic
are
levy
$0–$
18,8
39N
il$0
–$19
,404
Nil
$0–$
20,5
42
Nil
$0–
$20,
542
Nil
(for
sin
gles
)$1
8,8
40-$
22,1
6310
% o
f >
$1
9,40
5-$2
2,82
81
0% o
f >
$2
0,54
3-$
24,1
6710
% o
f >
$
20,5
43-$
24,1
67
10%
of
>
$18
,839
$19,
404
$20,
542
$20,
542
> $
22,1
631.
5>
$2
2,82
81.
5>
$24
,167
1.5
> $
24,1
67
1.5
Am
ou
nt
Am
ou
nt
Am
ou
nt
Am
ou
nt
Lo
w I
nco
me
$0-$
30,
000
$1,
500
$0-$
30,0
00$1
,500
$0-$
37,0
00
$445
$0-
$37,
000
$44
5T
ax O
ffse
t$3
0,0
01-$
67,5
00le
ss 4
%$3
0,00
1-$6
7,50
0le
ss 4
%$3
7,00
1-$
66,6
66le
ss 1
.5%
$37
,001
-$66
,66
6le
ss 1
.5%
of
>
of
>
of
>
of
>
$30
,000
$30,
000
$37,
000
$37,
000
> $
67,5
00N
il>
$6
7,50
0N
il>
$66
,666
Nil
> $
66,6
66
Nil
Fro
m 1
Ju
ly 2
012
Fro
m 1
Ju
ly 2
013
Fro
m 1
Ju
ly 2
010
Fro
m 1
Ju
ly 2
011
(a
) T
his
tabl
e in
clud
es le
gisl
ated
cha
nges
to
tax
rate
s an
d th
resh
olds
, ex
clud
ing
tem
pora
ry c
hang
es s
uch
as t
he T
empo
rary
Flo
od a
nd C
yclo
ne R
econ
stru
ctio
n Le
vy in
20
11-1
2.

Statement 5: Revenue
5-19
RECEIPTS GROWTH BY HEAD OF REVENUE
In 2011-12, total receipts are expected to grow by 9.3 per cent ($28.0 billion), on the back of a pick-up in individuals’ income tax growth of 11.3 per cent ($15.3 billion) and a bounce-back in company tax growth of 19.9 per cent ($11.2 billion).
In 2012-13, total receipts are forecast to grow by a further 11.8 per cent ($38.8 billion), reflecting 8.1 per cent ($12.3 billion) growth in individuals’ income tax receipts, 8.9 per cent ($6.0 billion) growth in company tax receipts, and 10.5 per cent ($8.7 billion) growth in indirect taxes.
In the projection years, total receipts are forecast to grow by 6.4 per cent ($23.8 billion) in 2013-14, 5.4 per cent ($21.1 billion) in 2014-15 and by 6.0 per cent ($24.8 billion) in 2015-16.
Individuals’ income and other withholding taxation receipts
Table 8: Individuals’ income and other withholding taxation receipts Actual Estimates2010-11 2011-12 2012-13 2013-14 2014-15 2015-16
$m $m $m $m $m $mIndividuals' and other withholding taxes
Gross income tax withholding 129,654 142,200 150,600 163,900 174,700 185,400Gross other individuals 27,795 31,300 35,500 37,900 41,500 44,900less: Refunds 24,711 25,600 26,240 26,430 28,580 30,500
Total individuals' and withholding taxation 132,739 147,900 159,860 175,370 187,620 199,800Fringe benefits tax 3,303 3,480 3,830 4,310 4,680 4,880Total individuals taxation receipts 136,041 151,380 163,690 179,680 192,300 204,680
Projections
Gross income tax withholding
Receipts from gross income tax withholding are expected to grow by 9.7 per cent ($12.5 billion) in 2011-12, reflecting growth in wages and salaries.
In 2012-13, gross income tax withholding receipts are forecast to increase by 5.9 per cent ($8.4 billion), reflecting more modest growth in wages and salaries.
In the projection years, receipts from gross income tax withholding are expected to grow by 8.8 per cent ($13.3 billion) in 2013-14, 6.6 per cent ($10.8 billion) in 2014-15 and 6.1 per cent ($10.7 billion) in 2015-16, reflecting longer-term growth in wages and salaries, partly offset by the effect of personal tax cuts brought about by the Clean Energy Future Package.

Statement 5: Revenue
5-20
Gross other individuals
Gross other individuals receipts are expected to grow by 12.6 per cent ($3.5 billion) in 2011-12, largely reflecting growth in non-wage income.
In 2012-13, receipts from gross other individuals are expected to grow by 13.4 per cent ($4.2 billion), reflecting growth in non-wage income.
In the projection years, receipts from gross other individuals are expected to grow in line with longer-term trends in non-wage income.
Income tax refunds for individuals
Income tax refunds for individuals, which have a negative impact on receipts, are expected to grow by 3.6 per cent ($889 million) in 2011-12, mainly reflecting 2010-11 individuals’ income.
Individuals’ tax refunds are then expected to grow by 2.5 per cent ($640 million) in 2012-13, largely reflecting a bring-forward of the low-income tax offset.
In the projection years, refunds for individuals are expected to return to longer-term trend growth.
Fringe benefits tax
Receipts from fringe benefits tax (FBT) are expected to grow by 5.4 per cent ($177 million) in 2011-12, reflecting wages and employment growth.
In 2012-13, FBT is expected to grow by 10.1 per cent ($350 million), in part reflecting the positive impact of the revised policy treatment of FBT on cars.
Over the projection years, FBT is expected to return to longer-term trend growth.
Company and other related income taxation receipts
Table 9: Company and other related income taxation receipts Actual Estimates2010-11 2011-12 2012-13 2013-14 2014-15 2015-16
$m $m $m $m $m $mCompany tax 56,262 67,460 73,480 76,370 80,320 84,270Superannuation funds 6,519 7,230 8,050 9,010 10,805 12,715Resource rent taxes(a) 806 1,510 7,160 8,190 7,380 8,200Total company and related income
taxation receipts 63,587 76,200 88,690 93,570 98,505 105,185
Projections
(a) Resource rent taxes include PRRT and gross receipts from the MRRT. Net receipts from the MRRT are
expected to be $3.0 billion in 2012-13, $3.5 billion in 2013-14, $3.2 billion in 2014-15 and $3.7 billion in 2015-16, which represent the net impact on receipts across several different heads of revenue. These include the offsetting reductions in company tax (through deductibility) and interactions with other taxes.

Statement 5: Revenue
5-21
Company tax
Company tax is forecast to grow by 19.9 per cent ($11.2 billion) in 2011-12, reflecting the lagged effect of the economic recovery on tax collections following the global financial crisis. In 2012-13, company tax receipts are expected to grow by 8.9 per cent ($6.0 billion), as strengthening economic conditions since the financial crisis continue to flow into tax collections.
Over the projection years, receipts from company tax are expected to grow by 3.9 per cent ($2.9 billion) in 2013-14, 5.2 per cent ($4.0 billion) in 2014-15 and 4.9 per cent ($4.0 billion) in 2015-16, reflecting more normal rates of growth in gross operating surplus.
Superannuation funds
Receipts from superannuation funds are expected to grow by 10.9 per cent ($711 million) in 2011-12 and 11.3 per cent ($820 million) in 2012-13, reflecting the ongoing recovery from the global financial crisis in wages and salaries growth and asset prices, which increase contributions and earnings from superannuation funds.
In the projection years, receipts from superannuation funds increase by 11.9 per cent ($960 million) in 2013-14, 19.9 per cent ($1.8 billion) in 2014-15, and 17.7 per cent ($1.9 billion) in 2015-16. The acceleration in growth in superannuation tax over the projection years reflects stronger capital gains growth as asset markets recover and the effect of crisis-related losses on tax positions unwinds. It also reflects policy changes, including the phased increase in the superannuation guarantee charge to 12 per cent, and the measure announced at this Budget to reduce the tax concession which very high income earners receive on their concessional contributions.
Resource rent taxes
Resource rent taxes include the petroleum resource rent tax (PRRT) and the minerals resource rent tax (MRRT). They can be highly variable as they are heavily influenced by movements in the exchange rate and relevant commodity prices. The introduction of the MRRT in 2012-13 gives a one-off boost to the revenue base and growth rate in that year.
Receipts from resource rent taxes are expected to increase by 87.3 per cent ($704 million) in 2011-12, reflecting high commodity prices and high levels of production.
Receipts from resource rent taxes are expected to grow substantially in 2012-13, reflecting the commencement of the MRRT.
Over the forward years, receipts from resource rent taxes are expected to reflect the projected changes in the commodity price cycle and some additional fields paying PRRT coming on stream.

Statement 5: Revenue
5-22
Box 3: The company tax payments system during a downturn
The design of the company tax payments system may result in counter-intuitive payment patterns following a downturn. The majority of company tax is paid in quarterly instalments, which are calculated from quarterly turnover and a rate based on the most recently assessed tax return. There is also a balancing payment or a refund upon lodgement of the tax return six months after the income year.
Chart A shows an illustrative example, with the ‘pre-downturn’ being a ‘normal’ year, with no balancing payment required. In the downturn year (year 0), instalments fall due to lower turnover, but the company still receives a refund (the negative bar in year 1) because the instalment rate reflects pre-downturn profits.
During year 1, when turnover returns to normal, the company will receive its new, lower, instalment rate. It will therefore pay lower instalments which, combined with the refund from year 0, makes year 1 the lowest year of tax paid over the cycle. The company will under-pay its tax in year 1 and pay a balancing payment in year 2. This effect will broadly repeat in year 2, with the company still operating on the lower instalment rate. Instalments return to ‘normality’ in year 3 which, combined with the balancing payment from year 2, makes this the peak year for tax payments.
This stylised example illustrates that a downturn takes several years to flow through the company tax payments system and results in very high growth rates of total tax paid several years afterwards. Downturns may spread over more than one year and, as companies operate on various accounting years, the effects may extend even further. This example does not consider a company making a loss, which is ‘carried forward’ and offset against future years’ income, potentially generating even higher growth rates as income returns to normality (Box 3, Statement 5, 2010-11 Budget).
Chart A: Cash payments for an example company through a downturn
-5
0
5
10
15
-5
0
5
10
15
Pre-downturn Year 0(downturn)
Year 1 Year 2 Year 3 Year 4
$million$million
Instalments Balancing payment or refund Total tax paid
Source: Treasury estimates.

Statement 5: Revenue
5-23
Sales taxation receipts
Table 10: Sales taxation receipts Actual Estimates2010-11 2011-12 2012-13 2013-14 2014-15 2015-16
$m $m $m $m $m $mGoods and services tax 46,083 45,729 48,341 51,049 53,660 56,247Wine equalisation tax 722 720 770 820 870 920Luxury car tax 483 440 450 460 480 510Total sales taxation receipts 47,288 46,889 49,561 52,329 55,010 57,677
Projections
Goods and services tax
Goods and services tax (GST) receipts are expected to decline by 0.8 per cent ($354 million) in 2011-12, reflecting weak year-to-date collections as well as softness in dwelling investment.
In 2012-13, receipts from GST are expected to grow by 5.7 per cent ($2.6 billion), reflecting growth in taxable consumption and dwelling investment as well as increased compliance measures.
In the projection years, GST receipts are expected to grow by 5.6 per cent ($2.7 billion) in 2013-14 and 5.1 per cent ($2.6 billion) in 2014-15 and 4.8 per cent ($2.6 billion) in 2015-16, in line with trend growth in consumption.
Other sales taxes
Other sales taxes include the wine equalisation tax and the luxury car tax.
Luxury car tax (LCT) receipts are expected to decline by 8.9 per cent ($43 million) in 2011-12, reflecting subdued growth in luxury car sales during the year. LCT receipts are expected to increase by 2.3 per cent ($10 million) in 2012-13, reflecting a modest bounce back in sales. A return to longer term growth is expected over the projection period.
Wine equalisation tax (WET) receipts are expected to remain broadly unchanged in 2011-12. In 2012-13, receipts from the WET are expected to grow by 6.9 per cent ($50 million), reflecting modest growth in wine consumption. Receipts from the WET are expected to grow in line with longer-term growth rates over the projection years.

Statement 5: Revenue
5-24
Excise and customs duty
Table 11: Excise and customs duty receipts Actual2010-11 2011-12 2012-13 2013-14 2014-15 2015-16
$m $m $m $m $m $mExcise duty
Petrol 5,892 6,000 5,900 5,900 5,750 6,050Diesel 7,435 8,200 8,700 9,200 9,300 9,500Beer 1,952 1,960 2,035 2,183 2,265 2,383Tobacco 6,387 5,790 5,850 5,190 5,220 5,360Other excisable products 4,089 3,830 4,400 4,710 4,990 5,180
of which: Other excisable beverages(a) 897 930 940 1,030 1,070 1,130
Total excise duty receipts 25,756 25,780 26,885 27,183 27,525 28,473Customs duty
Textiles, clothing and footwear 639 650 730 785 635 675Passenger motor vehicles 507 850 940 1,020 1,090 1,160Excise-like goods 3,364 4,210 4,370 5,310 5,420 5,610Other imports 1,287 1,400 1,500 1,625 1,720 1,840less: Refunds and drawbacks 368 200 200 200 200 200
Total customs duty receipts 5,429 6,910 7,340 8,540 8,665 9,085Total excise and customs
duty receipts 31,185 32,690 34,225 35,723 36,190 37,558
ProjectionsEstimates
(a) Other excisable beverages are those not exceeding 10 per cent by volume of alcohol (excluding beer,
brandy and wine).
Excise duty
Receipts from excise are expected to be broadly unchanged in 2011-12, reflecting the balance of declines in alcohol and tobacco excise and gains in diesel and petrol excise. In 2012-13, excise receipts are expected to increase by 4.3 per cent ($1.1 billion), partly reflecting continued strong growth in diesel excise. In the projection years, excise duties are expected to grow in line with long-term trends.
Excise duties on tobacco over the forward years are affected by the scheduled relocation overseas of a large tobacco producer, which reduces excise and raises customs duty.

Statement 5: Revenue
5-25
Table 12: Excise rates(a)
Rates Rates Rates Ratesapplying applying applying applying
from from from from2 Aug 2010 1 Feb 2011 1 Aug 2011 1 Feb 2012
Commodity $ $ $ $Petroleum and other fuel products (per litre)
Gasoline 0.38143 0.38143 0.38143 0.38143Diesel 0.38143 0.38143 0.38143 0.38143Ethanol and biodiesel 0.38143 0.38143 0.38143 0.38143Blends of the above 0.38143 0.38143 0.38143 0.38143Aviation gasoline 0.03556 0.03556 0.03556 0.03556Aviation kerosene 0.03556 0.03556 0.03556 0.03556Other petroleum products 0.38143 0.38143 0.38143 0.38143
Greases (per kilogram) 0.05449 0.05449 0.05449 0.05449Oils and lubricants, excluding greases (per litre) 0.05449 0.05449 0.05449 0.05449Beer (per litre of alcohol over 1.15 per cent)
Draught beer, low strength 7.25 7.33 7.51 7.56Draught beer, mid strength 22.76 23.01 23.59 23.73Draught beer, high strength 29.78 30.11 30.86 31.05Other beer, low strength 36.31 36.71 37.63 37.86Other beer, mid strength 42.31 42.78 43.85 44.11Other beer, high strength 42.31 42.78 43.85 44.11Non-commercial, low strength 2.55 2.58 2.64 2.66Non-commercial, mid and high strength 2.95 2.98 3.05 3.07
Other beverages, not exceeding10 per cent alcohol content
(per litre of alcohol) 71.67 72.46 74.27 74.72Potable spirits (per litre of alcohol)
Brandy 66.92 67.66 69.35 69.77Other spirits, exceeding 10 per cent
alcohol content 71.67 72.46 74.27 74.72Cigarettes, cigars and tobacco (tobacco
content of 0.8 grams or less per stick) 0.33267 0.33633 0.34474 0.34681Tobacco products (per kilogram) 415.86 420.43 430.94 433.53 (a) The rate of excise on crude oil and condensate is not provided in this table as it varies according to the
quantity sold, the sale price, and the dates of discovery and development of the oil field.
Table 13: Customs duty tariff rates Applying from Applying from Applying from
11 May 2005 1 January 2010 1 January 2015
Per cent Per cent Per cent
General tariff(a) 5 5 5
Passenger motor vehicles(b) 10 5 5
Textiles, clothing and footwear
Clothing and finished textiles 17.5 10 5
Cotton sheeting, fabric, carpet and footwear 10 5 5
Sleeping bags, table linen and footwear parts 7.5 5 5
Tariff concession order 0 0 0 (a) The general tariff of 5 per cent applies to most manufactured goods. Many goods, including primary
products, textiles, clothing and footwear and other manufactured goods have a free rate of duty. (b) This category includes new passenger vehicles and off-road vehicles and parts. Used or second-hand
passenger vehicles are subject to an additional impost of $12,000.

Statement 5: Revenue
5-26
Customs
Customs duties are expected to grow by 27.3 per cent ($1.5 billion) in 2011-12, reflecting higher expected receipts from tobacco and passenger motor vehicles.
In 2012-13, customs duty receipts are expected to grow by 6.2 per cent ($430 million), reflecting higher expected receipts from tobacco, general goods and passenger motor vehicles.
In 2013-14, customs duty is expected to increase by 16.3 per cent ($1.2 billion), partly reflecting the effect of the relocation of a large tobacco producer offshore. Customs duties are expected to return to more normal rates of growth by 2015-16.
Carbon Pricing Mechanism
Receipts from the carbon pricing mechanism are expected to be around $24.7 billion over the forward estimates period.
Table 14: Carbon pricing mechanism receipts Actual Estimates2010-11 2011-12 2012-13 2013-14 2014-15 2015-16
$m $m $m $m $m $mCarbon pricing mechanism receipts - - 4,020 6,610 7,310 6,720
Projections
The carbon pricing mechanism will commence from 1 July 2012, with a fixed price period of three years (commencing at $23 in 2012-13). Liable entities will be required to surrender a carbon unit for every tonne of covered greenhouse gas they emit.
The scheme will transition to a flexible price from 2015-16 and be linked to the international market. Under the flexible price an overall limit (or emissions cap) will be placed on annual greenhouse gas emissions from covered sources. In the flexible price period, international carbon prices are expected to set the domestic carbon price.
The increase in receipts from 2012-13 to 2013-14 largely reflects the surrender obligations for the fixed price period, where liable entities are required to surrender permits for 75 per cent of their emissions liability in the relevant compliance year and the remainder in the following compliance year. The decrease in receipts from 2014-15 to 2015-16 largely reflects lower emissions from moving to a pollution cap.
The receipt estimate for 2015-16 incorporates an international carbon price of around $29, based on Treasury modelling in Strong Growth, Low Pollution. For further detail see Box 1, Statement 3.

Statement 5: Revenue
5-27
Other taxation receipts
Other taxation receipts are expected to decline by 8.9 per cent ($244 million) in 2011-12, reflecting weaker collections, and increase by 17.1 per cent ($426 million) in 2012-13, reflecting the Government’s decision to implement the Cooper Review reforms that streamline the superannuation system and the increase in the passenger movement charge.
Table 15: Other taxation receipts Actual Estimates Projections2010-11 2011-12 2012-13 2013-14 2014-15 2015-16
$m $m $m $m $m $mAgricultural levies 445 437 440 436 443 449Other taxes 2,292 2,057 2,480 3,060 3,094 3,190Total other taxation receipts 2,738 2,494 2,920 3,496 3,537 3,639
Non-taxation receipts
Non-tax receipts are expected to decline by 4.1 per cent ($862 million) in 2011-12 from 2010-11 as a consequence of lower dividends and interest receipts.
Non-tax receipts are expected to increase by 26.3 per cent ($5.3 billion) in 2012-13, reflecting an increase in the sale of non-financial assets, increased interest received by the Future Fund and higher dividends from Government Business Enterprises.
Table 16: Non-taxation receipts
Actual2010-11 2011-12 2012-13 2013-14 2014-15 2015-16
$m $m $m $m $m $mSales of goods and services 7,522 8,040 8,289 8,696 8,426 8,741Interest received 4,943 4,343 4,660 4,679 4,525 4,822Dividends 3,248 2,222 2,518 1,967 2,137 2,197Other non-taxation receipts 5,472 5,718 10,201 5,793 5,677 7,154Total non-taxation receipts 21,185 20,323 25,667 21,135 20,766 22,914
ProjectionsEstimates

Statement 5: Revenue
5-28
REVENUE VARIATIONS SINCE MYEFO
The revenue estimates are the accrual accounting equivalent of the cash-based receipts estimates. Changes in revenue are generally driven by the same factors — policy as well as parameter variation — as receipts. Where the revenue and receipts estimates tend to vary is in terms of the timing of their impacts.
Further information on the difference between the accrual and cash taxation estimates is provided in Appendix E: Taxation Revenue Recognition.
Table 17 provides a reconciliation of the Budget’s revenue estimates with those at MYEFO.
Table 17: Reconciliation of total Australian Government general government revenue estimates from the 2011-12 MYEFO
Estimates Projections2011-12 2012-13 2013-14 2014-15
$m $m $m $mRevenue at 2011-12 MYEFO 344,110 382,764 407,542 428,151Per cent of GDP 23.1 24.5 24.7 24.6
Changes from 2011-12 MYEFO to 2012-13 BudgetEffect of policy decisions(a) 76 1,722 3,362 4,763Effect of parameter and other variations -7,768 -8,415 -8,707 -8,084Total variations -7,692 -6,693 -5,344 -3,321
Revenue at 2012-13 Budget 336,418 376,071 402,197 424,830Per cent of GDP 22.8 24.2 24.6 24.7 (a) Excludes secondary impacts on public debt interest of policy decisions and offsets from the contingency
reserve for decisions taken.
Since the 2011-12 MYEFO, total revenue has been revised down by $7.7 billion in 2011-12 and by $6.7 billion in 2012-13. The downward revisions reflect lower estimated company taxes, superannuation tax, GST and excise. The factors affecting downward revisions to tax receipts are also at play with regards to revenue write-downs.
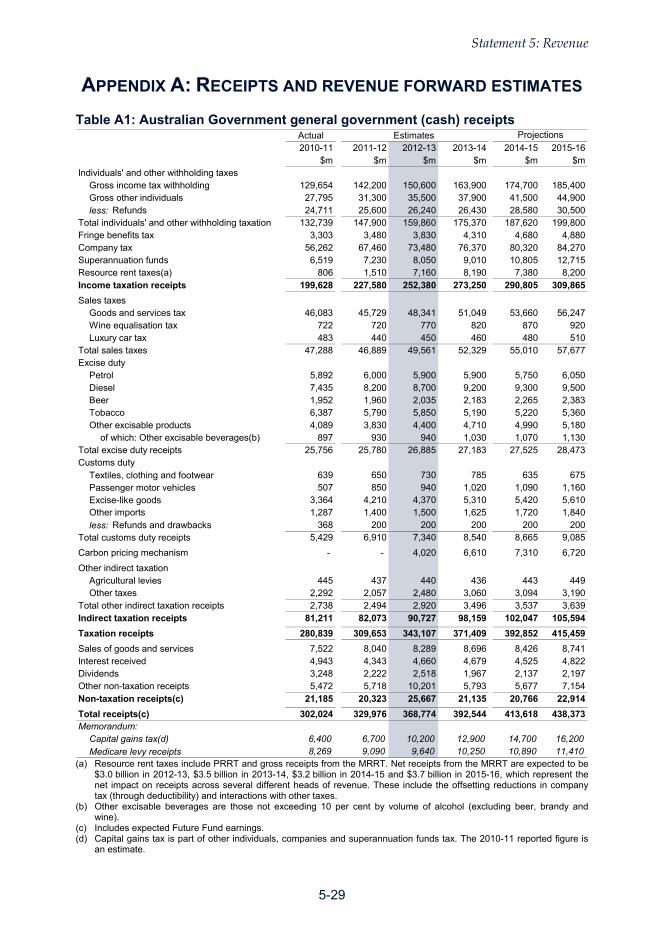
Statement 5: Revenue
5-29
APPENDIX A: RECEIPTS AND REVENUE FORWARD ESTIMATES
Table A1: Australian Government general government (cash) receipts Actual Estimates2010-11 2011-12 2012-13 2013-14 2014-15 2015-16
$m $m $m $m $m $mIndividuals' and other withholding taxes
Gross income tax withholding 129,654 142,200 150,600 163,900 174,700 185,400Gross other individuals 27,795 31,300 35,500 37,900 41,500 44,900less: Refunds 24,711 25,600 26,240 26,430 28,580 30,500
Total individuals' and other withholding taxation 132,739 147,900 159,860 175,370 187,620 199,800Fringe benefits tax 3,303 3,480 3,830 4,310 4,680 4,880Company tax 56,262 67,460 73,480 76,370 80,320 84,270Superannuation funds 6,519 7,230 8,050 9,010 10,805 12,715Resource rent taxes(a) 806 1,510 7,160 8,190 7,380 8,200Income taxation receipts 199,628 227,580 252,380 273,250 290,805 309,865
Sales taxesGoods and services tax 46,083 45,729 48,341 51,049 53,660 56,247Wine equalisation tax 722 720 770 820 870 920Luxury car tax 483 440 450 460 480 510
Total sales taxes 47,288 46,889 49,561 52,329 55,010 57,677Excise duty
Petrol 5,892 6,000 5,900 5,900 5,750 6,050Diesel 7,435 8,200 8,700 9,200 9,300 9,500Beer 1,952 1,960 2,035 2,183 2,265 2,383Tobacco 6,387 5,790 5,850 5,190 5,220 5,360Other excisable products 4,089 3,830 4,400 4,710 4,990 5,180
of which: Other excisable beverages(b) 897 930 940 1,030 1,070 1,130Total excise duty receipts 25,756 25,780 26,885 27,183 27,525 28,473Customs duty
Textiles, clothing and footwear 639 650 730 785 635 675Passenger motor vehicles 507 850 940 1,020 1,090 1,160Excise-like goods 3,364 4,210 4,370 5,310 5,420 5,610Other imports 1,287 1,400 1,500 1,625 1,720 1,840less: Refunds and drawbacks 368 200 200 200 200 200
Total customs duty receipts 5,429 6,910 7,340 8,540 8,665 9,085
Carbon pricing mechanism - - 4,020 6,610 7,310 6,720
Other indirect taxationAgricultural levies 445 437 440 436 443 449Other taxes 2,292 2,057 2,480 3,060 3,094 3,190
Total other indirect taxation receipts 2,738 2,494 2,920 3,496 3,537 3,639Indirect taxation receipts 81,211 82,073 90,727 98,159 102,047 105,594
Taxation receipts 280,839 309,653 343,107 371,409 392,852 415,459
Sales of goods and services 7,522 8,040 8,289 8,696 8,426 8,741Interest received 4,943 4,343 4,660 4,679 4,525 4,822Dividends 3,248 2,222 2,518 1,967 2,137 2,197Other non-taxation receipts 5,472 5,718 10,201 5,793 5,677 7,154Non-taxation receipts(c) 21,185 20,323 25,667 21,135 20,766 22,914
Total receipts(c) 302,024 329,976 368,774 392,544 413,618 438,373Memorandum:
Capital gains tax(d) 6,400 6,700 10,200 12,900 14,700 16,200Medicare levy receipts 8,269 9,090 9,640 10,250 10,890 11,410
Projections
(a) Resource rent taxes include PRRT and gross receipts from the MRRT. Net receipts from the MRRT are expected to be
$3.0 billion in 2012-13, $3.5 billion in 2013-14, $3.2 billion in 2014-15 and $3.7 billion in 2015-16, which represent the net impact on receipts across several different heads of revenue. These include the offsetting reductions in company tax (through deductibility) and interactions with other taxes.
(b) Other excisable beverages are those not exceeding 10 per cent by volume of alcohol (excluding beer, brandy and wine).
(c) Includes expected Future Fund earnings. (d) Capital gains tax is part of other individuals, companies and superannuation funds tax. The 2010-11 reported figure is
an estimate.

Statement 5: Revenue
5-30
Table A2: Australian Government general government (accrual) revenue Actual Estimates Projections
2010-11 2011-12 2012-13 2013-14 2014-15 2015-16
$m $m $m $m $m $m
Individuals' and other withholding taxes
Gross income tax withholding 130,790 143,220 151,620 164,980 175,860 186,650
Gross other individuals 30,642 33,610 37,670 40,250 44,150 47,740
less: Refunds 24,660 25,600 26,240 26,430 28,580 30,500
Total individuals' and other withholding taxation 136,772 151,230 163,050 178,800 191,430 203,890
Fringe benefits tax 3,348 3,540 3,900 4,390 4,760 4,960
Company tax 57,312 67,950 75,032 77,901 81,902 85,932
Superannuation funds 6,693 7,390 8,250 9,220 11,035 12,995
Resource rent taxes(a) 806 1,840 7,410 8,350 7,400 8,240
Income taxation revenue 204,931 231,950 257,642 278,661 296,527 316,017
Sales taxes
Goods and services tax 48,093 47,790 50,486 53,234 56,056 58,730
Wine equalisation tax 747 730 780 830 880 930
Luxury car tax 489 440 450 460 480 510
Total sales taxes 49,329 48,960 51,716 54,524 57,416 60,170
Excise duty
Petrol 5,907 6,080 5,900 5,380 5,880 6,190
Diesel 7,454 8,200 8,700 9,200 9,300 9,500
Beer 1,957 1,960 2,035 2,183 2,265 2,383
Tobacco 6,387 5,790 5,850 5,190 5,220 5,360
Other excisable products 4,097 3,830 4,400 4,710 4,990 5,180
of which: Other excisable beverages(b) 900 930 940 1,030 1,070 1,130
Total excise duty revenue 25,803 25,860 26,885 26,663 27,655 28,613
Customs duty
Textiles, clothing and footwear 643 650 730 785 635 675
Passenger motor vehicles 774 850 940 1,020 1,090 1,160
Excise-like goods 3,364 4,210 4,370 5,310 5,420 5,610
Other imports 1,288 1,410 1,510 1,635 1,730 1,850
less: Refunds and drawbacks 241 180 180 180 180 180
Total customs duty revenue 5,828 6,940 7,370 8,570 8,695 9,115
Carbon pricing mechanism - - 7,690 8,685 9,275 9,400
Other indirect taxation
Agricultural levies 445 437 440 436 443 449
Other taxes 2,669 2,307 2,883 3,188 3,267 3,396
Total other indirect taxation revenue 3,115 2,744 3,323 3,625 3,711 3,845
Indirect taxation revenue 84,074 84,504 96,984 102,067 106,752 111,143
Taxation revenue 289,005 316,454 354,626 380,727 403,278 427,160
Sales of goods and services 7,680 8,256 8,264 8,641 8,455 8,788
Interest 5,169 4,703 5,113 5,209 5,187 5,493
Dividends 2,562 1,669 2,485 1,966 2,137 2,197
Other non-taxation revenue 5,473 5,336 5,583 5,654 5,773 5,922
Non-taxation revenue(c) 20,885 19,964 21,445 21,470 21,552 22,400
Total revenue(c) 309,890 336,418 376,071 402,197 424,830 449,559
Memorandum:
Capital gains tax(d) 6,400 6,700 10,200 12,900 14,700 16,200
Medicare levy revenue 8,269 9,090 9,640 10,250 10,890 11,410 (a) Resource rent taxes include PRRT and gross revenue from the MRRT. Net revenue from the MRRT is expected to be
$3.0 billion in 2012-13, $3.5 billion in 2013-14, $3.2 billion in 2014-15 and $3.7 billion in 2015-16, which represent the net impact on revenue across several different heads of revenue. These include the offsetting reductions in company tax (through deductibility) and interactions with other taxes.
(b) Other excisable beverages are those not exceeding 10 per cent by volume of alcohol (excluding beer, brandy and wine).
(c) Includes expected Future Fund earnings. (d) Capital gains tax is part of other individuals, companies and superannuation funds tax. The 2010-11 reported figure is
an estimate.

Statement 5: Revenue
5-31
APPENDIX B: CHANGES SINCE 2011-12 MYEFO
Table B1: Reconciliation of 2011-12 general government (cash) receipts
MYEFO Budget$m $m $m %
Individuals' and other withholding taxesGross income tax withholding 142,500 142,200 -300 -0.2Gross other individuals 30,600 31,300 700 2.3less: Refunds 26,600 25,600 -1,000 -3.8
Total individuals' and other withholding taxation 146,500 147,900 1,400 1.0Fringe benefits tax 3,450 3,480 30 0.9Company tax 70,000 67,460 -2,540 -3.6Superannuation funds 8,850 7,230 -1,620 -18.3Resource rent taxes(a) 1,930 1,510 -420 -21.8Income taxation receipts 230,730 227,580 -3,150 -1.4
Sales taxesGoods and services tax 47,663 45,729 -1,934 -4.1Wine equalisation tax 740 720 -20 -2.7Luxury car tax 480 440 -40 -8.3
Total sales taxes 48,883 46,889 -1,994 -4.1Excise duty
Petrol 6,000 6,000 0 0.0Diesel 8,000 8,200 200 2.5Beer 2,050 1,960 -90 -4.4Tobacco 6,250 5,790 -460 -7.4Other excisable products 4,600 3,830 -770 -16.7
of which: Other excisable beverages(b) 950 930 -20 -2.1Total excise duty receipts 26,900 25,780 -1,120 -4.2Customs duty
Textiles, clothing and footwear 650 650 0 0.0Passenger motor vehicles 600 850 250 41.7Excise-like goods 4,000 4,210 210 5.3Other imports 1,450 1,400 -50 -3.4less: Refunds and drawbacks 260 200 -60 -23.1
Total customs duty receipts 6,440 6,910 470 7.3
Carbon pricing mechanism - - - -
Other indirect taxationAgricultural levies 427 437 9 2.1Other taxes 1,919 2,057 139 7.2
Total other indirect taxation receipts 2,346 2,494 148 6.3Indirect taxation receipts 84,569 82,073 -2,496 -3.0
Taxation receipts 315,299 309,653 -5,646 -1.8
Sales of goods and services 7,970 8,040 70 0.9Interest received 4,902 4,343 -558 -11.4Dividends 2,233 2,222 -11 -0.5Other non-taxation receipts 6,029 5,718 -311 -5.2Non-taxation receipts(c) 21,133 20,323 -810 -3.8
Total receipts(c) 336,432 329,976 -6,457 -1.9Memorandum:
Capital gains tax 7,300 6,700 -600 -8.2
Medicare levy revenue 8,930 9,090 160 1.8
Estimates Change on MYEFO
(a) Resource rent taxes in 2011-12 only includes PRRT. (b) Other excisable beverages are those not exceeding 10 per cent by volume of alcohol (excluding beer, brandy and
wine). (c) Includes expected Future Fund earnings.

Statement 5: Revenue
5-32
Table B2: Reconciliation of 2012-13 general government (cash) receipts
MYEFO Budget$m $m $m %
Individuals' and other withholding taxesGross income tax withholding 150,100 150,600 500 0.3Gross other individuals 34,700 35,500 800 2.3less: Refunds 27,200 26,240 -960 -3.5
Total individuals' and other withholding taxation 157,600 159,860 2,260 1.4Fringe benefits tax 3,800 3,830 30 0.8Company tax 75,810 73,480 -2,330 -3.1Superannuation funds 9,900 8,050 -1,850 -18.7Resource rent taxes(a) 8,010 7,160 -850 -10.6Income taxation receipts 255,120 252,380 -2,740 -1.1
Sales taxesGoods and services tax 51,229 48,341 -2,888 -5.6Wine equalisation tax 780 770 -10 -1.3Luxury car tax 510 450 -60 -11.8
Total sales taxes 52,519 49,561 -2,958 -5.6Excise duty
Petrol 5,800 5,900 100 1.7Diesel 8,500 8,700 200 2.4Beer 2,200 2,035 -165 -7.5Tobacco 6,250 5,850 -400 -6.4Other excisable products 5,150 4,400 -750 -14.6
of which: Other excisable beverages(b) 1,000 940 -60 -6.0Total excise duty receipts 27,900 26,885 -1,015 -3.6Customs duty
Textiles, clothing and footwear 700 730 30 4.3Passenger motor vehicles 700 940 240 34.3Excise-like goods 4,250 4,370 120 2.8Other imports 1,700 1,500 -200 -11.8less: Refunds and drawbacks 260 200 -60 -23.1
Total customs duty receipts 7,090 7,340 250 3.5
Carbon pricing mechanism 4,020 4,020 0 0.0
Other indirect taxationAgricultural levies 432 440 8 1.8Other taxes 2,079 2,480 401 19.3
Total other indirect taxation receipts 2,511 2,920 409 16.3Indirect taxation receipts 94,041 90,727 -3,314 -3.5
Taxation receipts 349,161 343,107 -6,054 -1.7
Sales of goods and services 8,218 8,289 71 0.9Interest received 4,951 4,660 -291 -5.9Dividends 1,785 2,518 732 41.0Other non-taxation receipts 10,444 10,201 -243 -2.3Non-taxation receipts(c) 25,398 25,667 269 1.1
Total receipts(c) 374,559 368,774 -5,785 -1.5Memorandum:
Capital gains tax 11,000 10,200 -800 -7.3
Medicare levy revenue 9,620 9,640 20 0.2
Estimates Change on MYEFO
(a) Resource rent taxes in 2012-13 includes PRRT and gross receipts from the MRRT. (b) Other excisable beverages are those not exceeding 10 per cent by volume of alcohol (excluding beer, brandy and
wine). (c) Includes expected Future Fund earnings.

Statement 5: Revenue
5-33
Table B3: Reconciliation of 2011-12 general government (accrual) revenue Estimates Change on MYEFO
MYEFO Budget$m $m $m %
Individuals' and other withholding taxesGross income tax withholding 143,520 143,220 -300 -0.2Gross other individuals 32,910 33,610 700 2.1less: Refunds 26,600 25,600 -1,000 -3.8
Total individuals' and other withholding taxation 149,830 151,230 1,400 0.9Fringe benefits tax 3,530 3,540 10 0.3Company tax 71,800 67,950 -3,850 -5.4Superannuation funds 8,990 7,390 -1,600 -17.8Resource rent taxes(a) 2,030 1,840 -190 -9.4Income taxation revenue 236,180 231,950 -4,230 -1.8
Sales taxesGoods and services tax 49,750 47,790 -1,960 -3.9Wine equalisation tax 750 730 -20 -2.7Luxury car tax 480 440 -40 -8.3
Total sales taxes 50,980 48,960 -2,020 -4.0Excise duty
Petrol 6,080 6,080 0 0.0Diesel 7,980 8,200 220 2.8Beer 2,050 1,960 -90 -4.4Tobacco 6,250 5,790 -460 -7.4Other excisable products 4,600 3,830 -770 -16.7
of which: Other excisable beverages(b) 950 930 -20 -2.1Total excise duty revenue 26,960 25,860 -1,100 -4.1Customs duty
Textiles, clothing and footwear 650 650 0 0.0Passenger motor vehicles 750 850 100 13.3Excise-like goods 4,000 4,210 210 5.3Other imports 1,460 1,410 -50 -3.4
less: Refunds and drawbacks 120 180 60 50.0Total customs duty revenue 6,740 6,940 200 3.0
Carbon pricing mechanism - - - - Other indirect taxation
Agricultural levies 427 437 9 2.1Other taxes 2,344 2,307 -36 -1.6
Total other indirect taxation revenue 2,771 2,744 -27 -1.0Indirect taxation revenue 87,451 84,504 -2,947 -3.4
Taxation revenue 323,631 316,454 -7,177 -2.2
Sales of goods and services 8,050 8,256 206 2.6Interest 5,190 4,703 -488 -9.4Dividends 1,652 1,669 18 1.1Other non-taxation revenue 5,587 5,336 -251 -4.5Non-taxation revenue(c) 20,479 19,964 -515 -2.5
Total revenue(c) 344,110 336,418 -7,692 -2.2Memorandum:
Capital gains tax 7,300 6,700 -600 -8.2Medicare levy revenue 8,930 9,090 160 1.8
(a) Resource rent taxes in 2011-12 only includes PRRT. (b) Other excisable beverages are those not exceeding 10 per cent by volume of alcohol (excluding beer, brandy and
wine). (c) Includes expected Future Fund earnings.

Statement 5: Revenue
5-34
Table B4: Reconciliation of 2012-13 general government (accrual) revenue Estimates Change on MYEFO
MYEFO Budget$m $m $m %
Individuals' and other withholding taxesGross income tax withholding 151,190 151,620 430 0.3Gross other individuals 37,350 37,670 320 0.9less: Refunds 27,200 26,240 -960 -3.5
Total individuals' and other withholding taxation 161,340 163,050 1,710 1.1Fringe benefits tax 3,870 3,900 30 0.8Company tax 77,620 75,032 -2,588 -3.3Superannuation funds 10,060 8,250 -1,810 -18.0Resource rent taxes(a) 8,000 7,410 -590 -7.4Income taxation revenue 260,890 257,642 -3,248 -1.2
Sales taxesGoods and services tax 53,560 50,486 -3,074 -5.7Wine equalisation tax 790 780 -10 -1.3Luxury car tax 510 450 -60 -11.8
Total sales taxes 54,860 51,716 -3,144 -5.7Excise duty
Petrol 5,800 5,900 100 1.7Diesel 8,480 8,700 220 2.6Beer 2,200 2,035 -165 -7.5Tobacco 6,250 5,850 -400 -6.4Other excisable products 5,150 4,400 -750 -14.6
of which: Other excisable beverages(b) 1,000 940 -60 -6.0Total excise duty revenue 27,880 26,885 -995 -3.6Customs duty
Textiles, clothing and footwear 700 730 30 4.3Passenger motor vehicles 700 940 240 34.3Excise-like goods 4,250 4,370 120 2.8Other imports 1,710 1,510 -200 -11.7
less: Refunds and drawbacks 120 180 60 50.0Total customs duty revenue 7,240 7,370 130 1.8
Carbon pricing mechanism 7,690 7,690 0 0.0Other indirect taxation
Agricultural levies 432 440 8 1.8Other taxes 2,687 2,883 196 7.3
Total other indirect taxation revenue 3,119 3,323 204 6.5Indirect taxation revenue 100,789 96,984 -3,805 -3.8
Taxation revenue 361,679 354,626 -7,053 -2.0
Sales of goods and services 8,295 8,264 -30 -0.4Interest 5,417 5,113 -305 -5.6Dividends 1,786 2,485 699 39.2Other non-taxation revenue 5,587 5,583 -5 -0.1Non-taxation revenue(c) 21,085 21,445 360 1.7
Total revenue(c) 382,764 376,071 -6,693 -1.7Memorandum:
Capital gains tax 11,000 10,200 -800 -7.3Medicare levy revenue 9,620 9,640 20 0.2
(a) Resource rent taxes in 2012-13 includes PRRT and gross revenue from the MRRT. (b) Other excisable beverages are those not exceeding 10 per cent by volume of alcohol (excluding beer, brandy and
wine). (c) Includes expected Future Fund earnings.

5-35
Statement 5: Revenue
AP
PE
ND
IX C
: RE
CE
IPT
S A
ND
RE
VE
NU
E H
IST
OR
Y A
ND
FO
RE
CA
ST
S
Tab
le C
1: A
ust
ralia
n G
ove
rnm
ent
(cas
h)
rece
ipts
2003
-04
200
4-05
2005
-06
2006
-07
2007
-08
2008
-09
2009
-10
2010
-11
2011
-12
2012
-13
2013
-14
2014
-15
201
5-16
(est
)(e
st)
(est
)(p
roj)
(pro
j)$
m$m
$m$m
$m$m
$m$m
$m$m
$m$
m$m
Ind
ivid
uals
' and
oth
er w
ithh
oldi
ng t
axes
Gro
ss in
com
e ta
x w
ithho
ldin
g89
,638
97,
304
103,
120
107,
119
113,
982
115,
899
118,
532
129,
654
142,
200
150,
600
163
,900
174,
700
185
,400
Gro
ss o
ther
indi
vidu
als
19,9
352
2,55
424
,895
25,7
972
9,52
530
,030
25,9
282
7,79
531
,30
035
,500
37,
900
41,5
00
44,9
00le
ss:
Re
fund
s12
,325
13,
734
15,2
4417
,145
19,
601
23,5
6924
,390
24,
711
25,6
00
26,2
402
6,43
028
,58
030
,500
Tot
al in
divi
dual
s' a
nd o
the
r w
ithho
ldin
g97
,247
106
,123
112,
770
115,
770
123,
906
122,
361
120,
070
132,
739
147,
900
159,
860
175
,370
187,
620
199
,800
Frin
ge b
ene
fits
tax
3,5
903,
703
4,04
93,
761
3,85
63,
399
3,5
043,
303
3,48
03,
830
4,31
04,
680
4,8
80C
ompa
ny t
ax36
,101
40,
404
48,9
6057
,100
61,
700
60,3
9152
,209
56,
262
67,4
60
73,4
807
6,37
080
,32
084
,270
Sup
eran
nuat
ion
fund
s5,
551
6,24
86,
368
8,2
111
2,05
49,
217
6,0
996,
519
7,23
08,
050
9,01
010
,80
512
,715
Res
ourc
e re
nt t
axe
s(a)
1,1
681,
459
1,91
71,
510
1,68
62,
184
1,2
5180
61,
510
7,16
08,
190
7,38
08
,200
Inco
me
taxa
tion
rece
ipts
143,
658
157
,937
174,
063
186,
353
203,
202
197,
552
183,
132
199,
628
227,
580
252,
380
273
,250
290,
805
309
,865
Sal
es t
axes
Goo
ds a
nd s
ervi
ces
tax
33,0
693
5,18
437
,342
39,6
144
2,42
441
,335
43,9
674
6,08
345
,72
948
,341
51,
049
53,6
60
56,2
47W
ine
equ
alis
atio
n ta
x7
0468
265
66
5066
569
37
3372
272
077
082
087
092
0L
uxur
y ca
r ta
x3
3529
832
23
6445
239
34
7248
344
045
046
048
051
0O
ther
sa
les
taxe
s(b)
-48
-10
-16
-60
-10
00
00
00
Tot
al s
ales
tax
es34
,060
36,
154
38,3
0440
,621
43,
541
42,4
2045
,173
47,
288
46,8
89
49,5
615
2,32
955
,01
057
,677
Exc
ise
duty
Fue
l exc
ise
13,5
401
4,27
613
,992
14,6
631
5,25
215
,637
15,6
751
6,26
716
,83
017
,790
18,
480
18,6
60
19,2
70O
ther
exc
ise
7,5
397,
612
7,82
28,
086
8,47
48,
736
8,7
649,
490
8,95
09,
095
8,70
38,
865
9,2
03T
otal
exc
ise
duty
21,0
792
1,88
821
,814
22,7
492
3,72
724
,373
24,4
392
5,75
625
,78
026
,885
27,
183
27,5
25
28,4
73C
usto
ms
dut
y5,
038
5,01
24,
488
5,0
635,
561
5,81
45,
341
5,42
96,
910
7,34
08,
540
8,66
59
,085
Car
bon
pric
ing
me
chan
ism
4,02
06,
610
7,31
06
,720
Oth
er in
dire
ct t
axa
tion
Agr
icul
tura
l lev
ies
603
584
610
608
611
620
395
445
437
440
436
443
449
Oth
er t
axes
1,6
551,
740
1,93
61,
999
1,73
41,
848
2,4
942,
292
2,05
72,
480
3,06
03,
094
3,1
90T
otal
oth
er in
dire
ctta
xatio
n re
ceip
ts2,
258
2,32
42,
546
2,6
072,
345
2,46
82,
888
2,73
82,
494
2,92
03,
496
3,53
73
,639
Ind
irect
tax
atio
n re
ceip
ts62
,435
65,
377
67,1
5271
,039
75,
174
75,0
7577
,841
81,
211
82,0
73
90,7
279
8,15
910
2,04
710
5,5
94
Tax
atio
n re
ceip
ts20
6,0
9222
3,3
1424
1,21
525
7,3
9227
8,37
627
2,62
726
0,9
7328
0,83
930
9,65
334
3,10
73
71,4
0939
2,85
241
5,4
59

5-36
Statement 5: Revenue
Tab
le C
1: A
ust
ralia
n G
ove
rnm
ent
(cas
h)
rece
ipts
(co
nti
nu
ed)
20
03-0
420
04-
0520
05-0
620
06-0
720
07-0
820
08-0
920
09-1
020
10-1
120
11-1
220
12-1
320
13-1
420
14-1
520
15-
16(e
st)
(est
)(e
st)
(pro
j)(p
roj)
$m
$m$m
$m$m
$m$m
$m$m
$m$m
$m
$m
Inte
rest
rec
eive
d1,
056
1,40
02,
325
3,7
314,
769
5,16
64,
025
4,94
34,
343
4,66
04,
679
4,52
54
,822
Div
iden
ds a
nd o
the
r10
,627
11,
271
12,4
0311
,514
11,
772
14,8
0619
,665
16,
242
15,9
80
21,0
071
6,45
516
,24
118
,092
Non
-tax
atio
n re
ceip
ts11
,683
12,
670
14,7
2815
,245
16,
540
19,9
7323
,689
21,
185
20,3
23
25,6
672
1,13
520
,76
622
,914
Tot
al r
ecei
pts
217,
776
235
,985
255,
943
272,
637
294,
917
292,
600
284,
662
302,
024
329,
976
368,
774
392
,544
413,
618
438
,373
(a
) R
esou
rce
rent
tax
es i
nclu
de P
RR
T a
nd g
ross
rec
eipt
s fr
om t
he M
RR
T.
Net
rec
eipt
s fr
om t
he M
RR
T a
re e
xpec
ted
to b
e $3
.0 b
illio
n in
201
2-13
, $3
.5 b
illio
n in
201
3-14
, $3
.2 b
illio
n in
20
14-1
5 an
d $3
.7 b
illio
n in
201
5-16
, w
hich
rep
rese
nt t
he n
et im
pact
on
rece
ipts
acr
oss
seve
ral d
iffer
ent
head
s of
rev
enue
. T
hese
incl
ude
the
offs
ettin
g re
duct
ions
in c
ompa
ny t
ax (
thro
ugh
dedu
ctib
ility
) an
d in
tera
ctio
ns w
ith o
ther
tax
es.
(b)
‘Oth
er s
ales
taxe
s’ in
clud
es W
hole
sale
Sal
es T
ax.

5-37
Statement 5: Revenue
Tab
le C
2: M
ajo
r ca
teg
ori
es o
f (c
ash
) re
ceip
ts a
s a
pro
po
rtio
n o
f G
DP
(a)
Gro
ssG
ross
Ref
unds
Tot
al
FB
TS
uper
Com
pani
esR
RT
(c)
Tot
al
Sal
esE
xcis
e &
CP
M(e
)O
ther
Tot
alT
otal
Tot
alT
otal
ITW
othe
rin
d. &
fund
sin
com
eta
xes(
d)C
usto
ms
tax
indi
rect
tax
non-
tax
rece
ipts
ind.
(b)
w'h
oldi
ngta
xdu
tyta
xre
ceip
tsre
ceip
ts%
%%
%%
%%
%%
%%
%%
%%
%%
1977
-78
10.2
2.4
0.9
11.7
0.0
0.0
3.0
0.0
14.6
1.7
3.7
-0.
45.
820
.42.
522
.919
78-7
99.
72.
00.
910
.90.
00.
02.
60.
013
.51.
54.
4-
0.4
6.3
19.7
2.3
22.0
1979
-80
10.0
2.1
0.8
11.3
0.0
0.0
2.5
0.0
13.8
1.4
4.8
-0.
46.
620
.42.
122
.519
80-8
110
.12.
20.
811
.60.
00.
03.
10.
014
.71.
45.
0-
0.3
6.7
21.4
2.2
23.6
1981
-82
10.8
2.2
0.8
12.2
0.0
0.0
2.9
0.0
15.1
1.6
4.6
-0.
36.
521
.62.
123
.619
82-8
311
.12.
21.
012
.30.
00.
02.
60.
014
.81.
84.
7-
0.3
6.9
21.7
2.3
24.0
1983
-84
10.7
2.1
1.1
11.7
0.0
0.0
2.1
0.0
13.8
1.9
4.8
-0.
47.
121
.02.
423
.419
84-8
511
.22.
30.
912
.60.
00.
02.
40.
015
.02.
15.
0-
0.5
7.5
22.5
2.5
25.0
1985
-86
11.5
2.6
1.3
12.8
0.0
0.0
2.3
0.0
15.1
2.2
4.9
-0.
47.
522
.62.
825
.419
86-8
711
.83.
01.
313
.60.
20.
02.
40.
016
.12.
24.
6-
0.4
7.2
23.3
2.9
26.2
1987
-88
11.4
3.0
1.3
13.1
0.3
0.0
2.7
0.0
16.1
2.3
4.3
-0.
47.
023
.12.
625
.719
88-8
911
.82.
71.
413
.10.
30.
02.
80.
016
.22.
63.
5-
0.4
6.5
22.7
2.0
24.7
1989
-90
11.5
2.6
1.5
12.6
0.3
0.1
3.2
0.0
16.2
2.5
3.4
-0.
36.
222
.41.
924
.419
90-9
111
.22.
71.
612
.30.
30.
33.
40.
116
.32.
33.
3-
0.4
6.0
22.3
1.8
24.1
1991
-92
10.9
2.2
1.8
11.2
0.3
0.3
3.2
0.2
15.2
2.2
3.0
-0.
35.
420
.62.
022
.619
92-9
310
.81.
91.
810
.90.
30.
32.
90.
314
.82.
12.
9-
0.2
5.2
20.0
2.0
22.0
1993
-94
10.7
1.9
1.5
11.0
0.3
0.3
2.7
0.2
14.5
2.2
3.0
-0.
25.
520
.02.
222
.219
94-9
510
.91.
91.
611
.20.
60.
43.
10.
215
.42.
33.
1-
0.2
5.7
21.1
1.7
22.9
1995
-96
11.3
1.9
1.6
11.7
0.6
0.3
3.4
0.1
16.1
2.4
3.0
-0.
25.
721
.81.
623
.519
96-9
711
.62.
11.
612
.10.
60.
53.
40.
216
.82.
43.
0-
0.2
5.5
22.4
1.6
24.0
1997
-98
11.8
2.1
1.6
12.2
0.5
0.5
3.3
0.2
16.7
2.4
2.9
-0.
25.
522
.21.
723
.9
Inco
me
tax
Indi
rect
tax
atio
n re
ceip
ts

5-38
Statement 5: Revenue
Tab
le C
2: M
ajo
r ca
teg
ori
es o
f (c
ash
) re
ceip
ts a
s a
pro
po
rtio
n o
f G
DP
(co
nti
nu
ed)(a
)
Gro
ssG
ross
Ref
unds
To
tal
FB
TS
uper
Com
pani
esR
RT
(c)
To
tal
Sal
esE
xcis
e &
CP
M(e
)O
ther
Tot
alT
otal
Tot
alT
ota
lIT
Wo
ther
ind.
&fu
nds
inco
me
taxe
s(d)
Cus
tom
sta
xin
dire
ctta
xn
on-t
axre
ceip
tsin
d.(
b)w
'hol
ding
tax
dut
yta
xre
ceip
tsre
ceip
ts%
%%
%%
%%
%%
%%
%%
%%
%%
199
8-99
12.
12.
11.
712
.50
.50
.63.
30
.11
7.1
2.4
2.8
-0.
05.
22
2.3
2.2
24.5
199
9-00
12.
22.
01.
712
.60
.60
.63.
70
.21
7.6
2.3
2.7
-0.
25.
22
2.9
2.2
25.1
200
0-01
10.
61.
91.
610
.90
.50
.74.
50
.31
6.9
3.6
3.3
-0.
27.
22
4.1
1.8
25.9
200
1-02
10.
52.
21.
411
.20
.50
.63.
60
.21
6.1
3.6
3.2
-0.
37.
12
3.2
1.7
24.8
200
2-03
10.
52.
21.
511
.20
.40
.64.
10
.21
6.6
3.9
3.2
-0.
37.
42
4.0
1.6
25.5
200
3-04
10.
42.
31.
411
.30
.40
.64.
20
.11
6.7
4.0
3.0
-0.
37.
32
4.0
1.4
25.3
200
4-05
10.
62.
41.
511
.50
.40
.74.
40
.21
7.2
3.9
2.9
-0.
37.
12
4.2
1.4
25.6
200
5-06
10.
42.
51.
511
.30
.40
.64.
90
.21
7.5
3.9
2.6
-0.
36.
82
4.2
1.5
25.7
200
6-07
9.9
2.4
1.6
10.7
0.3
0.8
5.3
0.1
17.
23.
82
.6-
0.2
6.6
23.
81.
425
.220
07-
08
9.7
2.5
1.7
10.5
0.3
1.0
5.2
0.1
17.
33.
72
.5-
0.2
6.4
23.
71.
425
.120
08-
09
9.3
2.4
1.9
9.8
0.3
0.7
4.8
0.2
15.
83.
42
.4-
0.2
6.0
21.
81.
623
.420
09-
10
9.2
2.0
1.9
9.3
0.3
0.5
4.0
0.1
14.
23.
52
.3-
0.2
6.0
20.
21.
822
.020
10-
11
9.3
2.0
1.8
9.5
0.2
0.5
4.0
0.1
14.
33.
42
.2-
0.2
5.8
20.
11.
521
.620
11-
12 e
st9.
62.
11.
710
.00
.20
.54.
60
.11
5.4
3.2
2.2
-0.
25.
62
1.0
1.4
22.3
201
2-13
est
9.7
2.3
1.7
10.3
0.2
0.5
4.7
0.5
16.
33.
22
.20.
30.
25.
82
2.1
1.7
23.8
201
3-14
est
10.
02.
31.
610
.70
.30
.64.
70
.51
6.7
3.2
2.2
0.4
0.2
6.0
22.
71.
324
.020
14-
15 p
roj
10.
12.
41.
710
.90
.30
.64.
70
.41
6.9
3.2
2.1
0.4
0.2
5.9
22.
81.
224
.020
15-
16 p
roj
10.
22.
51.
711
.00
.30
.74.
60
.51
7.1
3.2
2.1
0.4
0.2
5.8
22.
91.
324
.2
Inco
me
tax
Indi
rect
tax
atio
n re
ceip
ts
(a
) F
igur
es u
p to
and
inc
ludi
ng19
98-9
9 ar
e ba
sed
on t
he o
ld C
omm
onw
ealth
Bud
get
Sec
tor
cash
acc
ount
ing
fram
ewor
k. F
igur
es f
rom
199
9-20
00 a
re o
n an
Aus
tral
ian
Gov
ernm
ent
gene
ral
gove
rnm
ent
GF
S b
asis
. (b
) G
ross
oth
er in
divi
dua
ls in
clud
e am
ount
s pr
evio
usly
col
lect
ed u
nder
the
Pre
scrib
ed P
aym
ents
Sys
tem
and
Rep
orta
ble
Pay
men
ts S
yste
m b
etw
een
1983
-84
and
1999
-200
0.
(c)
Res
ourc
e re
nt t
axes
inc
lude
PR
RT
and
gro
ss r
ecei
pts
from
the
MR
RT
. N
et r
ecei
pts
from
the
MR
RT
are
exp
ecte
d to
be
$3.0
bill
ion
in 2
012-
13,
$3.5
bill
ion
in 2
013-
14,
$3.2
bill
ion
in
2014
-15
and
$3.7
bill
ion
in 2
015-
16,
whi
ch r
epre
sent
the
net
impa
ct o
n re
ceip
ts a
cros
s se
vera
l diff
eren
t he
ads
of r
even
ue.
The
se in
clud
e th
e of
fset
ting
redu
ctio
ns in
com
pany
tax
(th
roug
h de
duct
ibili
ty)
and
inte
ract
ions
with
oth
er t
axes
. (d
) ‘S
ales
tax
es’ i
nclu
de w
hole
sale
sal
es t
ax w
hich
was
abo
lishe
d in
200
0-01
. (e
) C
arbo
n pr
icin
g m
echa
nism
.

5-39
Statement 5: Revenue
Tab
le C
3: A
ust
ralia
n G
ove
rnm
ent
(acc
rual
) re
ven
ue
2003
-04
2004
-05
2005
-06
2006
-07
2007
-08
2008
-09
2009
-10
2010
-11
2011
-12
2012
-13
2013
-14
2014
-15
2015
-16
(est
)(e
st)
(est
)(p
roj)
(pro
j)$m
$m$m
$m$m
$m$m
$m$m
$m$m
$m$m
Indi
vidu
als'
and
oth
er w
ithho
ldin
g ta
xes
Gro
ss in
com
e ta
x w
ithho
ldin
g90
,095
98,2
5010
3,81
110
7,80
911
4,70
011
7,08
611
9,92
213
0,79
014
3,22
015
1,62
016
4,98
017
5,86
018
6,65
0G
ross
oth
er in
divi
dual
s21
,010
24,0
0325
,859
26,9
5231
,036
32,2
6027
,287
30,6
4233
,610
37,6
7040
,250
44,1
5047
,740
less
: R
efun
ds12
,325
13,7
3415
,239
17,1
4719
,601
23,5
6924
,390
24,6
6025
,600
26,2
4026
,430
28,5
8030
,500
Tot
al in
divi
dual
s' a
nd o
ther
with
hold
ing
98,7
7910
8,51
911
4,43
111
7,61
412
6,13
512
5,77
712
2,82
013
6,77
215
1,23
016
3,05
017
8,80
019
1,43
020
3,89
0F
ringe
ben
efits
tax
3,64
23,
476
4,08
43,
754
3,79
63,
581
3,52
33,
348
3,54
03,
900
4,39
04,
760
4,96
0C
ompa
ny t
ax36
,337
43,1
0648
,987
58,5
3864
,790
60,7
0553
,193
57,3
1267
,950
75,0
3277
,901
81,9
0285
,932
Sup
eran
nuat
ion
fund
s5,
785
6,41
06,
705
7,87
911
,988
9,22
76,
182
6,69
37,
390
8,25
09,
220
11,0
3512
,995
Res
ourc
e re
nt t
axes
(a)
1,16
51,
465
1,99
11,
594
1,87
12,
099
1,29
780
61,
840
7,41
08,
350
7,40
08,
240
Inco
me
taxa
tion
reve
nue
145,
709
162,
974
176,
198
189,
378
208,
579
201,
389
187,
016
204,
931
231,
950
257,
642
278,
661
296,
527
316,
017
Sal
es t
axes
Goo
ds a
nd s
ervi
ces
tax
34,1
2135
,975
39,1
1841
,208
44,3
8142
,626
46,5
5348
,093
47,7
9050
,486
53,2
3456
,056
58,7
30W
ine
equa
lisat
ion
tax
705
693
657
651
661
707
748
747
730
780
830
880
930
Luxu
ry c
ar t
ax33
630
233
136
546
438
449
948
944
045
046
048
051
0O
ther
sal
es t
axes
(b)
-38
-13
-19
60-1
9-1
00
00
00
0T
otal
sal
es t
axes
35,1
2236
,957
40,0
8642
,284
45,4
8643
,716
47,8
0049
,329
48,9
6051
,716
54,5
2457
,416
60,1
70E
xcis
e du
tyF
uel e
xcis
e13
,529
14,3
5014
,073
14,6
5315
,085
15,5
9215
,766
16,3
0516
,910
17,7
9017
,960
18,7
9019
,410
Oth
er e
xcis
e7,
539
7,63
17,
854
8,08
28,
441
8,72
78,
781
9,49
78,
950
9,09
58,
703
8,86
59,
203
Tot
al e
xcis
e du
ty21
,068
21,9
8121
,927
22,7
3423
,526
24,3
1924
,547
25,8
0325
,860
26,8
8526
,663
27,6
5528
,613
Cus
tom
s du
ty5,
622
5,54
84,
988
5,64
46,
070
6,27
65,
748
5,82
86,
940
7,37
08,
570
8,69
59,
115
Car
bon
pric
ing
mec
hani
sm7,
690
8,68
59,
275
9,40
0
Oth
er in
dire
ct t
axat
ion
Agr
icul
tura
l lev
ies
603
584
610
608
611
620
395
445
437
440
436
443
449
Oth
er t
axes
1,83
51,
899
1,90
81,
862
1,95
72,
334
2,49
42,
669
2,30
72,
883
3,18
83,
267
3,39
6T
otal
oth
er in
dire
ct t
axat
ion
reve
nue
2,43
82,
483
2,51
82,
470
2,56
72,
954
2,88
93,
115
2,74
43,
323
3,62
53,
711
3,84
5In
dire
ct t
axat
ion
reve
nue
64,2
5066
,969
69,5
1873
,132
77,6
5077
,264
80,9
8484
,074
84,5
0496
,984
102,
067
106,
752
111,
143
Tax
atio
n re
venu
e20
9,95
922
9,94
324
5,71
626
2,51
028
6,22
927
8,65
326
8,00
028
9,00
531
6,45
435
4,62
638
0,72
740
3,27
842
7,16
0

5-40
Statement 5: Revenue
Tab
le C
3: A
ust
ralia
n G
ove
rnm
ent
(acc
rual
) re
ven
ue
(co
nti
nu
ed)
200
3-04
200
4-05
2005
-06
2006
-07
2007
-08
200
8-09
200
9-10
2010
-11
2011
-12
2012
-13
201
3-14
201
4-15
2015
-16
(est
)(e
st)
(est
)(p
roj)
(pro
j)$m
$m$m
$m$
m$m
$m$m
$m$
m$m
$m$m
Inte
rest
rec
eive
d1
,304
1,62
12,
437
3,92
15,
558
5,1
244,
430
5,1
694,
703
5,11
35
,209
5,18
75,
493
Div
iden
ds a
nd o
ther
10,9
0510
,943
13,0
851
1,97
911
,94
215
,155
20,3
3715
,716
15,
262
16,3
32
16,2
6216
,365
16,9
07N
on-t
axat
ion
reve
nue
12,2
0912
,564
15,5
221
5,90
017
,50
020
,280
24,7
6720
,885
19,
964
21,4
45
21,4
7021
,552
22,4
00
Tot
al r
even
ue22
2,1
682
42,5
0726
1,2
3827
8,41
030
3,72
929
8,9
332
92,7
6730
9,8
9033
6,41
837
6,07
140
2,1
974
24,8
3044
9,5
59
(a)
Res
ourc
e re
nt ta
xes
incl
ude
PR
RT
an
d gr
oss
reve
nue
from
the
MR
RT
. N
et r
even
ue f
rom
the
MR
RT
is e
xpec
ted
to b
e $3
.0 b
illio
n in
201
2-13
, $3
.5 b
illio
n in
201
3-14
, $3
.2 b
illio
n in
201
4-15
an
d $3
.7 b
illio
n in
201
5-16
, w
hich
rep
rese
nt t
he n
et i
mpa
ct o
n re
venu
e ac
ross
sev
eral
diff
eren
t he
ads
of r
eve
nue.
The
se i
nclu
de t
he o
ffset
ting
redu
ctio
ns i
n co
mpa
ny t
ax (
thro
ugh
dedu
ctib
ility
) an
d in
tera
ctio
ns w
ith o
ther
tax
es.
(b)
‘Oth
er s
ales
taxe
s’ in
clud
es W
hole
sale
Sal
es T
ax.

5-41
Statement 5: Revenue
Tab
le C
4: M
ajo
r ca
teg
ori
es o
f (a
ccru
al)
reve
nu
e as
a p
rop
ort
ion
of
GD
P
Gro
ssG
ross
Re
fund
sT
otal
F
BT
Sup
erC
ompa
nies
RR
T(a
)T
ota
l S
ales
Exc
ise
&C
PM
(c)
Oth
erT
otal
To
tal
Tot
alT
otal
ITW
oth
erin
d. &
fund
sin
com
eta
xes(
b)C
usto
ms
tax
indi
rect
tax
non
-tax
reve
nue
ind.
w'h
oldi
ngta
xdu
tyta
xre
ven
uere
venu
e%
%%
%%
%%
%%
%%
%%
%%
%%
199
9-00
12.
32.
11.
612
.80
.60
.63.
70.
21
7.9
2.4
2.7
-0.
25.
32
3.2
2.1
25.3
200
0-01
10.
71.
91.
611
.00
.50
.75.
00.
31
7.6
3.7
3.3
-0.
37.
32
4.9
1.4
26.3
200
1-02
10.
62.
31.
411
.40
.50
.63.
60.
21
6.3
3.7
3.3
-0.
37.
32
3.6
1.6
25.2
200
2-03
10.
62.
31.
511
.40
.40
.64.
20.
21
6.8
4.0
3.3
-0.
37.
62
4.4
1.5
25.8
200
3-04
10.
52.
41.
411
.50
.40
.74.
20.
11
7.0
4.1
3.1
-0.
37.
52
4.4
1.4
25.8
200
4-05
10.
72.
61.
511
.80
.40
.74.
70.
21
7.7
4.0
3.0
-0.
37.
32
5.0
1.4
26.3
200
5-06
10.
42.
61.
511
.50
.40
.74.
90.
21
7.7
4.0
2.7
-0.
37.
02
4.7
1.6
26.3
200
6-07
10.
02.
51.
610
.90
.30
.75.
40.
11
7.5
3.9
2.6
-0.
26.
82
4.2
1.5
25.7
200
7-08
9.
82.
61.
710
.70
.31
.05.
50.
21
7.7
3.9
2.5
-0.
26.
62
4.3
1.5
25.8
200
8-09
9.
42.
61.
910
.00
.30
.74.
80.
21
6.1
3.5
2.4
-0.
26.
22
2.3
1.6
23.9
200
9-10
9.
32.
11.
99
.50
.30
.54.
10.
11
4.5
3.7
2.3
-0.
26.
32
0.7
1.9
22.6
201
0-11
9.
32.
21.
89
.80
.20
.54.
10.
11
4.6
3.5
2.3
-0.
26.
02
0.6
1.5
22.1
201
1-12
est
9.7
2.3
1.7
10.2
0.2
0.5
4.6
0.1
15.
73.
32
.2-
0.2
5.7
21.
41.
422
.820
12-
13 e
st9.
82.
41.
710
.50
.30
.54.
80.
51
6.6
3.3
2.2
0.5
0.2
6.3
22.
91.
424
.220
13-
14 e
st1
0.1
2.5
1.6
10.9
0.3
0.6
4.8
0.5
17.
13.
32
.20.
50.
26.
22
3.3
1.3
24.6
201
4-15
pro
j1
0.2
2.6
1.7
11.1
0.3
0.6
4.8
0.4
17.
23.
32
.10.
50.
26.
22
3.4
1.3
24.7
201
5-16
pro
j1
0.3
2.6
1.7
11.2
0.3
0.7
4.7
0.5
17.
43.
32
.10.
50.
26.
12
3.5
1.2
24.8
Inco
me
tax
Indi
rect
tax
atio
n re
venu
e
(a
) R
esou
rce
rent
taxe
s in
clud
e P
RR
T a
nd
gros
s re
venu
e fr
om th
e M
RR
T.
Net
rev
enue
fro
m t
he M
RR
T is
exp
ecte
d to
be
$3.0
bill
ion
in 2
012-
13,
$3.5
bill
ion
in 2
013-
14,
$3.2
bill
ion
in 2
014-
15
and
$3.7
bill
ion
in 2
015-
16,
whi
ch r
epre
sent
the
net
im
pact
on
reve
nue
acro
ss s
ever
al d
iffer
ent
head
s of
rev
enu
e. T
hese
inc
lude
the
offs
ettin
g re
duct
ions
in
com
pany
tax
(th
roug
h de
duct
ibili
ty)
and
inte
ract
ions
with
oth
er t
axes
. (b
) ‘S
ales
tax
es’ i
nclu
des
Who
lesa
le S
ales
Tax
prio
r to
200
0-01
, w
hen
it w
as a
bolis
hed
as p
art
of th
e ch
ange
s un
der
A N
ew T
ax
Sys
tem
. (c
) C
arbo
n pr
icin
g m
echa
nism
.
Statement 5: Revenue
5-42
APPENDIX D: FORECAST METHODOLOGY AND PERFORMANCE
The Government’s receipts estimates are prepared using a ‘base plus growth’ methodology. The last known outcome (2010-11 for the 2012-13 Budget) is used as the base to which estimated growth rates are applied, resulting in receipts estimates for the current and future years. The growth rates are determined from forecasts for a large range of economic data, many of which are described in Statement 2.
The smaller and relatively simple heads of revenue, such as luxury car tax and many of the excises are forecast by mapping the growth rate of an appropriate economic parameter directly to the tax growth rate in the relevant head of revenue. Most of the large and complex heads of revenue, such as personal and company income taxes are forecast by mapping appropriate economic parameter growth rates to the various income, expense and deduction items on the relevant tax returns. An estimate of total tax payable is then calculated by applying the statutory rates to the estimated income base. Timing models based on past payment behaviour assist in determining whether this tax will be paid in the year the income is earned, such as for pay as you go withholding tax, or in future years, such as for individuals’ refunds.
Other information affecting receipts forecasts includes known tax collections for the current year, new policy, and calendar date timing (for example, more pay as you go withholding tax is paid on a Thursday than any other day of the week, so years with 53 Thursdays will result in more receipts than years with 52 Thursdays).
The Government’s receipts forecasts, like all forecasts, are subject to a margin of error. The discernible trend between 2002-03 and 2007-08 was for receipts forecasts to under-predict outcomes (Chart D1). For example, the 2007-08 Budget forecast taxation receipts to grow by 5.0 per cent in 2007-08, compared to the outcome of 8.1 per cent, a forecast error of 3.1 percentage points. Since 2008-09, the outcome for receipts has been lower than the Budget forecast, broadly reflecting the impacts of the global financial crisis.
The receipts forecasting error may be split into three underlying sources: errors in economic forecasts that underpin the receipts forecasts; errors in translating the economy to receipts forecasts; and miscellaneous factors such as post-Budget policy decisions, court decisions regarding tax law interpretation, changes in compliance activities of the ATO, and revisions to historical economic data. Note that there may also be secondary errors relating to the timing of payments of tax — even if the forecasts were accurate, revenue may be recorded in the fiscal year before or after it was expected.

Statement 5: Revenue
5-43
Chart D1: Budget forecast error on taxation receipts growth
-8
-6
-4
-2
0
2
4
6
-8
-6
-4
-2
0
2
4
6
2002-03 2003-04 2004-05 2005-06 2006-07 2007-08 2008-09 2009-10 2010-11 2011-12
Percentage pointsPercentage points
Source: Treasury estimates.
Chart D2 shows the relationship between forecast errors of the economy and tax receipts (excluding capital gains tax) over recent years, including the current estimates for 2011-12. The dotted lines depict a receipts forecasting error of plus or minus 0.5 per cent if there is zero error on the economic forecasts.
Nominal non-farm GDP was chosen as a broad indicator of the economic forecasts. The relationship in Chart D2 is only approximate as some sources of error are independent of economic conditions and the forecasts for tax receipts rely on forecasts of a range of economic variables, not just nominal non-farm GDP.
On average, economic forecasting errors will be magnified in receipts forecasting errors, due to the progressive nature of personal income tax. The lower and upper lines are based on aggregate elasticities (of receipts with respect to nominal non-farm GDP) of 1.0 and 1.5 respectively, which are consistent with theoretical models of the tax system.
Broadly, points outside this range may represent forecasts of tax receipts growth that were either too high or too low given the economic growth forecasts. The points may also fall outside the range due to the timing of tax payments, where economic activity in one year affects tax paid in the following year. In addition, the points outside of the range in the lower left quadrant have been impacted by a larger elasticity between the economy and tax during a downturn, due to the function of automatic stabilisers in the tax system.
For example, in 2002-03, nominal non-farm GDP growth turned out to be around 1 percentage point higher than forecast, but growth in tax receipts (excluding CGT) were almost 4 percentage points higher than forecast. That is, the error in the revenue forecast was higher than the around 2 percentage points that the rule of thumb

Statement 5: Revenue
5-44
suggests should be theoretically associated with an economic forecasting error of that magnitude.
Chart D2: Budget forecast errors on nominal non-farm GDP growth and taxation receipts growth (excl. CGT)
2002-032003-04
2004-05
2005-062006-07
2007-08
2008-09
2009-10
2010-11
2011-12
-8
-6
-4
-2
0
2
4
6
8
-8
-6
-4
-2
0
2
4
6
8
-4 -3 -2 -1 0 1 2 3 4 5
Fore
cas
t e
rror
on
taxa
tio
n g
row
th
Forecast error on nominal non-farm GDP growth
Percentage points Percentage points
Source: Treasury estimates.
From 2008-09, errors in tax receipts have been significantly affected by the economic downturn related to the global financial crisis, particularly with regards to capital gains tax (Chart D3).
Chart D3. Forecast error on capital gains tax (contribution to tax receipts growth)
-2.0
-1.5
-1.0
-0.5
0.0
0.5
1.0
1.5
2.0
-2.0
-1.5
-1.0
-0.5
0.0
0.5
1.0
1.5
2.0
2002-03 2005-06 2008-09 2011-12
Percentage pointsPercentage points
Source: Treasury estimates.
Statement 5: Revenue
5-45
Modest over-forecasts of nominal GDP in 2010-11 and 2011-12 translated into larger over-forecasts of tax receipts. Several factors have contributed to the forecasting errors in both 2010-11 and 2011-12, such as the ongoing weakness in the global economy, the continued strength in the Australian dollar and associated uneven domestic conditions.
The larger than expected utilisation of losses generated in 2008-09 have also contributed to recent forecasting errors.
Discussions of earlier years can be found in previous budgets.

Statement 5: Revenue
5-46
APPENDIX E: TAXATION RECEIPTS AND REVENUE
RECOGNITION
There are different methods of accounting for taxation receipts. Each method of receipts recognition results in estimates and outcomes that may be significantly different from those produced using other methods.
Accrual accounting was introduced by the Australian Government for the 1999-2000 Budget. Before then, all estimates and outcomes were reported only on a cash basis. Cash recognition still plays a role in budgeting and outcomes reporting, with both accrual and cash taxation estimates and outcomes reported in the Budget Papers. Furthermore, there are also different methods for recognising accrual receipts.
This appendix provides an explanation of the different receipts recognition methods that apply to the various taxation receipts heads.
Receipts recognition methods
Cash recognition
Under cash recognition, which is also referred to as receipts recognition, taxation receipts are accounted for at the time a taxation payment is received by the relevant authority. The receipt may be a different amount from the taxation liability and result in a subsequent amended (refund or debit) assessment. The receipt may also be received in a period different from that to which the taxation liability relates.
Cash recognition is an integral part of budget reporting as a cash flow statement must be prepared under the accrual accounting frameworks on which the budget must be based. It also provides additional information about the structure of taxation. Cash data are available over a much longer period and are therefore often used for time series analysis — accrual data are only available since 1999-2000.
Accrual receipts recognition
The Australian Accounting Standards (AAS) and Government Finance Statistics (GFS) standards for accrual accounting require that taxation receipts be recognised in the reporting period in which the underlying economic transaction occurs, such as when the taxpayer earns the income that is subsequently subject to taxation. This is referred to as the economic transactions method (ETM). However, the standards permit reporting using an alternative approach when there is an inability to reliably measure taxation receipts using ETM.
Currently, ETM has been determined not to be a reliable measure for several significant receipts heads — individuals and other withholding taxation, company income taxation and superannuation taxation. These receipts heads, which collectively

Statement 5: Revenue
5-47
account for the majority of total receipts, are recognised using the taxation liability method (TLM) rather than ETM.
Under TLM, taxation receipts are accounted for at the time a taxpayer makes a payment or self-assessment or when an assessment of a taxation liability is raised by the relevant authority (for example, the Australian Taxation Office). This method retains some elements of cash receipts recognition — for example, receipts are recognised when cash payment occurs if it is prior to an assessment being raised.
The point of receipts recognition under ETM and TLM can sometimes be in different periods — for example, a taxation return for the 2007-08 income year lodged in October 2008, and which results in a new taxation liability or a refund, would be recognised in the 2007-08 financial year under ETM and in the 2008-09 financial year under TLM. In this case, ETM requires that outcomes for 2007-08 include an estimation of liabilities or receipts relating to activities in 2007-08 that are likely to be identified in subsequent periods. TLM outcomes do not incorporate this estimation, as only currently identified taxation liabilities are reported. Consequently, aggregate TLM receipts outcomes are usually known with relative certainty, although there can be estimation issues involved in allocating aggregate amounts between different heads of receipts.
History of accrual receipts recognition
From 1999-2000 to 2005-06, all accrual taxation receipts were recognised in budget documents on a TLM basis. From the 2006-07 Budget, ETM receipts recognition has been adopted for all receipts heads where the ETM receipts can be reliably estimated. This generally occurs where the economic activity, the identification of the liability and the receipt of the payment all occur with little or no lag and, consequently, the ETM and TLM (and cash) recognition methods produce relatively consistent results.
TLM receipts recognition continues to be used where ETM estimates are considered unreliable. At present, this is limited to individuals and other withholding taxation, company income taxation and superannuation taxation, but this will be reviewed periodically. ETM estimates and outcomes are inherently more volatile for these receipts heads, mainly because they incorporate the estimation of significant levels of liabilities likely to be identified in future periods. This additional level of estimation would increase the likelihood of differences between the receipts estimates and outcomes, with consequent impacts on the budget balances. This greater level of uncertainty would make the implementation of fiscal policy more problematic than if these receipts heads continue to be recognised using TLM.

Statement 5: Revenue
5-48
Differences between accrual and cash taxation estimates
Table E1: Estimates of taxation revenue on an accrual and cash basis
2011-12 2012-13 2013-14 2014-15 2015-16$b $b $b $b $b
Taxation revenue (accrual) 316.5 354.6 380.7 403.3 427.2Taxation receipts (cash) 309.7 343.1 371.4 392.9 415.5
Difference (accrual less cash) 6.8 11.5 9.3 10.4 11.7
Memorandum items:
Net receivables 2.4 6.1 4.7 4.8 5.7Write-offs of bad and doubtful debts 2.1 2.2 2.4 2.5 2.7Penalty remissions 2.1 2.3 2.4 2.6 2.8Other 0.2 0.9 -0.1 0.5 0.6Total 6.8 11.5 9.3 10.4 11.7
Estimates Projections
Other differences between accrual and cash estimates
There are a number of other timing differences between the recognition of accrual revenue and cash receipts as well as instances where revenue has been recognised but cash payment is no longer expected to be received.
• Tax receivables arise where taxation liabilities are recognised in one period, but the taxpayer is not expected to pay the liability until a later period. In general, net receivables increase over time in line with growth in taxes.
• Penalty remissions occur where accrual taxation liabilities are recognised, but circumstances are taken into account and the Commissioner of Taxation reduces the amount of various penalties and interest required to be paid.
• A taxation liability may be written off where the previously recognised receipts are no longer expected to be received.
• A credit amendment may be issued where a taxation assessment is amended (for example, where a court decision leads to a change in the interpretation of the taxation laws).

Statement 5: Revenue
5-49
APPENDIX F: TAX EXPENDITURES
This attachment contains an overview of the cost of tax expenditures provided to taxpayers through the tax system.
Tax expenditures provide a benefit to a specified activity or class of taxpayer. They can be delivered as a tax exemption, tax deduction, tax offset, reduced tax rate or deferral of tax liability. The Government can use tax expenditures to allocate resources to different activities or taxpayers in much the same way that it can use direct expenditure programs.
The data reported in this appendix are consistent with the data reported in the 2011 Tax Expenditures Statement published in January 2012. The data do not include the impact of decisions in this Budget on tax expenditures.
Care needs to be taken when analysing tax expenditure data: see the 2011 Tax Expenditures Statement for a detailed discussion.
Table F1 contains estimates of total tax expenditures for the period 2008-09 to 2015-16.
Table F1: Total measured tax expenditures Other tax Tax expenditures
Housing Superannuation expenditures Total as a proportionYear $m $m $m $m of GDP (%)2008‑09 (est) 29,500 33,117 49,294 111,911 8.92009‑10 (est) 43,500 25,413 47,509 116,422 9.02010‑11 (est) 35,500 27,226 48,938 111,664 8.02011‑12 (proj) 35,500 30,216 46,991 112,707 7.62012‑13 (proj) 36,000 32,116 51,223 119,339 7.72013‑14 (proj) 36,000 35,056 54,966 126,022 7.72014‑15 (proj) 36,500 40,226 59,438 136,164 7.92015‑16 (proj) 36,500 45,096 66,013 147,609 8.1

Statement 5: Revenue
5-50
Table F2 shows estimates of large measured tax expenditures for 2011-12.
Table F2: Large measured tax expenditures in 2011-12 Tax expenditure Estimate
$mLarge positive tax expendituresE6 Capital gains tax main residence exemption — discount component 20,000E5 Capital gains tax main residence exemption 15,500C5 Superannuation — concessional taxation of employer contributions 14,850C6 Superannuation — concessional taxation of superannuation entity earnings 14,000H29 GST — Food — uncooked, not prepared, not for consumption on premises of sale
and some beverages 5,900E17 Capital gains tax discount for individuals and trusts 4,700H19 GST — Health; medical and health services 3,050H16 GST — Education 2,900H2 GST — Financial Supplies; input taxed treatment 2,450A43 Exemption of Family Tax Benefit, Parts A and B, including expense equivalent 2,060C3 Concessional taxation of non‑superannuation termination benefits 1,450B16 Exemption from interest withholding tax on certain securities 1,440A22 Exemption of 30 per cent private health insurance rebate, including expense
equivalent 1,320H3 GST — Financial Supplies; reduced input tax credits 1,290D14 Philanthropy — Exemption for public benevolent institutions (excluding public and
not-for-profit hospitals) 1,260D18 Application of statutory formula to value car benefits 1,220A21 Exemption from the Medicare levy for residents with a taxable income below a
threshold 1,200F7 Concessional rate of excise levied on aviation gasoline and aviation turbine fuel 1,060H11 GST — Imported services 1,050B93 Statutory effective life caps 1,040D11 Philanthropy — Exemption for public and not‑for‑profit hospitals and public
ambulance services 1,000A32 Senior Australians' and Pensioners' Tax Offset 960C8 Superannuation — deduction and concessional taxation of certain personal
contributions 960A65 Philanthropy — Deduction for gifts to deductible gift recipients 910B4 Income tax exemption for local government bodies 830H6 GST — Water, sewerage and drainage 810B105 Research and development — Research and Development Tax Concession 780B95 Deduction for capital works expenditure 735A41 Exemption of certain income support benefits, pensions or allowances 670B108 Small business and general business tax break 660H10 GST — Importation Threshold 640H5 GST — Child Care Services 620
Large negative tax expendituresF24 Customs duty ‑2,460F11 Higher rate of excise levied on cigarettes not exceeding 0.8 grams of tobacco ‑1,760A30 Flood and cyclone reconstruction levy ‑1,500

6-1
STATEMENT 6: EXPENSES AND NET CAPITAL
INVESTMENT
Statement 6 presents estimates of general government sector expenses and net capital investment, allocated according to the various functions of government, on an accrual accounting basis. General government sector expenses are expected to decline as a share of Gross Domestic Product (GDP) in 2012-13, reflecting the Government’s commitment to fiscal discipline.
This Budget includes a range of measures to return the Budget to surplus in 2012-13, including $16.3 billion of savings in expenses and net capital investment. The largest savings include further efficiencies and targeted reductions in defence funding ($5.5 billion over four years) along with slower growth in official development assistance (ODA) ($2.9 billion over four years) arising from a one year deferral in the Government’s commitment to increase ODA to 0.5 per cent of Gross National Income. The most significant areas of expenditure in 2012-13 are for the social security and welfare (35.0 per cent of total expenses), other purposes (18.6 per cent), health (16.2 per cent), and education (7.9 per cent) functions.
The strongest growth in expenses across the Budget and forward estimates is expected to occur in the housing and community amenities (22.1 per cent), other purposes (18.2 per cent), fuel and energy (16.5 per cent), agriculture, forestry and fishing (10.8 per cent) and health (8.2 per cent) functions. These increases are partly offset by declines in the recreation and culture (-14.3 per cent) and other economic affairs (-8.1 per cent) functions. The 2012-13 Budget includes funding for a number of key Government policy priorities. The Government has announced a five year $3.7 billion package of reforms to Australia’s aged care system, with a net Government investment of $577 million. This includes more home-based services, better access to residential aged care facilities, and making the system fairer, more transparent and more responsive to the needs of older Australians.
The Government will also provide assistance to people with a disability and their families and carers through implementation of the first stage of a National Disability Insurance Scheme (NDIS). Funding of $1.0 billion over four years for the first stage will test key features of an NDIS in up to four launch locations, to be announced following negotiations with State and Territory governments.
The Government will also spend an additional $2.9 billion over four years to ease the cost of living pressures on families and unemployed people through the Spreading the Benefits of the Boom package.

6-2
CONTENTS
Overview ....................................................................................................... 6-3
General government sector expenses ....................................................... 6-3 Reconciliation of expenses since the 2011-12 Budget ................................................ 6-3 Estimated expenses by function .................................................................................. 6-5 Major savings ............................................................................................................... 6-9 Program expenses ..................................................................................................... 6-10 General public services .............................................................................................. 6-11 Defence ...................................................................................................................... 6-14 Public order and safety .............................................................................................. 6-16 Education ................................................................................................................... 6-17 Health ......................................................................................................................... 6-21 Social security and welfare ........................................................................................ 6-27 Housing and community amenities ............................................................................ 6-34 Recreation and culture ............................................................................................... 6-36 Fuel and energy ......................................................................................................... 6-38 Agriculture, forestry and fishing .................................................................................. 6-40 Mining, manufacturing and construction .................................................................... 6-42 Transport and communication .................................................................................... 6-43 Other economic affairs ............................................................................................... 6-45 Other purposes ........................................................................................................... 6-48
General government net capital investment............................................ 6-50 Reconciliation of net capital investment since the 2011-12 Budget ........................... 6-50 Net capital investment estimates by function ............................................................. 6-52 Trends in Australian Government staffing .................................................................. 6-54 Appendix A: Expense by function and sub-function ................................................... 6-55 Appendix B: The Contingency Reserve ..................................................................... 6-58 Appendix C: Additional Agency Statistics .................................................................. 6-60

6-3
STATEMENT 6: EXPENSES AND NET CAPITAL
INVESTMENT
OVERVIEW
Australian Government general government sector (GGS) accrual expenses are expected to decrease by 1.8 per cent in real terms in 2012-13, and then grow in 2013-14 and for the remainder of the forward estimates. Total expenses are expected to fall as a percentage of GDP between 2011-12 and 2012-13, then remain broadly stable over the forward estimates.
Table 1: Estimates of general government sector expenses MYEFO Revised Estimate Projections2011-12 2011-12 2012-13 2013-14 2014-15 2015-16
Total expenses ($b) 371.7 373.7 376.3 398.5 416.4 439.0Real growth on
previous year (%)(a) 1.3 2.5 -1.8 3.3 2.0 2.9Per cent of GDP 25.0 25.3 24.3 24.4 24.2 24.2 (a) Real growth is calculated using the Consumer Price Index.
As set out in Statement 3 of Budget Paper No.1, the Government also reports spending on a cash basis. When expressed in cash terms, Government spending is forecast to grow by an average of 1.8 per cent per annum over the five years to 2015-16.
General government sector expenses
Reconciliation of expenses since the 2011-12 Budget
Table 2 provides a reconciliation of expense estimates between the 2011-12 Budget, the Mid-Year Economic and Fiscal Outlook 2011-12 (MYEFO) and the 2012-13 Budget showing the effect of policy decisions, and economic parameter and other variations.

Statement 6: Expenses and Net Capital Investment
6-4
Table 2: Reconciliation of expense estimates Estimates Projections
2011-12 2012-13 2013-14 2014-15$m $m $m $m
2011-12 Budget expenses 365,817 380,523 398,974 414,137
Changes from 2011-12 Budget to 2011-12 MYEFOEffect of policy decisions(a) 4,805 1,166 6,269 6,468Effect of parameter and other variations 1,125 -1,754 -4,620 -1,742Total variations 5,929 -587 1,649 4,726
2011-12 MYEFO expenses 371,747 379,935 400,623 418,863
Changes from 2011-12 MYEFO to 2012-13 BudgetEffect of policy decisions(a) 1,951 201 773 3,095Effect of economic parameter variationsTotal economic parameter variations -2,322 -3,883 -3,770 -4,712
Unemployment benefits -140 -88 722 -14Prices and wages -264 -899 -1,336 -1,393Interest and exchange rates -18 -46 -56 -58GST payments to the States -1,900 -2,850 -3,100 -3,247
Public debt interest -113 -302 -440 -622Program specific parameter variations 1,859 2,070 1,798 1,936Slippage in 2011-12 Budget decisions -8 0 0 0Other variations 558 -1,749 -482 -2,112Total variations 1,925 -3,662 -2,120 -2,415
2012-13 Budget expenses 373,671 376,273 398,503 416,449 (a) Excludes secondary impacts on public debt interest of policy decisions and offsets from the Contingency
Reserve for decisions taken.
Economic parameter variations are forecast to reduce expenses in 2012-13 and over the forward estimates compared to forecasts at the time of the 2011-12 MYEFO. This is largely due to a reduction in goods and services tax (GST) payments to the States and Territories, consistent with a reduction in GST revenue collections. The indexation of many government payments, including social security payments, also contributes to the reduction in the growth of expenses since the 2011-12 MYEFO, reflecting lower estimates of prices and wages growth relative to those in MYEFO.
Program specific parameter variations are expected to remain fairly stable across the Budget and forward estimates.

Statement 6: Expenses and Net Capital Investment
6-5
Estimated expenses by function
Table 3 sets out the estimates of Australian Government GGS expenses by function for the period 2011-12 to 2015-16.
Table 3: Estimates of expenses by function Estimates Projections
2011-12 2012-13 2013-14 2014-15 2015-16$m $m $m $m $m
General public services 21,944 22,054 22,790 23,641 24,686Defence 21,656 21,559 22,212 23,129 24,453Public order and safety 4,072 3,957 3,935 3,934 3,992Education 29,259 29,572 29,929 31,683 33,846Health 61,168 61,003 64,088 67,175 71,137Social security and welfare 126,879 131,656 138,241 143,085 150,354Housing and community amenities 6,238 7,276 8,972 9,269 9,571Recreation and culture 3,705 3,605 3,432 3,297 3,328Fuel and energy 6,633 6,523 7,832 7,993 8,190Agriculture, forestry and fishing 3,255 2,609 2,576 2,662 3,114Mining, manufacturing and construction 2,114 2,084 2,128 2,224 2,398Transport and communication 9,178 5,048 6,702 6,973 5,600Other economic affairs 9,758 9,331 9,290 9,234 9,242Other purposes 67,812 69,994 76,377 82,150 89,132Total expenses 373,671 376,273 398,503 416,449 439,044 Major expense variations from 2012-13 over the forward years include movements in the following functions:
• defence — the Government will achieve savings in the Defence portfolio of $5.5 billion over four years, including through deferring some Defence acquisitions, adjusting the Defence capital equipment program and delivering further operating efficiencies, while delivering priority 2009 Defence White Paper capabilities;
• social security and welfare — the increase in expenses is largely due to the indexation of personal benefits and income support payments, such as the Age Pension, and the continuing demographic shift to an older population;
• health — the increase in expenses reflects indexation of the Commonwealth’s contribution to the provision of hospital services under the National Health Reform Agreement and, from 2014-15, projected growth in hospital services. Medicare expenses are also expected to increase as a direct result of the increase in the Australian population — and in particular, the number of Australians aged over 65 — as well as technology and social factors;
• education — expenses are expected to increase reflecting the introduction by the Government of a demand driven funding system and more generous indexation arrangements for higher education, and the level of indexation applied to schools funding together with student enrolment growth;

Statement 6: Expenses and Net Capital Investment
6-6
• housing and community amenities — expenses are expected to increase primarily due to the implementation of various programs under the Clean Energy Futures package;
• agriculture, forestry and fishing — expenses are expected to decrease reflecting a general return to normal seasonal conditions across Australia and an anticipated reduction in spending on drought assistance; and
• other purposes — the increase in expenses is primarily due to growing general revenue assistance payments (primarily GST) to be made to the States and Territories and the conservative bias allowance component of the Contingency Reserve.
Government expenses are strongly influenced by underlying trends in spending in the social security and welfare, health and education functions (see Boxes 1 and 2). Together, these functions account for 59.1 per cent of all Government expenses in 2012-13. Health spending is forecast to grow faster in real terms than education and social security and welfare spending over the forward estimates period and is expected to increase its share of total expenses from around 14.0 per cent in 2000-01 to 16.2 per cent in 2015-16.
Further details of spending trends against all functions are set out under individual function headings. Specific information regarding initiatives in the defence, education, health and social security and welfare functions is set out in Boxes 3 to 9.

Statement 6: Expenses and Net Capital Investment
6-7
Box 1: Where does government spending go in 2012-13?
Government spending provides a wide range of services to the community. The most significant component of government spending relates to social security and welfare, with around one third of total expenses providing support to the aged, families with children, people with disabilities, veterans, carers and unemployed people.
Another one sixth of government expenses occur in health, including Medicare Benefits Schedule (MBS) and Pharmaceutical Benefits Scheme (PBS) payments. A similar amount is also transferred to the States and Territories in general revenue assistance under the other purposes function.
The Government also provides significant investment under the education function, supporting government and non-government schools, as well as higher education and vocational education and training. The remainder is spent on defence and a range of other public services.
The estimates presented in the chart above are explained in greater detail under each individual function in the following pages.
Social security and welfare
35%
Other purposes19%
Health16%
Education8%
General public services
6%
Defence6%
All other functions10%

Statement 6: Expenses and Net Capital Investment
6-8
Box 2: Trends in future spending
Social security and welfare expenses are projected to grow strongly over the forward estimates. Key factors driving this include the Age Pension, with demographic factors resulting in the number of people receiving the Age Pension expected to increase by 220,000 from 2012-13 to 2015-16; income support for carers, as a result of the increasing number of senior Australians receiving care and assistance; and child care fee assistance, reflecting the growing use of child care services which is in part due to the Government’s reforms designed to increase workforce participation.
A number of major health programs will continue to see strong expenditure growth, including the MBS, the PBS, and payments to the States and Territories under the Australian Health Care Agreement and the National Health Reform Agreement. Spending on health, particularly the MBS and PBS, is influenced by population growth and to some extent by the ageing of the population together with developments in health technology and the resulting listing of new products and services.
Spending growth in the education function is largely expected to come from assistance to government and non-government schools. University spending is also forecast to continue to rise strongly due to the recent uncapping of student places and revised indexation arrangements.
Total real growth by function — 2012-13 to 2015-16(a)
-1,000
0
1,000
2,000
3,000
4,000
5,000
6,000
7,000
8,000
-1,000
0
1,000
2,000
3,000
4,000
5,000
6,000
7,000
8,000$ mill ion$ mil lion
(a) The other purposes function is not included in this chart as it contains expenses in the Contingency Reserve,
the impact of which will fall to other functions, as well as general revenue assistance to the State and Territory governments (primarily GST). Total real growth in the other purposes function is $12.9 billion from 2012-13 and over the forward estimates.

Statement 6: Expenses and Net Capital Investment
6-9
Major savings
As part of the Government’s commitment to return the Budget to surplus in 2012-13, it has identified around $32.6 billion of savings over four years in this Budget, of which $16.3 billion relates to savings in expenses and net capital investment. These savings reduce expenses and net capital investment across a range of functions.
The Government will achieve savings in the Defence portfolio, including through deferring some Defence acquisitions, adjusting the Defence capital equipment program and delivering further operating efficiencies, while delivering priority 2009 Defence White Paper capabilities. These measures will result in savings of $5.5 billion in the defence function over four years.
The deferral of Australia’s ODA growth target will reduce expenses by $2.9 billion over four years, largely through a reduction in the provision for expanded aid funding held in the Contingency Reserve. These expenses are allocated to the foreign affairs and economic aid sub-function.
In the social security and welfare function, savings from improving the Aged Care Funding Instrument ($1.1 billion over four years) and fairer means testing arrangements for home care and residential care ($256.8 million over four years) will be redirected to support the Government’s Aged Care reform measures. Changes in eligibility for Parenting Payment are expected to reduce expenses by $687.1 million over four years. Savings from ceasing the Community Development Employment Projects (CDEP) program from 30 June 2013 ($584.4 million over four years) will be redirected to support components of the new Remote Jobs and Communities program. A further $360.9 million in savings over four years will result from new limits to age eligibility for Family Tax Benefit Part A.
In the health function, savings of $1.5 billion will be redirected to other health spending and contribute to the sustainability of the health system over the forward estimates. Savings will be achieved across a range of programs over four years including: redirecting funding from the Commonwealth Dental Health program ($290.0 million) to new dental health initiatives; redirecting funding from the supporting longer stay older patient initiative as part of Aged Care reform measures ($150.0 million); ceasing funding for expanding access to multi-purpose services as part of the National Health Reform Agreement ($120.7 million); and price decreases to some medicines listed on the Pharmaceutical Benefits Scheme ($111.3 million).
Major savings will also be achieved by removing grandfathering arrangements for student contributions for maths and science courses ($314.9 million over four years) in the education function. Further details of all savings measures are available in Budget Paper No. 2, Budget Measures 2012-13.

Statement 6: Expenses and Net Capital Investment
6-10
Program expenses
Table 3.1 reports the top 20 expense programs in the 2012-13 financial year. These programs represent 64.4 per cent of total expenses in that year. The revenue assistance to the States and Territories program comprises 13.1 per cent of total expenses for 2012-13. Of the remaining programs in the top 20, more than half provide financial assistance or services to seniors, families, people with a disability, students, carers and the unemployed.
Table 3.1: Top 20 programs by expenses in 2012-13
2011-12 2012-13 2013-14 2014-15 2015-16
Program Function $m $m $m $m $m
Revenue assistance to the
States and Territories Other purposes 46,714 49,381 52,039 54,632 57,214
Income support for seniors SSW 34,812 36,760 39,017 41,741 44,865
Family tax benefit SSW 19,934 19,927 20,896 21,456 21,963
Medicare services Health 17,603 17,850 18,690 20,023 21,334
Disability support pension SSW 14,493 14,835 15,374 16,118 16,939
Assistance to the States for
healthcare services Health 12,694 13,504 14,368 15,928 17,623
Pharmaceuticals and
pharmaceutical services Health 9,600 9,924 10,615 11,352 12,128
Job seeker income support SSW 7,449 8,783 9,795 8,994 9,727
Non government schools –
national support Education 7,739 8,313 8,977 9,691 10,457
Residential and flexible
care(a) SSW - 8,272 8,667 9,231 9,701
Higher education support Education 6,879 7,098 7,309 7,687 8,051
Public sector Other purposes; General
superannuation(b) public services 6,467 6,863 6,974 7,105 7,243
Income support for carers SSW 5,723 6,277 6,986 7,776 8,568
Fuel tax credits scheme Fuel and energy 5,732 5,600 6,179 5,880 5,919
Parents' income support SSW 5,879 5,317 5,095 5,239 5,102
Management of capability
sustainment Defence 5,301 5,295 5,671 6,126 6,427
Army capabilities Defence 5,239 5,025 5,365 5,625 5,924
Private health insurance Health 5,305 4,527 4,538 4,561 4,596
Child care fee assistance SSW 4,179 4,437 4,802 5,173 5,512
Department of
Human Services(c) SSW; Health 4,517 4,410 4,332 4,156 4,120
Sub-total 226,257 242,401 255,691 268,493 283,414
Other programs 147,414 133,872 142,812 147,956 155,630
Total expenses 373,671 376,273 398,503 416,449 439,044
Estimates Projections
(a) The 'Residential and flexible care' program commencing on 1 July 2012 is a result of a change to the
Department of Health and Ageing program structure. (b) This program is a combination of public sector superannuation nominal interest and benefits programs. (c) Department of Human Services departmental expenses.

Statement 6: Expenses and Net Capital Investment
6-11
General public services
Expenses under the general public services function support the organisation and operation of government such as those related to the Parliament, the Governor-General and conduct of elections; the collection of taxes and management of public funds and debt; assistance to developing countries to reduce poverty and achieve sustainable development, particularly countries in the Pacific region; contributions to international organisations; and the operations of the foreign service. It also includes expenses related to research in areas not otherwise connected with a specific function, and those associated with overall economic and statistical services as well as government superannuation benefits (excluding nominal interest expenses on unfunded liabilities which are included under the nominal superannuation interest sub-function in the other purposes function).
Table 4: Summary of expenses — general public services Estimates Projections
2011-12 2012-13 2013-14 2014-15 2015-16$m $m $m $m $m
Legislative and executive affairs 1,010 974 1,206 1,176 991Financial and fiscal affairs 7,663 7,770 7,683 7,917 8,148Foreign affairs and economic aid 5,798 6,254 6,918 7,571 8,537General research 2,789 2,720 2,598 2,550 2,501General services 841 858 859 863 892Government superannuation benefits 3,843 3,479 3,525 3,564 3,616Total general public services 21,944 22,054 22,790 23,641 24,686 Total general public services expenses are estimated to increase in real terms by 3.9 per cent from 2012-13 over the forward years, or 1.1 per cent per annum on average in real terms.
The uneven profile of expenses under the legislative and executive affairs sub-function partly reflects costs that will be incurred by the Australian Electoral Commission to support the scheduled federal election in 2013-14.
Expenses in the financial and fiscal affairs sub-function are expected to increase over the forward estimates, primarily due to an increase in bad and doubtful debts expenses in line with the normal growth in taxation revenue over the forward estimates.
The increase in expenses from 2012-13 over the forward years in the government superannuation benefits sub-function reflects revised actuarial estimates of the Government’s superannuation liability.
Total expenses under the foreign affairs and economic aid sub-function are forecast to increase by 26.7 per cent in real terms from 2012-13 over the forward years. This increase is due to the Government’s commitment to increase the level of ODA to 0.5 per cent of Gross National Income by 2016-17. While this represents a one year deferral of the original target of 2015-16, ODA spending is still projected to continue to

Statement 6: Expenses and Net Capital Investment
6-12
increase by 30.3 per cent in real terms from 2012-13 to 2015-16. Under the new growth profile, ODA spending will have doubled from 2007-08 levels by 2014-15. Based on current projections of ODA contributions by the 23 members of the Development Assistance Committee of the Organisation for Economic Co-operation and Development (OECD), this growth path could see Australia rank sixth in the ODA donor rankings by 2015-16. Currently, Australia is ranked tenth. Budget Paper No. 2, Budget Measures 2012-13 contains further details on the Government’s revision to the growth profile for ODA. Table 4.1 sets out the major components of foreign affairs and economic aid sub-function expenses.
Table 4.1: Trends in the major components of foreign affairs and economic aid sub-function expenses
2011-12 2012-13 2013-14 2014-15 2015-16$m $m $m $m $m
Official development assistance (a)(b) 4,130 4,997 5,588 6,055 7,017Africa, South and Central Asia, Middle Eastand other 1,145 1,133 1,274 1,524 1,592
East Asia 919 1,044 1,229 1,483 1,566PNG and Pacific 931 963 1,093 1,226 1,389Multilateral replenishments 10 569 568 13 -Emergency, humanitarian and
refugee programs 332 402 416 520 684UN, Commonwealth and other
international organisations 342 368 411 383 457NGO, volunteer and community programs 168 193 234 267 282Other (c) 284 325 364 640 1,048
International deployments 352 311 203 161 160Passport services 202 248 259 269 281Payments to international organisations 238 240 240 242 244International agricultural research
and development 110 118 117 115 111Consular services 75 72 74 75 75Finance and insurance services for Australian
exporters and investors 50 40 37 35 33Other 641 227 399 620 615Total 5,798 6,254 6,918 7,571 8,537
Estimates Projections
(a) The difference between these figures and the Government's ODA target is due primarily to the way
replenishments are recognised in accrual terms when initial commitments are made. However, ODA targets are measured in cash terms and reflect the timing of actual cash payments (which, in the case of multilateral replenishments, can be spread over several years).
(b) Some minor ODA delivered by other government departments may be classified to other programs or functions.
(c) Other includes AusAID's departmental expenses and the provision available for future aid spending in the ODA Contingency Reserve (CR) in the Budget and forward estimates. The ODA CR represents the difference between the amount of ODA already committed by Australia and the Government's target levels of ODA.
The general research sub-function incorporates expenses incurred by the Commonwealth Scientific and Industrial Research Organisation, the Australian Nuclear Science and Technology Organisation, the Australian Institute of Marine Science and the Australian Research Council.

Statement 6: Expenses and Net Capital Investment
6-13
Total expenses in this sub-function are forecast to decrease by 14.6 per cent in real terms from 2012-13 over the forward years, or by 5.1 per cent per annum on average in real terms. This decrease is mainly due to the completion of a number of projects funded under the Education Investment Fund in the science and research capacity program.
The table below sets out the major components of general research sub-function expenses.
Table 4.2: Trends in the major components of general research sub-function expenses
2011-12 2012-13 2013-14 2014-15 2015-16
$m $m $m $m $mNational research flagships 566 575 612 639 643Discovery - research and research training 502 542 556 523 577Core research and services 544 503 501 524 566Science and research capacity 464 363 183 115 34Linkage - cross sector research partnerships 326 338 334 334 273Science and technology solutions 272 258 261 264 265Other 115 141 152 150 143Total 2,789 2,720 2,598 2,550 2,501
Estimates Projections

Statement 6: Expenses and Net Capital Investment
6-14
Defence
The defence function includes expenses incurred by the Department of Defence (Defence), the Defence Materiel Organisation (DMO) and other agencies. Defence expenses support Australian military operations overseas and the delivery of navy, army, air and intelligence capabilities and strategic policy advice in the defence of Australia and its national interests. The DMO contributes to the preparedness of the Australian defence organisation through the acquisition and through-life support of military equipment and supplies.
This function records the majority of expenses incurred by the Defence portfolio but does not include the expenses incurred by the Department of Veterans’ Affairs, superannuation payments to retired military personnel and housing assistance provided through Defence Housing Australia. These expenses are reported in the social security and welfare, other purposes, and housing and community amenities functions, respectively.
Table 5: Summary of expenses — defence Estimates Projections
2011-12 2012-13 2013-14 2014-15 2015-16$m $m $m $m $m
Defence 21,656 21,559 22,212 23,129 24,453Total defence 21,656 21,559 22,212 23,129 24,453 Total expenses for the defence function are estimated to increase by 5.0 per cent in real terms from 2012-13 over the forward estimates, reflecting underlying growth after Defence’s contribution to broader Government savings.
The forward estimates of expenses do not provide for extensions of currently approved operations beyond 2012-13 (to the end of 2012 for East Timor). Such funding is considered on a year-by-year basis and is subject to future decisions of the Government. From 2012-13, additional funding of $1.3 billion is being provided to support Defence overseas operations in Afghanistan, East Timor and the Solomon Islands. See Budget Paper No. 2, Budget Measures 2012-13 for further details.
The Government will achieve savings in the Defence portfolio, including through deferring some Defence acquisitions, adjusting the Defence capital equipment program and delivering further operating efficiencies, while delivering priority 2009 Defence White Paper capabilities. These measures will result in savings of $5.5 billion over four years. These savings are in addition to the $20.6 billion in savings to be realised as part of the Defence Strategic Reform Program from 2009 through to 2020.
Further details on the capital reprogramming and additional efficiencies can be found in Budget Paper No. 2, Budget Measures 2012-13.
The acquisition of defence capital items is reported in the net capital investment section of this Statement and in Box 3 below.

Statement 6: Expenses and Net Capital Investment
6-15
Box 3: Defence funding
Total Defence expenditure is estimated to decrease by $1.5 billion (8.6 per cent in real terms) in 2012-13. This includes both expenses and net capital investment. Expenses for the defence function are those incurred in undertaking its day-to-day activities. Net capital investment represents expenditure to acquire capital items in the form of equipment, buildings and land, less depreciation expenses.
Table 5.1: Trends in the major components of defence function expenses and net capital investment
Estimates2011-12 2012-13 2013-14 2014-15 2015-16
$m $m $m $m $mExpenses 21,656 21,559 22,212 23,129 24,453Net capital investment 2,408 986 739 1,023 2,368Total defence spending 24,063 22,545 22,951 24,152 26,821Nominal growth (per cent) 0.6% -6.3% 1.8% 5.2% 11.1%Real growth (per cent) -1.7% -8.6% -0.7% 2.7% 8.3%
Projections
Capital spending in the defence function is for the acquisition of large and complex platforms and military equipment, and the construction of support facilities linked to capability. Capital spending can experience significant annual fluctuations, including as the result of slippage in expenditure from one year to the next year (or to later years), foreign exchange rate fluctuations, and in response to additional supplementary funding decisions of Government. Further details of defence capital spending are provided in the net capital investment section of this Statement.
The expected decrease in real Defence funding in 2012-13 and 2013-14 is due to adjustments in capital acquisitions, the practice of funding overseas operations on a year-by-year basis and the additional savings that take full effect in those years.
The Government will continue to support the priority capabilities of the 2009 Defence White Paper, including the Future Submarine Project and purchase of Joint Strike Fighters. The reprogramming of Defence funding and savings returned to the Budget will have no adverse affect on overseas operations or the provision of equipment to Defence Force personnel on or preparing for deployment on those operations. Military personnel numbers will not be affected by the realisation of additional savings from Defence. There will be a net reduction in civilian personnel numbers of 1,000, primarily through natural attrition and tightening of recruitment practices.

Statement 6: Expenses and Net Capital Investment
6-16
Public order and safety
Expenses under the public order and safety function support the administration of the federal legal system and the provision of legal services, including legal aid, to the community. Public order and safety expenses also include law enforcement and intelligence activities, and the protection of Australian Government property.
Table 6: Summary of expenses — public order and safety Estimates Projections
2011-12 2012-13 2013-14 2014-15 2015-16$m $m $m $m $m
Courts and legal services 869 857 860 862 869Other public order and safety 3,203 3,100 3,075 3,073 3,123Total public order and safety 4,072 3,957 3,935 3,934 3,992 Total expenses for the public order and safety function are estimated to decrease by 6.4 per cent in real terms from 2012-13 over the forward years, or by 2.2 per cent per annum on average in real terms primarily through improved efficiencies.
Expenses within the courts and legal services sub-function are expected to decrease by 5.9 per cent in real terms from 2012-13 over the forward years, or by 2.0 per cent per annum on average in real terms. The reduction in funding from 2011-12 to 2012-13 mainly reflects the implementation of revised property management arrangements for the Commonwealth courts, which have transferred responsibility for some court property costs to the general public services function. The decrease in real terms from 2012-13 over the forward years is largely due to increased efficiencies together with temporary funding ending in 2012-13 for the Commonwealth Director of Public Prosecutions. Expenses for the other public order and safety sub-function are expected to decrease by 6.5 per cent in real terms from 2012-13 over the forward years, or by 2.2 per cent per annum on average. These decreases result from efficiencies expected to be achieved in the delivery of security programs, including lower surveillance costs for the Australian Customs and Border Protection Service arising from the shared use of a Department of Defence vessel to patrol the Southern Ocean.

Statement 6: Expenses and Net Capital Investment
6-17
Education
The education function includes expenses to support the delivery of education services through higher education institutions; vocational education and training providers (including technical and further education institutions); and government (State and Territory) and non-government primary and secondary schools.
Table 7: Summary of expenses — education Estimates Projections
2011-12 2012-13 2013-14 2014-15 2015-16$m $m $m $m $m
Higher education 8,579 8,917 9,302 9,752 10,188Vocational and other education 1,997 1,889 1,929 2,096 2,091Schools 12,308 12,872 13,487 14,468 15,396
Non-government schools 7,734 8,311 8,977 9,691 10,457Government schools 4,574 4,561 4,510 4,777 4,939
Student assistance 4,121 4,115 4,215 4,396 4,514General administration 314 258 258 258 260School education - specific funding 1,940 1,522 738 713 1,396Total education 29,259 29,572 29,929 31,683 33,846 Total spending on education is expected to increase by 6.2 per cent in real terms from 2012-13 over the forward years, or by 2.0 per cent per annum on average in real terms.
Expenses under the higher education sub-function are estimated to increase by 6.0 per cent in real terms from 2012-13 over the forward years. This primarily reflects the impact of reforms to higher education, including the introduction by the Government of a demand driven funding system and revised indexation arrangements.
As part of the transition to a demand driven funding system from 1 January 2012, the cap on Commonwealth funded over-enrolments was increased from 5 to 10 per cent in 2010 and 2011. The cap on Commonwealth funded over-enrolments was removed from 2012 onwards. The profile of higher education funding over the period 2012-13 to 2015-16 reflects the accumulated impact of the growth in actual enrolments from 2010, as well as forecast continued strong growth. More generous indexation arrangements for higher education funding, which now reflect movements in professional wages and salaries, will also contribute to increased funding for the sector.
The component contributing most to the growth of the vocational and other education sub-function is the Skills Reform National Partnership announced as part of the Building Australia’s Future Workforce package in the 2011-12 Budget. Total expenses for the sub-function are estimated to increase by 2.8 per cent in annual average real terms from 2012-13 over the forward years as a result of increased funding for this national partnership.

Statement 6: Expenses and Net Capital Investment
6-18
The major components of the vocational and other education sub-function are set out in Table 7.1.
Table 7.1: Trends in the major components of vocational and other education sub-function expenses
Estimates2011-12 2012-13 2013-14 2014-15 2015-16
$m $m $m $m $mAssistance to the States for skills and
workforce development 1,363 1,389 1,415 1,443 1,471National Partnership Payments - vocational
and other education 421 279 283 415 377Adult Migrant English Program 213 221 231 238 243Total 1,997 1,889 1,929 2,096 2,091
Projections
Expenses under the schools — non-government schools sub-function are expected to increase by an average of 5.3 per cent per annum in real terms from 2012-13 over the forward years. Strong growth in non-government school expenses is due to the level of indexation applied to schools funding together with student enrolment growth. The indexation of schools funding is calculated based on average government school recurrent costs and is well above the Consumer Price Index.
Expenses under the schools — government schools sub-function includes general assistance and national partnerships which, by their nature, are time limited. Excluding national partnerships, assistance to the States and Territories for government schools is estimated to increase from $3.6 billion in 2012-13 to $4.2 billion in 2015-16, an average increase of 4.6 per cent per annum in real terms over the forward estimates. The Smarter Schools national partnerships are progressively concluding over the next four years. A break-up of national partnership funding can be found in Budget Paper No. 3, Australia’s Federal Relations 2012-13.
Expenses under the student assistance sub-function are expected to increase by 1.8 per cent in real terms from 2012-13 over the forward estimates, or by 0.6 per cent per annum on average in real terms. This reflects a real increase in expenses under the Higher Education Loan Program (HELP) partially offset by a real decrease in expenses for tertiary student assistance.
The real decrease in tertiary student assistance between 2012-13 and 2013-14 reflects a reduction in expenses in Youth Allowance (Student) payments, which is primarily the result of the Supporting Families with Teenagers measure announced in the 2011-12 Budget. From 1 January 2012, dependent 16 to 19 year olds in secondary full-time study and dependent 16 to 17 year olds in non-secondary full-time study are no longer eligible for Youth Allowance (Student) and will instead be supported by Family Tax Benefit Part A, which is reported under the social security and welfare function.
The expenses for HELP reflect the estimated cost to the Government of providing concessional loans as well as the cost of providing incentives for students to pay

Statement 6: Expenses and Net Capital Investment
6-19
university fees up-front and to make early repayments on their HELP debts. The expected increase in HELP expenses reflects the introduction of a demand driven funding system, which will increase the number of students accessing a HELP loan.
The major components of the student assistance sub-function are set out in Table 7.2.
Table 7.2: Trends in the major components of student assistance sub-function expenses
Estimates2011-12 2012-13 2013-14 2014-15 2015-16
$m $m $m $m $mTertiary student assistance 3,012 2,895 2,862 2,940 2,972Higher Education Loan Program 816 924 1,053 1,151 1,237School student assistance 276 279 284 290 290Other 17 17 16 15 15Total 4,121 4,115 4,215 4,396 4,514
Projections
The major components of the school education — specific funding sub-function are the national partnership agreements on Building the Education Revolution, Digital Education Revolution, Improving Teacher Quality, Trade Training Centres, Empowering Local Schools, Reward for School Improvement, Rewards for Great Teachers and Youth Attainment and Transitions, and a number of elements of the Closing the Gap package. This includes both government and non-government school expenditure.The variation in expenses between years is predominantly attributed to the terms of these national partnerships. In particular, the estimated reduction in expenses from 2011-12 to 2014-15 is due to the winding up of a number of national partnerships including Youth Attainment and Transitions, Digital Education Revolution, Improving Teacher Quality and the completion of Building the Education Revolution projects by the end of 2011-12. The increase in expenses from 2014-15 to 2015-16 is due to the rollout of new national partnerships including Empowering Local Schools, Reward for School Improvement and Rewards for Great Teachers.

Statement 6: Expenses and Net Capital Investment
6-20
Box 4: Education spending trends
The education function contains a number of significant programs with sustained strong expenditure growth. Average real expenditure growth in assistance to government and non-government schools has been around 4 per cent and 5 per cent per annum respectively over the period 2000-01 to 2010-11, while the Higher Education Support program has seen growth of around 3 per cent per annum in real terms.
Indexation of assistance levels to both government and non-government schools is based on average cost growth in government schools, which has averaged around 6 per cent per annum over the past 10 years, and which is expected to remain at this level over coming years. Population growth amongst 5 to 18 year olds over the next ten years is expected to be higher than over the past ten years. Average real expenditure growth for these programs is therefore expected to be a little higher than in the past, but remaining in the order of 4 to 5 per cent per annum.
Recent strong growth in student enrolments and more generous indexation arrangements have led to strong growth in Higher Education Support over the forward estimates. Beyond the forward estimates, student enrolment growth is not expected to continue at these enhanced levels and average real expenditure growth for the Higher Education Support program is likely to stabilise at around 3 per cent per annum.
The Final Report of the Review of Funding for Schooling Final Report (the Gonski Review), and the Government’s initial response, were released on 20 February 2012. The Review makes a number of recommendations for school funding reform in Australia.
The Government’s initial response to the Gonski Review acknowledged the need for more work to be done to validate and refine elements of the Review’s recommendations. A total of $5.8 million over two years has been provided to the Department of Education, Employment and Workplace Relations to undertake this work.

Statement 6: Expenses and Net Capital Investment
6-21
Health
The health function includes expenses relating to: medical services funded through Medicare and the Private Health Insurance Rebate; payments to the States and Territories to deliver essential health services, including public hospitals; the Pharmaceutical Benefits and Repatriation Pharmaceutical Benefits Schemes; blood and blood products; population health initiatives; and health education and training services.
Table 8: Summary of expenses — health Estimates Projections
2011-12 2012-13 2013-14 2014-15 2015-16$m $m $m $m $m
Medical services and benefits(a) 24,199 23,679 24,483 25,819 27,198Hospital services(b) 2,890 2,597 2,774 2,027 1,903National Health Reform Payment(c) 12,694 13,504 14,368 15,928 17,623Pharmaceutical benefits and services 10,539 10,889 11,619 12,393 13,166Aboriginal and Torres Strait Islander health 742 764 780 765 789Health services 6,974 6,400 6,816 6,954 7,117General administration 3,130 3,169 3,247 3,288 3,341Total health 61,168 61,003 64,088 67,175 71,137 (a) The estimated financial impact of premium growth on the forward estimates for the Private Health
Insurance Rebate has been allocated to the Contingency Reserve, due to commercial sensitivities. (b) The hospital services sub-function includes payments from the Commonwealth to the States and
Territories for specific hospital improvement initiatives and is in addition to the bulk of hospital funding that is provided under the ‘National health reform payment’ sub-function.
(c) The name of this sub-function has changed from 'National healthcare specific purpose payment' to 'National health reform payment'.
Total expenses for this function are estimated to increase by 2.7 per cent per annum on average in real terms from 2012-13 over the forward years, and to make up an increasing share of total government expenses over the medium term. This increase is expected to be driven by the combination of technology and social factors, such as the effects of an ageing population, which increase the demand for health services.
The health expense estimates include the Government’s commitment to provide additional funding to increase the size and capacity of the dental workforce, to alleviate the pressure on public dental waiting lists and to support the delivery of oral health promotion. Further information on these measures can be found in Budget Paper No. 2, Budget Measures 2012-13.

Statement 6: Expenses and Net Capital Investment
6-22
Box 5: Moving towards a more sustainable health budget
Since 2007, the Government has taken a range of decisions to place health expenditure on a more sustainable footing, whilst ensuring front-line health services continue to meet the needs of current and future generations.
Total Government health expenses are stable between 2011-12 and 2012-13. This is followed by solid growth over the forward estimates (Chart 1). The change from 2011-12 to 2012-13 reflects a series of Government decisions including:
• means testing private health insurance, estimated to deliver savings of $746 million in 2012-13 and $2.4 billion over three years; and
• ongoing pricing reforms to the Pharmaceutical Benefits Scheme, announced in the 2010-11 Budget to deliver savings of $528 million in 2012-13 and $1.9 billion over five years.
Expenditure on infrastructure is also lower in 2012-13, as projects under the first three rounds of the Health and Hospitals Fund are progressively completed. Since 2009 the Government has invested $5 billion in our health system’s infrastructure through 224 projects around Australia. The Government has also spent $467 million over two years from 2010-11 to establish the key components of the Personally Controlled Electronic Health Record system.
The Government’s decisions have improved the sustainability of the health budget and provided capacity to invest in key services such as:
• $19.8 billion in public hospital services through to 2019-20 under National Health Reform;
• $2.2 billion over five years (from 2011-12) to deliver National Mental Health Reform;
• $515.3 million over four years (from 2012-13) for dental care for those who can least afford it;
• $233.7 million over three years (from 2012-13) to progress the national e-Health agenda; and
• other measures such as replenishing the National Medical Stockpile, and expanding the National Bowel Cancer Screening program.
Going forward, Government health expenditure is projected to continue to increase as a share of GDP. There is significant growth in the medium term arising from key programs in the portfolio. While the overall health budget remains stable between 2011-12 and 2012-13, it still grows in real terms over the forward estimates, on average, by 2.7 per cent per year (5.3 per cent in nominal terms).

Statement 6: Expenses and Net Capital Investment
6-23
Box 5: Moving towards a more sustainable health budget (continued)
Chart 1: Commonwealth health expenditure
0
10
20
30
40
50
60
70
80
0
10
20
30
40
50
60
70
80
2006-07 2009-10 2012-13 2015-16
$billion$billion
Health expenditure in the 2011-12 financial year is expected to be $1.3 billion higher than originally estimated in the 2011-12 Budget, but is consistent with estimates published in the 2011-12 MYEFO. The increase since the 2011-12 Budget largely reflects delays in the introduction of the 2009-10 Budget Measure Private Health Insurance — fair and sustainable support for the future along with the impact of premium growth for private health insurance rebates from April 2011. It also reflects the continued operation of the Chronic Disease Dental Scheme (CDDS), which was not included in the forward estimates at the time of the 2011-12 Budget beyond 31 December 2011, consistent with Government policy to end this program.
The medical services and benefits sub-function, which primarily consists of Medicare and Private Health Insurance Rebate expenses, comprises 38.8 per cent of total health expenses for 2012-13. Medicare expenses are the major driver of growth in this sub-function, and are expected to increase over the forward estimates as a direct result of the increase in the Australian population — and in particular, the number of Australians aged over 65 — as well as technology and social factors.
The decrease in expenses between 2011-12 and 2012-13 is mainly driven by the introduction of means testing for the Private Health Insurance Rebate. In the absence of this measure, forecast spending on medical services and benefits would have been $746.3 million higher in 2012-13.

Statement 6: Expenses and Net Capital Investment
6-24
The major components of the medical services and benefits sub-function are set out in Table 8.1.
Table 8.1: Trends in the major components of medical services and benefits sub-function expenses
2011-12 2012-13 2013-14 2014-15 2015-16$m $m $m $m $m
Medicare services 17,603 17,850 18,690 20,023 21,334Private health insurance 5,305 4,527 4,538 4,561 4,596General medical consultations and services 920 931 943 953 961Primary care practice incentives 302 284 213 228 234Other 69 87 99 54 73Total 24,199 23,679 24,483 25,819 27,198
ProjectionsEstimates
The Commonwealth’s contribution to funding under the National Health Reform Agreement is reported through the national health reform payment sub-function. The increase in expenses over the forward estimates for this sub-function reflects indexation of the Commonwealth’s contribution to the provision of hospital services and, from 2014-15, projected growth in hospital services. In addition to its base contribution, the Commonwealth has undertaken to fund 45 per cent of efficient growth in hospital services from 2014-15, as calculated by the Independent Hospital Pricing Authority. This will increase to 50 per cent of efficient growth from 2017-18.
Growth in the pharmaceutical benefits and services sub-function over the forward estimates is mainly driven by increasing demand for pharmaceutical services. PBS growth in 2011-12 and 2012-13 is lower than historical trends, largely reflecting the implementation of the 2010-11 Budget measure titled Pharmaceutical Benefits Scheme — further pricing reform from 1 April 2012. This measure requires manufacturers to disclose to the Government the actual price at which they sell medicines to wholesalers and pharmacies. This increased transparency is expected to help stabilise growth in the short term; however, growth is expected to return to its long-term trend of around 5 per cent per annum from 2013-14 onwards. PBS estimates do not include potential new listings or price adjustments, which typically increase spending. The major components of the pharmaceutical benefits and services sub-function expenses are set out in Table 8.2.

Statement 6: Expenses and Net Capital Investment
6-25
Table 8.2: Trends in the major components of pharmaceutical benefits and services sub-function expenses
2011-12 2012-13 2013-14 2014-15 2015-16$m $m $m $m $m
Pharmaceutical benefits (concessional)(a) 6,037 6,172 6,605 7,062 7,459Pharmaceutical benefits (general)(b) 1,781 1,834 1,964 2,115 2,490Pharmaceutical benefits (highly specialised
and other drugs dispensed in hospitals)(c) 1,567 1,698 1,823 1,949 1,949Veterans' pharmaceutical benefits 438 430 426 422 416Payments for wholesalers and pharmacy
programs 205 209 213 216 220Other 510 546 588 629 631Total 10,539 10,889 11,619 12,393 13,166
ProjectionsEstimates
(a) Concessional benefits are those provided through community pharmacies for Centrelink concession card
holders. (b) General benefits are those provided through community pharmacies for people without concession
cards. (c) Highly specialised drugs are subsidised by the Commonwealth Government through hospitals.
Expenses in the health services sub-function include Commonwealth expenses associated with the delivery of population health, hearing services, blood and blood products, research and other allied health services, e-Health, and health infrastructure funding through the Health and Hospitals Fund (HHF). Expenses in the general administration sub-function include the Commonwealth’s investment in health workforce measures, and the Government’s support for rural health initiatives, including the Royal Flying Doctor Service. This sub-function also includes the Government’s expenditure on the delivery of programs.
The hospital services sub-function includes payments to the States and Territories through a range of existing and new national partnership agreements, and support for veterans' hospital services. The initial years of the forward estimates include funding for emergency departments and elective surgery investment as part of national health reform. The estimates decline over time as these initiatives are concluded.
Expenses in the Aboriginal and Torres Strait Islander health sub-function will increase in 2012-13 through the Stronger Futures in the Northern Territory package. This package of funding for the Northern Territory ensures the continued delivery of primary care, specialist and allied health services for Indigenous Australians, as well as the continuation of the Remote Area Health Corps, a program that helps meet workforce shortages in remote locations.
Aboriginal and Torres Strait Islander people across Australia can access mainstream services as well as Indigenous specific services. Substantial investments in Indigenous health also occur through other health sub functions.

Statement 6: Expenses and Net Capital Investment
6-26
Box 6: Health spending trends
A number of major Health programs have seen and will continue to see sustained expenditure growth, including the MBS, the PBS, and payments to the States and Territories under the Australian Health Care Agreement and the National Health Reform Agreement. Over the period from 2000-01 to 2010-11, average real expenditure growth for the MBS has been around 5.2 per cent per annum, 5 per cent per annum for the PBS, while health payments to the States and Territories have averaged around 3.5 per cent per annum. The Private Health Insurance Rebate has also experienced strong real growth of around 6 per cent per annum.
Spending on the MBS and PBS is impacted by population growth and to some extent by the ageing of the population; however, spending is also influenced by developments in health technology and the resulting listing of new products and services. These non-demographic influences are stronger than the demographic impacts, with real growth expected to remain at relatively high levels of around 3 per cent per annum for the MBS and 5 per cent per annum for the PBS. Payments to the States and Territories for healthcare under the National Health Reform Agreement will grow relatively quickly (at around 8 per cent per annum in real terms from 2015-16), in large part due to volume growth and the Commonwealth increasing its contribution to meet its target of funding 50 per cent of the growth in the efficient price of hospital services.

Statement 6: Expenses and Net Capital Investment
6-27
Social security and welfare
The social security and welfare function includes: pensions and services to the aged; assistance to the unemployed, people with disabilities and families with children; and income support and compensation for veterans and their dependants. It also includes assistance provided to Indigenous Australians.
Table 9: Summary of expenses — social security and welfare Estimates Projections
2011-12 2012-13 2013-14 2014-15 2015-16$m $m $m $m $m
Assistance to the aged 48,675 51,138 54,221 57,305 61,344Assistance to veterans and dependants 7,071 6,898 6,912 6,837 6,770Assistance to people with disabilities 22,951 23,978 25,453 27,182 28,923Assistance to families with children 34,589 34,152 35,435 36,595 37,472Assistance to the unemployed and the sick 7,449 8,783 9,795 8,994 9,727Other welfare programs 974 1,707 1,748 1,702 1,707Assistance for Indigenous Australians nec(a) 1,366 1,200 969 932 943General administration 3,804 3,800 3,708 3,539 3,468Total social security and welfare 126,879 131,656 138,241 143,085 150,354 (a) The name of this sub-function has changed from 'Aboriginal advancement nec' to 'Assistance for
Indigenous Australians not elsewhere classified (nec)’.
Expenses in the social security and welfare function are estimated to grow by 6.0 per cent in real terms from 2012-13 over the forward years, or at an average annual rate of 2.0 per cent. The sub-functions contributing most to the growth are assistance to the aged, assistance to people with disabilities and assistance to families with children. The funding over the forward estimates in the assistance to Indigenous Australians not elsewhere classified (nec) sub-function does not include a large component of the Stronger Futures in the Northern Territory package. This expenditure is not for publication from 2013-14 as it is subject to negotiation with the Northern Territory Government.
The continuing demographic shift to an older population, as outlined in the 2010 Intergenerational Report, continues to contribute to increased social security and welfare expenses as more Australians become eligible for the Age Pension and begin to enter residential and community care facilities. The ageing of the population is also leading to an increase in the number of people caring for senior Australians and becoming eligible for carer payments.
Additionally, the Secure and Sustainable Pensions package announced in the 2009-10 Budget continues to contribute to growth of pension payments including the Age Pension, Disability Support Pension and Carer Payment over the forward estimates. The principal driver of growth over the forward estimates in the assistance to the aged sub-function is the income support for seniors program, with expected average annual real growth of 3.6 per cent from 2012-13 over the forward estimates. This is largely driven by the program’s major component, the Age Pension, with

Statement 6: Expenses and Net Capital Investment
6-28
demographic factors outlined above estimated to result in the number of people receiving the Age Pension increasing by 220,000 between 2012-13 and 2015-16.
Growth over the forward estimates is also driven by increased funding required by the home care, home support and the residential and flexible care programs due to demographic factors, as well as changes in the cost of delivering aged care.
From 1 July 2012, there will be a transfer of funding from the national partnership payments component of the assistance to the aged sub-function to the home support component (with the exception of Western Australia and Victoria) and the access and information component. This follows the Commonwealth taking on full funding and policy responsibility for aged care.
The major components of the assistance to the aged sub-function are outlined below in Table 9.1.
Table 9.1: Trends in the major components of assistance to the aged sub-function expenses(a)
2011-12 2012-13 2013-14 2014-15 2015-16$m $m $m $m $m
Income support for seniors 34,812 36,760 39,017 41,741 44,865Residential and flexible care 7,920 8,272 8,667 9,231 9,701Veterans’ community care and support 1,606 1,669 1,760 1,881 2,027Home support 247 1,381 1,505 1,635 1,757Home care 1,058 1,080 1,165 1,273 1,408National partnership payments – assistance
to the aged 1,883 803 845 313 325Mature age income support 580 486 435 350 323Allowances, concessions and services for
for seniors 258 238 312 337 354Ageing and service improvement 123 161 196 206 219Workforce and quality 138 152 178 189 217Access and information 26 123 132 128 134Other 24 13 9 21 14Total 48,675 51,138 54,221 57,305 61,344
ProjectionsEstimates
(a) From 2012-13, the Department of Health and Ageing has restructured a number of its programs in the
assistance to the aged sub-function. Further detail is provided at Box 7: Aged Care reform.

Statement 6: Expenses and Net Capital Investment
6-29
Box 7: Aged Care reform
The Government is building a better, fairer and more nationally consistent aged care system through the Living Longer. Living Better aged care reform package announced on 20 April 2012. The Government will be spending $3.7 billion over five years from 2012-13 to: improve access to better aged care services; improve aged care linkages with the health system; improve fairness and sustainability; increase support for dementia; support the diverse care needs of Australia’s ageing population; establish an Aged Care Financing Authority; and establish an Aged Care Reform Implementation Council. Specific initiatives include increasing the number of home care packages ($880 million), building more residential care facilities ($487 million), tackling dementia ($268 million), and building a gateway to aged care services ($198 million).
The investment is partly offset by fairer and more uniform contributions to the cost of care by older Australians who have the capacity to contribute to their care needs through changed means testing arrangements (saving $561 million), modifications to the aged care funding instrument (redirecting $1,597 million), and redirecting funding from related programs (saving $961 million). For further information on these reforms, see the Living Longer. Living Better materials released by the Prime Minister and the Minister for Mental Health and Ageing on 20 April 2012 and Budget Paper No. 2, Budget Measures 2012-13.
The main components contributing to the growth of the assistance to families with children sub-function are family tax benefit payments and child care fee assistance. Family Tax Benefit payments will grow over the forward estimates as a result of payment rate increases provided by the Government to ease the pressure on families through the Spreading the Benefits of the Boom package.
The Government will provide $2.1 billion over five years for a new Schoolkids Bonus to provide guaranteed support to families for the cost of their children’s education. This will replace the Education Tax Refund (ETR), which is currently available as a refundable tax offset. The Schoolkids Bonus will be made in two equal instalments in January and July each year commencing January 2013. As a transitional arrangement, the ETR in 2011-12 will be replaced by a one-off lump sum payment to eligible families in June 2012. Making these payments automatic will increase assistance to the many eligible families currently missing out on some or any ETR.
Child care fee assistance is projected to grow in real terms by 15.3 per cent from 2012-13 over the forward estimates (at an annual average real rate of 4.9 per cent). The increase in expenses reflects the growing use of child care services and the implementation of productivity reforms designed to increase workforce participation.
The major components of the assistance to families with children sub-function are set out in Table 9.2.
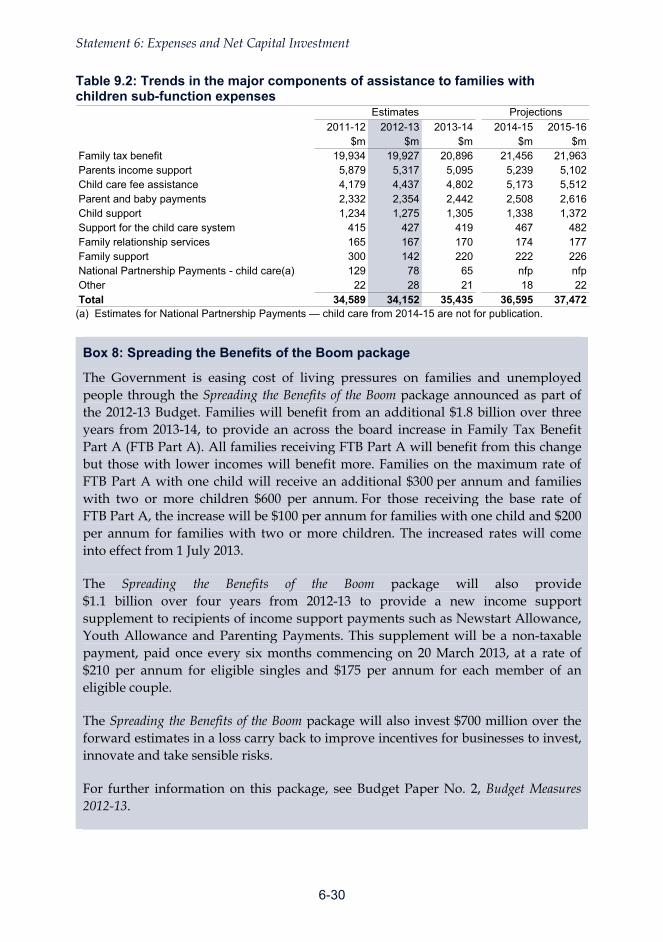
Statement 6: Expenses and Net Capital Investment
6-30
Table 9.2: Trends in the major components of assistance to families with children sub-function expenses
2011-12 2012-13 2013-14 2014-15 2015-16$m $m $m $m $m
Family tax benefit 19,934 19,927 20,896 21,456 21,963Parents income support 5,879 5,317 5,095 5,239 5,102Child care fee assistance 4,179 4,437 4,802 5,173 5,512Parent and baby payments 2,332 2,354 2,442 2,508 2,616Child support 1,234 1,275 1,305 1,338 1,372Support for the child care system 415 427 419 467 482Family relationship services 165 167 170 174 177Family support 300 142 220 222 226National Partnership Payments - child care(a) 129 78 65 nfp nfpOther 22 28 21 18 22Total 34,589 34,152 35,435 36,595 37,472
ProjectionsEstimates
(a) Estimates for National Partnership Payments — child care from 2014-15 are not for publication.
Box 8: Spreading the Benefits of the Boom package
The Government is easing cost of living pressures on families and unemployed people through the Spreading the Benefits of the Boom package announced as part of the 2012-13 Budget. Families will benefit from an additional $1.8 billion over three years from 2013-14, to provide an across the board increase in Family Tax Benefit Part A (FTB Part A). All families receiving FTB Part A will benefit from this change but those with lower incomes will benefit more. Families on the maximum rate of FTB Part A with one child will receive an additional $300 per annum and families with two or more children $600 per annum. For those receiving the base rate of FTB Part A, the increase will be $100 per annum for families with one child and $200 per annum for families with two or more children. The increased rates will come into effect from 1 July 2013.
The Spreading the Benefits of the Boom package will also provide $1.1 billion over four years from 2012-13 to provide a new income support supplement to recipients of income support payments such as Newstart Allowance, Youth Allowance and Parenting Payments. This supplement will be a non-taxable payment, paid once every six months commencing on 20 March 2013, at a rate of $210 per annum for eligible singles and $175 per annum for each member of an eligible couple.
The Spreading the Benefits of the Boom package will also invest $700 million over the forward estimates in a loss carry back to improve incentives for businesses to invest, innovate and take sensible risks.
For further information on this package, see Budget Paper No. 2, Budget Measures 2012-13.

Statement 6: Expenses and Net Capital Investment
6-31
The increase in projected expenses in the assistance to people with disabilities sub-function from 2011-12 is driven primarily by three programs — the introduction of the first stage of a National Disability Insurance Scheme (NDIS), the Disability Support Pension (DSP) and income support for carers.
Box 9: First Stage of a National Disability Insurance Scheme
The Australian, State and Territory governments have committed to working towards an NDIS and agreed their shared responsibility for this important reform.
The Australian Government will provide $1.0 billion over four years for the first stage of an NDIS. This will deliver personalised care and support for up to 10,000 people with significant and permanent disabilities and expand to support up to 20,000 people from 2014-15. Eligible individuals will be entitled to reasonable and necessary care and support that reflects their individual circumstances.
The first stage of an NDIS will occur in up to four regions, to be announced following negotiations with State and Territory governments. The Government will be seeking to share the costs with State and Territory governments of individual care and support for people with a significant and permanent disability, and will bear the full remaining costs of this initiative.
The Australian Government will provide funding for: building and operating the information technology system required to collect and analyse data; employing Local Area Coordinators to provide a more individually focused approach to delivering assistance to people with a disability; preparing the disability sector for the new way of delivering disability services with a focus on launch locations; conducting assessments of people with a disability in launch locations to determine their eligibility and the appropriate level of individual care and support; establishing a new National Disability Transition Agency; continuing the Commonwealth Taskforce responsible for providing policy advice to the government on the design, governance and funding of an NDIS; undertaking research into early interventions to improve support for people with a disability; and evaluating the outcomes being achieved in launch locations to inform further decision making.
For further information on this reform, see the press release of the Prime Minister and the Minister for Disability Reform on 30 April 2012 and Budget Paper No. 2, Budget Measures 2012-13.
DSP expenses are estimated to grow at 2.0 per cent per annum in real terms from 2012-13 over the forward years, largely driven by growth in payment rates. Estimated growth in expenses will be tempered by decreases in the projected grant rate for DSP due to the recent changes to the assessment arrangements. These arrangements require

Statement 6: Expenses and Net Capital Investment
6-32
DSP claimants to provide sufficient evidence of their future work capacity or be referred to an alternate income support payment and offered employment assistance.
Expenses for income support for carers are estimated to grow at a rate of 8.2 per cent in real terms per annum from 2012-13 over the forward estimates, largely driven by growth in payment rates and strong anticipated growth in the number of people receiving carer payments. This is attributable to the increasing number of senior Australians receiving care and assistance due to an ageing population.
The major components of the assistance to people with disabilities sub-function are outlined below in Table 9.3.
Table 9.3: Trends in the major components of assistance to people with disabilities sub-function expenses
2011-12 2012-13 2013-14 2014-15 2015-16$m $m $m $m $m
Disability support pension 14,493 14,835 15,374 16,118 16,939Income support for carers 5,723 6,277 6,986 7,776 8,568Assistance to the States for disability
services 1,209 1,278 1,347 1,425 1,500Disability employment services 1,001 999 1,022 991 961Services and support for people with a
disability 311 322 338 320 337Other 214 267 386 552 618Total 22,951 23,978 25,453 27,182 28,923
ProjectionsEstimates
Expenses for the assistance to the unemployed and the sick sub-function are forecast to increase in real terms by 2.8 per cent from 2012-13 over the forward estimates and at an average annual real rate of 0.9 per cent. The main driver of the increase in expenses for this sub-function is the introduction of the new income support supplement that will be provided under the Spreading the Benefits of the Boom package at a total cost of $1.1 billion over four years. In addition, the expenses are also impacted by forecast increases in the number of unemployment benefit recipients from 2011-12 to 2013-14.
Expenses on assistance to veterans and dependants are forecast to decrease at a steady rate largely reflecting the continuing decline in the veteran population.
Expenses for the general administration sub-function are decreasing from 2012-13 over the forward estimates due to administrative efficiencies generated from the integration of the Department of Human Services and Centrelink. While the efficiencies commence in 2012-13, the majority of efficiencies are expected in 2014-15 when the integration is expected to be complete.
The decrease from 2012-13 over the forward years of 10.0 per cent per annum in real terms in the assistance for Indigenous Australians not elsewhere classified (nec) sub-function is largely the result of funding for the CDEP program being redirected

Statement 6: Expenses and Net Capital Investment
6-33
from 1 July 2013 to the new Remote Jobs and Communities program which is classified under the other economic affairs function.
Additional funding in 2012-13 for the Stronger Futures in the Northern Territory package is partly classified under the assistance to Indigenous Australians not elsewhere classified sub-function, but is also classified under the health, education, public order and safety, and other economic affairs functions. A large component of the Stronger Futures in the Northern Territory package is not for publication from 2013-14 as it is subject to negotiation with the Northern Territory Government.
Expenses under the other welfare programs sub-function will increase from 2011-12 to 2012-13 mainly due to the reclassification of $1.0 billion for the Low Income Earners’ Superannuation Co-contribution program from the assistance to families with children sub-function.

Statement 6: Expenses and Net Capital Investment
6-34
Housing and community amenities
The housing and community amenities function includes the Australian Government’s contribution to the National Affordable Housing Specific Purpose Payments and related national partnerships, other Australian Government housing programs, the expenses of Defence Housing Australia (DHA), and various regional development and environmental protection programs.
Table 10: Summary of expenses — housing and community amenities Estimates Projections
2011-12 2012-13 2013-14 2014-15 2015-16$m $m $m $m $m
Housing 3,336 3,004 3,146 3,137 3,107Urban and regional development 585 479 661 707 549Environment protection 2,316 3,794 5,165 5,425 5,915Total housing and community amenities 6,238 7,276 8,972 9,269 9,571 Total expenses under the housing and community amenities function are estimated to increase by 22.1 per cent in real terms from 2012-13 over the forward estimates, or by 6.9 per cent per annum on average in real terms.
The housing sub-function contains initiatives relating to the Australian Government’s contribution to the National Affordable Housing Specific Purpose Payments and related National Partnerships, provision of housing for the general public and people with special needs, and the expenses of DHA.
Expenses for the sub-function will decline slightly in 2012-13 to reflect the scheduled conclusion of payments such as the Social Housing Initiative in 2011-12 and cessation of the Housing Affordability Fund in 2012-13. Otherwise, expenses are stable over the forward estimates.
The urban and regional development sub-function comprises regional development programs and services to territories, including the Regional Development Australia Fund (RDAF). Expenses are expected to fluctuate over the forward estimates, consistent with the varying nature of the projects being undertaken, and the multiple rounds being held. The increase in forecast expenses in 2013-14 and 2014-15 and subsequent decrease from 2014-15 to 2015-16 is primarily due to the funding profile of the $573 million component of the RDAF which is funded by the Minerals Resource Rent Tax.
The environment protection sub-function includes expenses for a variety of initiatives including the protection and conservation of the environment, water and waste management, pollution abatement and environmental research. The large increase in expenses from 2012-13 is primarily due to the implementation of various programs under the Clean Energy Futures package announced on 10 July 2011. This package includes a number of programs designed to assist the most emissions-intensive activities in the economy to transition to a carbon-constrained future (for example, the

Statement 6: Expenses and Net Capital Investment
6-35
Jobs and Competitiveness Program and Energy Security Fund) and programs which support land and natural resource management activities (for example, the Biodiversity Fund).
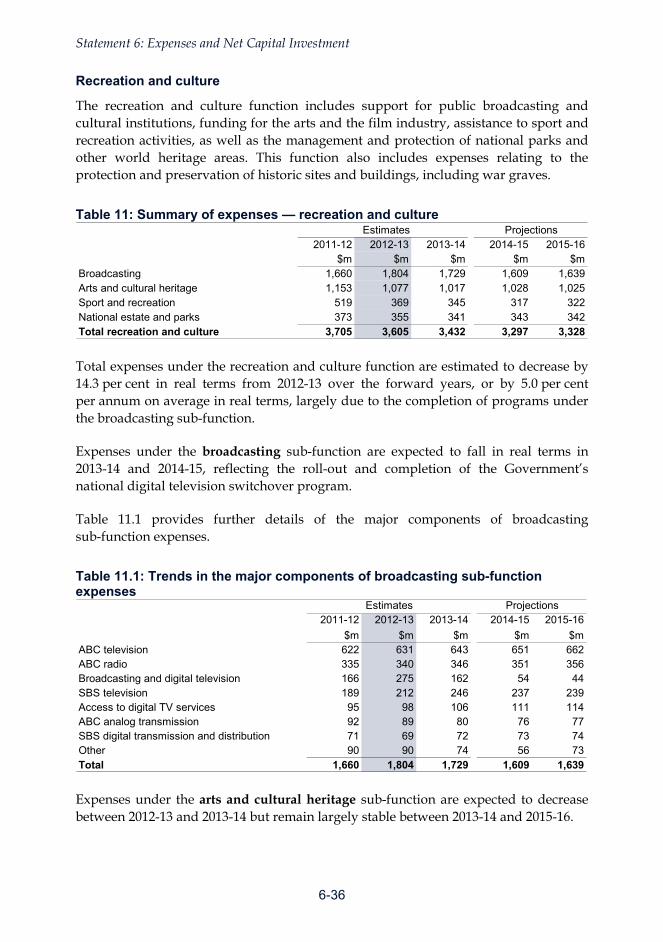
Statement 6: Expenses and Net Capital Investment
6-36
Recreation and culture
The recreation and culture function includes support for public broadcasting and cultural institutions, funding for the arts and the film industry, assistance to sport and recreation activities, as well as the management and protection of national parks and other world heritage areas. This function also includes expenses relating to the protection and preservation of historic sites and buildings, including war graves.
Table 11: Summary of expenses — recreation and culture Estimates Projections
2011-12 2012-13 2013-14 2014-15 2015-16$m $m $m $m $m
Broadcasting 1,660 1,804 1,729 1,609 1,639Arts and cultural heritage 1,153 1,077 1,017 1,028 1,025Sport and recreation 519 369 345 317 322National estate and parks 373 355 341 343 342Total recreation and culture 3,705 3,605 3,432 3,297 3,328 Total expenses under the recreation and culture function are estimated to decrease by 14.3 per cent in real terms from 2012-13 over the forward years, or by 5.0 per cent per annum on average in real terms, largely due to the completion of programs under the broadcasting sub-function.
Expenses under the broadcasting sub-function are expected to fall in real terms in 2013-14 and 2014-15, reflecting the roll-out and completion of the Government’s national digital television switchover program.
Table 11.1 provides further details of the major components of broadcasting sub-function expenses.
Table 11.1: Trends in the major components of broadcasting sub-function expenses
2011-12 2012-13 2013-14 2014-15 2015-16
$m $m $m $m $mABC television 622 631 643 651 662ABC radio 335 340 346 351 356Broadcasting and digital television 166 275 162 54 44SBS television 189 212 246 237 239Access to digital TV services 95 98 106 111 114ABC analog transmission 92 89 80 76 77SBS digital transmission and distribution 71 69 72 73 74Other 90 90 74 56 73Total 1,660 1,804 1,729 1,609 1,639
Estimates Projections
Expenses under the arts and cultural heritage sub-function are expected to decrease between 2012-13 and 2013-14 but remain largely stable between 2013-14 and 2015-16.

Statement 6: Expenses and Net Capital Investment
6-37
The sport and recreation sub-function includes programs to improve participation in sport and recreational activities, and achieve excellence in high performing athletes. The forecast decrease in expenses from 2013-14 largely reflects completion of the Active After-school Communities program, which has been extended by one calendar year to December 2013. See Budget Paper No. 2, Budget Measures 2012-13 for more details.
Expenses under the national estate and parks sub-function are expected to decrease slightly over the forward estimates. The decrease largely reflects a reduction in funding for the Australian-Antarctic Program from 2012-13 and the Great Barrier Reef Marine Park Authority from 2013-14.

Statement 6: Expenses and Net Capital Investment
6-38
Fuel and energy
The fuel and energy function includes expenses for the Fuel Tax Credits, Cleaner Fuels and Product Stewardship Waste (Oil) schemes, administered by the Australian Taxation Office. It also includes expenses related to improving Australia’s energy efficiency, resource related initiatives, and programs to support the production or use of alternative fuels, including ethanol and biodiesel.
Table 12: Summary of expenses — fuel and energy Estimates Projections
2011-12 2012-13 2013-14 2014-15 2015-16$m $m $m $m $m
Fuel and energy 6,633 6,523 7,832 7,993 8,190Total fuel and energy 6,633 6,523 7,832 7,993 8,190 Fuel and energy expenses are estimated to increase by 16.5 per cent in real terms from 2012-13 over the forward years, or by 5.2 per cent per annum on average.
The major program within this function is the Fuel Tax Credits Scheme which is expected to see an increase across the budget and forward estimates, reflecting increased claims by eligible businesses commensurate with higher diesel consumption, particularly in the mining industry.
Changes in the Fuel Tax Credit estimates also reflect, from 1 July 2012, the completion of the phasing in of fuel tax credits on fuel used in off-road activities such as construction, manufacturing, wholesale, retail, property management and landscaping. This increase is offset by the introduction of the carbon pricing mechanism which from 1 July 2012 reduces fuel tax credit entitlements in place of incurring carbon pricing for off-road fuel use.
In 2013-14, opt-in arrangements will allow large off-road fuel users to opt into the carbon pricing mechanism which will restore their full fuel tax credit entitlements. Subject to enabling legislation, from 1 July 2014 eligible on-road fuel users that choose not to opt into the carbon pricing scheme will also claim reduced fuel tax credits.
Table 12.1 provides further details of the fuel and energy sub-function expenses.

Statement 6: Expenses and Net Capital Investment
6-39
Table 12.1: Trends in the major components of fuel and energy sub-function expenses
2011-12 2012-13 2013-14 2014-15 2015-16$m $m $m $m $m
Fuel tax credits scheme 5,732 5,600 6,179 5,880 5,919Resources related initiatives and
management 287 362 379 623 670Australian Renewable Energy Agency
(ARENA) - 293 345 437 322Other 614 269 929 1,053 1,279Total 6,633 6,524 7,832 7,993 8,190
Estimates Projections
The increase in expenses under the Resources Related Initiatives and Management component from 2012-13 mainly relates to the anticipated scale-up of projects under the Carbon Capture and Storage Flagships program and a growth in expenses under the Ethanol Production Grants program.
The Australian Renewable Energy Agency (ARENA) component reflects the commencement of the agency on 1 July 2012. ARENA will administer a range of Government support programs for research and development, demonstration and commercialisation of renewable energy projects, including some programs previously administered by the Department of Resources, Energy and Tourism. The fluctuation in expenses after 2012-13 is largely driven by the expected timing of projects.
The fluctuation in expenses under the Other component partly reflects the timing of the rollout of the Coal Sector Jobs package. The package assists the most emissions-intensive coal mines to transition to a carbon price. The increase in expenses from 2013-14 relates to the anticipated scale-up of projects funded from the Low Emissions Technology Demonstration Fund.

Statement 6: Expenses and Net Capital Investment
6-40
Agriculture, forestry and fishing
The agriculture, forestry and fishing function expenses support assistance to primary producers, forestry, fishing, land and water resources management, quarantine services and contributions to research and development.
Table 13: Summary of expenses — agriculture, forestry and fishing Estimates Projections
2011-12 2012-13 2013-14 2014-15 2015-16$m $m $m $m $m
Wool industry 64 61 57 57 57Grains industry 170 178 180 183 184Dairy industry 49 53 54 55 57Cattle, sheep and pig industry 180 180 184 188 190Fishing, horticulture and other agriculture 243 243 247 243 241General assistance not allocated to
specific industries 26 28 28 29 29Rural assistance 281 103 154 131 119Natural resources development 1,581 1,146 983 1,094 1,515General administration 662 616 689 684 724Total agriculture, forestry and fishing 3,255 2,609 2,576 2,662 3,114 Total expenses under this function are estimated to increase by 10.8 per cent in real terms from 2012-13 over the forward years, or by 3.5 per cent per annum on average. Expenses for the rural assistance sub-function are estimated to increase by 6.8 per cent in real terms over the forward estimates. The estimated reduction in expenditure between 2011-12 and 2012-13 reflects a general return to normal seasonal conditions across Australia and an anticipated reduction in spending on drought assistance assumed to be maintained over the forward estimates. The increase in estimated expenses in 2013-14, and the subsequent reduction over 2014-15 and 2015-16, is driven by the introduction of the Carbon Farming Futures program (CFF) announced in the 2011-12 MYEFO. CFF is a grants program that encourages the farming industry to reduce greenhouse gas emissions on the land. The majority of grants expenditure for the program is expected to be incurred in 2013-14.
Expenses under the natural resources development sub-function are driven by the Water for the Future package, which comprises urban and rural programs, including funding for water purchasing (included under net capital investment), irrigation modernisation, desalination, recycling and stormwater capture. The fluctuation in annual expenses largely reflects the progressive completion by 2015-16 of projects under the National Urban Water and Desalination Plan and the National Water Security Plan for Cities and Towns, and a scaling up of projects under the Sustainable Rural Water Use and Infrastructure Program from 2014-15.
The components in the natural resources development sub-function, including major water initiatives, are set out in Table 13.1.

Statement 6: Expenses and Net Capital Investment
6-41
Table 13.1: Trends in the major components of natural resources development sub-function expenses
Estimates Projections2011-12 2012-13 2013-14 2014-15 2015-16
$m $m $m $m $mWater reform(a)
Sustainable rural water use and infrastructure 611 593 615 778 1207National urban water and desalination plan 321 125 35 28 14National water security plan for cities and towns 88 70 15 8 3Other water reform 80 43 64 24 25
Sustainable management - natural resources 49 42 37 37 37Forestry industry 54 9 9 9 9Other 378 264 208 210 220Total 1,581 1,146 983 1,094 1,515
(a) Water Reform also includes the programs: National Partnership Payments — Water and Natural Resources; and Commonwealth Environmental Water.

Statement 6: Expenses and Net Capital Investment
6-42
Mining, manufacturing and construction
The mining, manufacturing and construction function includes expenses designed to assist the efficiency and competitiveness of Australian industries. The major components include the Research and Development Tax Incentive and programs specific to the automotive, textile, clothing and footwear industries.
Table 14: Summary of expenses — mining, manufacturing and construction Estimates Projections
2011-12 2012-13 2013-14 2014-15 2015-16$m $m $m $m $m
Mining, manufacturing and construction 2,114 2,084 2,128 2,224 2,398Total mining, manufacturing
and construction 2,114 2,084 2,128 2,224 2,398 Total expenses under the mining, manufacturing and construction function are expected to increase by 6.8 per cent in real terms from 2012-13 over the forward years.
The increase in expenses from 2012-13 for the Research and Development Tax Incentive, administered by the Australian Taxation Office, drives much of the increase in expenses for this function and reflects an expected increase in claims. Expenses under the industry development and investment component of this function are also expected to increase from 2012-13 due to the introduction of a number of industry assistance measures as part of the Clean Energy Futures package and the reprofiling of existing funding for industry assistance measures for the automotive industry. The forecast decrease in expenses in 2012-13 from 2011-12 for industry development and investment reflects the impact of bringing forward funding for the Steel Transformation Plan to encourage investment and innovation in the Australian steel manufacturing industry.
Table 14.1 provides further details of the major components of the mining, manufacturing and construction sub-function expenses.
Table 14.1: Trends in major components of mining, manufacturing and construction sub-function expenses
2011-12 2012-13 2013-14 2014-15 2015-16$m $m $m $m $m
Research and development tax incentive 1,137 1,201 1,268 1,339 1,414Industry development and investment 816 685 698 731 845Other 161 198 162 154 139Total 2,114 2,084 2,128 2,224 2,398
ProjectionsEstimates

Statement 6: Expenses and Net Capital Investment
6-43
Transport and communication
The transport and communication function supports the infrastructure and regulatory framework for Australia’s transport and communication sectors.
Table 15: Summary of expenses — transport and communication Estimates Projections
2011-12 2012-13 2013-14 2014-15 2015-16$m $m $m $m $m
Communication 892 585 559 530 510Rail transport(a) 1,066 964 1,319 903 901Air transport 247 214 196 194 198Road transport(a) 6,294 2,674 3,599 4,110 2,775Sea transport 305 308 317 327 335Other transport and communication 373 304 713 908 881Total transport and communication 9,178 5,048 6,702 6,973 5,600 (a) Most road and rail funding in 2014-15 and 2015-16, which is currently classified under the road transport
sub-function, will be reclassified between the road and rail transport sub-functions as programs of work are determined.
Total expenses under this function are estimated to decrease between 2011-12 and 2012-13 largely due to the bringing forward of $1.8 billion to 2011-12, including for the early completion of some projects. There will also be a deferral of around $500 million from projects in 2012-13 to 2013-14 and later years. Total expenses are forecast to increase by 3.0 per cent in real terms from 2012-13 over the forward years, or by 1.0 per cent per annum on average in real terms.
The expenses under the road transport sub-function primarily consist of grants provided under the Nation Building program, including funding provided for projects under the Building Australia Fund (BAF). Expense estimates for this sub-function fluctuate year on year as payments correspond to milestone and project timelines. The decline in estimated expenses from 2011-12 is largely due to projects funded as a response to the global financial crisis nearing their completion and the acceleration of payments to various projects under the Nation Building program, the BAF and the Regional Infrastructure Fund (RIF) resulting in an increase in payments in 2011-12 and a decrease in the forward years.
The next five year Nation Building program (Nation Building 2) begins in 2014-15. Although the Government has not yet finalised the details of the program, a provision is recorded against the road transport sub-function. Funds will be split between the road transport and the rail transport sub-functions at a later date. The program will continue road infrastructure projects with funding for, among other things, the Government’s election commitments for the Richmond Bridge in New South Wales, Princes Highway West in Victoria, Calliope Crossroads in Queensland, Great Eastern Highway in Western Australia and Tasman Highway in Tasmania. Funding includes an allocation for the continuation of the Roads to Recovery program, to improve safety at black spots, and the Heavy Vehicle Safety and Productivity program.

Statement 6: Expenses and Net Capital Investment
6-44
The increase in estimated expenses in the rail transport sub-function between 2012-13 and 2013-14 is mainly due to metropolitan rail infrastructure funding provided as part of the Nation Building Plan for the Future package in the 2009-10 Budget. This package includes projects funded from the BAF such as a $3.2 billion contribution over six years towards the Regional Rail Express project in Victoria. Nation Building 2 is also expected to continue rail infrastructure investment with funds for continued payments for the Moreton Bay Rail Link project in Queensland.
The estimated expenses for the air transport and sea transport sub-functions predominantly relate to the activities of the safety regulators — the Civil Aviation Safety Authority, the Australian Maritime Safety Authority (AMSA) and the Australian Transport Safety Bureau (ATSB). The increase in the estimated expenses for the sea transport sub-function is due to the National Transport Reforms which seek to establish national transport safety through expanding ATSB’s safety investigation responsibilities and AMSA’s maritime safety function. The decline in expenses in the air transport sub-function over the forward estimates is primarily due to the winding down of the Regional Aviation Access program in mid-2013.
The increase in estimated expenses in the other transport and communication sub-function, commencing in 2013-14 and rising in each year thereafter, reflects funding for the Regional Infrastructure Fund announced in the context of the Minerals Resource Rent Tax.
The decline in real terms of estimated expenses in the communication sub-function from 2012-13 reflects the completion of several digital productivity measures and the planned completion of activities related to the renewal, replanning and sale of radio frequency spectrum. This sub-function does not reflect the Government’s equity investment in the National Broadband Network.

Statement 6: Expenses and Net Capital Investment
6-45
Other economic affairs
The other economic affairs function includes expenses on tourism and area promotion, labour market assistance, immigration, industrial relations and other economic affairs not elsewhere classified (nec).
Table 16: Summary of expenses — other economic affairs Estimates Projections
2011-12 2012-13 2013-14 2014-15 2015-16$m $m $m $m $m
Tourism and area promotion 171 177 184 182 172Total labour and employment affairs 4,765 4,515 4,601 4,573 4,568
Vocational and industry training 1,982 1,719 1,706 1,703 1,677Labour market assistance to job seekers
and industry 2,088 2,119 2,231 2,204 2,217Industrial relations 694 677 664 667 674
Immigration 2,475 2,383 2,262 2,205 2,277Other economic affairs nec 2,347 2,256 2,244 2,274 2,224Total other economic affairs 9,758 9,331 9,290 9,234 9,242 Total expenses under the other economic affairs function are projected to decrease by 8.1 per cent in real terms from 2012-13 over the forward years, or by 2.8 per cent per annum on average in real terms.
Tourism and area promotion sub-function expenses are expected to increase from 2012-13 as a result of the introduction of the Asia Marketing Fund, which will support the promotion of Australia to growing markets in Asia. The subsequent projected decrease in expenses from 2014-15 is the result of the winding down and cessation of several tourism related initiatives, including the TQUAL Grants program from the end of 2014-15.
The reduction in expenses under the vocational and industry training sub-function between 2011-12 and 2012-13 is attributable to the redirection of funding from the Productivity Places program to the Skills Reform National Partnership which will provide $1.75 billion in total over five years from 2012-13. These expenses are included in the vocational and other education sub-function within the education function.
The slight decrease in expenses over the forward estimates in the vocational and industry training sub-function is largely due to the progressive termination of a number of short term programs announced in the 2011-12 Budget as part of the Building Australia’s Future Workforce package. These programs include: the Productivity Education and Training Fund; Investing in Experience — Skills Recognition and Training (previously called More Help for Mature Age Workers); and the Australian Apprenticeships Mentoring Program. The profile of expenses also reflects redirections in the Workforce Innovation, Vocational Education and Training National Support and Australian Apprenticeships Incentives Programs. See Budget Paper No. 2, Budget Measures 2012-13 for more details.

Statement 6: Expenses and Net Capital Investment
6-46
The expenses under the labour market assistance to job seekers and industry sub-function are estimated to decrease by an average of 1.0 per cent per annum in real terms from 2012-13 over the forward estimates. This decrease reflects an estimated reduction in expenses of Job Services Australia, the completion of the National Green Jobs Corp program on 31 December 2011, and the completion of the Productive Ageing package on 30 June 2014. The increase in expenses for this sub-function between 2012-13 and 2013-14 can be attributed to the redirection of the majority of CDEP resourcing, previously classified under the social security and welfare function, to partially fund the new Remote Jobs and Communities program commencing on 1 July 2013.
Industrial relations sub-function expenses are expected to decline in real terms over the forward estimates. The estimated decrease in expenses in 2013-14 compared to the previous years is mainly due to the cessation of the transitional education activities that support the implementation of the national workplace relations system for the private sector announced in the 2010-11 Budget.
Estimated expenses in the immigration sub-function are expected to fall slightly over the forward estimates. This fall is driven by costs associated with Irregular Maritime Arrivals (IMAs). While expenses associated with accommodating and processing IMAs have increased since the 2011-12 MYEFO, these expenses will decline over the forward estimates as a result of the increasing use of lower cost detention options.
Under the other economic affairs nec sub-function, the substantial decrease in expenses in 2012-13 is primarily due to the closure of the Green Car Innovation Fund within the Innovative Industry program, which was closed to new applicants in the 2011-12 Budget. Total expenses under this sub-function are estimated to decrease by 8.5 per cent in real terms between 2012-13 and 2015-16.

Statement 6: Expenses and Net Capital Investment
6-47
Table 16.1 provides further details of trends in major components of the other economic affairs nec sub-function expenses.
Table 16.1: Trends in major components of the other economic affairs nec sub-function expenses
2011-12 2012-13 2013-14 2014-15 2015-16$m $m $m $m $m
Innovative industry 379 313 318 333 280Trade, education and investment development 198 188 185 188 186Export market development grants scheme 150 150 150 150 150Operating costs for:
Department of Industry, Innovation, Science,Research and Tertiary Education 430 424 410 404 401
Australian Securities and Investments Commission 392 396 393 384 376
Bureau of Meteorology 328 325 323 325 328IP Australia 154 169 177 182 185Australian Competition and Consumer
Commission 172 155 147 145 144Other 144 136 141 163 174Total 2,347 2,256 2,244 2,274 2,224
ProjectionsEstimates

Statement 6: Expenses and Net Capital Investment
6-48
Other purposes
The other purposes function includes expenses incurred in the servicing of public debt interest, and assistance to state, territory and local governments. This function also includes items classified to natural disaster relief, the Contingency Reserve (see Appendix B for a detailed description), and expenses related to the nominal interest on unfunded liabilities for government superannuation benefits.
Table 17: Summary of expenses — other purposes Estimates Projections
2011-12 2012-13 2013-14 2014-15 2015-16$m $m $m $m $m
Public debt interest 11,510 12,017 12,013 11,635 11,416Interest on Commonwealth Government's behalf 11,510 12,017 12,013 11,635 11,416
Nominal superannuation interest 7,358 8,015 8,295 8,587 8,908General purpose inter-government
transactions 49,555 50,519 54,381 57,049 59,726General revenue assistance -
States and Territories 46,714 49,381 52,039 54,632 57,214Local government assistance 2,841 1,138 2,342 2,417 2,512
Natural disaster relief(a) 815 113 105 40 0Contingency reserve -1,426 -670 1,583 4,838 9,083Total other purposes 67,812 69,994 76,377 82,150 89,132
(a) Amounts for the Natural Disaster Relief and Recovery Arrangements (NDRRA) reflect expenses being recorded in the year in which the disaster occurs rather than when payments are made to State or Territory Governments in relation to Commonwealth financial obligations under the NDRRA.
Total expenses under the other purposes function are estimated to increase by 18.2 per cent in real terms from 2012-13 over the forward years, or by 5.7 per cent per annum in real terms.
The increase in expenses over the forward estimates under the other purposes function is primarily driven by general revenue assistance paid to State and Territory governments, nearly all of which comprise payments of GST revenue grants which are provided on an ‘untied’ basis. The forecast growth in payments to the States and Territories for the GST has been revised down since the 2011-12 MYEFO in line with forecast reductions in GST revenue. Payments to State and Territory governments tied to specific purposes are reported under the relevant sections in this statement. Further information on general revenue assistance to the States and Territories can be found in Budget Paper No. 3, Australia’s Federal Relations 2012-13.
The increase in expenses under the public debt interest sub-function to 2012-13 is due to the increased issuance of Commonwealth Government Securities. Expenses under the nominal superannuation interest sub-function are projected to increase over time, reflecting the growth in the Commonwealth’s superannuation liability. The Future Fund was established to assist in meeting the cost of this liability. Further information on the Future Fund can be found in Statement 7 of Budget Paper No. 1.

Statement 6: Expenses and Net Capital Investment
6-49
Expenses in the local government assistance sub-function predominantly relate to financial assistance grants made to the States and Territories and consist of a general purpose component and an identified local road component, both of which are untied, allowing councils to direct the grants to local priorities. Expenses are higher in 2011-12 but then reduce in 2012-13 as a result of the Government’s decision to pay the first two quarterly instalments of the expected 2012-13 local government financial assistance grants of $1.1 billion to local councils in 2011-12. This is to provide local governments with additional flexibility to respond to residual economic challenges arising from natural disasters in 2010-11 and 2011-12 and other pressures. Expenses are expected to increase from 2013-14 across the forward estimates due to forecast population increases and changes in the Consumer Price Index (local government funding provided by the Commonwealth is linked to population and inflation). Also included in this sub-function are expenses under the Regional and Local Community Infrastructure program which is scheduled to finish in 2011-12. Further information on Commonwealth Government assistance to local governments can be found in Budget Paper No.3, Australia’s Federal Relations 2012-13.
The expenses under the natural disaster relief sub-function from 2011-12 to 2015-16 relate mainly to the major natural disasters since 2009-10, including the 2012 floods. Commonwealth payments provide financial support for the affected States and Territories under the Natural Disaster Relief and Recovery Arrangements.
The increase in expenses in the contingency reserve sub-function from 2012-13 is largely due to the conservative bias allowance (CBA). The CBA is a mechanism used to improve the accuracy of the forward estimates by anticipating the tendency for the estimates of existing policy to be revised upwards through time. The allowance is progressively unwound at each MYEFO and budget until it is completely removed for the budget year. This regular drawing down of the CBA reflects the fact that the tendency for underestimating payments diminishes as the forecast year gets closer. The Contingency Reserve is discussed in more detail at Appendix B.

Statement 6: Expenses and Net Capital Investment
6-50
General government net capital investment
Net capital investment is broadly defined as the sale and acquisition of non-financial assets less depreciation expenses. It provides a measure of the overall growth in capital assets (including buildings and infrastructure, specialist military equipment, and computer software) after taking into account depreciation and amortisation as previously acquired assets age.
Australian Government general government sector net capital investment is expected to be negative $2.7 billion in 2012-13, $7.5 billion lower than in 2011-12. This change is largely due to a reduction in the acquisition of Defence assets, along with the sale of some non-financial assets.
Table 18: Estimates of total net capital investment MYEFO Revised Estimates Projections2011-12 2011-12 2012-13 2013-14 2014-15 2015-16
Total net capital investment ($m) 4,813 4,749 -2,701 1,048 1,361 1,059
Per cent of GDP 0.3 0.3 -0.2 0.1 0.1 0.1 Reconciliation of net capital investment since the 2011-12 Budget
A reconciliation of the net capital investment estimates, showing the effect of policy decisions and parameter and other variations since the 2011-12 Budget, is provided in Table 19.
Table 19: Reconciliation of net capital investment estimates Estimates Projections
2011-12 2012-13 2013-14 2014-15$m $m $m $m
2011-12 Budget net capital investment 4,405 -1,367 3,034 3,160
Changes from 2011-12 Budget to 2011-12 MYEFOEffect of policy decisions(a) -175 -424 -200 -251Effect of parameter and other variations 583 -94 -74 -16Total variations 408 -518 -274 -267
2011-12 MYEFO net capital investment 4,813 -1,885 2,760 2,893
Changes from 2011-12 MYEFO to 2012-13 BudgetEffect of policy decisions(a) 46 -532 -930 -648Effect of parameter and other variations -110 -285 -781 -884Total variations -64 -816 -1,711 -1,531
2012-13 Budget net capital investment 4,749 -2,701 1,048 1,361 (a) Excludes secondary impacts on public debt interest of policy decisions and offsets from the Contingency
Reserve for decisions taken.

Statement 6: Expenses and Net Capital Investment
6-51
The forecast net capital investment for 2012-13 is largely unchanged since the 2011-12 MYEFO.
A discussion of changes between the 2011-12 MYEFO and the 2012-13 Budget, shown in the table above, can be found in Statement 3. Further information on the capital measures since MYEFO can be found in Budget Paper No. 2, Budget Measures 2012-13.

Statement 6: Expenses and Net Capital Investment
6-52
Net capital investment estimates by function
Estimates for Australian Government general government sector net capital investment by function for the period 2011-12 to 2015-16 are provided in Table 20.
Table 20: Estimates of net capital investment by function Estimates Projections
2011-12 2012-13 2013-14 2014-15 2015-16$m $m $m $m $m
General public services 468 579 533 277 -19Defence 2,408 986 739 1,023 2,368Public order and safety 220 188 8 46 -84Education 7 10 10 4 3Health 280 66 -16 -47 -44Social security and welfare 103 -71 -79 -67 -117Housing and community amenities 182 35 -38 -92 -22Recreation and culture 71 26 6 1 -19Fuel and energy 11 -7 -2 -1 0Agriculture, forestry and fishing 596 155 146 346 411Mining, manufacturing and construction 18 21 11 1 3Transport and communication 36 7 -12 -38 -31Other economic affairs 146 -49 -95 -102 -79Other purposes 203 -4,649 -163 11 -1,311Total net capital investment 4,749 -2,701 1,048 1,361 1,059 A significant component of the Government’s net capital investment in 2012-13 occurs in the defence function. These investments reflect the acquisition of military equipment and the construction of support facilities. Such investments can experience uneven expenditure throughout their development and life cycle extending over long periods of time, and can contribute to fluctuations in levels of net capital investment from year to year. Major factors contributing to changes in net capital investment, expected to occur in the following functions, include:
• defence — reprogramming funding over the forward estimates for the Defence capital investment program. The reprogramming reflects deferring some Defence acquisitions and adjusting the Defence capital equipment program, while delivering priority 2009 Defence White Paper capabilities;
• general public services — replacement of a research vessel for the Commonwealth Scientific and Industrial Research Organisation funded through the Education Investment Fund;
• public order and safety — the fit out of the central office accommodation for the Australian Security Intelligence Organisation and the replacement of existing Bay Class vessels and information communication technology hardware together with refurbishment and accommodation activities by the Australian Customs and Border Protection Service; and

Statement 6: Expenses and Net Capital Investment
6-53
• agriculture, forestry and fishing — investment in water entitlements under the Water for the Future package, to address water over-allocation in the Murray-Darling Basin, which is expected to decline in 2012-13 and 2013-14.
Table 21 reports the acquisition of non-financial assets by function before taking into account depreciation or amortisation.
Table 21: Australian Government general government sector purchases of non-financial assets by function
Estimates Projections2011-12 2012-13 2013-14 2014-15 2015-16
$m $m $m $m $mGeneral public services 949 1,325 821 677 1,584Defence 5,988 4,662 4,461 4,758 6,133Public order and safety 538 515 359 403 290Education 34 25 25 19 18Health 332 134 95 67 72Social security and welfare 374 235 247 281 250Housing and community amenities 250 168 138 124 125Recreation and culture 358 312 298 295 278Fuel and energy 16 -5 1 1 1Agriculture, forestry and fishing 620 181 171 370 432Mining, manufacturing and construction 27 29 19 8 8Transport and communication 101 75 58 28 32Other economic affairs 516 347 309 295 312Other purposes 203 34 50 37 46General government purchases
of non-financial assets 10,304 8,040 7,051 7,363 9,579

Statement 6: Expenses and Net Capital Investment
6-54
Trends in Australian Government staffing
Trends in the estimated annual average staffing level (ASL)1 for all agencies in the General Government Sector are reported in Table 22 below. The data provides a summary of people employed by the Australian Government, including all Defence Force personnel and those employed by Statutory Authorities.
Table 22: Estimates of Average Staff Levels 2005-06 2006-07 2007-08 2008-09 2009-10 2010-11 2011-12 2012-13227,013 238,623 248,217 250,566 258,321 261,891 261,637 258,563
The 2011-12 Budget papers estimated 262,995 ASL in 2011-12. The current estimate is 261,637 ASL in 2011-12. The 2012-13 Budget is expected to result in a reduction in ASL of 3,073 in 2012-13 across the General Government Sector.
Appendix C provides details of ASL at the portfolio and agency level.
1 ASL figures reflect the average number of employees receiving salary or wages over the
financial year, with adjustments for casual and part-time staff, to show the average full time equivalent (FTE). ASL figures also include non-uniformed staff and overseas personnel.

Statement 6: Expenses and Net Capital Investment
6-55
APPENDIX A: EXPENSE BY FUNCTION AND SUB-FUNCTION
Table A1: Estimates of expenses by function and sub-function Actuals Estimates Projections
2010-11 2011-12 2012-13 2013-14 2014-15 2015-16
$m $m $m $m $m $m
General public services
Legislative and executive affairs 1,039 1,010 974 1,206 1,176 991
Financial and fiscal affairs 7,834 7,663 7,770 7,683 7,917 8,148
Foreign affairs and economic aid 5,564 5,798 6,254 6,918 7,571 8,537
General research 2,687 2,789 2,720 2,598 2,550 2,501
General services 1,208 841 858 859 863 892
Government superannuation benefits 4,150 3,843 3,479 3,525 3,564 3,616
Total general public services 22,481 21,944 22,054 22,790 23,641 24,686
Defence 20,408 21,656 21,559 22,212 23,129 24,453
Public order and safety
Courts and legal services 803 869 857 860 862 869
Other public order and safety 3,020 3,203 3,100 3,075 3,073 3,123
Total public order and safety 3,823 4,072 3,957 3,935 3,934 3,992
Education
Higher education 7,722 8,579 8,917 9,302 9,752 10,188
Vocational and other education 1,887 1,997 1,889 1,929 2,096 2,091
Schools 11,188 12,308 12,872 13,487 14,468 15,396
Non-government schools 7,261 7,734 8,311 8,977 9,691 10,457
Government schools 3,926 4,574 4,561 4,510 4,777 4,939
Student assistance 4,567 4,121 4,115 4,215 4,396 4,514
General administration 387 314 258 258 258 260
School education - specific funding 6,355 1,940 1,522 738 713 1,396
Total education 32,106 29,259 29,572 29,929 31,683 33,846
Health
Medical services and benefits(a) 23,247 24,199 23,679 24,483 25,819 27,198
Hospital services(b) 2,627 2,890 2,597 2,774 2,027 1,903
National Health Reform Payment(c) 12,063 12,694 13,504 14,368 15,928 17,623
Pharmaceutical benefits and services 10,040 10,539 10,889 11,619 12,393 13,166
Aboriginal and Torres Strait Islander health 650 742 764 780 765 789
Health services 5,627 6,974 6,400 6,816 6,954 7,117
General administration 1,817 3,130 3,169 3,247 3,288 3,341
Total health 56,070 61,168 61,003 64,088 67,175 71,137
Social security and welfare
Assistance to the aged 44,493 48,675 51,138 54,221 57,305 61,344
Assistance to veterans and dependants 7,022 7,071 6,898 6,912 6,837 6,770
Assistance to people with disabilities 20,734 22,951 23,978 25,453 27,182 28,923
Assistance to families with children 31,286 34,589 34,152 35,435 36,595 37,472

Statement 6: Expenses and Net Capital Investment
6-56
Table A1: Estimates of expenses by function and sub-function (continued) Actuals Estimates Projections
2010-11 2011-12 2012-13 2013-14 2014-15 2015-16
$m $m $m $m $m $m
Social security and welfare
(continued)
Assistance to the unemployed and
the sick 6,965 7,449 8,783 9,795 8,994 9,727
Other welfare programs 2,174 974 1,707 1,748 1,702 1,707
Assistance for Indigenous Australians nec(d) 1,180 1,366 1,200 969 932 943
General administration 3,241 3,804 3,800 3,708 3,539 3,468
Total social security and welfare 117,093 126,879 131,656 138,241 143,085 150,354
Housing and community amenities
Housing 4,352 3,336 3,004 3,146 3,137 3,107
Urban and regional development 354 585 479 661 707 549
Environment protection 837 2,316 3,794 5,165 5,425 5,915
Total housing and community
amenities 5,543 6,238 7,276 8,972 9,269 9,571
Recreation and culture
Broadcasting 1,489 1,660 1,804 1,729 1,609 1,639
Arts and cultural heritage 1,081 1,153 1,077 1,017 1,028 1,025
Sport and recreation 349 519 369 345 317 322
National estate and parks 333 373 355 341 343 342
Total recreation and culture 3,252 3,705 3,605 3,432 3,297 3,328
Fuel and energy 5,914 6,633 6,523 7,832 7,993 8,190
Agriculture, forestry and fishing
Wool industry 57 64 61 57 57 57
Grains industry 156 170 178 180 183 184
Dairy industry 48 49 53 54 55 57
Cattle, sheep and pig industry 166 180 180 184 188 190
Fishing, horticulture and other agriculture 225 243 243 247 243 241
General assistance not allocated to
specific industries 21 26 28 28 29 29
Rural assistance 498 281 103 154 131 119
Natural resources development 769 1,581 1,146 983 1,094 1,515
General administration 606 662 616 689 684 724
Total agriculture, forestry and fishing 2,546 3,255 2,609 2,576 2,662 3,114
Mining, manufacturing
and construction 1,456 2,114 2,084 2,128 2,224 2,398
Transport and communication
Communication 428 892 585 559 530 510
Rail transport(e) 539 1,066 964 1,319 903 901
Air transport 196 247 214 196 194 198
Road transport(e) 2,980 6,294 2,674 3,599 4,110 2,775
Sea transport 282 305 308 317 327 335
Other transport and communication 239 373 304 713 908 881
Total transport and communication 4,664 9,178 5,048 6,702 6,973 5,600

Statement 6: Expenses and Net Capital Investment
6-57
Table A1: Estimates of expenses by function and sub-function (continued) Actuals Estimates Projections
2010-11 2011-12 2012-13 2013-14 2014-15 2015-16
$m $m $m $m $m $m
Other economic affairs
Tourism and area promotion 158 171 177 184 182 172
Total labour and employment affairs 4,669 4,765 4,515 4,601 4,573 4,568
Vocational and industry training 1,726 1,982 1,719 1,706 1,703 1,677
Labour market assistance to job
seekers and industry 2,320 2,088 2,119 2,231 2,204 2,217
Industrial relations 623 694 677 664 667 674
Immigration 2,206 2,475 2,383 2,262 2,205 2,277
Other economic affairs nec 2,013 2,347 2,256 2,244 2,274 2,224
Total other economic affairs 9,046 9,758 9,331 9,290 9,234 9,242
Other purposes
Public debt interest 9,273 11,510 12,017 12,013 11,635 11,416
Interest on Commonwealth
Government's behalf 9,273 11,510 12,017 12,013 11,635 11,416
Nominal superannuation interest 6,997 7,358 8,015 8,295 8,587 8,908
General purpose inter-government
transactions 49,298 49,555 50,519 54,381 57,049 59,726
General revenue assistance -
States and Territories 46,964 46,714 49,381 52,039 54,632 57,214
Local government assistance 2,334 2,841 1,138 2,342 2,417 2,512
Natural disaster relief(f) 6,129 815 113 105 40 0
Contingency reserve 0 -1,426 -670 1,583 4,838 9,083
Total other purposes 71,696 67,812 69,994 76,377 82,150 89,132
Total expenses 356,100 373,671 376,273 398,503 416,449 439,044 (a) The estimated financial impact of premium growth on the forward estimates for the Private Health Insurance
Rebate has been allocated to the Contingency Reserve, due to commercial sensitivities. (b) The hospital services sub-function includes payments from the Commonwealth to the States and Territories for
specific hospital improvement initiatives and is in addition to hospital funding provided under the National health reform payment sub-function.
(c) The name of this sub-function has changed from 'National healthcare specific purpose payment' to 'National health reform payment'.
(d) The name of this sub-function has changed from 'Aboriginal advancement nec' to 'Assistance for Indigenous Australians not elsewhere classified (nec)’.
(e) Most road and rail funding in 2014-15 and 2015-16, which is currently classified under the road transport sub-function, will be reclassified between the road and rail transport sub-functions as programs of work are determined.
(f) Amounts for the Natural Disaster Relief and Recovery Arrangements (NDRRA) reflect expenses being recorded in the year in which the disaster occurs rather than when payments are made to State or Territory governments in relation to Commonwealth financial obligations under the NDRRA.

Statement 6: Expenses and Net Capital Investment
6-58
APPENDIX B: THE CONTINGENCY RESERVE
The Contingency Reserve (other purposes function) is an allowance, included in aggregate expenses, principally to reflect anticipated events that cannot be assigned to individual programs in the preparation of the Australian Government budget estimates. The Contingency Reserve is used to ensure that the estimates are based on the best information available at the time of the Budget. It is not a general policy reserve. While the Reserve is designed to ensure that aggregate estimates are as close as possible to expected outcomes, it is not appropriated. Allowances that are included in the Reserve can only be drawn upon once they have been appropriated by Parliament. These allowances are removed from the Reserve and allocated to specific agencies for appropriation and for outcome reporting closer to the time when the associated events eventuate.
The Contingency Reserve contains an allowance for the tendency for estimates of expenses for existing Government policy to be revised upwards in the forward years, known as the conservative bias allowance. Since the 2011-12 MYEFO, the allowance has been drawn down to zero in the Budget year (2012-13), to ½ of a percentage point of total general government sector expenses (excluding GST payments to the States) in the first forward year (2013-14), to 1 per cent of expenses in the second forward year (2014-15) and a 2 per cent provision has been included in the third forward year (2015-16). The drawdown of the allowance reduced expenses by $821 million in 2012-13, $857 million in 2013-14 and $1.8 billion in 2014-15. The drawdown of the conservative bias allowance is consistent with long standing practice and does not represent a saving or offset to Government spending measures.
The Contingency Reserve also makes allowance in 2012-13 and the forward years for anticipated events, including the following:
• a provision for underspends in the current financial year reflecting the tendency for budgeted expenses for some agencies or functions not to be met;
• commercial-in-confidence and national security-in-confidence items that cannot be disclosed separately, and programs that are yet to be renegotiated with State and Territory governments;
• decisions made too late for inclusion against individual agency estimates;
• the effect on the Budget and forward estimates of economic parameter revisions received late in the process and hence not able to be allocated to individual agencies or functions; and
• a provision for events and pressures that are reasonably expected to affect the budget estimates.
The Contingency Reserve also makes provision for future increases in Australia’s official development assistance yet to be allocated to specific aid programs. However, in this budget statement, these expenses are allocated to the foreign affairs and

Statement 6: Expenses and Net Capital Investment
6-59
economic aid sub-function. The provision is increased or decreased in line with the forecasts for the national accounts and when new aid proposals are funded.
The Contingency Reserve contains a provision in 2013-14 onwards for the majority of the Government’s funding for the Stronger Futures in the Northern Territory package. Funding for this package is subject to negotiation with the Northern Territory Government and will be removed from the Contingency Reserve at the conclusion of these negotiations. A provision has also been made to reflect the Government’s commitment to pay the Commonwealth’s share of the costs of the decision made by Fair Work Australia in response to the pay equity claim on behalf of certain workers in the Social and Community Services sector.

Statement 6: Expenses and Net Capital Investment
6-60
APPENDIX C: ADDITIONAL AGENCY STATISTICS
Table C1: General government expenses by agency Estimates Projections
2011-12 2012-13 2013-14 2014-15 2015-16
$m $m $m $m $m
Agriculture, Fisheries and Forestry
Department of Agriculture, Fisheries and Forestry 1,630 1,454 1,575 1,552 1,586
Grains Research and Development Corporation 166 181 182 185 185
Total 1,796 1,635 1,757 1,737 1,771
Attorney-General's
Attorney-General's Department 793 754 717 701 713
Australian Customs and Border Protection Service 1,122 1,092 1,066 1,046 1,066
Australian Federal Police 1,432 1,362 1,262 1,231 1,252
Australian Security Intelligence Organisation 413 445 449 461 475
Family Court of Australia 141 121 121 120 121
High Court of Australia 21 20 21 21 21
Total 3,921 3,795 3,637 3,580 3,648
Broadband, Communications and
the Digital Economy
Australian Broadcasting Corporation 1,173 1,188 1,206 1,219 1,240
Australian Communications and Media Authority 276 256 103 97 95
Department of Broadband, Communications and
the Digital Economy 2,035 1,727 1,621 1,506 1,523
Special Broadcasting Service Corporation 316 332 363 358 360
Total 3,800 3,503 3,292 3,180 3,218
Climate Change and Energy Efficiency
Clean Energy Regulator 19 2,875 4,052 4,397 4,963
Department of Climate Change and Energy
Efficiency 1,546 226 273 251 222
Total 1,565 3,101 4,325 4,647 5,185
Defence
Australian War Memorial 54 57 58 59 60
Defence Housing Australia 740 937 1,030 1,057 1,075
Defence Materiel Organisation 9,976 9,101 9,495 10,838 12,777
Department of Defence 28,891 28,959 29,876 31,058 32,693
Department of Veterans' Affairs 12,479 12,419 12,552 12,603 12,703
Total 52,139 51,473 53,011 55,615 59,308
Education, Employment and
Workplace Relations
Comcare 868 447 454 471 489
Department of Education, Employment and
Workplace Relations 37,491 32,665 34,378 34,658 36,562
Total 38,359 33,112 34,832 35,128 37,051

Statement 6: Expenses and Net Capital Investment
6-61
Table C1: General government expenses by agency (continued) Estimates Projections
2011-12 2012-13 2013-14 2014-15 2015-16
$m $m $m $m $m
Families, Housing, Community Services and
Indigenous Affairs
Department of Families, Housing, Community
Services and Indigenous Affairs 80,467 83,369 88,032 93,007 98,484
Indigenous Business Australia 142 186 163 169 172
Total 80,609 83,555 88,195 93,176 98,656
Finance and Deregulation
Australian Electoral Commission 132 133 315 139 143
Department of Finance and Deregulation 12,100 9,968 9,762 9,320 9,713
Future Fund Management Agency 701 596 637 679 724
Total 12,933 10,698 10,714 10,138 10,580
Foreign Affairs and Trade
AusAID 4,130 4,997 5,576 5,738 6,298
Australian Trade Commission 362 351 348 350 349
Department of Foreign Affairs and Trade 1,273 1,325 1,337 1,283 1,301
Export Finance and Insurance Corporation
(National Interest component) 58 48 46 45 44
Total 5,822 6,722 7,306 7,416 7,993
Health and Ageing
Department of Health and Ageing 50,242 51,202 53,701 56,640 59,975
National Blood Authority 1,035 1,096 1,172 1,270 1,373
National Health and Medical Research Council 863 893 916 916 920
Total 52,140 53,191 55,789 58,826 62,268
Human Services
Department of Human Services 5,833 5,796 5,766 5,621 5,610
Total 5,833 5,796 5,766 5,621 5,610
Immigration and Citizenship
Department of Immigration and Citizenship 2,725 2,642 2,533 2,483 2,565
Total 2,725 2,642 2,533 2,483 2,565
Industry, Innovation, Science, Research
and Tertiary Education
Australian Nuclear Science and
Technology Organisation 272 258 261 264 265
Australian Research Council 852 907 913 883 875
Commonwealth Scientific and Industrial
Research Organisation 1,293 1,268 1,308 1,367 1,412
Department of Industry, Innovation, Science, Research
and Tertiary Education 11,882 18,245 18,666 19,314 19,929
Total 14,300 20,678 21,148 21,828 22,482
Infrastructure and Transport
Civil Aviation Safety Authority 178 174 180 183 187
Department of Infrastructure and Transport 3,632 2,139 2,228 1,736 1,954
Total 3,810 2,313 2,409 1,918 2,141

Statement 6: Expenses and Net Capital Investment
6-62
Table C1: General government expenses by agency (continued) Estimates Projections
2011-12 2012-13 2013-14 2014-15 2015-16
$m $m $m $m $m
Parliament
Department of Parliamentary Services 162 159 155 154 156
Total 162 159 155 154 156
Prime Minister and Cabinet
Department of the Prime Minister and Cabinet 803 162 219 358 145
Total 803 162 219 358 145
Regional Australia, Local Government,
Arts and Sport
Australian Sports Commission 316 308 287 259 263
Department of Regional Australia, Local Government,
Arts and Sport 3,655 2,462 3,815 3,954 3,922
National Archives of Australia 77 76 77 78 80
National Capital Authority 36 37 38 39 39
National Gallery of Australia 41 42 42 43 43
National Library of Australia 78 74 75 76 77
National Museum of Australia 48 47 47 48 48
Total 4,250 3,045 4,381 4,495 4,472
Resources, Energy and Tourism
Australian Renewable Energy Agency 0 293 345 437 322
Department of Resources, Energy and Tourism 907 916 1,255 1,646 1,664
Tourism Australia 151 157 164 168 172
Total 1,058 1,366 1,764 2,250 2,158
Sustainability, Environment, Water,
Population and Communities
Bureau of Meteorology 338 325 323 325 328
Department of Sustainability, Environment, Water,
Population and Communities 1,499 1,379 1,713 1,781 2,199
Total 1,837 1,704 2,036 2,106 2,526
Treasury
Australian Bureau of Statistics 640 385 362 373 442
Australian Office of Financial Management 11,538 12,031 12,024 11,646 11,427
Australian Securities and Investments Commission 468 477 479 475 472
Australian Taxation Office 17,008 17,972 18,921 19,181 19,688
Department of the Treasury 85,917 80,613 84,920 86,506 91,063
Total 115,570 111,477 116,706 118,181 123,092
Small agencies 5,969 6,185 6,137 6,207 6,286
Whole of government and inter-agency
amounts(a) -29,421 -24,270 -21,639 -16,508 -15,728
AEIFRS expenses considered
other economic flows(b) -6,307 -5,770 -5,969 -6,088 -6,540
Total expenses 373,671 376,273 398,503 416,449 439,044 (a) Estimates of inter-agency transactions are included in the whole of government and inter-agency amounts. The
entry for each portfolio does not include eliminations for inter-agency transactions within that portfolio. (b) Agency estimates are reported on an AEIFRS basis. AEIFRS expenses considered other economic flows
include net write-down and impairment of assets and fair value losses and swap interest expense as detailed in Statement 9 Note 13.

Statement 6: Expenses and Net Capital Investment
6-63
Table C2: Departmental expenses by agency Estimates Projections
2011-12 2012-13 2013-14 2014-15 2015-16$m $m $m $m $m
Agriculture, Fisheries and ForestryDepartment of Agriculture, Fisheries and Forestry 709 661 734 728 768Grains Research and Development Corporation 166 181 182 185 185Total 875 841 915 913 953
Attorney-General'sAttorney-General's Department 279 252 256 250 252Australian Customs and Border Protection Service 1,118 1,089 1,063 1,042 1,062Australian Federal Police 1,385 1,341 1,248 1,219 1,239Australian Security Intelligence Organisation 413 445 449 461 475Family Court of Australia 141 121 121 120 121High Court of Australia 21 20 21 21 21Total 3,357 3,269 3,157 3,114 3,170
Broadband, Communications and the Digital Economy
Australian Broadcasting Corporation 1,173 1,188 1,206 1,219 1,240Australian Communications and Media Authority 115 110 102 96 95Department of Broadband, Communications and
the Digital Economy 136 121 111 93 95Special Broadcasting Service Corporation 316 332 363 358 360Total 1,739 1,750 1,782 1,766 1,790
Climate Change and Energy EfficiencyClean Energy Regulator 16 79 71 69 67Department of Climate Change and Energy
Efficiency 204 109 100 94 84Total 219 188 171 162 152
DefenceAustralian War Memorial 54 57 58 59 60Defence Housing Australia 740 937 1,030 1,057 1,075Defence Materiel Organisation 9,976 9,101 9,495 10,838 12,777Department of Defence 24,711 24,732 25,431 26,387 27,825Department of Veterans' Affairs 359 354 356 358 357Total 35,840 35,180 36,371 38,699 42,094
Education, Employment and Workplace Relations
Comcare 868 447 454 471 489Department of Education, Employment and
Workplace Relations 886 716 710 703 710Total 1,754 1,164 1,164 1,174 1,199

Statement 6: Expenses and Net Capital Investment
6-64
Table C2: Departmental expenses by agency (continued) Estimates Projections
2011-12 2012-13 2013-14 2014-15 2015-16$m $m $m $m $m
Families, Housing, Community Services and Indigenous Affairs
Department of Families, Housing, Community Services and Indigenous Affairs 617 633 643 680 697
Indigenous Business Australia 142 186 163 169 172Total 759 819 807 849 870
Finance and DeregulationAustralian Electoral Commission 132 133 247 139 143Department of Finance and Deregulation 514 534 524 508 523Future Fund Management Agency 35 42 43 45 46Total 681 709 814 691 712
Foreign Affairs and TradeAusAID 284 325 351 323 329Australian Trade Commission 211 200 197 200 199Department of Foreign Affairs and Trade 979 1,042 1,055 998 1,013Total 1,474 1,567 1,603 1,521 1,541
Health and AgeingDepartment of Health and Ageing 802 804 801 791 798National Blood Authority 11 11 11 11 11National Health and Medical Research Council 48 47 47 47 46Total 861 862 859 849 855
Human ServicesDepartment of Human Services 4,530 4,423 4,345 4,169 4,133Total 4,530 4,423 4,345 4,169 4,133
Immigration and CitizenshipDepartment of Immigration and Citizenship 1,417 1,435 1,444 1,474 1,589Total 1,417 1,435 1,444 1,474 1,589
Industry, Innovation, Science, Researchand Tertiary Education
Australian Nuclear Science and Technology Organisation 272 258 261 264 265
Australian Research Council 22 22 22 22 22Commonwealth Scientific and Industrial
Research Organisation 1,293 1,268 1,308 1,367 1,412Department of Industry, Innovation, Science, Research
and Tertiary Education 434 599 584 577 575Total 2,021 2,147 2,175 2,230 2,274
Infrastructure and TransportCivil Aviation Safety Authority 178 174 180 183 187Department of Infrastructure and Transport 223 205 214 209 216Total 402 380 394 391 404

Statement 6: Expenses and Net Capital Investment
6-65
Table C2: Departmental expenses by agency (continued) Estimates Projections
2011-12 2012-13 2013-14 2014-15 2015-16$m $m $m $m $m
ParliamentDepartment of Parliamentary Services 135 132 128 127 129Total 135 132 128 127 129
Prime Minister and CabinetDepartment of the Prime Minister and Cabinet 208 147 201 343 129Total 208 147 201 343 129
Regional Australia, Local Government, Arts and Sport
Australian Sports Commission 316 308 287 259 263Department of Regional Australia, Local Government,
Arts and Sport 100 106 99 100 101National Archives of Australia 77 76 77 78 80National Capital Authority 17 19 19 20 20National Gallery of Australia 41 42 42 43 43National Library of Australia 78 74 75 76 77National Museum of Australia 48 47 47 48 48Total 677 671 647 622 632
Resources, Energy and TourismAustralian Renewable Energy Agency 0 293 345 437 322Department of Resources, Energy and Tourism 122 93 86 79 71Tourism Australia 151 157 164 168 172Total 274 543 595 684 566
Sustainability, Environment, Water, Population and Communities
Bureau of Meteorology 328 325 323 325 328Department of Sustainability, Environment, Water,
Population and Communities 610 544 532 530 511Total 938 869 855 855 838
TreasuryAustralian Bureau of Statistics 640 385 362 373 442Australian Office of Financial Management 12 13 10 10 10Australian Securities and Investments Commission 392 396 393 384 376Australian Taxation Office 3,407 3,449 3,381 3,412 3,366Department of the Treasury 190 195 219 189 167Total 4,640 4,438 4,365 4,369 4,361
Small agencies 4,908 4,717 4,642 4,678 4,696Whole of government and inter-agency
amounts(a) -10,967 -10,440 -11,039 -12,025 -14,335AEIFRS expenses considered
other economic flows(b) -1,538 -1,136 -1,174 -1,239 -1,295
Total departmental expenses 55,204 54,674 55,220 56,416 57,458 (a) Estimates of inter-agency transactions are included in the whole of government and inter-agency
amounts. The entry for each portfolio does not include eliminations for inter-agency transactions within that portfolio.
(b) Agency estimates are reported on an AEIFRS basis. AEIFRS expenses considered other economic flows include net write-down and impairment of assets and fair value losses.

Statement 6: Expenses and Net Capital Investment
6-66
Table C3: Net capital investment by agency Estimates Projections
2011-12 2012-13 2013-14 2014-15 2015-16$m $m $m $m $m
Agriculture, Fisheries and ForestryDepartment of Agriculture, Fisheries and Forestry 27 -4 -3 -3 -2Grains Research and Development Corporation 0 1 0 0 0Total 27 -3 -3 -3 -2
Attorney-General'sAttorney-General's Department 8 -11 -13 -13 -6Australian Customs and Border Protection Service 55 40 18 53 44Australian Federal Police 21 14 55 24 -38Australian Security Intelligence Organisation 45 123 -35 0 -75Family Court of Australia 8 -1 -1 -1 -1High Court of Australia 1 1 1 0 0Total 137 166 23 63 -76
Broadband, Communications and the Digital Economy
Australian Broadcasting Corporation 9 10 -5 -3 -3Australian Communications and Media Authority 3 3 2 -1 9Department of Broadband, Communications and
the Digital Economy 39 -18 -14 -14 -15Special Broadcasting Service Corporation 22 4 -7 -7 -7Total 73 -1 -25 -26 -17
Climate Change and Energy EfficiencyClean Energy Regulator 5 14 -4 -5 -3Department of Climate Change and Energy
Efficiency 56 -6 -11 -4 4Total 62 8 -16 -8 1
DefenceAustralian War Memorial 68 2 16 0 -7Defence Housing Australia 21 24 -5 -48 -2Defence Materiel Organisation 400 0 0 0 0Department of Defence 1,354 288 15 332 2,247Department of Veterans' Affairs 15 -1 -3 -13 -13Total 1,858 314 23 271 2,226
Education, Employment and Workplace Relations
Comcare 16 9 2 3 3Department of Education, Employment and
Workplace Relations 2 -37 -44 -43 -42Total 18 -27 -41 -40 -39

Statement 6: Expenses and Net Capital Investment
6-67
Table C3: Net capital investment by agency (continued) Estimates Projections
2011-12 2012-13 2013-14 2014-15 2015-16$m $m $m $m $m
Families, Housing, Community Services and Indigenous Affairs
Department of Families, Housing, Community Services and Indigenous Affairs -14 2 31 -15 -53
Indigenous Business Australia 3 1 2 0 1Total -12 3 33 -15 -53
Finance and DeregulationAustralian Electoral Commission 2 4 -2 0 5Department of Finance and Deregulation 308 300 383 305 -687Future Fund Management Agency -234 0 0 0 0Total 77 304 380 304 -683
Foreign Affairs and TradeAusAID 19 9 4 1 0Australian Trade Commission 1 0 -8 -3 -3Department of Foreign Affairs and Trade 169 167 267 180 144Total 189 176 263 178 141
Health and AgeingDepartment of Health and Ageing 165 60 -23 -51 -88National Blood Authority 0 0 0 0 -1National Health and Medical Research Council 0 -1 -2 -2 -2Total 165 59 -24 -52 -90
Human ServicesDepartment of Human Services 118 -86 -128 -66 -82Total 118 -86 -128 -66 -82
Immigration and CitizenshipDepartment of Immigration and Citizenship 248 3 -19 -23 155Total 248 3 -19 -23 155
Industry, Innovation, Science, Researchand Tertiary Education
Australian Nuclear Science and Technology Organisation 35 34 11 -3 -15
Australian Research Council 0 0 -2 -2 -2Commonwealth Scientific and Industrial
Research Organisation 96 90 -37 -55 -69Department of Industry, Innovation, Science, Research
and Tertiary Education 24 8 8 -1 -3Total 155 132 -19 -61 -88
Infrastructure and TransportCivil Aviation Safety Authority 4 5 -7 -8 -7Department of Infrastructure and Transport -39 -4 -7 -9 -6Total -35 1 -14 -17 -13

Statement 6: Expenses and Net Capital Investment
6-68
Table C3: Net capital investment by agency (continued) Estimates Projections
2011-12 2012-13 2013-14 2014-15 2015-16$m $m $m $m $m
ParliamentDepartment of Parliamentary Services 6 -26 -22 -8 -8Total 6 -26 -22 -8 -8
Prime Minister and CabinetDepartment of the Prime Minister and Cabinet -167 6 2 -6 -13Total -167 6 2 -6 -13
Regional Australia, Local Government, Arts and Sport
Australian Sports Commission 23 -4 -6 -6 -15Department of Regional Australia, Local Government,
Arts and Sport 205 22 18 -16 -14National Archives of Australia 7 -3 -1 -2 -2National Capital Authority 13 -8 -8 -4 -4National Gallery of Australia 12 13 17 17 18National Library of Australia 3 5 1 2 2National Museum of Australia 4 3 0 5 4Total 266 28 20 -4 -12
Resources, Energy and TourismAustralian Renewable Energy Agency 0 0 0 0 0Department of Resources, Energy and Tourism 9 -6 -1 -1 0Tourism Australia 1 0 0 0 0Total 10 -7 -1 -1 0
Sustainability, Environment, Water, Population and Communities
Bureau of Meteorology 20 -2 -6 -8 -8Department of Sustainability, Environment, Water,
Population and Communities 556 142 134 335 398Total 576 140 128 327 390
TreasuryAustralian Bureau of Statistics -4 -12 -11 -9 -8Australian Office of Financial Management 0 3 0 0 0Australian Securities and Investments Commission 10 -15 -13 -17 -3Australian Taxation Office 87 76 -5 -22 -24Department of the Treasury 8 -31 -5 -5 -5Total 101 20 -35 -53 -40
Small agencies 206 70 -11 -48 -33Whole of government and inter-agency
amounts(a) 27 58 86 69 99Adjustments to AEIFRS movements in
non-financial assets(b) 644 -4,037 448 581 -705
Total net capital investment 4,749 -2,701 1,048 1,361 1,059 (a) Estimates of inter-agency transactions are included in the whole of government and inter-agency
amounts. The entry for each portfolio does not include eliminations for inter-agency transactions within that portfolio.
(b) Agency estimates are reported on an AEIFRS basis. AEIFRS movements in non-financial assets considered other economic flows include net write-down and impairment of non-financial assets, assets recognised for the first time and prepayments. They also include Contingency Reserve movements in non-financial assets.

Statement 6: Expenses and Net Capital Investment
6-69
Table C4: Capital appropriations by portfolio Estimates Projections
2011-12 2012-13 2013-14 2014-15 2015-16$m $m $m $m $m
Agriculture, Fisheries and ForestryDepartment of Agriculture, Fisheries and Forestry 26 12 12 10 10Total 26 12 12 10 10
Attorney-General'sAttorney-General's Department 50 137 32 17 21Australian Customs and Border Protection Service 136 125 111 147 142Australian Federal Police 62 37 81 86 39Australian Security Intelligence Organisation 61 66 48 34 34Family Court of Australia 10 6 6 7 7High Court of Australia 4 4 5 4 4Total 323 375 283 295 248
Broadband, Communications and the Digital Economy
Australian Broadcasting Corporation 6 17 0 0 0Australian Communications and Media Authority 9 8 9 7 9Department of Broadband, Communications and
the Digital Economy(a) 2,356 4,827 6,605 4,105 3,604Special Broadcasting Service Corporation 13 3 0 0 0Total 2,383 4,855 6,614 4,112 3,614
Climate Change and Energy EfficiencyClean Energy Regulator 4 19 1 1 1Department of Climate Change and Energy
Efficiency 33 7 6 5 5Total 36 27 7 6 6
DefenceAustralian War Memorial 8 11 25 13 7Department of Defence 2,053 0 0 286 1,549Department of Veterans' Affairs 25 21 20 14 15Total 2,086 33 46 313 1,571
Education, Employment and Workplace Relations
Comcare 7 0 0 0 0Department of Education, Employment and
Workplace Relations 81 52 47 50 51Total 88 52 47 50 51

Statement 6: Expenses and Net Capital Investment
6-70
Table C4: Capital appropriations by portfolio (continued) Estimates Projections
2011-12 2012-13 2013-14 2014-15 2015-16$m $m $m $m $m
Families, Housing, Community Services and Indigenous Affairs
Department of Families, Housing, Community Services and Indigenous Affairs 30 60 115 87 55
Indigenous Business Australia 33 38 37 37 37Total 63 97 152 124 91
Finance and DeregulationAustralian Electoral Commission 8 11 4 6 11Department of Finance and Deregulation 1,623 1,698 1,997 1,974 1,876Total 1,630 1,709 2,002 1,979 1,888
Foreign Affairs and TradeAusAID 70 532 339 13 12Australian Trade Commission 15 18 11 15 15Department of Foreign Affairs and Trade 145 120 164 101 70Total 231 671 514 128 97
Health and AgeingDepartment of Health and Ageing 143 80 33 24 28National Blood Authority 1 0 1 1 0Total 143 81 34 25 29
Human ServicesDepartment of Human Services 317 168 115 192 193Total 317 168 115 192 193
Immigration and CitizenshipDepartment of Immigration and Citizenship 159 116 99 98 101Total 159 116 99 98 101
Industry, Innovation, Science, Researchand Tertiary Education
Australian Nuclear Science and Technology Organisation 1 4 16 0 0
Australian Research Council 3 3 1 1 1Department of Industry, Innovation, Science, Research
and Tertiary Education 118 70 65 50 45Total 122 76 82 52 46

Statement 6: Expenses and Net Capital Investment
6-71
Table C4: Capital appropriations by portfolio (continued) Estimates Projections
2011-12 2012-13 2013-14 2014-15 2015-16$m $m $m $m $m
Infrastructure and TransportDepartment of Infrastructure and Transport 4 10 6 6 8Total 4 10 6 6 8
ParliamentDepartment of Parliamentary Services 32 23 23 35 36Total 32 23 23 35 36
Prime Minister and CabinetDepartment of the Prime Minister and Cabinet 6 13 5 4 4Total 6 13 5 4 4
Regional Australia, Local Government, Arts and SportDepartment of Regional Australia, Local Government,
Arts and Sport 45 45 22 17 17National Archives of Australia 7 6 6 6 6National Capital Authority 15 10 10 14 15National Gallery of Australia 16 16 17 17 18National Library of Australia 10 10 10 10 10National Museum of Australia 2 2 2 2 2Total 95 89 67 67 68
Resources, Energy and TourismDepartment of Resources, Energy and Tourism 5 0 0 0 0Total 5 0 0 0 0
Sustainability, Environment, Water, Population and Communities
Bureau of Meteorology 64 51 48 45 46Department of Sustainability, Environment, Water,
Population and Communities 442 215 38 481 183Total 506 266 86 526 229
TreasuryAustralian Bureau of Statistics 19 18 20 22 22Australian Office of Financial Management(b) 741,313 565,119 535,826 485,615 509,569Australian Securities and Investments Commission 65 30 28 16 25Australian Taxation Office 170 174 134 122 122Department of the Treasury 1,021 2,102 682 163 193Total 742,588 567,443 536,690 485,938 509,932
Small agencies 113 88 80 75 74
Total capital appropriations 750,958 576,201 546,964 494,034 518,292 (a) Sharp rises in capital appropriations are due to capital injections for the National Broadband Network. (b) The AOFM manages the overall level of cash in the OPA. It makes short-term borrowings by issuing
Treasury Notes and invests in short-term deposits and securities to manage daily variations in the OPA balance. The capital appropriations include this short-term investment and borrowing activity to manage the estimated within-year profile of the OPA balance. As the within-year profile of the OPA balance may differ from one year to the next, so in consequence will be the number, size and timing of short term investment and borrowing activity.

Statement 6: Expenses and Net Capital Investment
6-72
Table C5: Estimates of average staffing level (ASL) of agencies in the Australian Government general government sector(a)
Average staffing levels *2011-12 2012-13 Change
Agriculture, Fisheries and Forestry Department of Agriculture, Fisheries and Forestry 4,546 4,435 -112 Australian Fisheries Management Authority 195 189 -6 Australian Pesticides and Veterinary Medicines Authority 178 182 4Cotton Research and Development Corporation 9 12 3Fisheries Research and Development Corporation 11 11 0Grains Research and Development Corporation 49 53 4Grape and Wine Research and Development Corporation 11 10 -1 Rural Industries Research and Development Corporation 26 28 2Sugar Research and Development Corporation 8 8 0Wheat Exports Australia 11 5 -6 Wine Australia Corporation (Wine Australia) 38 39 1Total 5,082 4,972 -111
Attorney-General's Attorney-General’s Department 1,482 1,393 -89 Administrative Appeals Tribunal 162 162 0Australian Commission for Law Enforcement Integrity 24 29 5Australian Crime Commission 565 539 -26 Australian Customs and Border Protection Service (b) 5,225 5,035 -190 Australian Federal Police 6,420 6,410 -10 Australian Human Rights Commission 132 127 -5 Australian Institute of Criminology 48 49 1Australian Law Reform Commission 15 14 -1 Australian Security Intelligence Organisation 1,760 1,760 0Australian Transaction Reports and Analysis Centre (AUSTRAC) 296 294 -2 CrimTrac Agency 201 204 3Family Court of Australia 572 572 0Federal Court of Australia (c) 305 415 110Federal Magistrates Court of Australia 234 234 0High Court of Australia 83 81 -2 Insolvency and Trustee Service Australia 370 389 19National Native Title Tribunal (c) 160 0 -160 Office of Parliamentary Counsel 49 52 3Office of the Australian Information Commissioner 79 79 0Office of the Director of Public Prosecutions 513 504 -9 Total 18,695 18,342 -353
Broadband, Communications and the Digital EconomyDepartment of Broadband, Communications and the Digital Economy 672 641 -31 Australian Broadcasting Corporation 4,579 4,579 0Australian Communications and Media Authority 575 540 -35 Special Broadcasting Service Corporation 840 912 72Telecommunications Universal Service Management Agency (d) 0 16 16Total 6,666 6,688 22
Climate Change and Energy Efficiency Department of Climate Change and Energy Efficiency (e) 947 603 -344 Climate Change Authority (f) 0 19 19Low Carbon Australia Limited 24 32 8Clean Energy Regulator (g) 77 355 278Total 1,048 1,009 -39

Statement 6: Expenses and Net Capital Investment
6-73
Table C5: Estimates of average staffing level (ASL) of agencies in the Australian Government general government sector(a) (continued) DefenceDepartment of Defence – Civilian (includes contractors) 16,331 16,139 -192Defence Materiel Organisation (includes contractors) 6,024 5,592 -432Department of Defence – Military 57,882 58,636 754Department of Defence – Reserves 21,250 21,650 400Department of Veterans' Affairs 1,990 1,900 -90 Australian War Memorial 292 312 20Defence Housing Australia 571 591 20Total 104,340 104,820 480
Departments of the ParliamentDepartment of Parliamentary Services 720 702 -18 Department of the House of Representatives 155 156 1Department of the Senate 161 155 -6 Total 1,036 1,013 -23
Education, Employment and Workplace Relations Department of Education, Employment and Workplace Relations (h) 4,738 3,593 -1,145 Australian Curriculum Assessment and Reporting Authority 96 97 1Australian Institute for Teaching and School Leadership Limited 34 50 16Comcare 652 595 -57 Fair Work Australia 343 343 0Office of the Australian Building and Construction Commissioner (i) 155 0 -155 Office of the Fair Work Ombudsman 823 753 -70 Office of the Fair Work Building Industry Inspectorate (i) 0 155 155Safe Work Australia 110 110 0Total 6,951 5,696 -1,255
Families, Housing, Community Services and Indigenous AffairsDepartment of Families, Housing, Community Services
and Indigenous Affairs 2,754 2,916 162Aboriginal Hostels Limited 472 439 -33 Anindilyakwa Land Council 24 24 0Australian Institute of Family Studies 66 70 4Central Land Council 211 220 9Equal Opportunity for Women in the Workplace Agency 28 36 8Indigenous Business Australia 215 217 2Indigenous Land Corporation 215 215 0Northern Land Council 500 500 0Outback Stores Pty Ltd 120 120 0Tiwi Land Council 10 11 1Torres Strait Regional Authority 107 129 22Wreck Bay Aboriginal Community Council 32 32 0Total 4,754 4,929 175
Finance and Deregulation Department of Finance and Deregulation 1,645 1,595 -50 Australian Electoral Commission 808 822 14Commonwealth Superannuation Corporation 74 79 5
ComSuper 471 425 -46 Future Fund Management Agency 86 95 9Total 3,084 3,016 -68
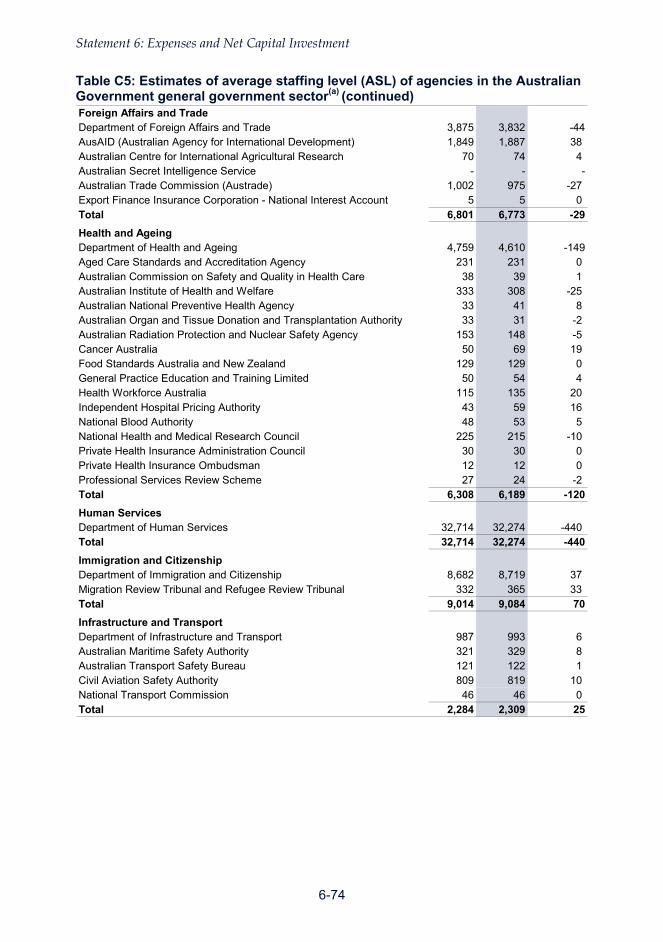
Statement 6: Expenses and Net Capital Investment
6-74
Table C5: Estimates of average staffing level (ASL) of agencies in the Australian Government general government sector(a) (continued) Foreign Affairs and TradeDepartment of Foreign Affairs and Trade 3,875 3,832 -44AusAID (Australian Agency for International Development) 1,849 1,887 38Australian Centre for International Agricultural Research 70 74 4Australian Secret Intelligence Service - - -Australian Trade Commission (Austrade) 1,002 975 -27 Export Finance Insurance Corporation - National Interest Account 5 5 0Total 6,801 6,773 -29
Health and AgeingDepartment of Health and Ageing 4,759 4,610 -149Aged Care Standards and Accreditation Agency 231 231 0Australian Commission on Safety and Quality in Health Care 38 39 1Australian Institute of Health and Welfare 333 308 -25 Australian National Preventive Health Agency 33 41 8Australian Organ and Tissue Donation and Transplantation Authority 33 31 -2 Australian Radiation Protection and Nuclear Safety Agency 153 148 -5 Cancer Australia 50 69 19Food Standards Australia and New Zealand 129 129 0General Practice Education and Training Limited 50 54 4Health Workforce Australia 115 135 20Independent Hospital Pricing Authority 43 59 16National Blood Authority 48 53 5National Health and Medical Research Council 225 215 -10 Private Health Insurance Administration Council 30 30 0Private Health Insurance Ombudsman 12 12 0Professional Services Review Scheme 27 24 -2 Total 6,308 6,189 -120
Human Services Department of Human Services 32,714 32,274 -440 Total 32,714 32,274 -440
Immigration and Citizenship Department of Immigration and Citizenship 8,682 8,719 37Migration Review Tribunal and Refugee Review Tribunal 332 365 33Total 9,014 9,084 70
Infrastructure and Transport Department of Infrastructure and Transport 987 993 6Australian Maritime Safety Authority 321 329 8Australian Transport Safety Bureau 121 122 1Civil Aviation Safety Authority 809 819 10National Transport Commission 46 46 0Total 2,284 2,309 25

Statement 6: Expenses and Net Capital Investment
6-75
Table C5: Estimates of average staffing level (ASL) of agencies in the Australian Government general government sector(a) (continued) Industry, Innovation, Science and Research and Tertiary EducationDepartment of Industry, Innovation, Science, Research and Tertiary Education (h) 2,527 3,256 729
Australian Institute of Aboriginal and Torres Strait Islander Studies 124 124 0
Australian Institute of Marine Science 207 198 -9 Australian Nuclear Science and Technology Organisation 1,107 1,150 43Australian Research Council 107 115 8Australian Skills Quality Authority (j) 116 208 92Commonwealth Scientific and Industrial Research Organisation 5,712 5,596 -116 IP Australia 1,004 1,029 25Tertiary Education Quality and Standards Agency (k) 48 90 42Total 10,952 11,766 814
Prime Minister and Cabinet Department of the Prime Minister and Cabinet (l) 896 700 -196 Australian National Audit Office 346 346 0Australian Public Service Commission 275 263 -12 National Australia Day Council Limited 11 12 1National Mental Health Commission 7 11 4Office of National Assessments 141 148 7Office of the Commonwealth Ombudsman 159 136 -23 Office of the Inspector-General of Intelligence and Security 13 13 0Office of the Official Secretary to the Governor-General 86 86 0Total 1,934 1,715 -219
Regional Australia, Local Government, Arts and SportDepartment of Regional Australia, Local Government, Arts and Sport (l) 476 567 91
Australia Business Arts Foundation Limited 25 25 0Australia Council 122 122 0Australian Film, Television and Radio School 145 145 0Australian National Maritime Museum 122 125 3Australian Sports Anti-Doping Authority 73 71 -2 Australian Sports Commission 735 718 -17 Bundanon Trust 18 19 2National Archives of Australia 429 429 0National Capital Authority 51 55 4National Film & Sound Archive 215 211 -4 National Gallery of Australia 242 242 0National Library of Australia 430 420 -10 National Museum of Australia 225 221 -4Old Parliament House 77 72 -5 Screen Australia 120 110 -10 Total 3,504 3,552 48
Resources, Energy and Tourism Department of Resources, Energy and Tourism 549 441 -108 Australian Renewable Energy Agency (m) 0 2 2Australian Solar Institute Limited 8 8 0Geoscience Australia 666 690 24National Offshore Petroleum Safety and Environmental 74 100 26 Management Authority
Tourism Australia 198 198 0Total 1,495 1,439 -56

Statement 6: Expenses and Net Capital Investment
6-76
Table C5: Estimates of average staffing level (ASL) of agencies in the Australian Government general government sector(a) (continued) Sustainability, Environment, Water, Population and CommunitiesDepartment of Sustainability, Environment, Water, Population and CommunitiesBureau of Meteorology 1,445 1,422 -23 Director of National Parks 288 275 -13 Great Barrier Reef Marine Park Authority 215 208 -7 Murray-Darling Basin Authority 295 305 10National Water Commission 63 44 -19 Sydney Harbour Federation Trust 55 56 1Total 4,650 4,545 -105
Treasury Department of the Treasury 1,006 919 -87 Australian Bureau of Statistics (n) 3,530 2,850 -680 Australian Competition and Consumer Commission 800 745 -55 Australian Office of Financial Management 40 44 4Australian Prudential Regulation Authority 606 613 7Australian Securities and Investments Commission 1,851 1,820 -31 Australian Taxation Office (o) 21,991 20,952 -1,039 Commonwealth Grants Commission 42 42 0Corporations and Markets Advisory Committee 3 3 0Inspector-General of Taxation 11 10 -1 National Competition Council 12 11 -1 Office of the Auditing and Assurance Standards Board 8 8 0Office of the Australian Accounting Standards Board 24 25 1Productivity Commission 199 191 -8 Royal Australian Mint 201 200 -1 Total 30,323 28,433 -1,890
TOTAL (for all general government sector agencies) 261,637 258,563 -3,073
2,289 2,235 -54
* Any discrepancies in totals are due to rounding of partial ASL (a) This table includes estimates of ASL provided by general government sector agencies. ASL figures
reflect the average number of employees receiving salary or wages over the financial year, with adjustments for casual and part time staff, to show the full-time equivalent. This also includes non-uniformed staff and overseas personnel.
(b) The decrease in ASL for the Australian Customs and Border Protection Service reflects the impact of internal restructuring decisions in relation to the agency's 2012-13 Enterprise Agreement and reductions in staffing driven by the savings measures: Australian Customs and Border Protection Service — Increased use of SmartGate capability and Illegal Foreign Fishing in Northern Waters — efficiencies.
(c) The functions of the National Native Title Tribunal will be placed in the Federal Court of Australia as part of the Court Efficiency measures.
(d) The Telecommunications Universal Service Management Agency will commence on 1 July 2012. (e) The ASL for the Department of Climate Change and Energy Efficiency is projected to reduce in 2012-13
by 344 primarily due to the ending of a range of administered programs, including the Home Insulation Program and the Solar Hot Water Rebate Program.
(f) The Climate Change Authority will commence operations on 1 July 2012. (g) The Clean Energy Regulator commenced operations on 2 April 2012 and therefore the estimated ASL
for 2011-12 is only for a 3 month period. The ASL is expected to increase in 2012-13 as the Regulator reaches its full complement of staffing.
(h) The projected decrease in ASL of 1,145 for the Department of Education, Employment and Workplace Relations (DEEWR) largely reflects the transfer of the tertiary education functions to the Department of Industry, Innovation, Science, Research and Tertiary Education (DIISRTE) during 2011-12, as well as some internal changes. Increases in ASL of 729 for DIISRTE largely reflects the transfer of the tertiary education functions.
(i) On 1 June 2012, the Office of the Australian Building and Construction Commissioner (ABCC) was abolished and a new agency, the Office of the Fair Work Building Industry Inspectorate (FWBII), was

Statement 6: Expenses and Net Capital Investment
6-77
created in its place. Although the FWBII was operational with staff for a short period in 2011-12 the ASL count is shown against ABCC.
(j) 2011-12 was the first year of operation for the Australian Skills Quality Authority, with regulatory functions being transferred from the states and territories at different times across the financial year.
(k) The Tertiary Education Quality and Standards Agency is a new agency established on 29 July 2011 and is expecting to achieve its full ongoing staffing profile in 2012-13.
(l) The decrease in ASL for the Department of the Prime Minister and Cabinet between 2011-12 and 2012-13 largely reflects the completion of the 2011 Commonwealth Heads of Government Meeting (CHOGM) and the transfer of the arts and sport functions to the Department of Regional Australia, Local Government, Arts and Sport (DRALGAS). Increases in 91 ASL for DRALGAS largely reflect the transfer of the arts and sports functions.
(m) The Australian Renewable Energy Agency will be established on 1 July 2012, with most departmental support functions being provided by the Department of Resources, Energy and Tourism.
(n) The decrease in ASL for the Australian Bureau of Statistics is predominately due to the completion of the 2011 Census of Population and Housing, reflecting the end of non-ongoing staff retained to perform the Census.
(o) The projected decrease of 1,039 ASL in 2012-13 represents the impact on the Australian Taxation Office of internal restructuring decisions and the implementation of further departmental efficiencies, offset by some ASL increases in new policy funding for 2012-13.


7-1
STATEMENT 7: ASSET AND LIABILITY MANAGEMENT
The Australian Government’s balance sheet remains amongst the strongest in the developed world. Australia recently received a AAA credit rating from all three major rating agencies for the first time in our history.
This strong balance sheet position continues to provide the Government with the capacity and flexibility to respond to unanticipated adverse events and longer-term challenges.
The strength of the Government’s financial position and the return to surplus in 2012-13 allows the Government to further reduce its already very low levels of net debt as a share of GDP from 2012-13.
The Australian Government’s net debt position remains very low by international standards, notwithstanding the further write-down to tax receipts and the fall in interest rates on Commonwealth Government Securities (CGS) contributing to an increase in net debt since the 2011-12 Budget. The average net debt position, as a per cent of GDP, of the major advanced economies (G7) is projected to reach around ten times the expected peak in Australia’s net debt.
In this Budget, the Government maintains its commitment to a liquid and efficient CGS market.
A detailed balance sheet for the Australian Government general government sector is provided in Statement 9: Budget Financial Statements.
Overview of the Australian Government’s balance sheet ........................ 7-3 Measurement of the Government’s financial position .................................................. 7-4
The Australian Government’s major assets and liabilities ...................... 7-8 Assets ........................................................................................................................... 7-8 Liabilities ..................................................................................................................... 7-12
The Commonwealth Government Securities Market .............................. 7-16

7-3
STATEMENT 7: ASSET AND LIABILITY MANAGEMENT
OVERVIEW OF THE AUSTRALIAN GOVERNMENT’S BALANCE SHEET
The Government’s balance sheet shows the stocks of all government assets and liabilities. Measures such as net debt, net financial worth and net worth are aggregates drawn from the balance sheet that provide an indication of the Government’s financial strength at a point in time (see Box 1).
The outlook for the Government’s stocks of assets and liabilities — or the Government’s balance sheet — over the forward estimates is based on a range of estimates and assumptions about those assets and liabilities. If the estimates or assumptions change, this is likely to affect the projected value of assets and liabilities, and hence change the projected path of the balance sheet measures outlined above.
The outlook for the Government’s stocks of assets across the forward estimates is broadly similar to that at the 2011-12 Budget. Several factors, including the further write-down in tax receipts and the fall in interest rates on Commonwealth Government Securities (CGS) to some of the lowest levels seen in Australia’s history, have resulted in an increase in the value of expected liabilities. These market value adjustments have contributed to higher estimates for net debt, and lower estimated net financial worth and net worth than was expected at the 2011-12 Budget.
However, Australia’s net debt position remains very low by international standards, with Australia one of only eight countries to have a AAA credit rating with a stable outlook from all three major credit ratings agencies.
Delivering a budget surplus through the Government’s ongoing commitment to fiscal discipline will sustain confidence in the strength of Australia’s public finances, and provide a buffer against adverse global economic developments.
Statement 3: Fiscal Strategy and Outlook examines the impact of altering key economic assumptions on payments and receipts. Since the budget position is one of the main drivers of the movement in the Government’s asset and liability position, changes in the economic assumptions will also affect the Government’s financial stocks.
The Government reports on a range of other fiscal risks in Statement 8: Statement of Risks. These risks comprise general developments or specific events that may affect the fiscal outlook. Fiscal risks may affect expenses or revenue and, as a result, may contribute to variability in the Government’s projected net debt, net financial worth and net worth position.

Statement 7: Asset and Liability Management
7-4
Measurement of the Government’s financial position
Box 1: Net debt, net financial worth and net worth
Net debt is a commonly quoted measure of a government’s financial strength. Historically, this was the only available stock measure for governments that were recording financial information in a cash-based accounting system. Net debt provides the most useful measure for international comparisons, given most OECD countries report on it.
Net financial worth is used by the Government as the primary indicator of balance sheet sustainability because it provides a more effective and intuitive indicator of the sustainability of the Government’s finances. It is a broader measure than net debt as it includes government borrowing, superannuation and all financial assets, but is narrower than net worth since it excludes non-financial assets. There are advantages to excluding non-financial assets since they are often illiquid and cannot easily be drawn upon to meet the Government’s financing needs.
Net worth is the broadest measure of the Government’s financial position. It is the net position of total assets and liabilities recorded on the balance sheet.
Net debt, net financial worth and net worth
A range of factors, including the further write-down in tax receipts and the increase in the market value of CGS on issue, have contributed to a higher expected level of net debt, and lower expected net financial worth and net worth, than was forecast in the 2011-12 Budget. However, these estimates remain well below those expected during the global financial crisis— net debt, for example, was expected to peak at 13.8 per cent of GDP in 2013-14 in the 2009-10 Budget.
Net debt is now expected to peak, in nominal terms, at $144.9 billion in 2013-14 (8.9 per cent of GDP), falling to 7.3 per cent of GDP by the end of the forward estimates.
In 2012-13, net financial worth is estimated to be -$248.6 billion, compared to the 2011-12 Budget estimate of -$198.5 billion. Net financial worth is estimated to be -$225.8 billion by the end of the forward estimates.
Chart 1 shows the projected movements in net financial worth since the 2010-11 Budget.

Statement 7: Asset and Liability Management
7-5
Chart 1: Net financial worth comparison
-300
-250
-200
-150
-100
-50
0
50
100
-300
-250
-200
-150
-100
-50
0
50
100
2010-11 2011-12 2012-13 2013-14 2014-15 2015-16
$billion$billion
2010-11 Budget 2011-12 Budget 2012-13 Budget
Note: Net financial worth for 2014-15 was not projected in the 2010-11 Budget; net financial worth for 2015-16 was not projected in the 2011-12 Budget.
Net worth is currently estimated at -$137.8 billion for 2012-13, compared with -$83.4 billion estimated at the time of the 2011-12 Budget.
The Australian Government’s financial position remains amongst the strongest in the developed world (Box 2) and is a key reason behind Australia’s receiving a AAA credit rating from all three major rating agencies for the first time in our history. Indeed, Australia is now one of only eight countries to have a AAA rating with a stable outlook from all three agencies. In addition to the Government’s adherence to a credible medium-term fiscal framework, other key factors underpinning Australia’s credit rating are the strength and resilience of the economy, the stability of the financial system and the quality of policy and institutional arrangements, including independent monetary policy and strong financial regulation.

Statement 7: Asset and Liability Management
7-6
Box 2: The strength of the Australian Government’s financial position
During 2011-12, many countries have faced profound financial and fiscal challenges as a result of the accumulation of large budget deficits and high levels of sovereign debt. Several governments have had to implement severe austerity measures in order to support more sustainable trajectories for government debt at a time when they also face the significant task of generating growth.
This stands in sharp contrast to the strength and resilience of the Australian Government’s financial position and the domestic economy, forecast to grow around trend.
Australia’s level of net debt remains very low by international standards (Chart A). Australian Government net debt is expected to peak at 9.6 per cent of GDP in 2011–12, compared to the expected average net debt position of the major advanced economies of around 93 per cent of GDP in 2016 and 2017.
Chart A: Comparison of Government net debt for selected economies, 2011-2017
0
25
50
75
100
125
150
175
0
25
50
75
100
125
150
175
Australia euro area Japan US UK
Per cent of GDPPer cent of GDP
Note: Australian data are for the Australian Government general government sector and refer to financial years beginning 2011-12. Data for all other economies are total government and refer to calendar years beginning 2011. Source: IMF Fiscal Monitor April 2012 and Treasury.

Statement 7: Asset and Liability Management
7-7
Box 2: The strength of the Australian Government’s financial position (continued)
Similarly, Australia’s net interest payments are very low by international comparison (Chart B).
Chart B: Net interest payments for Australia, the US and the euro area
-1
0
1
2
3
4
5
6
-1
0
1
2
3
4
5
6
1985 1990 1995 2000 2005 2010 2015
Per cent of GDPPer cent of GDP
euro area average
United States
Australia
Forecasts
Note: Net interest payments are equal to the difference between interest paid and interest receipts on government assets and liabilities. Australian and US data are federal government data. Australian data refer to financial years beginning 1985-86. US data refer to US fiscal years beginning October 1985. Euro area data are total government and refer to calendar years beginning 1985. Source: United States Congressional Budget Office The Budget and Economic Outlook January 2012 and Updated Budget Projections March 2012, OECD Economic Outlook 90 November 2011, Thomson Reuters and Treasury.
Not only are the Government’s debt levels very low by international comparison, the return to budget surplus in 2012-13 and beyond means that the Government is well placed to reduce net debt from its already modest level.
Returning the budget to surplus and having those surpluses growing over time will strengthen the balance sheet further. This will ensure Australia continues to have the flexibility to respond to any unanticipated adverse future events that have a fiscal impact and to other longer-term challenges.

Statement 7: Asset and Liability Management
7-8
THE AUSTRALIAN GOVERNMENT’S MAJOR ASSETS AND LIABILITIES
Assets
The Government’s total stock of assets is estimated to be around $325.8 billion at 30 June 2012, increasing to $349.4 billion in 2012-13 and $397.4 billion by the end of the forward estimates.
The Government’s financial assets are estimated to be $216.3 billion at 30 June 2012, increasing to $238.5 billion in 2012-13 and $283.4 billion by the end of the forward estimates.
The Government’s non-financial assets are estimated to be $109.5 billion at 30 June 2012, increasing to $110.9 billion in 2012-13 and $114.0 billion by the end of the forward estimates.
Future Fund
The Future Fund was established in 2006 to accumulate financial assets and invest them on behalf of the Australian Government to address the Government’s unfunded superannuation liability.
The Treasurer and the Minister for Finance and Deregulation set the Investment Mandate for the Future Fund, which, since the Fund’s establishment, has set a benchmark return of at least the CPI plus 4.5 per cent to 5.5 per cent per annum over the long term. The Investment Mandate gives guidance to the Future Fund Board of Guardians (the Board) in relation to its investment strategy. The Board is independently responsible for the investment decisions of the Fund. The Investment Mandate also requires the Board to take an acceptable but not excessive level of risk for the Fund, measured in terms such as the probability of losses in a particular year.
During the initial transition period of the Future Fund, it was envisaged that returns would be lower while investments were built in line with the long-term strategic asset allocation. Since inception, returns have reflected this situation. Returns have also been affected by the difficult investment climate, although the Fund’s performance compared favourably with institutional investors generally during this period.
Since the effective start of the investment program on 1 July 2007, the Future Fund has generated a nominal return of 4.6 per cent. Since the first contribution to the Future Fund on 5 May 2006, the return has been 4.9 per cent per annum.
At 31 March 2012, the Future Fund’s return for the financial year to date was 2.2 per cent.
The Future Fund was valued at $77.0 billion at 31 March 2012. Table 1 shows changes in the asset allocation of the Future Fund over 2011-12.

Statement 7: Asset and Liability Management
7-9
Table 1: Asset allocation of the Future Fund Asset class 30 June 2011 31 March 2012
$m $mAustralian equities 8,278 8,478Global equities 19,604 17,953Private equity 2,896 4,294Property 4,801 4,699Infrastructure 3,911 4,311Debt securities 14,403 14,301Alternative assets 13,768 14,475Cash 6,552 8,537Telstra holding 939 *Total Future Fund assets 75,152 77,049 *Note: In August 2011 the Future Fund Board of Guardians announced that it had achieved market weight in its Telstra holding following the completion of its portfolio rebalancing activity and that it would no longer report its Telstra holding separately from the rest of the portfolio.
Nation-building Funds
The Building Australia Fund (BAF), the Education Investment Fund (EIF) and the Health and Hospitals Fund (HHF) were established on 1 January 2009. These Nation-building Funds were established to finance investment in transport, communications, broadband, energy, water, higher education, research, vocational education and training, and health infrastructure.
The Investment Mandates for the Nation-building Funds, which are set by the Treasurer and the Minister for Finance and Deregulation, give guidance to the Board, which has responsibility for managing the investments of the BAF, EIF and HHF. The Board is responsible for the investment decisions of the funds.
The Investment Mandates set a benchmark return on the Nation-building Funds of the Australian three-month bank bill swap rate plus 0.3 per cent per annum calculated on a rolling 12-month basis (5.2 per cent for the year to 31 March 2012). The Investment Mandates require that investments minimise the probability of capital losses over a 12-month horizon. Consistent with these requirements, the assets of the three funds are invested in combinations of short-term and medium-term debt instruments.
Over the 12 months to 31 March 2012, the BAF and EIF each returned 5.4 per cent, while the HHF returned 5.3 per cent, exceeding the mandated benchmark return of 5.2 per cent.
At the end of the March quarter 2012, the value of the BAF was $6.7 billion, the EIF was $4.6 billion and the HHF stood at $3.9 billion.
The estimated uncommitted balance of funds at 31 March 2012 was $1.7 billion for the BAF, $2.8 billion for the EIF and $0.7 billion for the HHF. These figures are the amounts available for new eligible projects and include net investment earnings up to 31 March 2012.
Statement 7: Asset and Liability Management
7-10
The Nation-building Funds are financial asset funds, consisting of cash and investments in debt instruments. When cash is drawn down from the Funds to fund projects, this reduces the size of the Funds on the balance sheet. In addition, decisions which commit to future spending from the uncommitted balances of the Funds will impact on the underlying cash balance estimates at the time those decisions are taken.
Residential mortgage-backed securities
The global financial crisis led to the profound dislocation of the securitisation market globally, including the Australian residential mortgage backed securities (RMBS) market. In view of these developments, during 2008 and 2009 the Government directed the Australian Office of Financial Management (AOFM) to invest $16 billion in high quality, AAA-rated Australian securities to support competition from smaller lenders in the residential mortgage and small business lending markets.
In December 2010, as part of its Competitive and Sustainable Banking System package, the Government announced a further $4 billion of investment in the RMBS market, with an additional objective of transitioning to a sustainable market, bringing the Government’s total investment commitment to $20 billion.
As at 1 May 2012, the AOFM had invested $14.9 billion of these funds, with $5.1 billion remaining within the AOFM’s mandate to invest in future high-quality RMBS. The program has so far supported 58 securitisation deals to raise over $39.2 billion, assisting 20 smaller mortgage lenders to continue lending to the retail market.
The Government’s securitisation program continues to be successful in supporting smaller lenders access funding to compete in the retail mortgage and business lending markets.
Since 2008, it is estimated that the program has assisted smaller lenders fund over 211,000 home loans and more than $2.4 billion worth of loans to small businesses. Within the banking sector, non-major Australian-owned banks have increased their market share by 1.0 percentage point in the year to March 2012.
The AOFM and the Treasury will continue to monitor conditions in the RMBS market closely.
National Broadband Network
NBN Co Limited (NBN Co) was created in April 2009 to build and operate the National Broadband Network (NBN), the single largest infrastructure project in Australian history. NBN Co is a wholly owned Australian Government company that has been prescribed as a Government Business Enterprise.
There have been some delays to the rollout of the NBN over the course of 2011-12, owing to the delay in finalising the Definitive Agreements between NBN Co and Telstra and in NBN Co negotiating better value construction contracts. As a result,

Statement 7: Asset and Liability Management
7-11
NBN Co’s equity requirement from Government in 2011-12 has decreased to reflect these delays from $3.4 billion to $2.1 billion. The Government will provide $20.1 billion in equity to NBN Co over four years from 2012-13.
The NBN rollout is expected to accelerate in 2012-13 following the Definitive Agreements coming into force on 7 March 2012. On 29 March 2012, NBN Co announced the three year rollout plan for the NBN, which will see construction of the fibre optic network underway or complete in areas containing over 3.5 million premises in 1500 communities in every State and Territory — up to one third of Australia’s homes and businesses.
Higher Education Loan Program
The Higher Education Loan Program (HELP) comprises concessional loans to students that enable them to meet their education costs prior to earning an income above a certain level. The value of HELP is estimated to be around $17.6 billion at 30 June 2012, which is $0.3 billion higher than projected in the 2011-12 Budget. The value of HELP is projected to grow to around $20.3 billion over 2012-13 and $30.6 billion by the end of the forward estimates.
This growth is largely due to the estimated increase in university commencements over the forward estimates, principally the result of the uncapping of Commonwealth Support Places for Undergraduate courses from 1 January 2012 and the expansion of access to the Vocational Education and Training FEE-HELP scheme.
Clean Energy Finance Corporation
On 10 July 2011, the Government announced it would provide $2 billion a year for five years from 2013-14 to the Clean Energy Finance Corporation (CEFC). The CEFC will apply its capital through a commercial filter to increase flows of finance to the clean energy sector. It will invest in the later-stage development of renewable energy, low-emissions technology and energy efficiency. It will also invest in manufacturing businesses that provide inputs for these sectors. The CEFC will use a range of financial instruments to make these investments, including loans on commercial and concessional terms, loans guarantees and equity.
The CEFC will be established by legislation and will operate as a Commonwealth authority. Investment decisions will be made by an independent Board, consistent with a high-level investment mandate set by the Government.
Further information can be found in the measure: Clean Energy Finance Corporation detailed in the 2011-12 Mid-Year Economic and Fiscal Outlook.
Statement 7: Asset and Liability Management
7-12
Liabilities
The Government’s total liabilities are estimated to be $467.6 billion at 30 June 2012, increasing to $487.2 billion in 2012-13 and $509.1 billion by the end of the forward estimates.
Public sector employee superannuation liabilities
Public sector employee superannuation entitlements relating to past and present civilian employees and military personnel are a financial liability on the Government’s balance sheet. The Government’s superannuation liability is estimated to be around $138.5 billion at 30 June 2012.
The Australian Government has never fully funded its superannuation liabilities. The Commonwealth Sector Superannuation (CSS) Scheme and the Public Sector Superannuation (PSS) Scheme were closed to new members in 1990 and 2005 respectively. The Public Sector Superannuation Accumulation Plan was introduced from 1 July 2005 and provides fully funded accumulation benefits for new civilian employees.
Despite these reforms, the value of the Government’s existing superannuation liability is projected to continue growing (in nominal terms) into the future, reaching $159.7 billion by the end of the forward estimates. This is the result of growth in the membership of the Military Superannuation and Benefits Scheme (MSBS), which remains open to new military personnel, and continued growth of entitlements accruing to existing members of the closed civilian and military schemes.
An actuarially determined discount rate is used to estimate the present value of future unfunded superannuation benefits. While recent yields on government bonds have been lower than average, the long-term nature of the unfunded superannuation liability requires the use of a longer-term discount rate. The value recorded on the balance sheet is highly sensitive to the discount rate used. Consistent with the latest Long Term Cost Reports for the civilian and military schemes, the discount rate currently applied is 6.0 per cent per annum.
As the superannuation liability is included in the Government’s net worth and net financial worth aggregates, revaluations of the liability have an impact on these aggregates (see Note 1 in Budget Statement 9).
Commonwealth Government Securities
The face value of the total stock of Commonwealth Government Securities (CGS) on issue at 30 June 2012 is expected to be $235 billion. The face value of Treasury Bonds and Notes represents the amount that the Government pays back at maturity and is independent of fluctuations in market value.

Statement 7: Asset and Liability Management
7-13
CGS are reported on the balance sheet in market value terms, consistent with relevant accounting standards. The market value of CGS reflects bond prices in the secondary market, which are constantly changing with market conditions.
Treasury Bonds
Chart 2 shows the face value of Treasury Bonds outstanding at 30 June 2011 and new issuance in 2011-12. Three new Treasury Bond lines were issued in 2011-12.
Chart 2: Treasury Bonds on issue
0
2
4
6
8
10
12
14
16
18
0
2
4
6
8
10
12
14
16
18
Apr 1 2 Nov 12May 13Dec 13 Jun 14 Oct 1 4 Apr 1 5 Oct 1 5 Jun 16 Fe b 17 Jul 17 Jan 18 Mar 19 Apr 2 0 May 21 Jul 22 Apr 2 3 Apr 2 7
$billion$billion
Treasury Bonds outstanding at beginning of 2011-12 New Bond issuance in 2011-12
Note: New issuance in 2011-12 is to 8 May 2012.
The face value of Treasury Bonds on issue at 30 June 2012 is projected to be around $205 billion, and around $214 billion at 30 June 2013.
Treasury Indexed Bonds
Treasury Indexed Bonds (TIBs) are medium-term to long-term securities that have a capital value which is adjusted for movements in the CPI. Interest is paid quarterly, at a fixed rate, on the adjusted capital value. At maturity, investors receive the adjusted capital value of the security. The Australian Government recommenced the issuance of TIBs in 2009-10.
TIBs contribute to the management of Australian Government debt by widening the range of available debt instruments, diversifying risk and tapping additional sources of investor demand.
Chart 3 shows TIBs outstanding at 30 June 2011 and new issuance in 2011-12.

Statement 7: Asset and Liability Management
7-14
Chart 3: Treasury Indexed Bonds on issue
0
0.5
1
1.5
2
2.5
3
3.5
4
4.5
5
5.5
0
0.5
1
1.5
2
2.5
3
3.5
4
4.5
5
5.5
4% Aug 15 4% Aug 20 1.25% Feb 22 3% Sep 25 2.5% Sep 30
$billion$billion
Face value of TIBs outstanding at beginning of 2011-12 New TIBs issuance in 2011-12 Note: New issuance in 2011-12 is to 8 May 2012.
The face value of TIBs on issue at 30 June 2012 is projected to be around $16 billion, and around $18 billion at 30 June 2013.
Interest payments made on TIBs are reflected in the Government’s cash flow statements, with the adjusted capital value paid in the year which the bond matures. In 2015-16 there is an increase in interest paid as a result of the August 2015 TIB maturing.
Treasury Notes
Treasury Notes are short-term debt securities used primarily to meet within-year financing requirements resulting from differences in the timing of receipts and payments. The volume of Treasury Notes on issue will vary over the course of the year, depending on the size and profile of the within-year funding flows. It is anticipated that at least $10 billion of Treasury Notes will be kept on issue at all times to maintain a liquid market in Treasury Notes.
The face value of Treasury Notes on issue at 30 June 2012 is projected to be around $15 billion.
Aussie Infrastructure Bonds
In April 2009, the Government announced that its investment in NBN Co would be partly funded through the issuance of Aussie Infrastructure Bonds (AIBs).
AIBs were not required prior to 2011-12, as the Government’s equity contributions were met in full with funds from the Building Australia Fund. In 2011-12, it is expected

Statement 7: Asset and Liability Management
7-15
that around $1.7 billion of the Government’s $2.1 billion equity investment in the National Broadband Network will be financed by AIBs, through wholesale issuance of CGS as part of the AOFM’s overall debt issuance program.
From 2012-13, all of the Government’s equity contributions to NBN Co will be funded through AIBs. In 2012-13, this is expected to be around $5.8 billion.

Statement 7: Asset and Liability Management
7-16
THE COMMONWEALTH GOVERNMENT SECURITIES MARKET
In the 2011-12 Budget, the Government reaffirmed that its primary objective for the future of the Commonwealth Government Securities (CGS) market is to maintain liquidity to support the three- and ten-year bond futures market. The experience of the global financial crisis underscored the value in maintaining a liquid and efficient CGS market of sufficient size to support the long-term stability of the financial markets.
In considering the future of the CGS market, including the size needed to ensure liquidity, the Government’s deliberations were informed by discussion with a panel of financial market participants and financial regulators. The panel considered the impact of the global financial crisis, the new global liquidity standards and the changing composition of the CGS investor base on the CGS market.
Since the 2011-12 Budget there have been significant developments in world financial markets that have had implications for the CGS market, in particular the growing demand from international investors for Australian dollar denominated securities, including CGS, against a backdrop of global economic volatility and persistently weak sovereign balance sheets in many other advanced economies.
The strength of Australia’s economy and public finances, which is reinforced by the Government returning the budget to surplus, stands in stark contrast to many other sovereigns facing a significant task of generating growth and placing public finances on a sustainable footing. Australia is one of only eight countries to have a AAA credit rating with a stable outlook from all three major rating agencies.
Since the last Budget, a number of factors have influenced the fall in yields on bonds of all maturities (see Box 3). The benchmark borrowing rate for the 10-year Treasury Bond has fallen to some of the lowest levels in Australia’s history.

Statement 7: Asset and Liability Management
7-17
Box 3: Increased demand for Australia’s sovereign debt
In the year since the last Budget, CGS yields have fallen substantially across the yield curve, (Chart A) resulting in lower borrowing rates for the Government.
The movement in the Australian yield curve reflects a range of factors. The weak and fragile global economy has put downward pressure on benchmark global long-term bond yields. This weak global economy has also driven investors into high quality government debt. As a result, Australia is reaping the benefits of a deep and liquid AAA-rated CGS market, increasing the diversity of the buyers of government debt. Shorter-term bond yields have also moved, primarily owing to the changed stance of monetary policy.
As a result of this fall in yields, the market value of CGS outstanding has increased while the face value is not affected.
Chart A: Yield curve for Treasury Bonds
0
1
2
3
4
5
6
0
1
2
3
4
5
6
2011 2013 2015 2017 2019 2021 2023 2025
Per centPer cent
2012-13 Budget
2011-12 Budget
Note: Yields are indicative mid-rates of CGS. Data for the 2011-12 Budget and 2012-13 Budget refer to yields on 10 May 2011 and on 1 May 2012 respectively. Source: RBA.
CGS on issue subject to the current legislative limit is projected to be below $250 billion at the end of each financial year across the forward estimates. The volume of CGS on issue at various times throughout the year is projected to exceed this level due to within-year fluctuations of CGS on issue. Within-year fluctuations of CGS on issue are a normal feature of the annual financing task.
The two key drivers of within-year fluctuations of CGS on issue are: the difference in timing between Government outlays and revenue collections throughout the financial year; and the timing of bond maturities. Treasury Note issuance is the most efficient and effective means of managing within-year financing requirements.

Statement 7: Asset and Liability Management
7-18
Government payments occur relatively evenly across the financial year whereas tax collections in the last quarter of the financial year tend to be higher than in other quarters. As a consequence year-to-date expenditure exceeds year-to-date receipts for the majority of the year. The Australian Office of Financial Management (AOFM) manages this timing difference principally by issuing Treasury Notes.
In advance of bond lines maturing, the AOFM accumulates sufficient funds, including through Treasury Note issuance, to repay these bonds. This means that in the lead up to the maturity of a bond line there is a temporary increase in the amount of total CGS on issue owing to the combined value of the Treasury Notes and the maturing bond on issue. The volume of CGS on issue falls on the maturity date of the bond by the face value amount of that bond.
To ensure flexibility in meeting the Government’s objective of maintaining a deep and liquid CGS market, and to manage most efficiently the normal within-year financing task, an amendment will be sought to the Commonwealth Inscribed Stock Act 1911 to increase the legislative limit on CGS to $300 billion.
8-1
STATEMENT 8: STATEMENT OF RISKS
A range of factors may influence the actual budget outcome in future years. The Charter of Budget Honesty Act 1998 requires these factors to be disclosed in a statement of risks in each Budget and Mid-Year Economic and Fiscal Outlook. This statement outlines general fiscal risks, specific contingent liabilities and specific contingent assets that may affect the budget balances.
Risks to the Budget — overview ................................................................ 8-3
Economic and other parameters ................................................................ 8-4
Fiscal risks .................................................................................................... 8-5
Contingent liabilities and assets ................................................................ 8-6
Contingent liabilities — quantifiable .......................................................... 8-8 Broadband, Communications and the Digital Economy ............................................... 8-8 Defence and Defence Materiel Organisation ............................................................... 8-9 Education, Employment and Workplace Relations ...................................................... 8-9 Finance and Deregulation ............................................................................................ 8-9 Foreign Affairs and Trade ............................................................................................ 8-9 Health and Ageing ...................................................................................................... 8-10 Treasury ..................................................................................................................... 8-10
Contingent liabilities — unquantifiable .................................................... 8-12 Agriculture, Fisheries and Forestry ............................................................................ 8-12 Attorney-General’s ..................................................................................................... 8-13 Broadband, Communications and the Digital Economy ............................................. 8-14 Climate Change and Energy Efficiency ..................................................................... 8-14 Defence and Defence Materiel Organisation ............................................................. 8-15 Finance and Deregulation .......................................................................................... 8-16 Foreign Affairs and Trade .......................................................................................... 8-19 Health and Ageing ...................................................................................................... 8-19 Immigration and Citizenship ....................................................................................... 8-21 Industry, Innovation, Science, Research and Tertiary Education .............................. 8-22 Infrastructure and Transport ....................................................................................... 8-22 Resources, Energy and Tourism ................................................................................ 8-23 Sustainability, Environment, Water, Population and Communities ............................ 8-24 Treasury ..................................................................................................................... 8-25

8-2
Contingent assets — unquantifiable ........................................................ 8-27 Health and Ageing ...................................................................................................... 8-27 Industry, Innovation, Science, Research and Tertiary Education .............................. 8-27

8-3
STATEMENT 8: STATEMENT OF RISKS
The forward estimates of revenue and expenses in the 2012-13 Budget incorporate assumptions and judgments based on the best information available at the time of publication. A range of factors may influence the actual budget outcome in future years. The disclosure of these factors in this statement increases the transparency of the fiscal projections.
Events that could affect fiscal outcomes include:
• changes in economic and other parameters; particularly global economic developments;
• matters not included in the fiscal forecasts because of uncertainty about their timing, magnitude or likelihood; and
• the realisation of contingent liabilities or assets.
RISKS TO THE BUDGET — OVERVIEW
The revenue and expense estimates and projections published in the 2012-13 Budget Papers are based on a range of economic and other parameters. If the economic outlook were to differ from that presented in the Budget, the revenue and expense estimates and projections would also change. The sensitivity of Budget estimates to changes in economic assumptions is discussed in Appendix A of Statement 3.
Although the Australian economy is forecast to grow at around its trend rate over the forward estimates, a degree of uncertainty continues in global financial markets and will continue to present risks to the forecasts. Moreover, the effects of the earlier economic downturn continue to weigh on tax collections.
To the extent that unanticipated changes in economic circumstances occur, their impact will flow through to government payments and revenue forecasts in particular. For example, over the past year the outlook for economic growth and tax revenue in 2011-12 has weakened due to volatile financial markets, weaker employment and wages growth and softer asset prices.
In addition, revenue forecasting relies heavily on the observed historical relationships between the economy, tax bases and tax revenues. Such relationships may shift as economic conditions change and present a further risk to the estimates. For example, the real and financial dimensions of the deterioration in the global economy and uneven domestic conditions have posed particular challenges in estimating both the quantum and timing of loss utilisation. Losses incurred during the downturn can be carried forward to offset gains or profits as the economy recovers, such that to the

Statement 8: Statement of Risks
8-4
extent tax revenue improves it does so with some lag. Further, the structural changes in the economy driven by the mining boom are leading to structural changes in tax bases.
As in previous years, the Budget is subject to a number of contingent liabilities. A large number of these contingent liabilities reflect indemnities, including those relating to the Department of Defence, the Defence Materiel Organisation, the Future Fund Management Agency and Future Fund Board of Guardians, and the Reserve Bank of Australia.
The Government has also issued a number of guarantees, such as those relating to guarantee schemes for the banking and financial sector, payments by the Export Finance and Insurance Corporation and the superannuation liabilities of the Commonwealth Bank prior to its sale to the private sector.
Other significant contingent liabilities relate to uncalled capital subscriptions and credit facilities to international financial institutions and legal cases concerning the Australian Government. The Government continues to have robust and conservative strategies in place to reduce its potential exposure to these contingent liabilities.
There have been several changes to both the quantifiable and unquantifiable risks since the Mid-Year Economic and Fiscal Outlook 2011-12 (MYEFO). General revaluations of securities and deposits have led to certain risks such as the Guarantee of State and Territory Borrowings and the Financial Claims Scheme being modified. Some new risk items have also arisen since the MYEFO.
Contingent liabilities, contingent assets and other fiscal risks with a possible impact on the forward estimates greater than $20 million in any one year, or $50 million over the forward estimates period, are listed in this statement. Information on contingent liabilities and contingent assets is also provided in the annual financial statements of departments and non-budget entities.
ECONOMIC AND OTHER PARAMETERS
Changes in economic parameters represent a risk to the expenses and revenue estimates included in the Budget. As noted earlier, the uncertainty currently surrounding the global economic outlook implies that the degree of risk to the fiscal outlook remains elevated. Appendix A of Statement 3 examines the impact on revenue and expenses of altering some of the key economic assumptions underlying the Budget estimates.
Statement 8: Statement of Risks
8-5
FISCAL RISKS
Fiscal risks comprise general developments or specific events that may affect the fiscal outlook. Some developments or events raise the possibility of a fiscal impact. In other cases, the likelihood of a fiscal impact may be reasonably certain, but will not be included in the forward estimates because the timing or magnitude is not known.
Major taxes such as company and individuals’ income taxes fluctuate significantly with economic activity. Capital gains tax is particularly volatile and is affected by both the level of gains in asset markets and the timing of when those gains are realised. Resource rent taxes may vary quite significantly, particularly with movements in commodity prices and the level of the Australian dollar. Revenue from carbon permit sales for the flexible price period may also vary owing to changes in the world price of carbon permits.
The estimates and projections of revenue are subject to a number of general risks that can affect taxation collections. These general pressures include tax avoidance, court decisions, Australian Taxation Office rulings and the outcome of compliance programs. These pressures may result in a shift in the composition of taxation collected from the various tax bases and/or a change in the size of the tax base.
There are also a number of fiscal risks that may affect the expense estimates and projections. For example, major technological advances in medicines and medical practices may lead to changes to the Medicare Benefits Schedule and the Pharmaceutical Benefits Scheme. Other examples of fiscal risks include emergency foreign aid and potential natural disasters. Such occurrences have in the past resulted in unexpected increases in expenses and may do so again. Specific fiscal risks identified for the Budget and forward estimates are detailed below.
The estimates for the Department of Defence include the cost of major overseas operations of the Australian Defence Force in Afghanistan and the Middle East and the Solomon Islands for 2012-13. They also include the cost of the Timor-Leste operation for the period July to December 2012. The forward estimates of expenses do not provide for extensions of currently approved operations beyond 2012-13. Such funding is considered on a year-by-year basis and is subject to future decisions of the Government. This is consistent with past practice.
The Australian Government has supported the Gold Coast’s bid to host the 2018 Commonwealth Games through the provision of commitments in areas such as immigration, customs, work permits, taxation, security, protection of commercial rights, and communications and information technology. Costs and timing associated with implementing the commitments are not available at this time.
The Energy Security Council was established as part of the Clean Energy Future package to advise on support measures to address energy security risks. The Council assesses applications for financial assistance in the form of loans for generator owners

Statement 8: Statement of Risks
8-6
who need to refinance their debt if finance on reasonable commercial terms is not otherwise available. The Council will also consider applications for loans or other assistance to address systemic risk to energy security in the event of financial distress on the part of an energy market participant. Factors relevant to the realisation of this risk include the circumstances of the generator owners and their ability to access finance from the commercial market.
The Social Security Amendment (Supporting Australian Victims of Terrorism Overseas) Bill 2011 was introduced into Parliament on 24 March 2011. If passed, this legislation would establish a framework for the provision of financial assistance for Australians who are injured overseas as a result of terrorist acts and for close family members of Australians who are killed overseas as a result of terrorist acts. The legislation would enable the Prime Minister to declare that a relevant overseas terrorist incident is one to which the scheme applies. As acts of terrorism are unpredictable, the cost of the scheme is unquantifiable.
CONTINGENT LIABILITIES AND ASSETS
Contingent liabilities and contingent assets of the Australian Government are listed below by portfolio. These contingent liabilities and assets are a specific category of fiscal risks. Broadly, they represent possible costs or gains to the Australian Government arising from past events or decisions which will be confirmed or otherwise by the outcome of future events that are not within the Government’s control.
Contingent liabilities include loan guarantees, non-loan guarantees, warranties, indemnities, uncalled capital and letters of comfort. These possible costs are in addition to those recognised as liabilities in the consolidated financial statements of the Australian Government general government sector.
In general, information on contingent liabilities and assets is based on information provided by Australian Government departments and entities and is current to 31 March 2012. In some cases, other dates are used and those are noted in the relevant section.

Statement 8: Statement of Risks
8-7
Table 1: Summary of material changes to contingent liabilities and contingent assets in the Statement of Risks since the 2011-12 Budget and the 2011-12 MYEFO(a)
Contingent liabilities — quantifiable
Broadband, Communications and the Digital Economy NBN Co Limited — Equity Agreement Modified
Telstra Financial Guarantee Modified
Defence and Defence Materiel Organisation Indemnities and remote contingencies Modified
Finance and Deregulation Sale of Sydney Airports Corporation Limited Modified
Foreign Affairs and Trade Export Finance and Insurance Corporation Modified
Health and Ageing Guarantee Scheme for aged care accommodation bonds Modified
Immigration and Citizenship Education Services to Minors in Alternative Places of Detention(b) Removed
Treasury Australian Taxation Office — tax disputes Modified
International financial institutions — uncalled capital subscriptions Modified
International Monetary Fund Modified
Reserve Bank of Australia — guarantee Modified
Contingent liabilities — unquantifiable
Agriculture, Fisheries and Forestry National Environmental Biosecurity Response Agreement(c) Removed
Compensation claims arising from suspension of livestock exports to Indonesia New
Defence and Defence Materiel Organisation Indemnities and remote contingencies Modified
Finance and Deregulation Comcover — insurance claims and reinsurance recoveries Modified
Future Fund Management Agency and Future Fund Board of Guardians — indemnity Modified
Litigation — Davis Samuel case Modified
Superannuation(d) Removed
Health and Ageing Legal proceedings against the Professional Services Review impacting on the validity of past Committees New
Immigration and Citizenship Education Services to Minors in Alternative Places of Detention — South Australia New
Regional Australia, Local Government, Arts and Sport
National Aboriginal Islander Skills Dance College (NAISDA) — construction works(c) Removed
Whole-of-Government — 2015 Asian Football Confederation (AFC) Asian Cup — Government Guarantees(e) Removed
Sustainability, Environment, Water, Population and Communities Murray-Darling Basin Reform — risk assignment Modified
Statement 8: Statement of Risks
8-8
Table 1: Summary of material changes to contingent liabilities and contingent assets in the Statement of Risks since the 2011-12 Budget and the 2011-12 MYEFO(a) (continued)
Contingent liabilities — unquantifiable (continued)
Treasury
Financial Claims Scheme Modified
Guarantee of State and Territory Borrowing Modified
Guarantee Scheme for Large Deposits and Wholesale Funding Modified
Contingent assets — unquantifiable
Health and Ageing
Legal action seeking compensation from Sanofi-Aventis New (a) Risks appearing in this Statement but not listed in the table above are substantially unchanged since
disclosed in Budget Paper No. 1, Budget Strategy and Outlook 2011-12, Statement 8 or in the Mid-Year Economic and Fiscal Outlook 2011-12, Appendix C.
(b) Memorandum of Understanding surrounding this item expired at the end of the 2011 school year. (c) This item has fallen below the reporting threshold for the 2012-13 Budget. (d) This item is now disclosed under Comcover — insurance claims and reinsurance recoveries. (e) The Government has made a decision in relation to this item and it is no longer classified as a contingent
liability.
CONTINGENT LIABILITIES — QUANTIFIABLE
Broadband, Communications and the Digital Economy
NBN Co Limited — Equity Agreement
The Australian Government has entered into an Equity Funding Agreement with NBN Co. The Agreement formalises the Australian Government’s intention to provide equity to fund the roll out of the National Broadband Network (NBN), with such funding being conditional on the annual appropriation processes. It also commits the Australian Government, in the event of a termination of the NBN roll out, to provide sufficient funds to NBN Co to meet its direct costs arising from the termination. The NBN Co Equity Agreement terminates in 2021. As at 31 March 2012, NBN Co’s termination liabilities were estimated at $1.8 billion.
Telstra Financial Guarantee
The Australian Government has provided a guarantee to Telstra in respect of NBN Co’s financial obligations to Telstra under the Definitive Agreements. The Definitive Agreements are long term contracts and, in the case of the infrastructure component, involve terms of at least 35 years. The liabilities under the Definitive Agreements arise progressively during the roll out of the network as infrastructure is accessed and subscribers to Telstra’s existing network are disconnected. As at 31 March 2012, NBN Co had generated liabilities covered by the Guarantee estimated at $209 million. The Guarantee will terminate when NBN Co achieves specified credit ratings for a period of two continuous years and either:
• the company is fully capitalised; or
Statement 8: Statement of Risks
8-9
• the Minister for Communications declares, under the National Broadband Network Companies Act 2011, that, in his or her opinion, the National Broadband Network should be treated as built and fully operational.
Defence and Defence Materiel Organisation
Indemnities and remote contingencies
As at 31 March 2012, Defence had quantifiable significant remote contingent liabilities with a nominal value of $2.5 billion. These significant remote contingent liabilities are restricted in nature and details are not published because of commercial-in-confidence and/or national security reasons. The Defence Materiel Organisation carries 92 contingencies that are quantifiable, to the value of $3.15 billion. While these contingencies are considered remote, they have been reported in aggregate for completeness.
Education, Employment and Workplace Relations
Comcare liability for additional workers’ compensation payments
Comcare has a quantifiable contingency in respect of future statutory workers’ compensation claims for asbestos related diseases amounting to $45.6 million. This contingency relates to a decision in the Federal Court, Comcare v Etheridge (2006) Federal Court of Australia Full Court decision number 27.
Finance and Deregulation
Sale of Sydney Airports Corporation Limited
An indemnity was provided to Southern Cross Airports Corporation as the purchaser of the Sydney Airports Corporation Limited (SACL) in the event of a liability arising under Chapter 3 of the Duties Act 1997 (NSW) by reason of the sale of shares in SACL constituting a relevant acquisition in a land-rich private corporation. The New South Wales (NSW) Office of State Revenue issued a notice of assessment on 17 November 2006. The Australian Government maintains that there are no grounds for the assessment and action has been initiated in the NSW Supreme Court to overturn the assessment. The amount disputed is estimated at $590.2 million as at 31 March 2012.
Foreign Affairs and Trade
Export Finance and Insurance Corporation
The Australian Government guarantees the due payment of money that is, or may at any time become, payable by the Export Finance and Insurance Corporation (EFIC) to anybody other than the Government. The Government also has in place a $200 million callable capital facility available to EFIC on request to cover liabilities, losses and claims. As at 31 March 2012, the Government’s total contingent liability with EFIC was $3.4 billion, unchanged from the 2011-12 MYEFO. This liability comprises EFIC’s
Statement 8: Statement of Risks
8-10
liabilities to third parties ($2.7 billion) and EFIC’s overseas investment insurance, contracts of insurance and guarantees ($0.7 billion). Of the total $3.4 billion liability, $2.8 billion relates to EFIC’s Commercial Account and $0.6 billion relates to the National Interest Account.
Health and Ageing
Guarantee Scheme for aged care accommodation bonds
A Guarantee Scheme has been established through the Aged Care (Bond Security) Act 2006 and Aged Care (Bond Security) Levy Act 2006. Under the Guarantee Scheme, if a provider becomes insolvent or bankrupt and is unable to repay outstanding bond balances to aged care residents, the Australian Government will repay the bond balances owing to each resident. In return, the resident’s rights to pursue the defaulting provider to recover the accommodation bond money transfers to the Government. In the event the Government cannot recover the full amount from the defaulting provider, it may levy all providers holding accommodation bonds to recoup the shortfall. On 30 June 2011, the maximum contingent liability, in the very unlikely event that all providers defaulted, was $12.1 billion.
Aged care providers will be required to insure any accommodation bonds that they will hold in respect of care recipients who enter care on or after 1 July 2014.
Treasury
Australian Taxation Office — tax disputes
At any point in time the Australian Taxation Office is involved in a range of dispute resolution processes, including litigation, relating to tax disputes.
Outcomes of dispute resolution processes, including objections, settlements and court and tribunal decisions, are set out in the Commissioner of Taxation’s Annual Report each year. In addition, amounts owed by taxpayers that are subject to dispute, including objections and appeals, are also disclosed in the Commissioner of Taxation’s Annual Report each year. The estimated aggregate value of tax in dispute is $8.8 billion as at 20 April 2012.
Details of the outcome of dispute resolution processes are uncertain until a court ruling is made and/or an agreement is reached with the taxpayer at some future date. As a result, it is not possible to estimate with any reliability the likely financial impact of current disputes.
Guarantees under the Commonwealth Bank Sale Act 1995
Under the terms of the Commonwealth Bank Sale Act 1995, the Australian Government has guaranteed various superannuation and other liabilities amounting to $4.5 billion as of 31 December 2011. Of this amount, $0.8 billion is attributable to liabilities of the
Statement 8: Statement of Risks
8-11
Commonwealth Bank of Australia and $3.7 billion is attributable to liabilities of the Commonwealth Bank Officers’ Superannuation Corporation.
International financial institutions — uncalled capital subscriptions
The Australian Government has held uncalled capital subscriptions in the International Bank for Reconstruction and Development (IBRD) since 1947. The Government will contribute additional resources to the IBRD as part of the general capital increase agreed during 2010. The paid-in component of Australia’s contribution was a measure in the 2010-11 Budget. As part of this process, Australia will increase its uncalled capital subscription to US$3.6 billion (estimated value A$3.4 billion as at 30 March 2012).
Australia has also held uncalled capital subscriptions in the European Bank for Reconstruction and Development (EBRD) since 1991. The Government increased its uncalled capital subscription (effective 20 April 2011) to the EBRD as part of its 2010 general capital increase so that it totals EUR237.5 million (estimated value A$305.0 million as at 30 March 2012). The financial implications of the paid-in component were reported as a measure in the 2010-11 MYEFO.
The Australian Government also holds uncalled capital subscriptions in the Asian Development Bank of US$7.0 billion (estimated value A$6.8 billion as at 30 March 2012), and the Multilateral Investment Guarantee Agency of US$26.5 million (estimated value A$25.4 million as at 30 March 2012).
None of these international financial institutions has ever drawn on Australia’s uncalled capital subscriptions.
International Monetary Fund
Australia has made a line of credit available to the International Monetary Fund (IMF) under its New Arrangements to Borrow (NAB) since 1998. In line with G20 Leaders’ commitments, Australia joined with other countries to increase its credit line under an expanded NAB. When the expanded NAB came into effect on 11 March 2011, Australia’s NAB credit arrangement increased from SDR801.3 million (an estimated value of A$1.2 billion as at 30 March 2012) to SDR4.4 billion (an estimated value of A$6.5 billion). This is a contingent loan to help ensure that the IMF has the resources available to maintain stability and support recovery in the global economy. As agreed by G20 Finance Ministers and IMF Governors in late 2010, the credit arrangements of all NAB participants, including Australia, will be reduced when the increase in IMF quotas comes into effect. This is likely to occur in 2012-13.
On 20 April 2012, as part of a broad international effort to increase the resources available to the IMF, Australia committed to provide a US$7.0 billion (estimated value A$6.7 billion) contingent bilateral loan to the IMF, subject to domestic legislative processes. The contingent loan would be on terms consistent with separate bilateral loan and note purchase agreements to be concluded between the IMF and all

Statement 8: Statement of Risks
8-12
contributing countries. It would be drawn upon by the IMF only if needed to supplement the IMF’s quota and NAB resources and would be repaid in full with interest. The increase in the IMF’s resources will help ensure that it has the capability to address any potential vulnerability facing the global economy.
Reserve Bank of Australia — guarantee
This contingent liability relates to the Australian Government’s guarantee of the liabilities of the Reserve Bank of Australia. It is measured as the Bank’s total liabilities excluding capital, reserves, and Australian Government deposits. The major component of the Bank’s liabilities is notes (that is, currency) on issue. Notes on issue amount to $53.1 billion as at 28 March 2012, and the total guarantee is $62.0 billion, up from $56.7 billion at the 2011-12 MYEFO.
CONTINGENT LIABILITIES — UNQUANTIFIABLE
Agriculture, Fisheries and Forestry
Compensation claims arising from equine influenza outbreak
The Australian Government may become liable for compensation should it be found negligent in relation to the outbreak of equine influenza in 2007.
On 12 June 2008, the Minister for Agriculture, Fisheries and Forestry released the Equine Influenza Inquiry report. Subsequently, a number of organisations have indicated their intention to proceed with legal action against the Government. To date, 18 claims have been received. Court proceedings have commenced for two of these. The Department of Finance and Deregulation assumed responsibility for claims under its insurance arrangements with the Department of Agriculture, Fisheries and Forestry.
Compensation claims arising from suspension of livestock exports to Indonesia
The Australian Government may become liable for compensation following the decision by the Minister for Agriculture, Fisheries and Forestry to suspend the export of livestock to Indonesia for a period of 1 month in 2011. A potential class action has been received from a law firm on behalf of 21 clients. The Department of Agriculture, Fisheries and Forestry has also received a claim under the Scheme for Compensation for Detriment caused by Defective Administration (CDDA) from a law firm on behalf of three of its clients. The department is working with the Department of Finance and Deregulation, the Australian Government Solicitor and the Attorney-General’s Department to progress the claims.
Emergency Animal Disease Response Agreement and Emergency Plant Pest Response Deed
The Australian, State and Territory governments and some peak agricultural industry bodies are parties to cost sharing agreements that specify how responses to emergency animal diseases and plant pest and disease outbreaks will be funded. Under the terms

Statement 8: Statement of Risks
8-13
of the agreements, the Commonwealth is typically liable for 50 per cent of total government funding to respond to a disease or pest outbreak and may also provide financial assistance to industry by funding its share of the response. Any funding of industry contributions would subsequently be recovered from the industry, usually by a levy. Potential costs vary based on circumstances and are dependent on outbreaks of animal diseases or plant pests or diseases, the extent of outbreaks, frequency and location.
Attorney-General’s
Native Title agreements — access to geospatial data
The Australian Government has entered into agreements with State and Territory government bodies and/or their agents to access their geospatial land tenure data, which is essential to support the National Native Title Tribunal in achieving its outcome. Under these agreements, the Australian Government provides indemnities against third-party claims arising from errors in the data.
Native Title costs
The Australian Government has previously offered to assist the States and Territories in meeting certain Native Title costs pursuant to the Native Title Act 1993 (the NTA), including compensation costs. Consistent with the policy of considering this issue on a case by case basis, a National Partnership Agreement was executed in 2010 between the Commonwealth and Victoria, under which the Commonwealth will provide a contribution towards the settlement of two native title claims. No other agreement under this offer has been entered into to date.
The Australian Government will also be liable for any compensation found to be payable under the NTA in respect of compensable acts for which the Commonwealth is responsible.
The Australian Government’s liability in both scenarios cannot be quantified owing to uncertainty about the number and effect of compensable acts and the value of Native Title affected by those acts.
Northern Patrol and Response — Ashmore Guardian and Triton
The Australian Government has entered into contractual arrangements with Gardline Australia Pty Ltd for the provision of two vessels to strengthen enforcement activities in Australia’s northern waters and to patrol and respond to incursions in the Ashmore Reef National Nature Reserve and the Cartier Island Marine Reserve. The contracts with Gardline Australia contain unquantifiable indemnities relating to the use or other operations of armaments and the presence of armaments on the vessel. They also contain unquantifiable indemnities relating to damage to any property or injury to any person caused by the apprehended or escorted persons or their vessels.

Statement 8: Statement of Risks
8-14
Southern Ocean Maritime Patrol and Response Program
The Australian Government has entered into a contract to provide a Civil Charter Vessel to conduct patrols in the Southern Ocean and northern waters to undertake law enforcement activities in relation to illegal, unregulated and unreported fishing as well as people smuggling activities. This agreement will remain in force until 30 June 2014. The Australian Government’s contract contains unquantifiable indemnities relating to the use or other operations of armaments and ammunition and the presence of armaments and ammunition on the vessel. It also contains unquantifiable indemnities relating to damage to any property or injury to any person caused by the apprehended or escorted persons or their vessels.
Broadband, Communications and the Digital Economy
NBN Co Limited — Board Members’ Insolvency Indemnity
The Australian Government has provided each Director of NBN Co with an indemnity against liability as a result of the Government failing to meet its funding obligations to NBN Co. The liabilities covered by this indemnity would be the same as those covered by the NBN Co Equity Agreement, with the exception of any legal expenses incurred by individual Directors arising from this indemnity. The Directors are also indemnified in relation to claims arising out of their involvement in the negotiation and entry by NBN Co into the Financial Heads of Agreement with Telstra.
Optus Financial Guarantee
The Australian Government has provided a guarantee to Optus in respect of NBN Co’s financial obligations to Optus under the NBN Co-Optus Agreement, which is subject to satisfying the conditions precedent to the Agreement. That Agreement covers the period of the NBN roll out in Optus Hybrid Fibre Coaxial areas. As at 31 March 2012, the conditions precedent in the NBN Co-Optus Agreement had not been satisfied and the guarantee had therefore, not come into effect.
Termination of the funding agreement with OPEL
Following the termination of its funding agreement with OPEL Network Pty Ltd (OPEL) under the Broadband Connect Infrastructure program, the Commonwealth made provision towards costs incurred by OPEL in producing its Implementation Plan. OPEL was wound up on 13 March 2009. The liquidators of OPEL have indicated that they consider the Australian Government to have a liability with regard to the termination of the funding agreement. As at 31 March 2012, no legal proceedings have been filed.
Climate Change and Energy Efficiency
Kyoto Protocol — emissions target
As a party to the Kyoto Protocol, Australia is required to meet its target level for emissions over the first Commitment Period, 2008-2012. According to the latest

Statement 8: Statement of Risks
8-15
projections of emissions over the Commitment Period, Australia is on track to more than meet its 2008-2012 target. Estimates of the likely net balance and value of these permits will be determined when the final reconciliation of Australia’s emissions against its commitments is completed in 2015.
Defence and Defence Materiel Organisation
Indemnities and remote contingencies
As at 31 March 2012, Defence had no unquantifiable significant remote contingent liabilities, revised from the 9,985 instances reported in the 2011-12 MYEFO. Defence has recently reviewed its reporting of contingent liabilities and found previously reported liabilities (such as novated leases, fleet management agreements and minor indemnities) to be insignificant and no longer required to be disclosed in the Statement of Risks. The Defence Materiel Organisation carries 460 instances of contingencies (including Foreign Military Sales) that are unquantifiable. While these contingencies are considered remote, they have been reported in aggregate for completeness.
ADI Limited — Officers’ and Directors’ indemnities
Under the sale agreements for ADI Limited, the Australian Government agreed to indemnify the directors, officers and employees for claims and legal costs associated with assistance related to the sale of the Australian Government’s shares in the company. The Australian Government has provided an indemnity to ADI Limited for uninsured losses relating to specific heads of claims.
Decontamination of Defence sites
Defence has made financial provision for the possible costs to remediate contamination of Defence sites in Australia where a legal or constructive obligation has arisen. Defence has identified other sites where an obligation may exist; the potential costs of these liabilities are unquantifiable.
Litigation cases
The Department of Defence is involved in a wide range of litigation and other claims for compensation and/or damages that may result in litigation where the matters are not able to be finalised by use of negotiation. The litigation includes common law liability claims, including for injury alleged to have resulted from the F-111 Deseal/Reseal programs. A number of claims have also been received for damage caused by the use of a Defence Practice Area. There is also the potential for a number of claims to arise out of reviews into Australian Defence Force and Defence culture.

Statement 8: Statement of Risks
8-16
Finance and Deregulation
ASC Pty Ltd — Directors’ indemnities
The Australian Government has provided former directors and one current director of the ASC Pty Ltd (ASC) with indemnities in relation to three matters: for any claim against them as a result of complying with the ASC’s obligations under the Process Agreement between the Electric Boat Corporation (EBC), the Australian Government and the ASC; for any claim against them as a result of complying with the ASC’s obligations under the Service Level Agreement between the ASC, the Department of Defence, EBC and Electric Boat Australia; and for any claims and legal costs arising from the directors acting in accordance with the Board’s tasks and responsibilities, as defined under the indemnity.
Australian Government domestic property
The Australian Government’s domestic property portfolio managed by the Department of Finance and Deregulation has approximately 90 properties. A small number of these have had potential remediation issues identified which are currently the subject of further investigation. None of these properties has had a provision recognised as the conditions for neither legal nor constructive obligations have been met, nor is a reliable estimate of the obligation currently possible.
Comcover — insurance claims and reinsurance recoveries
The Department of Finance and Deregulation (Finance) manages Comcover, the Australian Government’s general self-insurance fund, which provides related services to Australian Government departments and agencies. Finance’s liability for outstanding claims includes the expected future cost of claims notified to Comcover as well as claims incurred but not reported. The provision for claims is subject to inherent uncertainty in the estimation process.
Following from the settlement of claims associated with Pan Pharmaceuticals, Comcover is now in dispute with its reinsurers regarding the amount recoverable through reinsurance arrangements. Comcover has sought legal advice and is pursuing the amount that is considered recoverable.
On 20 April 2007, the High Court of Australia found against the Australian Government on a claim for negligent mis-statement relating to superannuation benefits for a former employee of the then Department of the Interior. There is potential for more claims to arise from other former temporary employees who upon their retirement can demonstrate negligent mis-statement over their eligibility to join an Australian Government superannuation scheme.
Commonwealth Superannuation Corporation — immunity and indemnity
The Governance of Australian Government Superannuation Schemes Act 2011 (the Governance Act) provides for specific immunities for activities undertaken in good faith by directors and delegates of the board of the Commonwealth Superannuation
Statement 8: Statement of Risks
8-17
Corporation (CSC), provided these activities relate to the performance of their functions. These immunities do not prevent CSC from being subject to any action, liability, claim or demand. Under the Governance Act, other than in cases where the Superannuation Industry (Supervision) Act 1993 or regulations under that Act do not so permit, any money that becomes payable by CSC in respect of the superannuation schemes or funds for which it is responsible, is to be paid out of the relevant superannuation fund or if there is no fund, the Consolidated Revenue Fund (CRF). Amounts paid from a superannuation fund are reimbursed to the fund from the CRF.
Future Fund Management Agency and Future Fund Board of Guardians — indemnity
The Australian Government has provided certain staff members of the Future Fund Management Agency (FFMA) and the members of the Future Fund Board of Guardians (Board members) with Deeds of Indemnity. The indemnities are intended to cover liabilities in excess of the insurance policies of the Future Fund Board and its subsidiary entities and the Agency. Board members are indemnified in relation to the exercise of their powers and performance of their functions as members of the Future Fund Board of Guardians. Agency staff members are indemnified in connection with the performance of functions or the exercise of powers in their capacity as a director or officer of Future Fund Board of Guardians investee companies and/or subsidiaries. Both staff members of the FFMA and Board members are indemnified, to the maximum extent permitted by law.
Agency staff members are not indemnified to the extent they are indemnified by an investee company or a subsidiary or they are paid under a Directors and Officers policy of the investee company or subsidiary or to the extent that they are granted and receive financial assistance under Appendix E of the Legal Services Directions. Both Board members and Agency staff members are not indemnified for conduct they engage in other than in good faith; or in respect of any liability owed to the Board or the Commonwealth; or in respect of any act or omission that contravenes one of the civil penalty provisions of the Future Fund Act 2006 (the Future Fund Act). Board members and Agency staff are not indemnified for legal costs incurred by them in unsuccessfully defending or resisting criminal proceedings, or proceedings against a declaration that they have breached a civil penalty provision of the Future Fund Act. The indemnity is financially limited, in broad terms, to the value of the funds under management by the Future Fund Board of Guardians.
Googong Dam
On 4 September 2008, a 150-year lease for Googong Dam was signed between the Australian Government and the Australian Capital Territory (ACT) Government. The Australian Government is liable to pay just terms compensation if the terms of the lease are breached by introducing new legislation or changing the Canberra Water Supply (Googong Dam) Act 1974 in a way that impacts on the rights of the ACT. The lease includes a requirement for the Australian Government to undertake rectification of easements or any defects in title in relation to Googong Dam, and remediation of

Statement 8: Statement of Risks
8-18
any contamination it may have caused to the site. It also gives an indemnity in relation to acts or omissions by the Australian Government.
Indemnities for the Reserve Bank of Australia and private sector banks
In accordance with Government entities’ contracts for transactional banking services, the Australian Government has indemnified the Reserve Bank of Australia and contracted private sector banks against loss and damage arising from error or fraud by the entity, or transactions made by the bank with the authority of the entity.
Indemnities relating to other former asset sales, privatisations and IT outsourcing projects
Ongoing indemnities have been given in respect of a range of asset sales, privatisations and IT outsourcing projects that have been conducted by the Department of Finance and Deregulation (Finance), and the former Office of Asset Sales and Commercial Support and its predecessors. The probability of an action being made under one of these indemnities diminishes over time. Details of indemnities in respect of the other asset sales and privatisations have been provided in previous Budget and MYEFO papers, and previous annual reports of Finance and the Office of Asset Sales and Commercial Support.
Indemnities (including the year they were raised) are still current for: ADI Ltd (1998), Australian Airlines (1991), Australian Industry Development Corporation (1996), Australian Multimedia Enterprise (1997), Australian National Rail Commission and National Rail Corporation Ltd (1997 and 2000), Australian River Co Ltd (1999), Australian Submarine Corporation Pty Ltd (2000), ComLand Ltd (2004), Bankstown Airport Limited (2002), Camden Airport Ltd (2002), Commonwealth Accommodation and Catering Services (1988), Commonwealth Bank of Australia (1993 to 1996), Commonwealth Funds Management and Total Risk Management (1996 to 1997), Employment National Ltd (2003), Essendon Airport Ltd (2001), Federal Airports Corporation’s Airports (1995 to 1997), Housing Loans Insurance Corporation Ltd (1996), Health Insurance Commission (2000), Hoxton Park Airport Limited (2002), National Transmission Network (1999), Sydney Airports Corporation Ltd (2001), Telstra (1996, 1999 and 2006), and Wool International (1999). Apart from instances noted elsewhere, Finance does not currently expect any other action to be taken in respect of these indemnities.
Litigation — Davis Samuel case
The Australian Government is subject to a counter-claim for damages in relation to legal action before the Australian Capital Territory Supreme Court. The Australian Government is seeking to recover funds which were misappropriated from the Department of Finance and Deregulation during 1998. The counter claim is subject to sufficient uncertainty that it is not possible to quantify the amount, if any, of the liability. The Department is vigorously defending this counter claim. The hearing concluded in September 2008 and judgment is yet to be handed down.

Statement 8: Statement of Risks
8-19
Foreign Affairs and Trade
Export Finance Insurance Corporation — board member and senior management indemnities
The Australian Government has provided certain indemnities to Export Finance and Insurance Corporation (EFIC) board members and senior management to protect them against civil claims and legal expenses for unsuccessful criminal claims relating to the implementation of EFIC’s alliance/divestment of its short-term export credit insurance business.
Health and Ageing
Australian Medical Association
An agreement is held between the Australian Medical Association, the Australian Government, the Australian Private Hospitals Association Ltd, the Australian Health Insurance Association and Beyond Blue Ltd for participation in, and support of, the Private Mental Health Alliance and for the collection and analysis of a national minimum data set from private, hospital-based psychiatric services. Each party to the agreement has agreed to indemnify each other in respect of any loss, liability, cost, claim or expense, misuse of confidential information, or breach of the Privacy Act 1988. Each party’s liability to indemnify the other parties will be reduced proportionally to the extent that any unlawful or negligent act or omission of the other parties or their employees or agents contributed to the loss or damage. The indemnity survives the expiration or termination of the agreement.
Australian Red Cross Society — indemnities
Deeds of Agreement between the Australian Red Cross Society (the Red Cross) and the National Blood Authority in relation to the operation of the Australian Red Cross Blood Service and the development of principal manufacturing sites in Sydney and Melbourne include certain indemnities and a limitation of liability in favour of the Red Cross. These cover defined sets of potential business, product and employee risks and liabilities. The indemnities and limitation of liability only operate in the event of the expiry and non-renewal, or the earlier termination, of the Deed of Agreement relating to the operation of the Red Cross or the cessation of funding for the principal sites, and only within a certain scope. They are also subject to appropriate limitations and conditions including in relation to mitigation, contributory fault, and the process of handling relevant claims.
Blood and blood products liability cover
A National Managed Fund (NMF) has been established between the Australian Government, the Australian Red Cross Blood Service (the Blood Service) and the State and Territory governments which spreads the liability risks associated with the supply of blood and blood products by the Blood Service. The NMF provides for liabilities incurred by the Blood Service where other available mitigation or cover is not available. Under certain conditions, the Australian Government and the State and

Statement 8: Statement of Risks
8-20
Territory governments jointly provide indemnity for the Blood Service through a cost sharing arrangement for claims, both current and potential, regarding personal injury and loss or damage suffered by a recipient of certain blood products. If there are insufficient funds in the NMF to cover claim costs, the Jurisdictional Blood Committee will consider a report provided by the National Funds Manager to determine the level of additional funds required. The Australian Government’s share of any additional liability is limited to 63 per cent of any agreed net cost.
CSL Ltd
CSL Ltd (CSL) is indemnified against claims made by individuals who contract specified infections from specified products and against employees contracting asbestos-related injuries. CSL has unlimited cover for most events that occurred before the sale of CSL on 1 January 1994, but has more limited cover for a specified range of events that occurred during the operation of the Plasma Fractionation Agreement from 1 January 1994 to 31 December 2004. Where alternative cover was not arranged by CSL, the Australian Government may have a contingent liability.
The Australian Fractionation Agreement with CSL, which has operated since 1 January 2010, includes a requirement that the National Blood Authority make a defined payment to CSL, in certain circumstances only, in the event that the volume of plasma supplied annually to CSL is less than a specified amount.
Indemnities relating to vaccines
The Australian Government has provided an indemnity to the manufacturer of smallpox vaccine held by the Australian Government, covering possible adverse events that could result from the use of the vaccine in an emergency situation. Further, under certain conditions, certain indemnities have been provided to particular manufacturers of pandemic and pre-pandemic influenza vaccines for the supply or future supply of influenza vaccines (including H1N1 and H5N1).
Legal proceedings against the Professional Services Review impacting on the validity of past Committees
On 28 July 2011 the full Federal Court ruled that five Professional Services Review (PSR) committee matters were invalid as a result of the appointment process used to appoint the members. The finding has the potential to extend to a significant proportion of past committee cases. On 10 February 2012, the High Court granted the Commonwealth special leave to appeal the full Federal Court decision.
In addition to the five matters subject to the High Court appeal there are four further PSR matters currently on hold in the full Federal Court pending the decision of the High Court.
Medical Indemnity Exceptional Claims Scheme
In May 2003, the Australian Government announced that the Medical Indemnity Exceptional Claims Scheme was to assume liability for 100 per cent of any damages
Statement 8: Statement of Risks
8-21
payable against a doctor that exceeds a specified level of cover provided by that doctor’s medical indemnity insurer (currently $20 million). These arrangements would apply to payouts either related to a single large claim or to multiple claims that in aggregate exceed the cover provided by the doctor’s medical indemnity insurer, and would apply to claims notified under contracts-based cover since 1 January 2003.
Immigration and Citizenship
Education Services to Minors in Alternative Places of Detention — liability limit
South Australia
The Department of Immigration and Citizenship has entered into a formal arrangement with the Government of South Australia (as represented by the South Australian Department of the Premier and Cabinet) by way of an exchange of letters dated 17 December 2010. The letters represent the Government of South Australia’s agreement to provide a range of services (such as education, health, police and emergency services) to people in immigration detention in the State of South Australia in advance of signing a Memorandum of Understanding. This agreement is based on the understanding that the Commonwealth indemnifies the State, and its servants or agents engaged in the provision of the services, to the value of $5 million per claim or event, in relation to any damage or loss incurred by the State, arising out of or incidental to the provision of the services. This effectively represents an uncapped liability.
Immigration detention services — liability limits
The Department of Immigration and Citizenship (DIAC) has entered into a contract which commenced on 14 January 2009 with International Health and Medical Services Pty Ltd (IHMS), to deliver health services to people in detention in Australia on behalf of the Australian Government. Under this contract, DIAC has agreed to limit IHMS’s liability to DIAC to a maximum of $20.5 million; however, IHMS’s liability is unlimited for specific events defined under the contract.
DIAC has also entered into a contract which commenced on 29 June 2009 with Serco Pty Ltd (Serco), to deliver immigration detention services in Australia on behalf of the Australian Government at immigration detention centres. In this contract, DIAC has agreed to limit Serco’s liability to DIAC to a maximum of any insurance proceeds recovered by Serco and $75 million. Serco’s liability is unlimited for specific events defined under the contract.
DIAC entered into a separate contract which commenced on 11 December 2009 with Serco, to deliver immigration detention services in Australia on behalf of the Australian Government at immigration residential housing, immigration transit accommodation and alternative places of detention. In this contract, DIAC has agreed to limit Serco’s liability to DIAC to a maximum of any insurance proceeds recovered by Serco and $17 million. Serco’s liability is unlimited for specific events defined under the contract.

Statement 8: Statement of Risks
8-22
Industry, Innovation, Science, Research and Tertiary Education
Australian Nuclear Science and Technology Organisation — indemnity
The Australian Government has indemnified the Australian Nuclear Science and Technology Organisation and its officers from any liability that might be incurred from the conduct of activities authorised under the Australian Nuclear Science and Technology Organisation Act 1987. This indemnity is in addition to commercial insurance cover obtained from the Comcover Insurance Pool and other insurers.
Liability for damages caused by space activities
Under the United Nations Convention on International Liability for Damage Caused by Space Objects, the Australian Government is liable to pay compensation for damage caused to nationals of other countries by space objects launched from, or by, Australia. The Government requires the responsible party for a space activity approved under the Space Activities Act 1998 (the Act) to insure against liability for damage to third parties for an amount not less than the maximum probable loss, up to a maximum of $750 million indexed for inflation. Under the Act, the Government also accepts liability for damage suffered by Australian nationals, to a maximum value of $3.0 billion above the insured level.
Infrastructure and Transport
Australian Maritime Safety Authority incident costs
In the normal course of operations, the Australian Maritime Safety Authority is responsible for the provision of funds necessary to meet the clean-up costs arising from ship-sourced marine pollution and, in all circumstances, is responsible for making appropriate efforts to recover the costs of any such incidents. The Australian Government meets costs that cannot be recovered from such incidents. It is not possible to estimate the amounts of any eventual payments that may be required in relation to these incident costs.
Maritime Industry Finance Company Limited — board members’ indemnity
Indemnities for Maritime Industry Finance Company Limited (MIFCO) board members were provided to protect them against civil claims relating to their employment and conduct as directors. MIFCO was placed into voluntary liquidation on November 2006 and was deregistered on 24 April 2008. The indemnity is not time limited and continues even though the company has been liquidated. Until the indemnity agreements are varied or brought to an end, they will remain as contingent and unquantifiable liabilities.
Tripartite deeds relating to the sale of federal leased airports
Tripartite deeds relate to applicable federal leased airports. The tripartite deeds between the Australian Government, the airport lessee company (ALC) and financiers amend the airport (head) leases to provide for limited step-in-rights for financiers in circumstances where the Commonwealth terminates the head lease to enable the

Statement 8: Statement of Risks
8-23
financiers to correct the circumstances that triggered such a termination event. The tripartite deeds may require the Commonwealth to pay the ALC and financiers compensation as a result of its termination of the (head) lease. The Commonwealth’s contingent liabilities are considered to be unquantifiable and remote.
Resources, Energy and Tourism
British atomic test site at Maralinga
The Australian Government is responsible for 14 unlimited indemnities relating to the Maralinga Rehabilitation Project (1995-2000). In November 2009, the Australian Government agreed to the handback of the former nuclear test site at Maralinga to the Maralinga Tjarutja people. Under the terms of the handback, the Australian Government has indemnified the Maralinga Tjarutja people and the South Australian Government in respect of claims arising from test site contamination.
Gorgon liquefied natural gas and carbon dioxide storage project — long-term liability
The Australian and Western Australian governments have agreed to provide an indemnity to the Gorgon Joint Venture Partners (GJV) to indemnify the GJV against independent third-party claims (relating to stored carbon dioxide) under common law following closure of the carbon dioxide sequestration project, and subject to conditions equivalent to those set out in the Offshore Petroleum and Greenhouse Gas Storage Act 2006. It is proposed that the Western Australian Government will indemnify the GJV, and that the Australian Government will indemnify the Western Australian Government for 80 per cent of any amount determined to be payable under that indemnity. The formal agreement between the Australian and Western Australian governments in relation to the indemnity is expected to be signed in 2012.
Liability for costs incurred in a national liquid fuel emergency
The Australian Government has responsibility for the Liquid Fuel Emergency Act 1984 (the Act) which is administered by the Minister for Resources and Energy. In addition, the State and Territory governments have entered into an inter-governmental agreement (IGA) which coordinates the use of the powers under the Act in a national liquid fuel emergency. The IGA contains three areas where the Australian Government may incur expenses in the unlikely event of a national liquid fuel emergency. These relate to the direct costs of managing a liquid fuel emergency and include the possibility of the Australian Government reimbursing the State and Territory governments for costs arising from their responses, and potential compensation for industry arising from Australian Government directions under the Act.
Snowy Hydro Limited — directors’ indemnities
The Australian Government, together with the co-shareholder governments of New South Wales and Victoria, has indemnified the members of the Board of Snowy

Statement 8: Statement of Risks
8-24
Hydro Limited for liabilities arising from entering into agreements to implement corporatisation of the Snowy Mountains Hydro Electric Scheme, and from liabilities to Snowy Hydro Limited at corporatisation. The indemnity applies to liabilities arising within five years of corporatisation, and for which a claim is notified to the governments within 11 years of the corporatisation date of 28 June 2002.
Snowy Hydro Limited — water releases
The Australian, New South Wales and Victorian governments have indemnified Snowy Hydro Limited for liabilities arising from water releases in the Snowy River below Jindabyne Dam, where these releases are in accordance with the water licence and related regulatory arrangements agreed between the three governments. The indemnity applies to liabilities for which a claim is notified within 20 years from 28 June 2002.
Sustainability, Environment, Water, Population and Communities
Murray-Darling Basin Reform — additional net costs
Under the 3 July 2008 Intergovernmental Agreement on Murray-Darling Basin Reform (Reform IGA), the Australian Government agreed that the governments of New South Wales, Victoria, Queensland, South Australia and the Australian Capital Territory (Basin States) will not bear additional net costs as a consequence of the reforms agreed between the parties and the implementation of the Water Act 2007 (the Act). This undertaking ceases on 30 June 2015.
A methodology has been developed for agreement with the Basin States that enables the State and Australian governments to agree on the activities undertaken by a State that are relevant to the implementation of the reforms agreed under the Reform IGA and the implementation of the Act, and to monitor increased or decreased costs and/or revenues.
Murray-Darling Basin Reform — risk assignment
The Water Act 2007 (the Act) provides a risk assignment mechanism for making payments to any affected entitlement holders for reductions in water allocations, or changes in the reliability of water allocations, because of the Murray-Darling Basin Plan (which is anticipated to be finalised in late 2012). The Commonwealth is taking steps to ensure that there is no such reduction in water allocations as a result of reductions in sustainable diversion limits established in the Basin plan. The steps being taken by the Commonwealth to address this risk include the acquisition of environmental water entitlements equivalent to the Commonwealth’s share of the reduction in sustainable diversion limits.
The Government will provide funding of $310 million per annum from 2014-15 to bridge any remaining gap between the level of water returned to the Murray-Darling Basin under existing Water for the Future initiatives, and the level required to be returned under the sustainable diversion limits set in the final Basin Plan. The

Statement 8: Statement of Risks
8-25
additional funding will be used to continue buying back water entitlements each year beyond 2014, subject to the availability of water for purchase from willing sellers. This funding has been included in the forward estimates.
The total cost (if any) of the operation of the risk assignment mechanism will depend on water recoveries. The total cost is not able to be quantified until the Basin Plan has been finalised and may not be able to be quantified until significantly after this time when the new sustainable diversion limits come into effect.
Treasury
Financial Claims Scheme
The Australian Government has established a Financial Claims Scheme to provide depositors of authorised deposit-taking institutions and general insurance policyholders with timely access to their funds in the event of a financial institution failure.
The Australian Prudential Regulation Authority (APRA) is responsible for the administration of the Financial Claims Scheme. Under the Financial Claims Scheme, any payments to eligible depositors or general insurance policyholders will be made out of APRA’s Financial Claims Scheme Special Account.
The Financial Claims Scheme established under the Banking Act 1959 provides a mechanism for making payments to depositors under the Government’s guarantee of deposits in authorised deposit-taking institutions.
The Government announced that, from 12 October 2008, deposits up to $1.0 million at eligible authorised deposit-taking institutions would be eligible for coverage under the Financial Claims Scheme. The Government confirmed in December 2010 that the Financial Claims Scheme will be a permanent feature of the Australian financial system. The Government announced in September 2011 that a new cap of $250,000 would replace the $1.0 million cap from 1 February 2012.
As at 29 February 2012, deposits eligible for coverage under the Financial Claims Scheme were estimated to be approximately $623.1 billion, compared to $780.8 billion at 30 June 2011, largely reflecting the change in the eligible deposits cap.
The Financial Claims Scheme established under the Insurance Act 1973 provides a mechanism for making payments to eligible beneficiaries with a valid claim against a failed general insurer.
In the very unlikely event of a failure, any payments made under the Financial Claims Scheme would be recovered through the liquidation of the failed institution. In the even more unlikely event there was a shortfall, a levy would be applied to industry to recover the difference between the amount expended and the amount recovered in the liquidation. Initial amounts available to meet payments and administer the Financial

Statement 8: Statement of Risks
8-26
Claims Scheme, in the event of activation, are $20.1 billion an institution, under the legislation.
Guarantee of State and Territory Borrowing
The Australian Government announced on 25 March 2009 that a voluntary, temporary guarantee would be put in place over State and Territory borrowing. The Guarantee of State and Territory Borrowing commenced on 24 July 2009 and closed on 31 December 2010.
Securities covered by the guarantee will continue to be guaranteed until these securities either mature or are bought back and extinguished by the issuer.
The expected liability under the guarantee is remote and unquantifiable. Australian Government expenditure would arise under the guarantee only in the unlikely event that a State or Territory failed to meet its obligations with respect to a commitment that was subject to the guarantee and the guarantee was called upon. In such a case, the Government would likely be able to recover any such expenditure through a claim on the relevant state or territory at a future date. The impact on the Australian Government’s budget would depend upon the extent of the default and the State or Territory’s ability to meet the Government’s claim.
As at 31 March 2012, the face value of State and Territory borrowings covered by the guarantee was $33.0 billion, down from $36.8 billion at 30 September 2011.
Guarantee Scheme for Large Deposits and Wholesale Funding
The Australian Government announced the guarantee of eligible deposits and wholesale funding for authorised deposit-taking institutions from 12 October 2008 under the Guarantee Scheme for Large Deposits and Wholesale Funding.
On 7 February 2010, the Government announced that the Guarantee Scheme would close to new liabilities on 31 March 2010. Since 31 March 2010, Australian authorised deposit-taking institutions have been prohibited from issuing any new guaranteed wholesale funding or accepting new guaranteed deposits above $1.0 million. Existing guaranteed wholesale funding is guaranteed to maturity. Depositors who covered their balances above $1.0 million under the Guarantee Scheme can have those funds covered to maturity for term deposits up to five years, or until October 2015 for at call deposits.
The expected liability for deposits under the Guarantee Scheme is remote and unquantifiable. Government expenditure would arise under the guarantee only in the unlikely event that an institution failed to meet its obligations with respect to a commitment that was subject to the guarantee and the guarantee was called upon. In such a case, the Government would likely be able to recover any such expenditure through a claim on the relevant institution. The impact on the Government’s budget

Statement 8: Statement of Risks
8-27
would depend on the extent of the institution’s default and its ability to meet the Government’s claim.
As at 30 March 2012, total liabilities covered by the Guarantee Scheme were estimated at $94.8 billion, down from $117.0 billion at 21 October 2011. This is made up of $3.0 billion (down from $3.2 billion) of large deposits and $91.8 billion (down from $113.8 billion) of long-term wholesale funding. All guaranteed short-term wholesale funding matured in March 2011.
As at 29 February 2012, institutions participating in the Guarantee Scheme had paid fees of $3.4 billion since its inception.
Terrorism insurance — commercial cover
The Terrorism Insurance Act 2003 established a scheme for replacement terrorism insurance covering damage to commercial property, including associated business interruption and public liability. The Australian Reinsurance Pool Corporation (ARPC) uses reinsurance premiums paid by insurers to meet its administrative expenses and to build a fund and purchase reinsurance to help meet future claims. The Australian Government guarantees to pay any liabilities of the ARPC, but the Treasurer must declare a reduced payout rate to insured entities if the Government’s liability would otherwise exceed $10.0 billion.
CONTINGENT ASSETS — UNQUANTIFIABLE
Health and Ageing
Legal action seeking compensation from Sanofi-Aventis
The Department of Health and Ageing has initiated legal action to seek compensation from Sanofi-Aventis, the original patent owner of clopidogrel (Plavix®), for additional costs to the Pharmaceutical Benefits Scheme (PBS) resulting from a delay in listing a generic version of clopidogrel. Listing a generic form of clopidogrel on the Australian market in 2007 would have triggered an automatic reduction to the price paid by the Government for clopidogrel through the PBS. The first generic version of this medicine was listed in 2010.
Industry, Innovation, Science, Research and Tertiary Education
Wireless Local Area Network
The Commonwealth Scientific and Industrial Research Organisation (CSIRO) is currently involved in legal proceedings in the United States related to a wireless local area network patent which CSIRO owns and wishes to license broadly. The proceedings are additional to proceedings settled by agreement in 2009 and 2012 and are at various phases. If successful, CSIRO expects to receive additional revenue which would exceed the associated legal costs. At this stage, the revenue and costs are unquantifiable.


9-1
STATEMENT 9: BUDGET FINANCIAL STATEMENTS
The budget financial statements consist of an operating statement, including other economic flows, a balance sheet, and a cash flow statement for the Australian Government general government sector (GGS), the public non-financial corporations sector (PNFC) and the total non-financial public sector (NFPS). This statement also contains notes showing disaggregated information for the GGS.
The Charter of Budget Honesty Act 1998 (the Charter) requires that the budget be based on external reporting standards and for departures from these standards to be disclosed. The Government has produced budget financial statements that comply with both Australian Bureau of Statistics’ (ABS) accrual Government Finance Statistics (GFS) and Australian Accounting Standards (AAS), meeting the requirement of the Charter, with departures disclosed. The statements reflect the Government’s accounting policy that ABS GFS remains the basis of budget accounting policy, except where the Government applies AAS because it provides a better conceptual basis for presenting information of relevance to users of public sector financial reports.
The Australian, State and Territory governments have an agreed framework — the Accrual Uniform Presentation Framework (UPF) — for the presentation of government financial information on a basis broadly consistent with the Australian Accounting Standards Board standard AASB 1049. The budget financial statements are consistent with the requirements of the UPF.
In accordance with the UPF requirements, this statement also contains an update of the Australian Government’s Loan Council Allocation.

9-2
CONTENTS
Budget financial statements ....................................................................... 9-3 Notes to the financial statements ............................................................................... 9-13
Appendix A: Financial reporting standards and budget concepts ....... 9-28
Appendix B: Australian Loan Council Allocation ................................... 9-42

9-3
STATEMENT 9: BUDGET FINANCIAL STATEMENTS Table 1: Australian Government general government sector operating statement
Estimates Projections2011-12 2012-13 2013-14 2014-15 2015-16
Note $m $m $m $m $mRevenueTaxation revenue 3 316,454 354,626 380,727 403,278 427,160Sales of goods and services 4 8,256 8,264 8,641 8,455 8,788Interest income 5 4,703 5,113 5,209 5,187 5,493Dividend income 5 1,669 2,485 1,966 2,137 2,197Other 6 5,336 5,583 5,654 5,773 5,922
Total revenue 336,418 376,071 402,197 424,830 449,559
ExpensesGross operating expenses
Wages and salaries(a) 7 18,814 19,110 18,946 19,213 20,026Superannuation 7 4,316 3,968 4,047 4,113 4,169Depreciation and amortisation 8 6,003 6,188 6,322 6,393 6,468Supply of goods and services 9 69,984 71,120 74,160 78,322 83,748Other operating expenses(a) 7 5,750 5,057 5,232 5,403 5,585
Total gross operating expenses 104,867 105,443 108,707 113,444 119,996Superannuation interest expense 7 7,358 8,015 8,295 8,587 8,908Interest expenses 10 13,009 13,587 13,962 13,731 13,602Current transfers
Current grants 11 110,686 112,720 120,484 129,129 134,172Subsidy expenses 10,121 12,943 14,842 14,941 15,691Personal benefits 12 112,450 114,975 121,943 128,464 138,447
Total current transfers 233,258 240,637 257,269 272,534 288,311Capital transfers 11
Mutually agreed write-downs 2,139 2,266 2,407 2,589 2,766Other capital grants 13,040 6,324 7,863 5,564 5,461
Total capital transfers 15,179 8,589 10,271 8,153 8,227
Total expenses 373,671 376,273 398,503 416,449 439,044
Net operating balance -37,253 -202 3,694 8,381 10,516
Other economic flows
Gain/loss on equity and on sale of assets(b) -308 6,554 3,656 3,767 5,375
Net write-downs of assets (including bad and doubtful debts) -4,822 -5,358 -5,735 -6,114 -6,605
Assets recognised for the first time 507 531 555 579 604
Liabilities recognised for the first time 0 0 0 0 0
Actuarial revaluations -6,087 0 0 0 0
Net foreign exchange gains 70 -17 11 67 58
Net swap interest received 67 0 0 0 0
Market valuation of debt -15,396 2,635 2,329 1,930 1,604
Other economic revaluations(c) 399 -153 470 578 287
Total other economic flows -25,571 4,193 1,285 808 1,323
Comprehensive result - Total change in net worth 13 -62,823 3,991 4,980 9,189 11,839
Net operating balance -37,253 -202 3,694 8,381 10,516
Net acquisition of non-financial assetsPurchases of non-financial assets 10,304 8,040 7,051 7,363 9,579
less Sales of non-financial assets 589 4,872 459 244 1,588
less Depreciation 6,003 6,188 6,322 6,393 6,468plus Change in inventories 604 384 320 302 399
plus Other movements in non-financial assets 433 -65 458 334 -864
Total net acquisition of non-financial assets 4,749 -2,701 1,048 1,361 1,059
Fiscal balance (Net lending/borrowing)(d) -42,002 2,500 2,646 7,020 9,457 (a) Consistent with ABS GFS classification, other employee related expenses are reported under other operating
expenses. Total employee expenses equal wages and salaries plus other operating expenses. (b) Reflects changes in the market valuation of investments and any revaluations at the point of disposal or sale. (c) Largely reflects other revaluation of assets and liabilities. (d) The term fiscal balance is not used by the ABS.
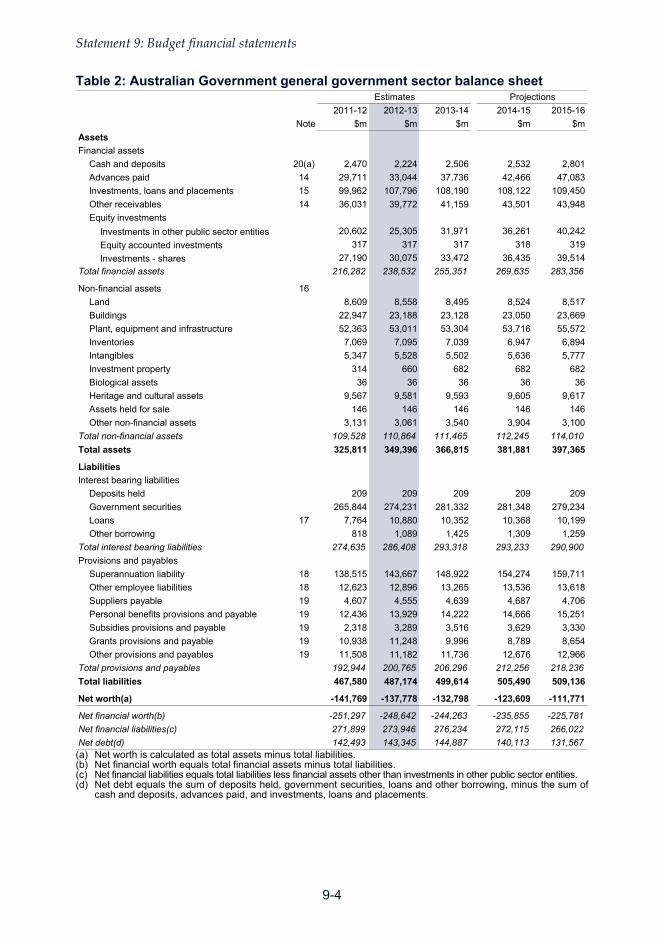
Statement 9: Budget financial statements
9-4
Table 2: Australian Government general government sector balance sheet Estimates Projections
2011-12 2012-13 2013-14 2014-15 2015-16
Note $m $m $m $m $m
Assets
Financial assets
Cash and deposits 20(a) 2,470 2,224 2,506 2,532 2,801
Advances paid 14 29,711 33,044 37,736 42,466 47,083
Investments, loans and placements 15 99,962 107,796 108,190 108,122 109,450
Other receivables 14 36,031 39,772 41,159 43,501 43,948
Equity investments
Investments in other public sector entities 20,602 25,305 31,971 36,261 40,242
Equity accounted investments 317 317 317 318 319
Investments - shares 27,190 30,075 33,472 36,435 39,514
Total financial assets 216,282 238,532 255,351 269,635 283,356
Non-financial assets 16
Land 8,609 8,558 8,495 8,524 8,517
Buildings 22,947 23,188 23,128 23,050 23,669
Plant, equipment and infrastructure 52,363 53,011 53,304 53,716 55,572
Inventories 7,069 7,095 7,039 6,947 6,894
Intangibles 5,347 5,528 5,502 5,636 5,777
Investment property 314 660 682 682 682
Biological assets 36 36 36 36 36
Heritage and cultural assets 9,567 9,581 9,593 9,605 9,617
Assets held for sale 146 146 146 146 146
Other non-financial assets 3,131 3,061 3,540 3,904 3,100
Total non-financial assets 109,528 110,864 111,465 112,245 114,010
Total assets 325,811 349,396 366,815 381,881 397,365
Liabilities
Interest bearing liabilities
Deposits held 209 209 209 209 209
Government securities 265,844 274,231 281,332 281,348 279,234
Loans 17 7,764 10,880 10,352 10,368 10,199
Other borrowing 818 1,089 1,425 1,309 1,259
Total interest bearing liabilities 274,635 286,408 293,318 293,233 290,900
Provisions and payables
Superannuation liability 18 138,515 143,667 148,922 154,274 159,711
Other employee liabilities 18 12,623 12,896 13,265 13,536 13,618
Suppliers payable 19 4,607 4,555 4,639 4,687 4,706
Personal benefits provisions and payable 19 12,436 13,929 14,222 14,666 15,251
Subsidies provisions and payable 19 2,318 3,289 3,516 3,629 3,330
Grants provisions and payable 19 10,938 11,248 9,996 8,789 8,654
Other provisions and payables 19 11,508 11,182 11,736 12,676 12,966
Total provisions and payables 192,944 200,765 206,296 212,256 218,236
Total liabilities 467,580 487,174 499,614 505,490 509,136
Net worth(a) -141,769 -137,778 -132,798 -123,609 -111,771
Net financial worth(b) -251,297 -248,642 -244,263 -235,855 -225,781
Net financial liabilities(c) 271,899 273,946 276,234 272,115 266,022
Net debt(d) 142,493 143,345 144,887 140,113 131,567 (a) Net worth is calculated as total assets minus total liabilities. (b) Net financial worth equals total financial assets minus total liabilities. (c) Net financial liabilities equals total liabilities less financial assets other than investments in other public sector entities. (d) Net debt equals the sum of deposits held, government securities, loans and other borrowing, minus the sum of
cash and deposits, advances paid, and investments, loans and placements.

Statement 9: Budget financial statements
9-5
Table 3: Australian Government general government sector cash flow statement(a)
Estimates Projections2011-12 2012-13 2013-14 2014-15 2015-16
$m $m $m $m $mCash receipts from operating activitiesTaxes received 309,653 343,107 371,409 392,852 415,459Receipts from sales of goods and services 8,040 8,289 8,696 8,426 8,741Interest receipts 4,343 4,660 4,679 4,525 4,822Dividends and income tax equivalents 2,222 2,518 1,967 2,137 2,197Other receipts 5,129 5,329 5,335 5,433 5,566Total operating receipts 329,386 363,902 392,085 413,374 436,786
Cash payments for operating activitiesPayments for employees -25,505 -25,849 -25,899 -26,381 -27,541Payments for goods and services -70,020 -71,162 -74,089 -78,347 -83,892Grants and subsidies paid -136,299 -129,330 -141,792 -147,811 -150,809Interest paid -10,846 -11,661 -11,450 -11,519 -12,975Personal benefit payments -112,588 -113,517 -121,656 -128,018 -137,922Other payments -5,078 -4,760 -4,943 -5,142 -5,416Total operating payments -360,336 -356,280 -379,831 -397,218 -418,554
Net cash flows from operating activities -30,950 7,622 12,254 16,156 18,231
Cash flows from investments in non-financial assets
Sales of non-financial assets 589 4,872 459 244 1,588Purchases of non-financial assets -10,882 -7,523 -6,999 -7,672 -8,695Net cash flows from investments in
non-financial assets -10,293 -2,651 -6,540 -7,428 -7,108
Net cash flows from investments infinancial assets for policy purposes -7,044 -13,281 -12,041 -8,826 -9,157
Cash flows from investments infinancial assets for liquidity purposes
Increase in investments 1,035 -1,979 -1,570 -1,045 -2,027Net cash flows from investments in
financial assets for liquidity purposes 1,035 -1,979 -1,570 -1,045 -2,027
Cash receipts from financing activities Borrowing 48,141 11,549 9,956 2,911 1,865Other financing 29 0 0 1 0Total cash receipts from financing activities 48,170 11,549 9,956 2,912 1,865
Cash payments for financing activitiesBorrowing 0 0 0 0 0Other financing -925 -1,507 -1,778 -1,743 -1,536Total cash payments for financing activities -925 -1,507 -1,778 -1,743 -1,536
Net cash flows from financing activities 47,245 10,043 8,179 1,169 329
Net increase/(decrease) in cash held -7 -246 282 27 268

Statement 9: Budget financial statements
9-6
Table 3: Australian Government general government sector cash flow statement (continued)(a)
Estimates Projections2011-12 2012-13 2013-14 2014-15 2015-16
$m $m $m $m $mNet cash flows from operating activities
and investments in non-financial assets (Surplus(+)/deficit(-)) -41,243 4,971 5,714 8,728 11,124
Finance leases and similar arrangements(b) -119 -406 -470 -1 -1GFS cash surplus(+)/deficit(-) -41,362 4,565 5,244 8,727 11,122less Future Fund earnings 3,040 3,030 3,201 3,408 3,653Equals underlying cash balance(c) -44,402 1,536 2,044 5,318 7,469plus Net cash flows from investments in
financial assets for policy purposes -7,044 -13,281 -12,041 -8,826 -9,157plus Future Fund earnings 3,040 3,030 3,201 3,408 3,653Equals headline cash balance -48,406 -8,715 -6,797 -99 1,965 (a) A positive number denotes a cash inflow; a negative sign denotes a cash outflow. (b) The acquisition of assets under finance leases decreases the underlying cash balance. The disposal of
assets previously held under finance leases increases the underlying cash balance. (c) The term underlying cash balance is not used by the ABS.

Statement 9: Budget financial statements
9-7
Table 4: Australian Government public non-financial corporations sector operating statement
Estimates2011-12 2012-13
$m $mRevenueCurrent grants and subsidies 17 20Sales of goods and services 7,888 7,917Interest income 91 46Other 1 0Total revenue 7,997 7,984
ExpensesGross operating expenses
Wages and salaries(a) 3,013 3,055Superannuation 228 252Depreciation and amortisation 553 842Supply of goods and services 3,793 4,102Other operating expenses(a) 414 412
Total gross operating expenses 8,000 8,664Interest expenses 95 136Other property expenses 233 245Current transfers
Tax expenses 45 134Total current transfers 45 134Total expenses 8,374 9,179
Net operating balance -377 -1,195
Other economic flows -1,032 20
Comprehensive result - Total change in net worth -1,409 -1,174excluding contribution from owners
Net acquisition of non-financial assetsPurchases of non-financial assets 3,411 4,981less Sales of non-financial assets 42 14
less Depreciation 553 842
plus Change in inventories 29 74plus Other movements in non-financial assets 184 286Total net acquisition of non-financial assets 3,030 4,484
Fiscal balance (Net lending/borrowing)(b) -3,407 -5,679 (a) Consistent with ABS GFS classification, other employee related expenses are reported under other
operating expenses. Total employee expenses equal wages and salaries plus other operating expenses. (b) The term fiscal balance is not used by the ABS.
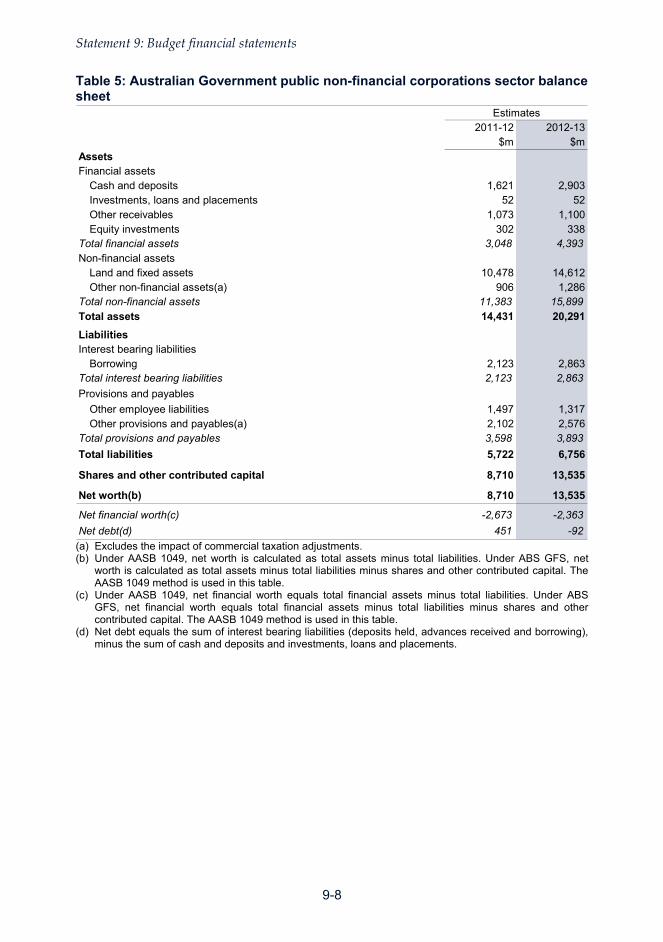
Statement 9: Budget financial statements
9-8
Table 5: Australian Government public non-financial corporations sector balance sheet
Estimates2011-12 2012-13
$m $mAssetsFinancial assets
Cash and deposits 1,621 2,903Investments, loans and placements 52 52Other receivables 1,073 1,100Equity investments 302 338
Total financial assets 3,048 4,393Non-financial assets
Land and fixed assets 10,478 14,612Other non-financial assets(a) 906 1,286
Total non-financial assets 11,383 15,899Total assets 14,431 20,291
LiabilitiesInterest bearing liabilities
Borrowing 2,123 2,863Total interest bearing liabilities 2,123 2,863
Provisions and payables
Other employee liabilities 1,497 1,317Other provisions and payables(a) 2,102 2,576
Total provisions and payables 3,598 3,893
Total liabilities 5,722 6,756
Shares and other contributed capital 8,710 13,535
Net worth(b) 8,710 13,535
Net financial worth(c) -2,673 -2,363
Net debt(d) 451 -92 (a) Excludes the impact of commercial taxation adjustments. (b) Under AASB 1049, net worth is calculated as total assets minus total liabilities. Under ABS GFS, net
worth is calculated as total assets minus total liabilities minus shares and other contributed capital. The AASB 1049 method is used in this table.
(c) Under AASB 1049, net financial worth equals total financial assets minus total liabilities. Under ABS GFS, net financial worth equals total financial assets minus total liabilities minus shares and other contributed capital. The AASB 1049 method is used in this table.
(d) Net debt equals the sum of interest bearing liabilities (deposits held, advances received and borrowing), minus the sum of cash and deposits and investments, loans and placements.

Statement 9: Budget financial statements
9-9
Table 6: Australian Government public non-financial corporations sector cash flow statement(a)
Estimates2011-12 2012-13
$m $mCash receipts from operating activitiesReceipts from sales of goods and services 8,989 9,069GST input credit receipts 80 86Other receipts 116 71Total operating receipts 9,185 9,226
Cash payments for operating activitiesPayments to employees -3,558 -3,594Payment for goods and services -4,448 -4,843Interest paid -57 -65GST payments to taxation authority -490 -511Other payments -47 -136Total operating payments -8,601 -9,148
Net cash flows from operating activities 584 78
Cash flows from investments in non-financial assetsSales of non-financial assets 85 14Purchases of non-financial assets -3,598 -5,229Net cash flows from investments in non-financial assets -3,513 -5,215
Cash flows from investments in financial assets for liquidity purposes
Increase in investments -193 63Net cash flows from investments in financial assets
for liquidity purposes -193 63
Net cash flows from financing activitiesBorrowing (net) 924 632Other financing (net) 2,516 5,952Distributions paid (net) -247 -227Net cash flows from financing activities 3,193 6,356
Net increase/(decrease) in cash held 71 1,282
Cash at the beginning of the year 1,551 1,621Cash at the end of the year 1,621 2,903
Net cash from operating activities and investments in non-financial assets -2,929 -5,137
Distributions paid -247 -227Equals surplus(+)/deficit(-) -3,176 -5,364Finance leases and similar arrangements(b) 0 -6GFS cash surplus(+)/deficit(-) -3,176 -5,370 (a) A positive number denotes a cash inflow; a negative sign denotes a cash outflow. (b) The acquisition of assets under finance leases decreases the surplus or increases the deficit. The
disposal of assets previously held under finance leases increases the surplus or decreases the deficit.

Statement 9: Budget financial statements
9-10
Table 7: Australian Government total non-financial public sector operating statement
Estimates2011-12 2012-13
$m $mRevenueTaxation revenue 316,409 354,492Sales of goods and services 14,951 15,089Interest income 4,764 5,131Dividend income 1,436 2,240Other 5,337 5,583Total revenue 342,897 382,535
ExpensesGross operating expenses
Wages and salaries(a) 21,827 22,165Superannuation 4,544 4,221Depreciation and amortisation 6,556 7,031Supply of goods and services 72,583 74,128Other operating expenses(a) 6,164 5,469
Total gross operating expenses 111,674 113,014Superannuation interest expense 7,358 8,015Interest expenses 13,075 13,695Current transfers
Current grants 110,686 112,720Subsidy expenses 10,104 12,923Personal benefits 112,450 114,975
Total current transfers 233,241 240,618Capital transfers 15,179 8,589Total expenses 380,527 383,931
Net operating balance -37,630 -1,396
Other economic flows -25,789 5,510
Comprehensive result - Total change in net worth -63,418 4,113
Net acquisition of non-financial assets Purchases of non-financial assets 13,715 13,020less Sales of non-financial assets 631 4,886
less Depreciation 6,556 7,031
plus Change in inventories 633 458plus Other movements in non-financial assets 617 221
Total net acquisition of non-financial assets 7,779 1,783
Fiscal balance (Net lending/borrowing)(b) -45,408 -3,179 (a) Consistent with ABS GFS classification, other employee related expenses are reported under other
operating expenses. Total employee expenses equal wages and salaries plus other operating expenses. (b) The term fiscal balance is not used by the ABS.

Statement 9: Budget financial statements
9-11
Table 8: Australian Government total non-financial public sector balance sheet Estimates
2011-12 2012-13$m $m
AssetsFinancial assets
Cash and deposits 4,091 5,127Advances paid 29,711 33,044Investments, loans and placements 99,710 107,544Other receivables 36,963 40,733Equity investments 38,503 41,422
Total financial assets 208,978 227,870Non-financial assets
Land and fixed assets 111,033 116,046Other non-financial assets 9,879 10,717
Total non-financial assets 120,912 126,762Total assets 329,889 354,633
LiabilitiesInterest bearing liabilities
Deposits held 209 209Government securities 265,844 274,231Loans 7,460 10,576Other borrowing 2,942 3,952
Total interest bearing liabilities 276,455 288,968Provisions and payables
Superannuation liability 138,515 143,667Other employee liabilities 14,119 14,213Other provisions and payables 43,768 46,640
Total provisions and payables 196,402 204,519Total liabilities 472,857 493,487
Shares and other contributed capital 8,710 13,535
Net worth(a) -142,968 -138,854
Net financial worth(b) -263,879 -265,617Net debt(c) 142,943 143,253 (a) Under AASB 1049, net worth is calculated as total assets minus total liabilities. Under ABS GFS, net
worth is calculated as total assets minus total liabilities minus shares and other contributed capital. The AASB 1049 method is used in this table.
(b) Under AASB 1049, net financial worth equals total financial assets minus total liabilities. Under ABS GFS, net financial worth equals total financial assets minus total liabilities, minus shares and other contributed capital. The AASB 1049 method is used in this table.
(c) Net debt equals the sum of deposits held, government securities, loans and other borrowing, minus the sum of cash and deposits, advances paid, and investments, loans and placements.

Statement 9: Budget financial statements
9-12
Table 9: Australian Government total non-financial public sector cash flow statement(a)
Estimates2011-12 2012-13
$m $mCash receipts from operating activitiesTaxes received 309,608 342,971Receipts from sales of goods and services 14,911 15,331Interest receipts 4,405 4,679Dividends and income tax equivalents 1,999 2,313Other receipts 5,129 5,330Total operating receipts 336,051 370,625
Cash payments for operating activitiesPayments to employees -29,063 -29,443Payments for goods and services -72,760 -74,404Grants and subsidies paid -136,299 -129,330Interest paid -10,873 -11,697Personal benefit payments -112,588 -113,517Other payments -5,080 -4,761Total operating payments -366,664 -363,152Net cash flows from operating activities -30,613 7,473
Cash flows from investments in non-financial assetsSales of non-financial assets 675 4,886Purchases of non-financial assets -14,481 -12,752Net cash flows from investments in non-financial assets -13,806 -7,866
Net cash flows from investments in financial assetsfor policy purposes -7,044 -13,281
Cash flows from investments in financial assets for liquidity purposes
Increase in investments 3,301 4,084Net cash flows from investments in financial assets
for liquidity purposes 3,301 4,084
Net cash flows from financing activitiesBorrowing (net) 49,065 12,181Other financing (net) -840 -1,555Net cash flows from financing activities 48,226 10,626
Net increase/(decrease) in cash held 63 1,036
Cash at the beginning of the year 4,028 4,091Cash at the end of the year 4,091 5,127
Net cash from operating activities and investments in non-financial assets -44,419 -394
Distributions paid 0 0Equals surplus(+)/deficit(-) -44,419 -394Finance leases and similar arrangements(b) -119 -412GFS cash surplus(+)/deficit(-) -44,538 -805 (a) A positive number denotes a cash inflow; a negative sign denotes a cash outflow. (b) The acquisition of assets under finance leases decreases the surplus or increases the deficit. The
disposal of assets previously held under finance leases increases the surplus or decreases the deficit.

Statement 9: Budget financial statements
9-13
NOTES TO THE FINANCIAL STATEMENTS
Note 1: External reporting standards and accounting policies
The Charter of Budget Honesty Act 1998 (the Charter) requires that the budget be based on external reporting standards and that departures from applicable external reporting standards be identified.
The major external standards used for budget reporting purposes are:
• the Australian Bureau of Statistics’ (ABS) accrual Government Finance Statistics (GFS) publication, Australian System of Government Finance Statistics: Concepts, Sources and Methods, (cat no. 5514.0), which in turn is based on the International Monetary Fund (IMF) accrual GFS framework; and
• Australian Accounting Standards (AAS), being AASB 1049 Whole of Government and General Government Sector Financial Reporting (AASB 1049) and other applicable Australian Equivalents to International Financial Reporting Standards (AEIFRS).
As required by the Charter, the financial statements have been prepared on an accrual basis that complies with both ABS GFS and AAS, except for departures disclosed at Note 2.
A more detailed description of the AAS and ABS GFS frameworks, in addition to definitions of key terms used in these frameworks, can be found in Appendix A. Table A2 in Appendix A explains the key differences between the two frameworks. Detailed accounting policies, as required by AAS, are disclosed in the annual consolidated financial statements.
Budget reporting focuses on the general government sector (GGS). The GGS provides public services that are mainly non-market in nature and for the collective consumption of the community, or involve the transfer or redistribution of income. These services are largely financed through taxes and other compulsory levies, user charging and external funding. This sector comprises all government departments, offices and some other bodies. In preparing financial statements for the GGS, all material transactions and balances between entities within the GGS have been eliminated. A list of entities within the GGS, as well as entities within and a description of the public non-financial corporations (PNFC) sector and public financial corporations (PFC) sector, are disclosed in Table A1 in Appendix A.
The Government’s key fiscal aggregates are based on ABS GFS concepts and definitions, including the ABS GFS cash surplus/deficit and the derivation of the underlying cash balance and net financial worth. AASB 1049 requires the disclosure of other ABS GFS fiscal aggregates, including net operating balance, net lending/borrowing (fiscal balance) and net worth. In addition to these ABS GFS

Statement 9: Budget financial statements
9-14
aggregates the Accrual Uniform Presentation Framework (UPF) requires disclosure of net debt, net financial worth and net financial liabilities.
Explanations of variations in fiscal balance, revenue, expenses, net capital investment, cash flows, net debt, net financial worth and net worth since the Mid-Year Economic and Fiscal Outlook 2011-12 (MYEFO) are disclosed in Statement 3.
Details of the Australian Government’s GGS contingent liabilities are disclosed in Statement 8.
Comprehensive guidance has not been issued under either the AAS or ABS GFS frameworks for the measurement of accrual revenue and expenses under the carbon price. Current estimates measure revenue and expenses at the expected market price for carbon in the year that emissions occur. Finance and Treasury will continue to review this treatment in consultation with the ABS and the Australian National Audit Office (ANAO).
Note 2: Departures from external reporting standards
The Charter requires that departures from applicable external reporting standards be identified. The budget financial statements depart from the external reporting standards as follows.
General government sector
Departures from ABS GFS
ABS GFS requires that provisions for bad and doubtful debts be excluded from the balance sheet. This treatment has not been adopted in the budget financial statements or in any reconciliation notes because excluding such provisions would overstate the value of Australian Government assets in the balance sheet. The budget financial statements currently adopt AAS treatment for provisions for bad and doubtful debts.
ABS GFS treats coins on issue as a liability and no revenue is recognised. The ABS GFS treatment of circulating coins as a liability has not been adopted in the budget financial statements or in any reconciliation notes. Instead, the budget financial statements adopt AAS treatment for circulating coins (seigniorage). Under this treatment seigniorage revenue is recognised upon the issue of coins and no liability is recorded.
Under ABS GFS, prepayments are classified as financial assets. In accordance with AAS, prepayments have been classified as non-financial assets in the budget financial statements. This is a classification difference that impacts on net financial worth.
ABS GFS records defence weapons platforms (DWP) as a non-financial asset on a market value basis (fair value), rather than expensing at time of acquisition. The value used by ABS is consistent with the National Accounts statistical methodology, and

Statement 9: Budget financial statements
9-15
represents an early adoption of changes to the System of National Accounts 2008. ABS GFS treatment of DWP is consistent with AAS, as non-financial assets can be valued at fair value as long as they can be reliably measured, otherwise cost is permissible. DWP will be valued at cost in the budget financial statements, as they have in previous budgets, while the Australian Government ascertains if a relevant and reliable fair value can be sourced.
Under ABS GFS, concessional loans are recognised at their nominal value, that is, they are not discounted to fair (market) value as there is not considered to be a secondary market. This treatment has not been adopted for the financial statements. Consistent with AAS, loans issued at below market interest rates or with long repayment periods are recorded at fair value (by discounting them by market interest rates). The difference between the nominal value and the fair value of the loan is recorded as an expense which is written back over the life of the loan.
ABS GFS requires investments in unlisted public sector entities to be valued based on their net assets. Under AAS, investments in public sector entities can be valued at fair value as long as a fair value can be reliably measured, otherwise net assets is permissible. The AAS treatment has been adopted in the financial statements.
Movements in the provision for restoration, decommissioning and make-good of assets have been included in the calculation of the fiscal balance capital adjustment because in many cases they involve legal obligations to expend resources. ABS GFS does not recognise adjustments for such provisions because they are considered a constructive obligation that may not materialise for many years.
Departures from AAS (including AASB 1049)
AAS requires the advances paid to the International Development Association and Asian Development Fund to be recognised at fair value. Under ABS GFS, these advances are recorded at nominal value. ABS GFS treatment is adopted in the financial statements.
AASB 1049 requires the disclosure of the operating result and its derivation on the face of the operating statement. However, as this aggregate is not used by the Australian Government (and is not required by the UPF), it has been disclosed in Note 13 rather than on the face of the operating statement.
AASB 1049 requires disaggregated information, by ABS GFS function, for expenses and total assets to be disclosed where they are reliably attributable. ABS GFS does not require total assets attributed to functions. In accordance with ABS GFS, disaggregated information for expenses and net acquisition of non-financial assets by function is disclosed in Statement 6. In accordance with the UPF, purchases of non-financial assets by function are also disclosed in Statement 6.
AASB 1049 requires AAS measurement of items to be disclosed on the face of the financial statements with reconciliation to ABS GFS measurement of items, where

Statement 9: Budget financial statements
9-16
different, in notes to the financial statements. Reconciliation notes have not been included as they would effectively create two measures of the same aggregate.
AASB 1049 requires major variances between original budget estimates and outcomes to be explained in the financial statements. Explanations of major variances for the 2011-12 year from the 2011-12 Budget to the 2011-12 MYEFO are discussed in Part 3 of the MYEFO. All policy decisions taken between the 2011-12 Budget and the 2011-12 MYEFO are disclosed in Appendix A of the MYEFO. Explanations of variations since the 2011-12 MYEFO are disclosed in Statement 3 of this document, with all decisions taken since the MYEFO disclosed in Budget Paper No. 2.
In addition to above adjustments, there are specific adjustments made to the corporations sectors as outlined below.
Public non-financial corporations (PNFC) sector and total non-financial public sector (NFPS)
Departures from ABS GFS
AASB 1049 defines net worth for the PNFC sector and NFPS as total assets less total liabilities, however, ABS GFS defines net worth as total assets less total liabilities less shares and contributed capital (which is equal to zero for the PNFC sector). Similarly, AASB 1049 defines net financial worth for these sectors as financial assets less total liabilities, whereas under ABS GFS it is equal to financial assets less total liabilities less shares and contributed capital. The AASB 1049 treatment has been adopted in the PNFC sector and NFPS financial statements.
Departures from AAS (including AASB 1049)
The financial statements for the PNFC sector and NFPS comply with the UPF but do not include all the line item disclosures required by AASB 1049. Disaggregated outcome notes for the PNFC sector will be disclosed in the consolidated financial statements.
AAS requires dividends paid to be classified as a distribution of equity. Under ABS GFS, dividends paid are classified as an expense. ABS GFS treatment has been adopted for use in the financial statements.
Australian government public corporations use commercial tax effect accounting to determine their net tax liability while the ATO determines their tax liability on a due and payable basis. To ensure symmetry in treatment between Australian government sectors, the ABS removes tax effect adjustments. The GFS treatment has been adopted in the financial statements.

Statement 9: Budget financial statements
9-17
Note 3: Taxation revenue by type Estimates Projections
2011-12 2012-13 2013-14 2014-15 2015-16$m $m $m $m $m
Income taxationIndividuals and other withholding taxes
Gross income tax withholding 143,220 151,620 164,980 175,860 186,650Gross other individuals 33,610 37,670 40,250 44,150 47,740less Refunds 25,600 26,240 26,430 28,580 30,500
Total individuals and other withholding taxation 151,230 163,050 178,800 191,430 203,890Fringe benefits tax 3,540 3,900 4,390 4,760 4,960Company tax 67,950 75,032 77,901 81,902 85,932Superannuation funds 7,390 8,250 9,220 11,035 12,995Resource rent taxes(a) 1,840 7,410 8,350 7,400 8,240Total income taxation revenue 231,950 257,642 278,661 296,527 316,017
Indirect taxationSales taxes
Goods and services tax 47,790 50,486 53,234 56,056 58,730Wine equalisation tax 730 780 830 880 930Luxury car tax 440 450 460 480 510
Total sales taxes 48,960 51,716 54,524 57,416 60,170Excise duty
Petrol 6,080 5,900 5,380 5,880 6,190Diesel 8,200 8,700 9,200 9,300 9,500Beer 1,960 2,035 2,183 2,265 2,383Tobacco 5,790 5,850 5,190 5,220 5,360Other excisable products 3,830 4,400 4,710 4,990 5,180
Of which: Other excisable beverages(b) 930 940 1,030 1,070 1,130Total excise duty revenue 25,860 26,885 26,663 27,655 28,613Customs duty
Textiles, clothing and footwear 650 730 785 635 675Passenger motor vehicles 850 940 1,020 1,090 1,160Excise-like goods 4,210 4,370 5,310 5,420 5,610Other imports 1,410 1,510 1,635 1,730 1,850less Refunds and drawbacks 180 180 180 180 180
Total customs duty revenue 6,940 7,370 8,570 8,695 9,115
Carbon pricing mechanism(c) - 7,690 8,685 9,275 9,400Other indirect taxation
Agricultural levies 437 440 436 443 449Other taxes 2,307 2,883 3,188 3,267 3,396
Total other indirect taxation revenue 2,744 3,323 3,625 3,711 3,845
Mirror taxes 461 487 518 549 574less Transfers to States in relation to mirror tax revenue 461 487 518 549 574
Mirror tax revenue 0 0 0 0 0
Total indirect taxation revenue 84,504 96,984 102,067 106,752 111,143
Total taxation revenue 316,454 354,626 380,727 403,278 427,160Memorandum:
Capital gains tax 6,700 10,200 12,900 14,700 16,200Medicare levy revenue 9,090 9,640 10,250 10,890 11,410
(a) Resource rent taxes include the Petroleum Resource Rent Tax (PRRT) and gross revenue from the Minerals Resource Rent Tax (MRRT). The net revenue from the MRRT is $3.0 billion in 2012-13, $3.5 billion in 2013-14, $3.2 billion in 2014-15 and $3.7 billion in 2015-16, which represents the net impact on revenue across several different revenue heads. This includes the offsetting reductions in company tax (through deductibility) and interactions with other taxes.
(b) Other excisable beverages are those not exceeding 10 per cent by volume of alcohol (excluding beer, brandy and wine).
(c) Tax revenue includes carbon accrual revenue measured at market price, with details of the accounting treatment of carbon revenue set out in Note 1 to the General Government Sector Financial Statements.

Statement 9: Budget financial statements
9-18
Note 3(a): Taxation revenue by source Estimates Projections
2011-12 2012-13 2013-14 2014-15 2015-16$m $m $m $m $m
Taxes on income, profits and capital gainsIncome and capital gains levied on individuals 154,790 166,980 183,420 196,575 209,365Income and capital gains levied on enterprises 77,160 90,662 95,241 99,952 106,652
Total taxes on income, profits and capital gains 231,950 257,642 278,661 296,527 316,017
Taxes on employers' payroll and labour force 461 485 503 523 543
Taxes on the provision of goods and servicesSales/goods and services tax 48,960 51,716 54,524 57,416 60,170Excises and levies 26,459 27,325 27,099 28,098 29,062Taxes on international trade 6,940 7,370 8,570 8,695 9,115
Total taxes on the provision of goods and services 82,359 86,411 90,193 94,209 98,347
Other sale of goods and services 1,684 10,088 11,370 12,019 12,253Total taxation revenue 316,454 354,626 380,727 403,278 427,160Memorandum:
Medicare levy revenue 9,090 9,640 10,250 10,890 11,410
Note 4: Sales of goods and services revenue Estimates Projections
2011-12 2012-13 2013-14 2014-15 2015-16$m $m $m $m $m
Sales of goods 1,281 1,523 1,659 1,706 1,728Rendering of services 4,113 3,914 3,798 3,489 3,447Operating lease rental 44 45 45 45 44Fees from regulatory services 2,818 2,783 3,139 3,215 3,568Total sales of goods and services revenue 8,256 8,264 8,641 8,455 8,788

Statement 9: Budget financial statements
9-19
Note 5: Interest and dividend revenue Estimates Projections
2011-12 2012-13 2013-14 2014-15 2015-16$m $m $m $m $m
Interest from other governmentsState and Territory debt 10 12 17 19 17Housing agreements 165 160 155 150 144
Total interest from other governments 176 173 173 168 162
Interest from other sourcesAdvances 41 43 47 51 57Deposits 101 96 99 101 103Bank deposits 221 206 197 198 205Indexation of HELP receivable and other
student loans 410 459 521 598 683Other 3,754 4,135 4,172 4,071 4,283
Total interest from other sources 4,527 4,940 5,036 5,019 5,331
Total interest 4,703 5,113 5,209 5,187 5,493
DividendsDividends from other public sector entities 374 1,126 446 476 415Other dividends 1,295 1,359 1,521 1,662 1,781
Total dividends 1,669 2,485 1,966 2,137 2,197
Total interest and dividend revenue 6,372 7,598 7,175 7,324 7,690
Note 6: Other sources of non-taxation revenue Estimates
2011-12 2012-13 2013-14 2014-15 2015-16$m $m $m $m $m
Industry contributions 36 41 40 40 40Royalties 1,654 1,799 1,696 1,667 1,673Seigniorage 124 136 134 138 137Other 3,521 3,607 3,783 3,928 4,072Total other sources of non-taxation revenue 5,336 5,583 5,654 5,773 5,922
Projections

Statement 9: Budget financial statements
9-20
Note 7: Employee and superannuation expense Estimates Projections
2011-12 2012-13 2013-14 2014-15 2015-16$m $m $m $m $m
Wages and salaries expenses 18,814 19,110 18,946 19,213 20,026
Other operating expensesLeave and other entitlements 2,508 2,254 2,286 2,311 2,345Separations and redundancies 110 37 37 40 38Workers compensation premiums and claims 712 744 784 831 884Other 2,420 2,023 2,125 2,221 2,318
Total other operating expenses 5,750 5,057 5,232 5,403 5,585
Superannuation expensesSuperannuation 4,316 3,968 4,047 4,113 4,169Superannuation interest cost 7,358 8,015 8,295 8,587 8,908
Total superannuation expenses 11,674 11,983 12,342 12,700 13,077
Total employee and superannuation expense 36,238 36,150 36,520 37,316 38,689
Note 8: Depreciation and amortisation expense Estimates Projections
2011-12 2012-13 2013-14 2014-15 2015-16$m $m $m $m $m
DepreciationSpecialist military equipment 2,704 2,762 2,806 2,811 2,829Buildings 1,230 1,273 1,314 1,365 1,408Other infrastructure, plant and equipment 1,245 1,296 1,346 1,357 1,374Heritage and cultural assets 38 39 39 39 39
Total depreciation 5,217 5,370 5,505 5,572 5,651
Total amortisation 786 819 817 821 817
Total depreciation and amortisation expense 6,003 6,188 6,322 6,393 6,468
Note 9: Supply of goods and services expense Estimates Projections
2011-12 2012-13 2013-14 2014-15 2015-16$m $m $m $m $m
Supply of goods and services 21,193 21,447 21,747 22,170 22,407Operating lease rental expenses 2,711 2,686 2,805 2,836 2,901Personal benefits – indirect 39,424 40,094 42,557 45,748 50,310Health care payments 5,291 5,400 5,500 5,623 5,781Other 1,364 1,493 1,552 1,946 2,349Total supply of goods and services expense 69,984 71,120 74,160 78,322 83,748

Statement 9: Budget financial statements
9-21
Note 10: Interest expense Estimates Projections
2011-12 2012-13 2013-14 2014-15 2015-16$m $m $m $m $m
Interest on debtGovernment securities(a) 11,510 12,017 12,013 11,635 11,416Loans 15 10 10 10 8Other 44 33 29 27 26
Total interest on debt 11,569 12,060 12,052 11,672 11,450
Other financing costs 1,440 1,528 1,909 2,059 2,152
Total interest expense 13,009 13,587 13,962 13,731 13,602 (a) Public debt interest estimates are calculated using the contract interest rates incurred on existing
Commonwealth Government Securities (CGS) when issued and technical assumptions, based on prevailing market interest rates across the yield curve, for yields on future CGS issuance.
Note 11: Current and capital grants expense Estimates Projections
2011-12 2012-13 2013-14 2014-15 2015-16$m $m $m $m $m
Current grants expenseState and Territory governments 83,810 84,523 89,115 93,946 99,646Local governments 37 39 28 8 3Private sector 2,584 2,211 2,586 3,041 2,953Overseas 4,075 4,468 5,190 5,625 6,240Non-profit organisations 2,058 1,787 1,847 1,793 2,111Multi-jurisdictional sector 9,208 9,587 9,959 10,369 10,801Other 8,914 10,105 11,759 14,347 12,418
Total current grants expense 110,686 112,720 120,484 129,129 134,172Capital grants expense
Mutually agreed write-downs 2,139 2,266 2,407 2,589 2,766Other capital grants
State and Territory governments 11,723 5,419 6,853 4,523 4,488Local governments 587 389 422 342 349Private sector 268 0 0 0 0Multi-jurisdictional sector 93 97 101 105 109Other 369 418 487 595 515
Total capital grants expense 15,179 8,589 10,271 8,153 8,227
Total grants expense 125,865 121,309 130,754 137,282 142,400
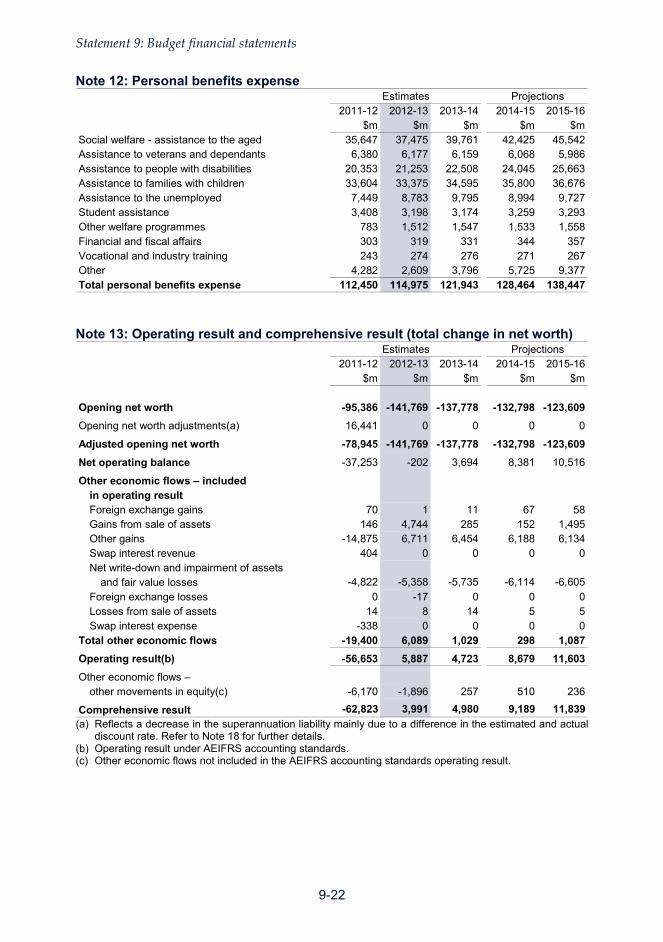
Statement 9: Budget financial statements
9-22
Note 12: Personal benefits expense Estimates Projections
2011-12 2012-13 2013-14 2014-15 2015-16$m $m $m $m $m
Social welfare - assistance to the aged 35,647 37,475 39,761 42,425 45,542Assistance to veterans and dependants 6,380 6,177 6,159 6,068 5,986Assistance to people with disabilities 20,353 21,253 22,508 24,045 25,663Assistance to families with children 33,604 33,375 34,595 35,800 36,676Assistance to the unemployed 7,449 8,783 9,795 8,994 9,727Student assistance 3,408 3,198 3,174 3,259 3,293Other welfare programmes 783 1,512 1,547 1,533 1,558Financial and fiscal affairs 303 319 331 344 357Vocational and industry training 243 274 276 271 267Other 4,282 2,609 3,796 5,725 9,377Total personal benefits expense 112,450 114,975 121,943 128,464 138,447
Note 13: Operating result and comprehensive result (total change in net worth) Estimates Projections
2011-12 2012-13 2013-14 2014-15 2015-16$m $m $m $m $m
Opening net worth -95,386 -141,769 -137,778 -132,798 -123,609
Opening net worth adjustments(a) 16,441 0 0 0 0
Adjusted opening net worth -78,945 -141,769 -137,778 -132,798 -123,609
Net operating balance -37,253 -202 3,694 8,381 10,516
Other economic flows – includedin operating resultForeign exchange gains 70 1 11 67 58Gains from sale of assets 146 4,744 285 152 1,495Other gains -14,875 6,711 6,454 6,188 6,134Swap interest revenue 404 0 0 0 0Net write-down and impairment of assets
and fair value losses -4,822 -5,358 -5,735 -6,114 -6,605Foreign exchange losses 0 -17 0 0 0Losses from sale of assets 14 8 14 5 5Swap interest expense -338 0 0 0 0
Total other economic flows -19,400 6,089 1,029 298 1,087
Operating result(b) -56,653 5,887 4,723 8,679 11,603
Other economic flows – other movements in equity(c) -6,170 -1,896 257 510 236
Comprehensive result -62,823 3,991 4,980 9,189 11,839 (a) Reflects a decrease in the superannuation liability mainly due to a difference in the estimated and actual
discount rate. Refer to Note 18 for further details. (b) Operating result under AEIFRS accounting standards. (c) Other economic flows not included in the AEIFRS accounting standards operating result.

Statement 9: Budget financial statements
9-23
Note 14: Advances paid and other receivables Estimates Projections
2011-12 2012-13 2013-14 2014-15 2015-16$m $m $m $m $m
Advances paidLoans to State and Territory governments 2,899 2,974 2,944 2,862 2,751Higher Education Loan Program 17,567 20,262 23,388 26,836 30,565Student Financial Supplement Scheme 656 598 533 464 391Other 8,626 9,248 10,910 12,342 13,414less Provision for doubtful debts 38 38 39 39 39
Total advances paid 29,711 33,044 37,736 42,466 47,083
Other receivablesGoods and services receivable 942 946 915 904 903Recoveries of benefit payments 2,880 2,900 2,875 2,903 2,981Taxes receivable 18,391 22,195 24,036 25,853 25,617Other 17,175 17,195 16,925 17,558 18,293less Provision for doubtful debts 3,357 3,463 3,591 3,718 3,846
Total other receivables 36,031 39,772 41,159 43,501 43,948
Note 15: Investments, loans and placements Estimates Projections
2011-12 2012-13 2013-14 2014-15 2015-16$m $m $m $m $m
Investments - deposits 28,572 30,670 29,024 25,469 23,295IMF quota 4,050 8,821 8,821 8,907 8,994Other 67,341 68,306 70,345 73,746 77,161Total investments, loans and placements 99,962 107,796 108,190 108,122 109,450

Statement 9: Budget financial statements
9-24
Note 16: Total non-financial assets Estimates Projections
2011-12 2012-13 2013-14 2014-15 2015-16$m $m $m $m $m
Land and buildingsLand 8,609 8,558 8,495 8,524 8,517Buildings 22,947 23,188 23,128 23,050 23,669
Total land and buildings 31,556 31,746 31,623 31,573 32,186
Plant, equipment and infrastructureSpecialist military equipment 39,955 39,880 39,827 40,423 42,652Other 12,408 13,132 13,477 13,293 12,919
Total plant, equipment and infrastructure 52,363 53,011 53,304 53,716 55,572
InventoriesInventories held for sale 1,095 1,130 1,109 1,051 1,050Inventories not held for sale 5,973 5,965 5,930 5,896 5,844
Total inventories 7,069 7,095 7,039 6,947 6,894
IntangiblesComputer software 3,242 3,277 3,126 2,931 2,677Other 2,104 2,251 2,376 2,705 3,100
Total intangibles 5,347 5,528 5,502 5,636 5,777
Total investment properties 314 660 682 682 682
Total biological assets 36 36 36 36 36
Total heritage and cultural assets 9,567 9,581 9,593 9,605 9,617
Total assets held for sale 146 146 146 146 146
Other non-financial assetsPrepayments 2,448 2,443 2,465 2,495 2,555Other 683 617 1,075 1,409 546
Total other non-financial assets 3,131 3,061 3,540 3,904 3,100
Total non-financial assets 109,528 110,864 111,465 112,245 114,010
Note 17: Loans Estimates Projections
2011-12 2012-13 2013-14 2014-15 2015-16$m $m $m $m $m
Promissory notes 3,229 6,481 6,021 6,045 6,017Special drawing rights 3,739 3,637 3,637 3,678 3,718Other 796 761 694 645 463Total loans 7,764 10,880 10,352 10,368 10,199

Statement 9: Budget financial statements
9-25
Note 18: Employee and superannuation liabilities Estimates Projections
2011-12 2012-13 2013-14 2014-15 2015-16$m $m $m $m $m
Total superannuation liability(a) 138,515 143,667 148,922 154,274 159,711
Other employee liabilitiesLeave and other entitlements 6,926 6,991 7,116 7,264 7,405Accrued salaries and wages 423 414 434 458 387Workers compensation claims 2,394 2,487 2,581 2,672 2,680Separations and redundancies 40 33 33 32 32Other 2,841 2,970 3,100 3,110 3,114
Total other employee liabilities 12,623 12,896 13,265 13,536 13,618
Total employee and superannuation liabilities 151,137 156,562 162,187 167,810 173,330
(a) For budget reporting purposes, a discount rate applied by actuaries in preparing Long-Term Cost Reports is used to value the superannuation liability. This reduces the volatility in reported liabilities that would occur from year to year if the long-term government bond rate were used. Consistent with AAS, the long-term government bond rate as at 30 June is used to calculate the superannuation liability for the purpose of actuals reporting.
Note 19: Provisions and payables Estimates Projections
2011-12 2012-13 2013-14 2014-15 2015-16$m $m $m $m $m
Suppliers payableTrade creditors 4,182 4,125 4,211 4,256 4,277Operating lease rental payable 195 205 206 207 206Other creditors 230 224 222 224 223
Total suppliers payable 4,607 4,555 4,639 4,687 4,706
Total personal benefits provisions and payable 12,436 13,929 14,222 14,666 15,251
Total subsidies provisions and payable 2,318 3,289 3,516 3,629 3,330
Grants provisions and payableState and Territory governments 169 173 169 169 169Non-profit organisations 101 101 101 101 101Private sector 318 316 313 305 305Overseas 1,016 1,328 1,585 1,231 842Local governments 14 14 14 14 14Other 9,320 9,315 7,815 6,969 7,222
Total grants provisions and payable 10,938 11,248 9,996 8,789 8,654
Other provisions and payablesProvisions for tax refunds 2,240 2,249 2,311 2,310 2,309Other 9,268 8,933 9,425 10,366 10,656
Total other provisions and payables 11,508 11,182 11,736 12,676 12,966

Statement 9: Budget financial statements
9-26
Note 20: Reconciliation of cash Estimates Projections
2011-12 2012-13 2013-14 2014-15 2015-16
$m $m $m $m $m
Operating balance (revenues less expenses) -37,253 -202 3,694 8,381 10,516
less Revenues not providing cash
Other 971 1,108 1,259 1,461 1,679
Total revenues not providing cash 971 1,108 1,259 1,461 1,679
plus Expenses not requiring cash
Increase/(decrease) in employee entitlements 5,611 5,483 5,693 5,731 5,668
Depreciation/amortisation expense 6,003 6,188 6,322 6,393 6,468
Mutually agreed write-downs 2,139 2,266 2,407 2,589 2,766
Other 921 730 1,251 1,662 1,761
Total expenses not requiring cash 14,674 14,667 15,673 16,376 16,663
plus Cash provided/(used) by working capital
items
Decrease/(increase) in inventories -460 -268 -199 -177 -270
Decrease/(increase) in receivables -4,205 -8,061 -6,621 -7,429 -5,794
Decrease/(increase) in other financial assets 73 642 1,534 1,007 837
Decrease/(increase) in other non-financial
assets -412 35 14 8 -12
Increase/(decrease) in benefits, subsidies and
grants payable -2,981 2,937 -523 -411 399
Increase/(decrease) in suppliers' liabilities 1,138 -2 120 53 -25
Increase/(decrease) in other provisions and
payables -553 -1,018 -178 -192 -2,404
Net cash provided/(used) by working capital -7,400 -5,735 -5,854 -7,140 -7,269
equals (Net cash from/(to) operating activities) -30,950 7,622 12,254 16,156 18,231
plus (Net cash from/(to) investing activities) -16,303 -17,911 -20,151 -17,298 -18,292
Net cash from operating activities and
investment -47,252 -10,288 -7,897 -1,142 -61
plus (Net cash from/(to) financing activities) 47,245 10,043 8,179 1,169 329
equals Net increase/(decrease) in cash -7 -246 282 27 268
Cash at the beginning of the year 2,477 2,470 2,224 2,506 2,532
Net increase/(decrease) in cash -7 -246 282 27 268
Cash at the end of the year 2,470 2,224 2,506 2,532 2,801

Statement 9: Budget financial statements
9-27
Note 20(a): Consolidated Revenue Fund
Estimates2011-12 2012-13 2013-14 2014-15 2015-16
$m $m $m $m $m
Total general government sector cash 2,470 2,224 2,506 2,532 2,801less CAC Agency cash balances 1,550 1,594 1,701 1,809 1,923plus Special public monies 382 382 382 382 382
Balance of Consolidated Revenue Fundat 30 June 1,302 1,012 1,187 1,105 1,260
Projections
The estimated and projected cash balances reflected in the balance sheet for the Australian Government GGS (Table 2) include the reported cash balances controlled and administered by Australian Government agencies subject to the Financial Management and Accountability Act 1997, and the reported cash balances controlled and administered by entities subject to the Commonwealth Authorities and Companies Act 1997 (CAC Act), that implement public policy through the provision of primarily non-market services.
Revenues or monies raised by the Executive Government automatically form part of the Consolidated Revenue Fund by force of section 81 of the Australian Constitution. For practical purposes, total Australian Government GGS cash, less cash controlled and administered by CAC Act entities, plus special public monies, represents the Consolidated Revenue Fund referred to in section 81 of the Australian Constitution. On this basis, the balance of the Consolidated Revenue Fund is shown above.
Further information on the Consolidated Revenue Fund is included in Budget Paper No. 4, Agency Resourcing 2012-13.

Statement 9: Budget financial statements
9-28
APPENDIX A: FINANCIAL REPORTING STANDARDS AND
BUDGET CONCEPTS
The Charter of Budget Honesty Act 1998 (the Charter) requires the budget to be based on external reporting standards. The Government has produced budget financial statements that comply with both ABS GFS and AAS, meeting the requirement of the Charter, with departures disclosed. The statements reflect the Government’s accounting policy that ABS GFS remains the basis of budget accounting policy, except where the Government applies AAS because it provides a better conceptual basis for presenting information of relevance to users of public sector financial reports.
AASB 1049 and the UPF also provide a basis for reporting of the PNFC and PFC sectors and the total NFPS.
General Government Sector Financial Reporting (AASB 1049)
The budget primarily focuses on the financial performance and position of the GGS. The ABS defines the GGS as providing public services which are mainly non-market in nature, mainly for the collective consumption of the community, involving the transfer or redistribution of income and financed mainly through taxes and other compulsory levies. AASB 1049 recognises the GGS as a reporting entity.
AASB 1049 history and conceptual framework
The AASB released AASB 1049 for application from the 2008-09 financial year. AASB 1049 seeks to ‘harmonise’ ABS GFS and AAS.
The reporting framework for AASB 1049 requires the preparation of accrual-based general purpose financial reports, showing government assets, liabilities, revenue, expenses and cash flows. GGS reporting under AASB 1049 aims to provide users with information about the stewardship of each government in relation to its GGS and accountability for the resources entrusted to it; information about the financial position, performance and cash flows of each government’s GGS; and information that facilitates assessments of the macroeconomic impact. While AASB 1049 provides a basis for whole-of-government and GGS outcome reporting (including the PNFC and PFC sectors), budget reporting focuses on the GGS.
There are three main general purpose statements that must be prepared in accordance with ABS GFS and AASB 1049. These are:
• an operating statement, including other economic flows, which shows net operating balance and net lending/borrowing (fiscal balance);
– to allow the presentation of a single set of financial statements in accordance with AASB 1049, the ABS GFS statement of other economic flows has been incorporated into the operating statement;

Statement 9: Budget financial statements
9-29
• a balance sheet, which also shows net worth, net financial worth, net financial liabilities and net debt; and
• a cash flow statement, which includes the calculation of the underlying cash balance.
In addition to these general purpose statements, notes to the financial statements are required. These notes include a summary of accounting policies, disaggregated information and other disclosures required by AAS. A full set of notes and other disclosures required by AAS are included in the annual consolidated financial statements.
All financial data presented in the financial statements are recorded as either stocks (assets and liabilities) or flows (classified as either transactions or other economic flows). Transactions result from a mutually agreed interaction between economic entities. Despite their compulsory nature, taxes are transactions deemed to occur by mutual agreement between the government and the taxpayer. Transactions that increase or decrease net worth (assets less liabilities) are reported as revenues and expenses respectively in the operating statement.1
A change to the value or volume of an asset or liability that does not result from a transaction is an other economic flow. This can include changes in values from market prices, most actuarial valuations, exchange rates and changes in volumes from discoveries, depletion and destruction. All other economic flows are reported in the operating statement.
Consistent with the ABS GFS framework, and in general AAS, the financial statements record flows in the period in which they occur. As a result, prior period outcomes may be revised for classification changes relating to information that could reasonably have been expected to be known in the past, is material in at least one of the affected periods and can be reliably assigned to the relevant period(s).
Operating statement
The operating statement presents details of transactions in revenues, expenses, the net acquisition of non-financial assets (net capital investment) and other economic flows for an accounting period.
Revenues arise from transactions that increase net worth and expenses arise from transactions that decrease net worth. Revenues less expenses gives the net operating balance. The net operating balance is similar to the National Accounts concept of government saving plus capital transfers.
1 Not all transactions impact on net worth. For example, transactions in financial assets and liabilities do not impact on net worth as they represent the swapping of assets and liabilities on the balance sheet.
Statement 9: Budget financial statements
9-30
The net acquisition of non-financial assets (net capital investment) measures the change in the Australian Government’s stock of non-financial assets owing to transactions. As such, it measures the net effect of purchases, sales and consumption (for example, depreciation of fixed assets and use of inventory) of non-financial assets during an accounting period.
Net acquisition of non-financial assets equals gross fixed capital formation, less depreciation, plus changes (investment) in inventories, plus other transactions in non-financial assets.
Other economic flows are presented in the operating statement and outline changes in net worth that are driven by economic flows other than revenues and expenses. Revenues, expenses and other economic flows sum to the total change in net worth during a period. The majority of other economic flows for the Australian Government GGS arise from price movements in its assets and liabilities.
Fiscal balance
The fiscal balance (or net lending/borrowing) is the net operating balance less net capital investment. Thus, the fiscal balance includes the impact of net expenditure (effectively purchases less sales) on non-financial assets rather than consumption (depreciation) of non-financial assets.2
The fiscal balance measures the Australian Government’s investment-saving balance. It measures in accrual terms the gap between government savings plus net capital transfers, and investment in non-financial assets. As such, it approximates the contribution of the Australian Government GGS to the balance on the current account in the balance of payments.
Balance sheet
The balance sheet shows stocks of assets, liabilities and net worth. In accordance with the UPF, net debt, net financial worth and net financial liabilities are also reported in the balance sheet.
Net worth
The net worth of the GGS, PNFC and PFC sectors is defined as assets less liabilities. This differs from the ABS GFS definition for the PNFC and PFC sectors where net worth is defined as assets less liabilities less shares and other contributed capital. Net worth is an economic measure of wealth, reflecting the Australian Government’s contribution to the wealth of Australia.
2 The net operating balance includes consumption of non-financial assets because depreciation is an expense. Depreciation also forms part of net capital investment, which (in the calculation of fiscal balance) offsets the inclusion of depreciation in the net operating balance.

Statement 9: Budget financial statements
9-31
Net financial worth
Net financial worth measures a government’s net holdings of financial assets. It is calculated from the balance sheet as financial assets minus liabilities. This differs from the ABS GFS definition of net financial worth for the PNFC and PFC sectors, defined as financial assets, less liabilities, less shares, less other contributed capital. Net financial worth is a broader measure than net debt, in that it incorporates provisions made (such as superannuation) as well as holdings of equity. Net financial worth includes all classes of financial assets and all liabilities, only some of which are included in net debt. As non-financial assets are excluded from net financial worth, this is a narrower measure than net worth. However, it avoids the concerns inherent with the net worth measure relating to the valuation of non-financial assets and their availability to offset liabilities.
Net financial liabilities
Net financial liabilities comprises total liabilities less financial assets but excludes equity investments in the other sectors of the jurisdiction. Net financial liabilities is a more accurate indicator than net debt of a jurisdiction’s fiscal position as it includes substantial non-debt liabilities such as accrued superannuation and long service leave entitlements. Excluding the net worth of other sectors of government results is a purer measure of financial worth than net financial worth as, in general, the net worth of other sectors of government, in particular the PNFC sector, is backed up by physical assets.
Net debt
Net debt is the sum of selected financial liabilities (deposits held, advances received, government securities, loans and other borrowing) less the sum of selected financial assets3 (cash and deposits, advances paid, and investments, loans and placements). This includes financial assets held by the Future Fund which are invested in these asset classes, including term deposits and investments in collective investment vehicles. Net debt does not include superannuation related liabilities. Net debt is a common measure of the strength of a government’s financial position. High levels of net debt impose a call on future revenue flows to service that debt.
Cash flow statement
The cash flow statement identifies how cash is generated and applied in a single accounting period. The cash flow statement reflects a cash basis of recording (rather than an accrual basis) where information is derived indirectly from underlying accrual transactions and movements in balances. This, in effect, means that transactions are
3 Financial assets are defined as cash, an equity instrument of another entity, a contractual right to receive cash or financial asset, and a contract that will or may be settled in the entity’s own equity instruments.

Statement 9: Budget financial statements
9-32
captured when cash is received or when cash payments are made. Cash transactions are specifically identified because cash management is considered an integral function of accrual budgeting.
Underlying cash balance
The underlying cash balance plus Future Fund earnings (ABS GFS cash surplus/deficit) is the cash counterpart of the fiscal balance, reflecting the Australian Government’s cash investment-saving balance. This measure is conceptually equivalent under the current accrual framework and the previous cash framework. For the GGS, the underlying cash balance is calculated as shown below:
Net cash flows from operating activities plus Net cash flows from investments in non-financial assets less Net acquisitions of assets acquired under finance leases and similar arrangements4 equals ABS GFS cash surplus/deficit less Future Fund earnings equals Underlying cash balance
The Government is reporting the underlying cash balance net of Future Fund earnings from 2005-06 onwards because the earnings will be reinvested to meet future superannuation payments and are therefore not available for current spending. However, Future Fund earnings are included in the fiscal balance because superannuation expenses relating to future cash payments are recorded in the fiscal balance estimates.
From 2020, the Future Fund becomes available to meet the Government’s superannuation liabilities. At this time earnings will be available to meet the Government’s recurrent superannuation spending, and so these will be included in the underlying cash balance.
The Government has decided to review the budget treatment of the Future Fund. In this Budget there has been no change to the current treatment of Future Fund earnings.
4 The underlying cash balance treats the acquisition and disposal of non-financial assets in the same manner regardless of whether they occur by purchase/sale or finance lease —acquisitions reduce the underlying cash balance and disposals increase the underlying cash balance. However, finance leases do not generate cash flows at the time of acquisition or disposal equivalent to the value of the asset. As such, net acquisitions of assets under finance leases are not shown in the body of the cash flow statement but are reported as a supplementary item for the calculation of the underlying cash balance.
Statement 9: Budget financial statements
9-33
In the second half of 2012 the Department of Finance and Deregulation and the Department of the Treasury plan to consult on the issues outlined in Box 1 below. Following further consideration of the issues raised, the Government will consider the future treatment of Future Fund costs in the Mid-Year Economic and Fiscal Outlook 2012-13.
Box 1: Future Fund earnings and costs and the underlying cash balance
The Commonwealth budget currently treats Future Fund payments and earnings (receipts) differently in the calculation of the underlying cash balance.
Since 2005-06, the underlying cash balance of the Commonwealth’s budget has excluded the gross earnings (receipts) of the Future Fund. This was a decision of the previous government taken when the Future Fund was created.
The earnings of the Fund were excluded because they are not available as a source to fund current spending. Under the Future Fund Act 2006, all earnings are required to be reinvested to meet the Government’s future public sector superannuation liabilities.
In contrast, the costs incurred to run the Future Fund are treated as a payment for the purpose of calculating the underlying cash balance. While gross earnings are deducted from the calculation of the underlying cash balance, only net earnings are available for reinvestment by the Fund. This is because the Fund is required under the Future Fund Act 2006 to meet all operating costs from its earnings.
This means that the gross earnings of the Fund are not included in the underlying cash balance, whereas the Fund’s costs are included. Excluding net rather than gross earnings would better reflect the operations of the Future Fund.
Expected Future Fund earnings are separately identified in the Australian Government GGS cash flow statement in Table 3 of this statement and related tables in Statement 3 and Statement 10.
Headline cash balance
The headline cash balance is calculated by adding net cash flows from investments in financial assets for policy purposes and Future Fund earnings to the underlying cash balance.

Statement 9: Budget financial statements
9-34
Cash flows from investments in financial assets for policy purposes include equity transactions and net advances.5 Equity transactions include equity injections into controlled businesses and privatisations of government businesses. Net advances include net loans to the States, net loans to students under the Higher Education Loan Program, and contributions to international organisations that increase the Australian Government’s financial assets.
Sectoral classifications
To assist in analysing the public sector, data is presented by institutional sector as shown in Figure 1. ABS GFS defines the GGS and the PNFC and PFC sectors. AASB 1049 has also adopted this sectoral reporting.
Figure 1: Institutional structure of the public sector
Total public sector
Public financial corporations sector
Public non-financial corporations sector
General government sector
Total non-financialpublic sector
(Includes Reserve Bank of Australia and other borrowing authorities)
(Government departments and agencies that provide non-market public services and are funded mainly through taxes)
(Provide goods and services to consumers on a commercial basis, are funded largely by the sale of these goods and services and are generally legally distinguishable from the governments that own them)
5 Cash flows from investments in financial assets for policy purposes were called net advances under the cash budgeting framework.

Statement 9: Budget financial statements
9-35
Table A1: Entities within the sectoral classifications
General government sector entities
Agriculture, Fisheries and Forestry Portfolio
Australian Fisheries Management Authority, Australian Pesticides and Veterinary Medicines Authority, Cotton Research and Development Corporation, Department of Agriculture, Fisheries and Forestry, Fisheries Research and Development Corporation, Grains Research and Development Corporation, Grape and Wine Research and Development Corporation, Rural Industries Research and Development Corporation, Sugar Research and Development Corporation, Wheat Exports Australia, Wine Australia Corporation
Attorney-General’s Portfolio
Administrative Appeals Tribunal, Attorney-General’s Department, Australian Commission for Law Enforcement Integrity, Australian Crime Commission, Australian Customs and Border Protection Service, Australian Federal Police, Australian Human Rights Commission, Australian Institute of Criminology, Australian Law Reform Commission, Australian Security Intelligence Organisation, Australian Transaction Reports and Analysis Centre, CrimTrac Agency, Family Court of Australia, Federal Court of Australia, Federal Magistrates Court of Australia, High Court of Australia, Insolvency and Trustee Service Australia, National Native Title Tribunal, Office of the Australian Information Commissioner, Office of the Director of Public Prosecutions, Office of Parliamentary Counsel
Broadband, Communications and the Digital Economy Portfolio
Australian Broadcasting Corporation, Australian Communications and Media Authority, Department of Broadband, Communications and the Digital Economy, Special Broadcasting Service Corporation, Telecommunications Universal Service Management Agency
Climate Change and Energy Efficiency Portfolio
Clean Energy Regulator, Climate Change Authority, Department of Climate Change and Energy Efficiency, Low Carbon Australia Limited
Defence Portfolio
AAF Company, Army and Air Force Canteen Service, Australian Military Forces Relief Trust Fund, Australian Strategic Policy Institute Limited, Australian War Memorial, Defence Housing Australia, Defence Materiel Organisation, Department of Defence, Department of Veterans’ Affairs, RAAF Welfare Recreational Company, Royal Australian Air Force Veterans’ Residences Trust Fund, Royal Australian Air Force Welfare Trust Fund, Royal Australian Navy Central Canteens Board, Royal Australian Navy Relief Trust Fund

Statement 9: Budget financial statements
9-36
Table A1: Entities within the sectoral classifications (continued)
General government sector entities (continued)
Education, Employment and Workplace Relations Portfolio
Australian Curriculum, Assessment and Reporting Authority, Australian Institute for Teaching and School Leadership Limited, Comcare, Department of Education, Employment and Workplace Relations, Fair Work Australia, Office of the Australian Building and Construction Commissioner, Office of the Fair Work Building Industry Inspectorate, Office of the Fair Work Ombudsman, Safe Work Australia, Seafarers Safety, Rehabilitation and Compensation Authority (Seacare Authority)
Families, Housing, Community Services and Indigenous Affairs Portfolio
Aboriginal Hostels Limited, Anindilyakwa Land Council, Australian Institute of Family Studies, Central Land Council, Department of Families, Housing, Community Services and Indigenous Affairs, Equal Opportunity for Women in the Workplace Agency, Indigenous Business Australia, Indigenous Land Corporation, Northern Land Council, Outback Stores Pty Ltd, Tiwi Land Council, Torres Strait Regional Authority, Wreck Bay Aboriginal Community Council
Finance and Deregulation Portfolio
Australian Electoral Commission, Commonwealth Superannuation Corporation, ComSuper, Department of Finance and Deregulation, Future Fund Management Agency
Foreign Affairs and Trade Portfolio
AusAID, Australian Centre for International Agricultural Research, Australian Secret Intelligence Service, Australian Trade Commission, Department of Foreign Affairs and Trade, Export Finance and Insurance Corporation National Interest Account
Health and Ageing Portfolio
Aged Care Standards and Accreditation Agency Ltd, Australian Commission on Safety and Quality in Health Care, Australian Institute of Health and Welfare, Australian National Preventative Health Agency, Australian Organ and Tissue Donation and Transplantation Authority, Australian Radiation Protection and Nuclear Safety Agency, Cancer Australia, Department of Health and Ageing, Food Standards Australia New Zealand, General Practice Education and Training Limited, Health Workforce Australia, Independent Hospital Pricing Authority, National Blood Authority, National Health and Medical Research Council, National Health Performance Authority, Private Health Insurance Administration Council, Private Health Insurance Ombudsman, Professional Services Review

Statement 9: Budget financial statements
9-37
Table A1: Entities within the sectoral classifications (continued)
General government sector entities (continued)
Human Services Portfolio
Department of Human Services
Immigration and Citizenship Portfolio
Department of Immigration and Citizenship, Migration Review Tribunal and Refugee Review Tribunal
Industry, Innovation, Science, Research and Tertiary Education Portfolio
Australian Institute of Aboriginal and Torres Strait Islander Studies, Australian Institute of Marine Science, Australian Learning and Teaching Council Limited, Australian Nuclear Science and Technology Organisation, Australian Research Council, Commonwealth Scientific and Industrial Research Organisation, Department of Industry, Innovation, Science, Research and Tertiary Education, IIF Investments Pty Limited, IP Australia, Australian Skills Quality Authority (National Vocational Education and Training Regulator), Tertiary Education Quality and Standards Agency
Infrastructure and Transport Portfolio
Australian Maritime Safety Authority, Australian Transport Safety Bureau, Civil Aviation Safety Authority, Department of Infrastructure and Transport, National Transport Commission
Prime Minister and Cabinet Portfolio
Australian National Audit Office, Australian Public Service Commission, Department of the Prime Minister and Cabinet, National Australia Day Council Limited, National Mental Health Commission, Office of the Commonwealth Ombudsman, Office of the Inspector-General of Intelligence and Security, Office of National Assessments, Office of the Official Secretary to the Governor-General
Regional Australia, Local Government, Arts and Sport Portfolio
Australia Business Arts Foundation Ltd, Australia Council, Australian Film, Television and Radio School, Australian National Maritime Museum, Australian Sports Anti-Doping Authority, Australian Sports Commission, Australian Sports Foundation Limited, Bundanon Trust, Department of Regional Australia, Local Government, Arts and Sport, National Archives of Australia, National Capital Authority, National Film and Sound Archive, National Gallery of Australia, National Library of Australia, National Museum of Australia, Old Parliament House, Screen Australia

Statement 9: Budget financial statements
9-38
Table A1: Entities within the sectoral classifications (continued)
General government sector entities (continued)
Resources, Energy and Tourism Portfolio
Australian Renewable Energy Agency, Australian Solar Institute Limited, Department of Resources, Energy and Tourism, Geoscience Australia, National Offshore Petroleum Safety and Environmental Management Authority, Tourism Australia
Sustainability, Environment, Water, Population and Communities Portfolio
Bureau of Meteorology, Department of Sustainability, Environment, Water, Population and Communities, Director of National Parks, Great Barrier Reef Marine Park Authority, Murray-Darling Basin Authority, National Water Commission, Sydney Harbour Federation Trust
Treasury Portfolio
Australian Bureau of Statistics, Australian Competition and Consumer Commission, Australian Office of Financial Management, Australian Prudential Regulation Authority, Australian Securities and Investments Commission, Australian Taxation Office, Clean Energy Finance Corporation, Commonwealth Grants Commission, Corporations and Markets Advisory Committee, Department of the Treasury, Inspector-General of Taxation, National Competition Council, Office of the Auditing and Assurance Standards Board, Office of the Australian Accounting Standards Board, Productivity Commission, Royal Australian Mint
Parliamentary Departments
Department of Parliamentary Services, Department of the House of Representatives, Department of the Senate, Parliamentary Budget Office
Public financial corporations
Education, Employment and Workplace Relations Portfolio
Coal Mining Industry (Long Service Leave Funding) Corporation
Finance and Deregulation Portfolio
Medibank Private Ltd
Foreign Affairs and Trade Portfolio
Export Finance and Insurance Corporation
Treasury Portfolio
Australia Reinsurance Pool Corporation, Reserve Bank of Australia

Statement 9: Budget financial statements
9-39
Table A1: Entities within the sectoral classifications (continued)
Public non-financial corporations
Attorney General’s Portfolio
Australian Government Solicitor
Broadband, Communications and the Digital Economy Portfolio
Australian Postal Corporation, NBN Co Ltd
Families, Housing, Community Services and Indigenous Affairs Portfolio
Voyages Indigenous Tourism Australia Pty Ltd
Finance and Deregulation Portfolio
Albury-Wodonga Development Corporation, Australian River Co. Ltd, ASC Pty Ltd
Human Services Portfolio
Australian Hearing Services
Infrastructure and Transport Portfolio
Airservices Australia, Australian Rail Track Corporation Ltd
Differences between ABS GFS and AAS framework (including AASB 1049)
AASB 1049 has adopted the AAS conceptual framework and principles for the recognition of assets, liabilities, revenues and expenses and their presentation, measurement and disclosure. In addition, AASB 1049 has broadly adopted the ABS GFS conceptual framework for presenting government financial statements. In particular, AASB 1049 requires the GGS to prepare a separate set of financial statements, over-riding AASB 127 Consolidated and Separate Financial Statements. AASB 1049 also follows ABS GFS by requiring changes in net worth to be split into either transactions or ‘other economic flows’ and for this to be presented in a single operating statement. AASB 1049 is therefore broadly consistent with international statistical standards and the International Monetary Fund’s (IMF) Government Finance Statistics Manual 2001.6
Some of the major differences between AAS and the ABS GFS treatments of transactions are outlined in Table A2. Further information on the differences between the two systems is provided in the ABS publication Australian System of Government Finance Statistics: Concepts, Sources and Methods, 2005 (cat. no. 5514.0).
6 Additional information on the Australian accrual GFS framework is available in the ABS publication Australian System of Government Finance Statistics: Concepts, Sources and Methods, 2005 (cat. no. 5514.0).

Statement 9: Budget financial statements
9-40
Table A2: Major differences between AAS and ABS GFS Issue AAS treatment ABS GFS treatment Treatment
adopted
Acquisition of defence weapons platforms (DWP)
Treated as capital expenditure. DWP appear as a non-financial asset on the balance sheet. Depreciation expense on assets is recorded in the operating statement. AASB 1049 requires cost to be used where fair value of the assets cannot be reliably measured.
ABS has updated its treatment in its GFS reports to record DWP as a non-financial asset on a market value basis. This represents an early adoption of changes to the System of National Accounts.
AAS
Circulating coins — seigniorage
The profit between the cost and sale of circulating coins (seigniorage) is treated as revenue.
Circulating coins (seigniorage) is treated as a liability, and the cost of producing the coins is treated as an expense.
AAS
Provision for bad and doubtful debts
Reported in the balance sheet as an offset to assets. Under AASB 1049, it is included in the operating statement as other economic flows.
Creating provisions is not considered an economic event and is therefore not considered to be an expense or reflected in the balance sheet.
AAS
Advances to the International Development Association and Asian Development Fund
Recorded at fair value in the balance sheet.
Recorded at nominal value in balance sheet.
ABS GFS
Concessional loans
Discounts concessional loans by a market rate of a similar instrument.
Does not discount concessional loans as no secondary market is considered to exist.
AAS
Investment in Other Public Sector Entities
Valued at fair value in the balance sheet as long as it can be reliably measured, otherwise net assets is permissible.
Unlisted entities valued based on their net assets in the balance sheet.
AAS
Provision for restoration, decommis- sioning and make-good
Included in the Fiscal Balance capital adjustment.
Excluded from the calculation of net lending capital adjustment.
AAS
Dividends paid by public corporations
Treated as an equity distribution. Equity distributions are treated as a distribution of profits, as opposed to an expense.
Dividends are treated as an expense.
ABS GFS

Statement 9: Budget financial statements
9-41
Issue AAS treatment ABS GFS treatment Treatment adopted
Commercial tax effect accounting assets and liabilities
Corporations in the PNFC and PFC sectors record tax expenses on a commercial basis.
Deferred tax assets and liabilities are reversed so that Corporations record tax expenses on a consistent basis to the Australian Taxation Office.
ABS GFS
Fiscal aggregates differences
Finance leases
Does not deduct finance leases in the derivation of the cash surplus/deficit.
Deducts finance leases in the derivation of the cash surplus/deficit.
Both are disclosed
Net worth of PNFC and PFC sectors
Calculated as assets less liabilities.
Calculated as assets less liabilities less shares and other contributed capital.
AAS
Classification difference
Prepayments Treated as a non-financial asset. Treated as a financial asset. AAS

Statement 9: Budget financial statements
9-42
APPENDIX B: AUSTRALIAN LOAN COUNCIL ALLOCATION
Under Loan Council arrangements, every year the Commonwealth and each State and Territory government nominate a Loan Council Allocation (LCA). A jurisdiction’s LCA incorporates:
• the estimated non-financial public sector ABS GFS cash surplus/deficit (made up from the balances of the general government and public non-financial corporations sectors and total non-financial public sector acquisitions under finance leases and similar arrangements);
• net cash flows from investments in financial assets for policy purposes; and
• memorandum items, which involve transactions that are not formally borrowings but nevertheless have many of the characteristics of borrowings.
LCA nominations are considered by the Loan Council, having regard to each jurisdiction’s fiscal position and infrastructure requirements, as well as the macroeconomic implications of the aggregate figure.
As set out in Table B1, the Commonwealth’s 2012-13 LCA budget update is a $13.6 billion deficit. This compares with its LCA nomination of a $7.0 billion deficit endorsed by Loan Council on 4 April 2012. The LCA budget update falls within the tolerance limit set at nomination.
Table B1: Commonwealth’s Loan Council Allocation budget update for 2012-13 2012-13 2012-13
Nomination Budget estimate$m $m
GGS cash surplus(-)/deficit(+) -4,490 -4,971PNFC sector cash surplus(-)/deficit(+) 948 5,137NFPS cash surplus(-)/deficit(+) (a) -3,542 394Acquisitions under finance leases and similar arrangements 404 412
equals ABS GFS cash surplus(-)/deficit(+) -3,137 805minus Net cash flows from investments
in financial assets for policy purposes (b) -10,867 -13,281plus Memorandum items (c) -761 -440
Loan Council Allocation 6,969 13,646 (a) May not directly equate to the sum of the GGS and the PNFC sector cash surplus/deficit due to intersectoral
transfers which are netted out. (b) Net cash flow from investments in financial assets for policy purposes are displayed with the same sign as they
are reported in cash flow statements. Such transactions involve the transfer or exchange of a financial asset and are not included within the cash surplus/deficit. However, the cash flow from investments in financial assets for policy purposes has implications for a government’s call on financial markets.
(c) For the Commonwealth’s LCA, memorandum items include the change in net present value (NPV) of operating leases (with NPV greater than $5 million), the overfunding of superannuation and the net financing requirement of the Australian National University.
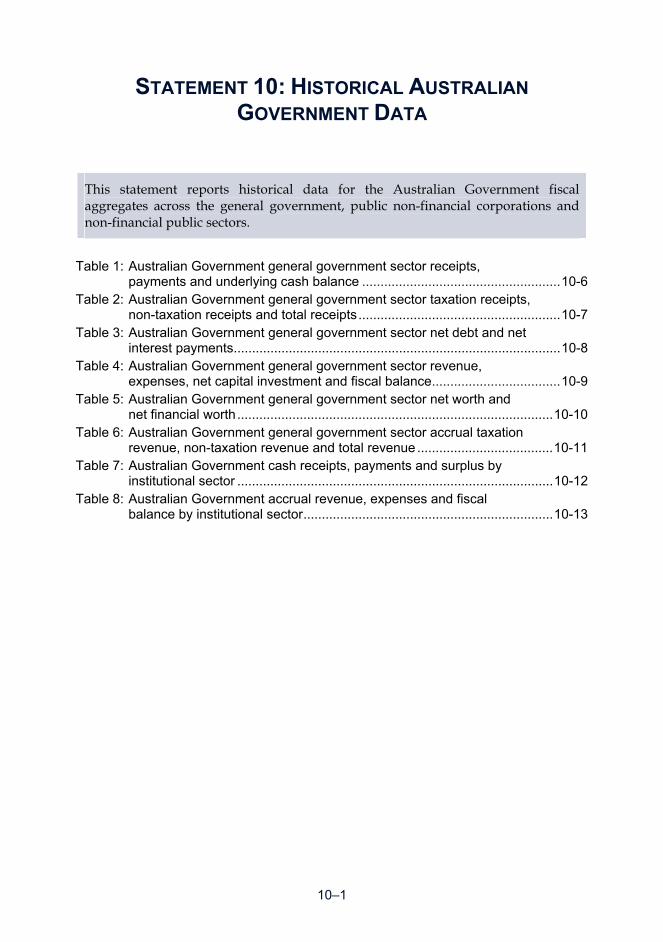
10–1
STATEMENT 10: HISTORICAL AUSTRALIAN
GOVERNMENT DATA
This statement reports historical data for the Australian Government fiscal aggregates across the general government, public non-financial corporations and non-financial public sectors.
Table 1: Australian Government general government sector receipts,
payments and underlying cash balance ...................................................... 10-6 Table 2: Australian Government general government sector taxation receipts,
non-taxation receipts and total receipts ....................................................... 10-7 Table 3: Australian Government general government sector net debt and net
interest payments ......................................................................................... 10-8 Table 4: Australian Government general government sector revenue,
expenses, net capital investment and fiscal balance ................................... 10-9 Table 5: Australian Government general government sector net worth and
net financial worth ...................................................................................... 10-10 Table 6: Australian Government general government sector accrual taxation
revenue, non-taxation revenue and total revenue ..................................... 10-11 Table 7: Australian Government cash receipts, payments and surplus by
institutional sector ...................................................................................... 10-12 Table 8: Australian Government accrual revenue, expenses and fiscal
balance by institutional sector .................................................................... 10-13


10–3
STATEMENT 10: HISTORICAL AUSTRALIAN
GOVERNMENT DATA
Statement 10 reports historical data for the Australian Government fiscal aggregates across the general government, public non-financial corporations and non-financial public sectors.
DATA SOURCES
Data are sourced from Australian Government Final Budget Outcomes, the Australian Bureau of Statistics (ABS) and Australian Government Consolidated Financial Statements.
• Accrual data from 1996-97 onwards and cash data, net debt data, net financial worth data and net worth data from 1999-2000 onwards are sourced from Australian Government Final Budget Outcomes. Back-casting adjustments for accounting classification changes and other revisions have been made from 1998-1999 onwards where applicable.
• Cash data prior to 1999-2000 are sourced from ABS data, which have been calculated using methodology consistent with that used for later years in ABS cat. no. 5512.0 Government Finance Statistics.
• Net debt data prior to 1999-2000 are from ABS cat. no. 5512.0 Government Finance Statistics 2003-04 in 1998-99, ABS cat. no. 5501.0 Government Financial Estimates 1999-2000 and ABS cat. no. 5513.0 Public Sector Financial Assets and Liabilities 1998 in 1987-88 to 1997-98, and Treasury estimates (see Treasury’s Economic Roundup, Spring 1996, pages 97-103) prior to 1987-88.
COMPARABILITY OF DATA ACROSS YEARS
The data set contains a number of structural breaks owing to accounting classification differences and changes to the structure of the budget which cannot be eliminated through back-casting because of data limitations. These breaks can affect the comparability of data across years, especially when the analysis is taken over a large number of years. Specific factors causing structural breaks include:
• from 2005-06 onwards, underlying Government Finance Statistics (GFS) data are provided by agencies in accordance with Australian Equivalents to International Financial Reporting Standards (AEIFRS). Prior to 2005-06, underlying GFS data are based on data provided by agencies in accordance with Australian Accounting Standards (AAS);

Statement 10: Historical Australian Government Data
10–4
• most recent accounting classification changes that require revisions to the historical series have been back-cast (where applicable) to 1998-1999, ensuring that data are consistent across the accrual period from 1998-1999 onwards. However, because of data limitations, these changes have not been back-cast to earlier years;
• prior to 1999-2000, Australian Government general government sector debt instruments are valued at historic cost, whereas from 1999-2000 onwards they are valued at market prices (consistent with accrual GFS standards). This affects net debt and net interest payments;
• cash data up to and including 1997-98 are calculated under a cash accounting framework, while cash data from 1998-99 onwards is derived from an accrual accounting framework.1 Although the major methodological differences associated with the move to the accrual framework have been eliminated through back-casting, comparisons across the break may still be affected by changes to some data sources and collection methodologies;
• adjustments in the coverage of agencies included in the accounts of the different sectors. These include the reclassification of Central Banking Authorities from the general government to the public financial corporations sector in 1998-99, and subsequent back-casting to account for this change;
• changes in arrangements for transfer payments, where tax concessions or rebates have been replaced by payments through the social security system. This has the effect of increasing both cash receipts and payments, as compared with earlier periods, but not changing cash balances. Changes in the opposite direction (tax expenditures replacing payments) reduce both cash payments and receipts; and
• classification differences in the data relating to the period prior to 1976-77 (which means that earlier data may not be entirely consistent with data for 1976-77 onwards).
REVISIONS TO PREVIOUSLY PUBLISHED DATA
Under the accrual GFS framework and generally under AAS, flows are recorded in the period in which they occurred. As a result, prior period outcomes may be revised for classification changes relating to information that could reasonably have been expected to be known in the past, is material in at least one of the affected periods, and can be reliably assigned to the relevant period(s).
1 Prior to the 2008-09 Budget, cash data calculated under the cash accounting framework was
used up to and including 1998-99. In the 2008-09 Budget, cash data prior to 1998-99 has been replaced by ABS data derived from the accrual framework.

Statement 10: Historical Australian Government Data
10–5
DEFLATING REAL SPENDING GROWTH BY THE CONSUMER PRICE INDEX
The 2012-13 Budget, including the historical series, calculates real spending growth using the Consumer Price Index (CPI) as the deflator. This is also the benchmark against which the Government’s fiscal strategy is based. Prior to the 2008-09 Budget the non-farm GDP (NFGDP) deflator was used and has therefore been shown in this statement for comparative purposes.
The use of the CPI, rather than the non-farm GDP deflator, provides a more accurate depiction of real government spending growth, especially in the current economic climate. The non-farm GDP deflator incorporates fluctuations in global commodity prices which are not relevant for Government expenditures. Therefore, deflating government spending by the non-farm GDP deflator distorts trends in real spending growth.
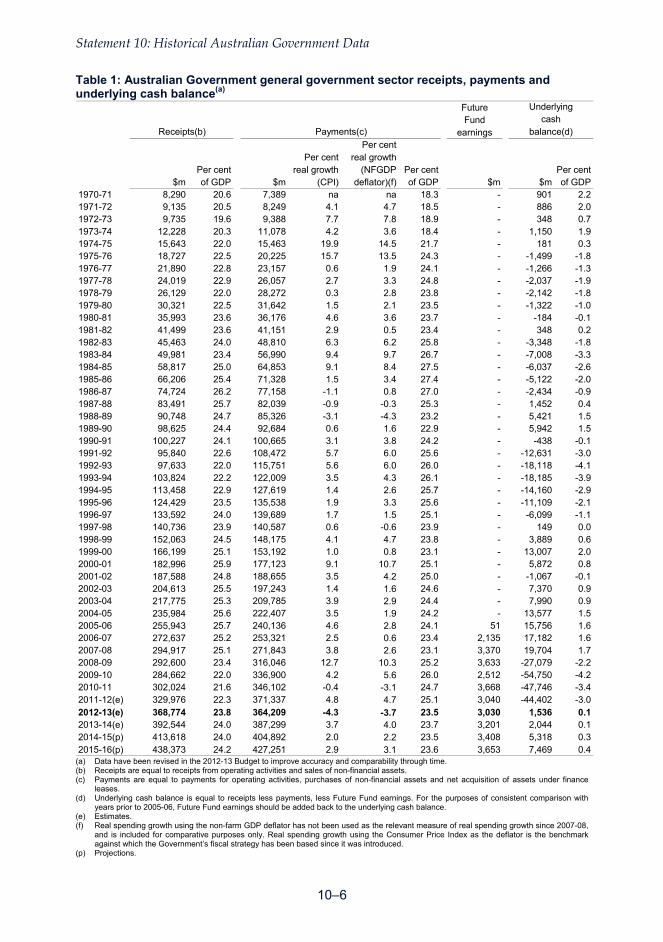
Statement 10: Historical Australian Government Data
10–6
Table 1: Australian Government general government sector receipts, payments and underlying cash balance(a)
FutureFund
earningsPer cent
Per cent real growthPer cent real growth (NFGDP Per cent Per cent
$m of GDP $m (CPI) deflator)(f) of GDP $m $m of GDP1970-71 8,290 20.6 7,389 na na 18.3 - 901 2.21971-72 9,135 20.5 8,249 4.1 4.7 18.5 - 886 2.01972-73 9,735 19.6 9,388 7.7 7.8 18.9 - 348 0.71973-74 12,228 20.3 11,078 4.2 3.6 18.4 - 1,150 1.91974-75 15,643 22.0 15,463 19.9 14.5 21.7 - 181 0.31975-76 18,727 22.5 20,225 15.7 13.5 24.3 - -1,499 -1.81976-77 21,890 22.8 23,157 0.6 1.9 24.1 - -1,266 -1.31977-78 24,019 22.9 26,057 2.7 3.3 24.8 - -2,037 -1.91978-79 26,129 22.0 28,272 0.3 2.8 23.8 - -2,142 -1.81979-80 30,321 22.5 31,642 1.5 2.1 23.5 - -1,322 -1.01980-81 35,993 23.6 36,176 4.6 3.6 23.7 - -184 -0.11981-82 41,499 23.6 41,151 2.9 0.5 23.4 - 348 0.21982-83 45,463 24.0 48,810 6.3 6.2 25.8 - -3,348 -1.81983-84 49,981 23.4 56,990 9.4 9.7 26.7 - -7,008 -3.31984-85 58,817 25.0 64,853 9.1 8.4 27.5 - -6,037 -2.61985-86 66,206 25.4 71,328 1.5 3.4 27.4 - -5,122 -2.01986-87 74,724 26.2 77,158 -1.1 0.8 27.0 - -2,434 -0.91987-88 83,491 25.7 82,039 -0.9 -0.3 25.3 - 1,452 0.41988-89 90,748 24.7 85,326 -3.1 -4.3 23.2 - 5,421 1.51989-90 98,625 24.4 92,684 0.6 1.6 22.9 - 5,942 1.51990-91 100,227 24.1 100,665 3.1 3.8 24.2 - -438 -0.11991-92 95,840 22.6 108,472 5.7 6.0 25.6 - -12,631 -3.01992-93 97,633 22.0 115,751 5.6 6.0 26.0 - -18,118 -4.11993-94 103,824 22.2 122,009 3.5 4.3 26.1 - -18,185 -3.91994-95 113,458 22.9 127,619 1.4 2.6 25.7 - -14,160 -2.91995-96 124,429 23.5 135,538 1.9 3.3 25.6 - -11,109 -2.11996-97 133,592 24.0 139,689 1.7 1.5 25.1 - -6,099 -1.11997-98 140,736 23.9 140,587 0.6 -0.6 23.9 - 149 0.01998-99 152,063 24.5 148,175 4.1 4.7 23.8 - 3,889 0.61999-00 166,199 25.1 153,192 1.0 0.8 23.1 - 13,007 2.02000-01 182,996 25.9 177,123 9.1 10.7 25.1 - 5,872 0.82001-02 187,588 24.8 188,655 3.5 4.2 25.0 - -1,067 -0.12002-03 204,613 25.5 197,243 1.4 1.6 24.6 - 7,370 0.92003-04 217,775 25.3 209,785 3.9 2.9 24.4 - 7,990 0.92004-05 235,984 25.6 222,407 3.5 1.9 24.2 - 13,577 1.52005-06 255,943 25.7 240,136 4.6 2.8 24.1 51 15,756 1.62006-07 272,637 25.2 253,321 2.5 0.6 23.4 2,135 17,182 1.62007-08 294,917 25.1 271,843 3.8 2.6 23.1 3,370 19,704 1.72008-09 292,600 23.4 316,046 12.7 10.3 25.2 3,633 -27,079 -2.22009-10 284,662 22.0 336,900 4.2 5.6 26.0 2,512 -54,750 -4.22010-11 302,024 21.6 346,102 -0.4 -3.1 24.7 3,668 -47,746 -3.42011-12(e) 329,976 22.3 371,337 4.8 4.7 25.1 3,040 -44,402 -3.02012-13(e) 368,774 23.8 364,209 -4.3 -3.7 23.5 3,030 1,536 0.12013-14(e) 392,544 24.0 387,299 3.7 4.0 23.7 3,201 2,044 0.12014-15(p) 413,618 24.0 404,892 2.0 2.2 23.5 3,408 5,318 0.32015-16(p) 438,373 24.2 427,251 2.9 3.1 23.6 3,653 7,469 0.4
Underlyingcash
balance(d)Receipts(b) Payments(c)
(a) Data have been revised in the 2012-13 Budget to improve accuracy and comparability through time. (b) Receipts are equal to receipts from operating activities and sales of non-financial assets. (c) Payments are equal to payments for operating activities, purchases of non-financial assets and net acquisition of assets under finance
leases. (d) Underlying cash balance is equal to receipts less payments, less Future Fund earnings. For the purposes of consistent comparison with
years prior to 2005-06, Future Fund earnings should be added back to the underlying cash balance. (e) Estimates. (f) Real spending growth using the non-farm GDP deflator has not been used as the relevant measure of real spending growth since 2007-08,
and is included for comparative purposes only. Real spending growth using the Consumer Price Index as the deflator is the benchmark against which the Government’s fiscal strategy has been based since it was introduced.
(p) Projections.

Statement 10: Historical Australian Government Data
10–7
Table 2: Australian Government general government sector taxation receipts, non-taxation receipts and total receipts(a)
Per cent Per cent Per cent$m of GDP $m of GDP $m of GDP
1970-71 7,193 17.8 1,097 2.7 8,290 20.61971-72 7,895 17.8 1,240 2.8 9,135 20.51972-73 8,411 16.9 1,324 2.7 9,735 19.61973-74 10,832 18.0 1,396 2.3 12,228 20.31974-75 14,141 19.9 1,502 2.1 15,643 22.01975-76 16,920 20.3 1,807 2.2 18,727 22.51976-77 19,714 20.5 2,176 2.3 21,890 22.81977-78 21,428 20.4 2,591 2.5 24,019 22.91978-79 23,409 19.7 2,720 2.3 26,129 22.01979-80 27,473 20.4 2,848 2.1 30,321 22.51980-81 32,641 21.4 3,352 2.2 35,993 23.61981-82 37,880 21.6 3,619 2.1 41,499 23.61982-83 41,025 21.7 4,438 2.3 45,463 24.01983-84 44,849 21.0 5,132 2.4 49,981 23.41984-85 52,970 22.5 5,847 2.5 58,817 25.01985-86 58,841 22.6 7,365 2.8 66,206 25.41986-87 66,467 23.3 8,257 2.9 74,724 26.21987-88 75,076 23.1 8,415 2.6 83,491 25.71988-89 83,452 22.7 7,296 2.0 90,748 24.71989-90 90,773 22.4 7,852 1.9 98,625 24.41990-91 92,739 22.3 7,488 1.8 100,227 24.11991-92 87,364 20.6 8,476 2.0 95,840 22.61992-93 88,760 20.0 8,873 2.0 97,633 22.01993-94 93,362 20.0 10,462 2.2 103,824 22.21994-95 104,921 21.1 8,537 1.7 113,458 22.91995-96 115,700 21.8 8,729 1.6 124,429 23.51996-97 124,559 22.4 9,033 1.6 133,592 24.01997-98 130,984 22.2 9,752 1.7 140,736 23.91998-99 138,420 22.3 13,643 2.2 152,063 24.51999-00 151,313 22.9 14,887 2.2 166,199 25.12000-01 170,354 24.1 12,641 1.8 182,996 25.92001-02 175,108 23.2 12,481 1.7 187,588 24.82002-03 192,131 24.0 12,482 1.6 204,613 25.52003-04 206,091 24.0 11,683 1.4 217,775 25.32004-05 223,314 24.2 12,669 1.4 235,984 25.62005-06 241,215 24.2 14,728 1.5 255,943 25.72006-07 257,392 23.8 15,245 1.4 272,637 25.22007-08 278,376 23.7 16,540 1.4 294,917 25.12008-09 272,627 21.8 19,973 1.6 292,600 23.42009-10 260,973 20.2 23,689 1.8 284,662 22.02010-11 280,839 20.1 21,185 1.5 302,024 21.62011-12(e) 309,653 21.0 20,323 1.4 329,976 22.32012-13(e) 343,107 22.1 25,667 1.7 368,774 23.82013-14(e) 371,409 22.7 21,135 1.3 392,544 24.02014-15(p) 392,852 22.8 20,766 1.2 413,618 24.02015-16(p) 415,459 22.9 22,914 1.3 438,373 24.2
Taxation receipts Non-taxation receipts Total receipts(b)
(a) Data have been revised in the 2012-13 Budget to improve accuracy and comparability through time. (b) Receipts are equal to receipts from operating activities and sales of non-financial assets. (e) Estimates. (p) Projections.

Statement 10: Historical Australian Government Data
10–8
Table 3: Australian Government general government sector net debt and net interest payments(a)
Per cent Per cent$m of GDP $m of GDP
1970-71 344 0.9 -189 -0.51971-72 -496 -1.1 -245 -0.61972-73 -790 -1.6 -252 -0.51973-74 -1,851 -3.1 -286 -0.51974-75 -1,901 -2.7 -242 -0.31975-76 -341 -0.4 -330 -0.41976-77 898 0.9 -62 -0.11977-78 2,896 2.8 4 0.01978-79 4,983 4.2 254 0.21979-80 6,244 4.6 440 0.31980-81 6,356 4.2 620 0.41981-82 5,919 3.4 680 0.41982-83 9,151 4.8 896 0.51983-84 16,015 7.5 1,621 0.81984-85 21,896 9.3 2,813 1.21985-86 26,889 10.3 3,952 1.51986-87 29,136 10.2 4,762 1.71987-88 27,344 8.4 4,503 1.41988-89 21,981 6.0 4,475 1.21989-90 16,123 4.0 4,549 1.11990-91 16,915 4.1 3,636 0.91991-92 31,041 7.3 3,810 0.91992-93 55,218 12.4 3,986 0.91993-94 70,223 15.0 5,628 1.21994-95 83,492 16.8 7,292 1.51995-96 95,831 18.1 8,861 1.71996-97 96,281 17.3 9,489 1.71997-98 82,935 14.1 8,279 1.41998-99 72,065 11.6 8,649 1.41999-00 53,869 8.1 7,514 1.12000-01 42,719 6.0 6,195 0.92001-02 38,180 5.1 5,352 0.72002-03 29,047 3.6 3,758 0.52003-04 22,639 2.6 3,040 0.42004-05 10,741 1.2 2,502 0.32005-06 -4,531 -0.5 2,303 0.22006-07 -29,150 -2.7 228 0.02007-08 -44,820 -3.8 -1,015 -0.12008-09 -16,148 -1.3 -1,196 -0.12009-10 42,283 3.3 2,386 0.22010-11 84,551 6.0 4,608 0.32011-12(e) 142,493 9.6 6,502 0.42012-13(e) 143,345 9.2 7,001 0.52013-14(e) 144,887 8.9 6,771 0.42014-15(p) 140,113 8.1 6,994 0.42015-16(p) 131,567 7.3 8,152 0.4
Net debt(b) Net interest payments(c)
(a) Data have been revised in the 2012-13 Budget to improve accuracy and comparability through time. (b) Net debt is equal to the sum of deposits held, advances received, government securities, loans and other
borrowing, minus the sum of cash and deposits, advances paid and investments, loans and placements. (c) Net interest payments are equal to the difference between interest paid and interest receipts. (e) Estimates. (p) Projections.

10–9
Statement 10: Historical Australian Government Data
Tab
le 4
: A
ust
ralia
n G
ove
rnm
ent
gen
eral
go
vern
men
t se
cto
r re
ven
ue,
exp
ense
s, n
et c
apit
al in
vest
men
t an
d f
isca
l bal
ance
(a)
Pe
r ce
nt
Pe
r ce
nt
Per
ce
nt
Per
cen
t
$mof
GD
P$m
of
GD
P$m
of G
DP
$mof
GD
P
1996
-97
141,
688
25.4
145
,821
26.2
900
.0-4
,22
3-0
.819
97-9
814
6,82
024
.914
8,6
5225
.214
70
.0-1
,97
9-0
.319
98-9
915
2,10
624
.514
6,7
7223
.61
,433
0.2
3,90
10.
619
99-0
016
7,30
425
.315
5,5
5823
.5-6
90
.01
1,81
51.
820
00-0
118
6,11
026
.318
0,0
9425
.58
0.0
6,00
70.
820
01-0
219
0,48
825
.219
3,0
4125
.638
20
.1-2
,93
5-0
.420
02-0
320
6,92
325
.820
1,2
5925
.128
70
.05,
377
0.7
2003
-04
222,
168
25.8
215
,361
25.1
660
0.1
6,14
80.
720
04-0
524
2,50
726
.322
9,2
4524
.91
,034
0.1
12,
228
1.3
2005
-06
261,
238
26.3
242
,173
24.3
2,4
980
.31
6,56
81.
720
06-0
727
8,41
125
.725
9,1
5623
.92
,333
0.2
16,
922
1.6
2007
-08
303,
729
25.8
280
,107
23.8
2,5
930
.22
1,02
91.
820
08-0
929
8,93
323
.932
4,5
5725
.94
,064
0.3
-29,
688
-2.4
2009
-10
292,
767
22.6
340
,035
26.3
6,4
330
.5-5
3,70
1-4
.220
10-1
130
9,89
022
.135
6,1
0025
.45
,297
0.4
-51,
506
-3.7
2011
-12(
e)33
6,41
822
.837
3,6
7125
.34
,749
0.3
-42,
002
-2.8
2012
-13(
e)37
6,07
124
.237
6,2
7324
.3-2
,701
-0.2
2,50
00.
220
13-1
4(e)
402,
197
24.6
398
,503
24.4
1,0
480
.12,
646
0.2
2014
-15(
p)42
4,83
024
.741
6,4
4924
.21
,361
0.1
7,02
00.
420
15-1
6(p)
449,
559
24.8
439
,044
24.2
1,0
590
.19,
457
0.5
Rev
enu
eE
xpe
nses
Net
cap
ital i
nve
stm
ent
Fis
cal b
alan
ce(b
)
(a
) D
ata
have
bee
n re
vise
d in
the
2012
-13
Bud
get
to im
prov
e ac
cura
cy a
nd c
ompa
rabi
lity
thro
ugh
time.
(b
) F
isca
l bal
ance
is e
qual
to r
even
ue le
ss e
xpen
ses
less
net
cap
ital i
nves
tmen
t.
(e)
Est
imat
es.
(p)
Pro
ject
ions
.

Statement 10: Historical Australian Government Data
10–10
Table 5: Australian Government general government sector net worth and net financial worth(a)
Per cent Per cent
$m of GDP $m of GDP
1999-00 -7,046 -1.1 -68,178 -10.32000-01 -6,618 -0.9 -73,097 -10.32001-02 -11,655 -1.5 -79,012 -10.52002-03 -15,330 -1.9 -84,645 -10.62003-04 -1,152 -0.1 -74,159 -8.62004-05 14,556 1.6 -60,257 -6.52005-06 17,971 1.8 -63,440 -6.42006-07 46,351 4.3 -39,976 -3.72007-08 70,859 6.0 -18,070 -1.52008-09 19,427 1.6 -74,094 -5.92009-10 -45,938 -3.6 -147,168 -11.42010-11 -95,386 -6.8 -200,810 -14.32011-12(e) -141,769 -9.6 -251,297 -17.02012-13(e) -137,778 -8.9 -248,642 -16.02013-14(e) -132,798 -8.1 -244,263 -15.02014-15(p) -123,609 -7.2 -235,855 -13.72015-16(p) -111,771 -6.2 -225,781 -12.4
Net financial worth(c)Net worth(b)
(a) Data have been revised in the 2012-13 Budget to improve accuracy and comparability through time. (b) Net worth is equal to total assets less liabilities. (c) Net financial worth is equal to financial assets less liabilities. (e) Estimates. (p) Projections.

Statement 10: Historical Australian Government Data
10–11
Table 6: Australian Government general government sector accrual taxation revenue, non-taxation revenue and total revenue(a)
Per cent Per cent Per cent$m of GDP $m of GDP $m of GDP
1999-00 153,408 23.2 13,896 2.1 167,304 25.32000-01 175,881 24.9 10,228 1.4 186,110 26.32001-02 178,210 23.6 12,278 1.6 190,488 25.22002-03 195,203 24.4 11,720 1.5 206,923 25.82003-04 209,959 24.4 12,209 1.4 222,168 25.82004-05 229,943 25.0 12,564 1.4 242,507 26.32005-06 245,716 24.7 15,522 1.6 261,238 26.32006-07 262,511 24.2 15,900 1.5 278,411 25.72007-08 286,229 24.3 17,500 1.5 303,729 25.82008-09 278,653 22.3 20,280 1.6 298,933 23.92009-10 268,000 20.7 24,767 1.9 292,767 22.62010-11 289,005 20.6 20,885 1.5 309,890 22.12011-12(e) 316,454 21.4 19,964 1.4 336,418 22.82012-13(e) 354,626 22.9 21,445 1.4 376,071 24.22013-14(e) 380,727 23.3 21,470 1.3 402,197 24.62014-15(p) 403,278 23.4 21,552 1.3 424,830 24.72015-16(p) 427,160 23.5 22,400 1.2 449,559 24.8
Taxation revenue Non-taxation revenue Total revenue
(a) Data have been revised in the 2012-13 Budget to improve accuracy and comparability through time. (e) Estimates. (p) Projections.

10–12
Statement 10: Historical Australian Government Data
Tab
le 7
: A
ust
ralia
n G
ove
rnm
ent
cash
rec
eip
ts, p
aym
ents
an
d s
urp
lus
by
inst
itu
tio
nal
sec
tor
($m
)(a)
Und
erly
ing
cash
Und
erly
ing
cash
Rec
eipt
s(b)
Pay
men
ts(c
)ba
lanc
e(d)
Rec
eipt
s(b)
Pay
men
ts(c
)C
ash
surp
lus(
d)R
ecei
pts(
b)P
aym
ents
(c)
bala
nce(
d)
1988
-89
90,7
4885
,326
5,42
14,
177
6,03
525
793
,923
90,3
125,
678
1989
-90
98,6
2592
,684
5,94
23,
926
11,3
22-5
,261
101,
495
102,
883
681
1990
-91
100,
227
100,
665
-438
4,80
49,
351
-2,1
3910
3,83
710
8,80
8-2
,577
1991
-92
95,8
4010
8,47
2-1
2,63
13,
899
7,71
310
197
,937
114,
369
-12,
530
1992
-93
97,6
3311
5,75
1-1
8,11
84,
385
7,81
9-1
9610
0,51
212
2,04
2-1
8,31
419
93-9
410
3,82
412
2,00
9-1
8,18
55,
178
6,47
61,
482
106,
747
126,
214
-16,
703
1994
-95
113,
458
127,
619
-14,
160
5,26
27,
318
1,95
611
6,75
113
2,96
5-1
2,20
419
95-9
612
4,42
913
5,53
8-1
1,10
94,
927
8,19
0-5
2712
6,59
314
0,96
3-1
1,63
619
96-9
713
3,59
213
9,68
9-6
,099
4,78
27,
373
473
135,
259
143,
948
-5,6
2619
97-9
814
0,73
614
0,58
714
96,
238
7,92
31,
119
144,
517
145,
985
1,26
819
98-9
915
2,06
314
8,17
53,
889
nana
-353
nana
3,53
619
99-0
016
6,19
915
3,19
213
,007
nana
-2,5
94na
na10
,413
2000
-01
182,
996
177,
123
5,87
2na
na39
1na
na6,
264
2001
-02
187,
588
188,
655
-1,0
67na
na1,
210
nana
143
2002
-03
204,
613
197,
243
7,37
027
,386
26,1
051,
280
nana
8,65
020
03-0
421
7,77
520
9,78
57,
990
27,7
1826
,142
1,57
523
8,23
622
7,09
99,
564
2004
-05
235,
984
222,
407
13,5
7729
,621
28,0
711,
550
257,
946
241,
577
15,1
2820
05-0
625
5,94
324
0,13
615
,756
30,8
7531
,874
-999
278,
254
263,
445
14,7
5820
06-0
727
2,63
725
3,32
117
,182
16,8
8218
,641
-1,7
5928
5,33
626
7,77
815
,423
2007
-08
294,
917
271,
843
19,7
047,
758
8,23
2-4
7330
0,50
327
7,90
319
,231
2008
-09
292,
600
316,
046
-27,
079
7,98
78,
960
-973
297,
421
321,
841
-28,
052
2009
-10
284,
662
336,
900
-54,
750
8,41
99,
341
-922
290,
681
343,
841
-55,
672
2010
-11
302,
024
346,
102
-47,
746
8,55
89,
733
-1,1
7530
8,25
835
3,51
1-4
8,92
020
11-1
2(e)
329,
976
371,
337
-44,
402
9,27
012
,446
-3,1
7633
6,72
638
1,26
4-4
7,57
820
12-1
3(e)
368,
774
364,
209
1,53
69,
240
14,6
10-5
,370
375,
511
376,
316
-3,8
3520
13-1
4(e)
392,
544
387,
299
2,04
4na
nana
nana
na20
14-1
5(p)
413,
618
404,
892
5,31
8na
nana
nana
na20
15-1
6(p)
438,
373
427,
251
7,46
9na
nana
nana
na
Gen
eral
gov
ernm
ent
Pub
lic n
on-f
inan
cial
cor
pora
tions
N
on-f
inan
cial
pub
lic s
ecto
r
(a
) D
ata
have
bee
n re
vise
d in
the
2012
-13
Bud
get t
o im
prov
e ac
cura
cy a
nd c
ompa
rabi
lity
thro
ugh
time.
(b
) R
ecei
pts
are
equa
l to
rece
ipts
from
ope
ratin
g ac
tiviti
es a
nd s
ales
of
non-
finan
cial
ass
ets.
(c
) P
aym
ents
are
equ
al t
o pa
ymen
ts f
or o
pera
ting
activ
ities
, pur
chas
es o
f non
-fin
anci
al a
sset
s an
d ne
t acq
uisi
tion
of a
sset
s un
der
finan
ce le
ases
. (d
) T
hese
item
s ex
clud
e F
utur
e F
und
earn
ings
fro
m 2
005-
06 o
nwar
ds.
Fut
ure
Fun
d ea
rnin
gs a
re s
how
n in
Tab
le 1
. (e
) E
stim
ates
. (p
) P
roje
ctio
ns.
na
Dat
a no
t av
aila
ble.

10–13
Statement 10: Historical Australian Government Data
Tab
le 8
: A
ust
ralia
n G
ove
rnm
ent
accr
ual
rev
enu
e, e
xpen
ses
and
fis
cal b
alan
ce b
y in
stit
uti
on
al s
ecto
r ($
m)(a
)
Fis
cal
Fis
cal
Fis
cal
Rev
enu
eE
xpen
ses
bala
nce
(b)
Rev
enu
eE
xpen
ses
bala
nce
(b)
Rev
enue
Exp
ense
sba
lanc
e(b
)
1996
-97
141
,688
145,
821
-4,2
2327
,431
26,0
15-3
31na
na-4
,554
1997
-98
146
,820
148,
652
-1,9
7929
,618
26,9
992,
360
nana
387
1998
-99
152
,106
146,
772
3,9
0127
,687
26,0
88-8
161
75,8
9116
8,9
633,
080
1999
-00
167
,304
155,
558
11,8
1525
,485
23,5
421,
062
188
,841
173,
889
12,9
8320
00-0
118
6,1
1018
0,0
946,
007
25,8
6924
,762
-826
207
,372
200,
184
5,2
4820
01-0
219
0,4
8819
3,0
41-2
,935
26,6
3825
,341
793
212
,518
213,
693
-2,0
6020
02-0
320
6,9
2320
1,2
595,
377
24,3
3922
,916
1,97
52
26,1
3521
9,1
297,
314
2003
-04
222
,168
215,
361
6,1
4825
,449
23,4
442,
143
241
,873
233,
077
8,2
7520
04-0
524
2,5
0722
9,2
4512
,228
26,9
6525
,191
1,47
32
63,5
8724
8,5
4913
,703
2005
-06
261
,238
242,
173
16,5
6828
,143
29,5
31-2
,442
282
,597
264,
923
14,1
2120
06-0
727
8,4
1125
9,1
5616
,922
15,4
4316
,360
-1,7
632
90,0
6727
1,7
3515
,153
2007
-08
303
,729
280,
107
21,0
296,
854
6,68
6-5
843
09,2
1528
5,4
2620
,443
2008
-09
298
,933
324,
557
-29,
688
6,99
87,
576
-1,4
953
03,7
3332
9,9
48-3
1,1
9520
09-1
029
2,7
6734
0,0
35-5
3,7
017,
288
7,29
7-1
,079
298
,412
344,
893
-53,
985
2010
-11
309
,890
356,
100
-51,
506
7,56
37,
787
-1,4
463
15,6
8836
2,1
22-5
2,9
5220
11-1
2(e)
336
,418
373,
671
-42,
002
7,99
78,
374
-3,4
073
42,8
9738
0,5
27-4
5,4
0820
12-1
3(e)
376
,071
376,
273
2,5
007,
984
9,17
9-5
,679
382
,535
383,
931
-3,1
7920
13-1
4(e)
402
,197
398,
503
2,6
46na
nana
nana
na20
14-1
5(p)
424
,830
416,
449
7,0
20na
nana
nana
na20
15-1
6(p)
449
,559
439,
044
9,4
57na
nana
nana
na
Gen
eral
gov
ern
me
nt
Pub
lic n
on-
finan
cia
l cor
por
atio
ns
Non
-fin
anci
al p
ubl
ic s
ecto
r
(a
) D
ata
ha
ve b
een
revi
sed
in th
e 2
012-
13
Bu
dge
t to
impr
ove
acc
ura
cy a
nd c
om
pa
rabi
lity
thro
ug
h tim
e.
(b)
Fis
cal b
ala
nce
is e
qua
l to
re
ven
ue le
ss e
xpe
nses
less
net
ca
pita
l in
vest
me
nt.
Ne
t cap
ital i
nve
stm
en
t is
not s
ho
wn
in th
is ta
ble
. (e
) E
stim
ate
s.
(p)
Pro
ject
ions
. n
a D
ata
no
t ava
ilab
le.
