budget strategy and outlook 2016-17 · 2016‑17 budget table 1.1 highlights the key fiscal...
TRANSCRIPT

Budget Strategy and Outlook 2016-17
Budget Paper No. 2


1
ContentsUnder Treasurer’s Certification 3
1 Overview 5
2 Fiscal Outlook and Strategy 9
3 Risks and Contingent Liabilities 23
4 Budget Initiatives 31
5 Intergovernmental Financial Relations Issues 37
6 Territory Taxes and Royalties 55
7 The Territory Economy 71
8 Uniform Presentation Framework 79
Appendices 99
Appendix A: Classification of Entities in the Northern Territory 101
Appendix B: Glossary 102
In this book, the term ‘state’ or ‘states’ includes the Australian Capital Territory and the Northern Territory, unless the context indicates otherwise.

2
2016-17 Budget

3
Under Treasurer’s CertificationIn accordance with provisions of the Fiscal Integrity and Transparency Act, I certify that the financial projections included in the May 2016 Budget documentation were based on Government decisions that I was aware of or that were made available to me by the Treasurer before 19 May 2016. The projections presented are in accordance with the Uniform Presentation Framework.
Jodie Ryan Under Treasurer
20 May 2016

4
2016-17 Budget

Overview 5
Budget Strategy and Outlook
Chapter 1Overview
Budget Paper No. 2 presents whole of government financial information and related issues, and consolidates information from other Budget papers. It also meets the requirements of the Fiscal Integrity and Transparency Act and complies with the Uniform Presentation Framework, as agreed by all Australian jurisdictions.
Fiscal OutlookThe 2016‑17 Budget has been influenced by a challenging fiscal and economic environment with the Territory faced with a reduced GST revenue share, lower taxation revenue, and a moderation in economic growth from record high levels.
In response to these challenges, the 2016‑17 Budget focuses on stimulating the Territory economy while maintaining Government’s commitment to the fiscal strategy of returning the Budget to a balanced position. However, the effect of reduced revenues and spending decisions aimed at stimulating the Territory economy has resulted in a delay in a return to surplus by two years, from 2017‑18 until 2019‑20.
These factors have resulted in increased fiscal deficits across the Budget and forward years when compared to the April 2015 Budget, with a projected deficit of $794 million in 2016‑17, reducing over the budget cycle to a small fiscal balance surplus of $12 million in 2019‑20.
In addition to the changes to the fiscal balance projections, net debt has also been influenced by the long‑term lease of the Port of Darwin, finalised on 16 November 2015. This is evident in 2015‑16 where net debt has improved by $670 million, to only $1.97 billion, when compared to the $2.64 billion estimated in April 2015. However from 2017‑18 net debt is higher than previously projected with an estimate of $3.1 billion by 2019‑20.
Against this backdrop the updated fiscal projections in the 2016‑17 Budget include:
•a general government operating surplus of $242 million and $70 million in 2015‑16 and 2016‑17 respectively, with operating deficits projected for both 2017‑18 and 2018‑19 before returning to a surplus of $23 million in 2019‑20;
•fiscal deficits for the non financial public sector forecast in 2015‑16 through to 2018‑19 before returning to surplus in 2019‑20;
•substantial infrastructure investment in 2016‑17 of $1.7 billion;
• improvements to net debt in 2015‑16 but increasing from 2016‑17 to 2018‑19; and
•a net debt to revenue ratio while increasing, remaining significantly below the fiscal strategy target of 60 per cent in all years, with 46 per cent projected in 2019‑20.
Table 1.1: Key Fiscal Indicators and Aggregates
2015‑16 2016‑17 2017‑18 2018‑19 2019‑20 Estimate Budget Forward Estimate
$M $M $M $M $M
Net operating balance – GGS 242 70 ‑ 19 ‑ 56 23Fiscal balance – NFPS ‑ 153 ‑ 794 ‑ 413 ‑ 148 12Net debt – NFPS 1 971 2 707 3 048 3 137 3 101
Net debt to revenue – NFPS (%) 29 41 47 49 46
GGS: general government sector; NFPS: non financial public sectorSource: Department of Treasury and Finance
6 Overview
2016-17 Budget
Table 1.1 highlights the key fiscal aggregates for the general government sector and the non financial public sector, for the 2016‑17 Budget.
Further information on the comparison between the estimates contained in the 2016‑17 Budget and those projected at the time of the April 2015 Budget is provided in Chapter 2.
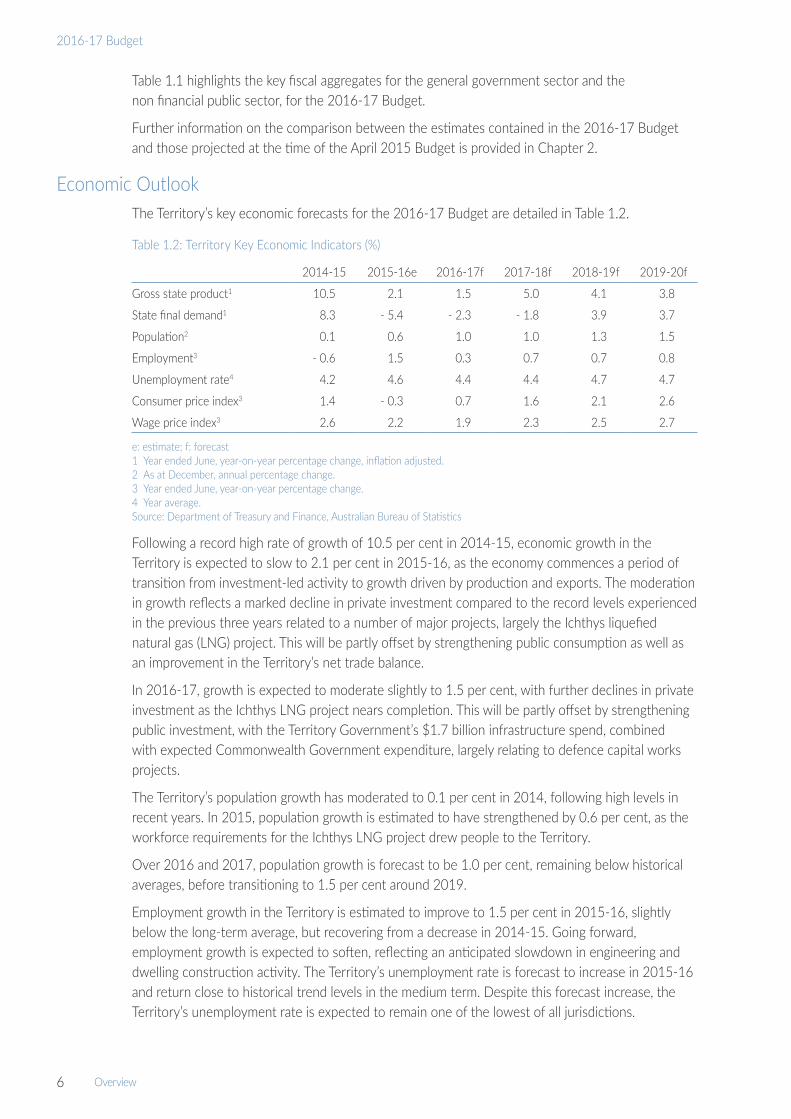
Economic Outlook The Territory’s key economic forecasts for the 2016‑17 Budget are detailed in Table 1.2.
Table 1.2: Territory Key Economic Indicators (%)
2014‑15 2015‑16e 2016‑17f 2017‑18f 2018‑19f 2019‑20f
Gross state product1 10.5 2.1 1.5 5.0 4.1 3.8
State final demand1 8.3 ‑ 5.4 ‑ 2.3 ‑ 1.8 3.9 3.7
Population2 0.1 0.6 1.0 1.0 1.3 1.5
Employment3 ‑ 0.6 1.5 0.3 0.7 0.7 0.8
Unemployment rate4 4.2 4.6 4.4 4.4 4.7 4.7
Consumer price index3 1.4 ‑ 0.3 0.7 1.6 2.1 2.6
Wage price index3 2.6 2.2 1.9 2.3 2.5 2.7
e: estimate; f: forecast1 Year ended June, year‑on‑year percentage change, inflation adjusted.2 As at December, annual percentage change.3 Year ended June, year‑on‑year percentage change.4 Year average.Source: Department of Treasury and Finance, Australian Bureau of Statistics
Following a record high rate of growth of 10.5 per cent in 2014‑15, economic growth in the Territory is expected to slow to 2.1 per cent in 2015‑16, as the economy commences a period of transition from investment‑led activity to growth driven by production and exports. The moderation in growth reflects a marked decline in private investment compared to the record levels experienced in the previous three years related to a number of major projects, largely the Ichthys liquefied natural gas (LNG) project. This will be partly offset by strengthening public consumption as well as an improvement in the Territory’s net trade balance.
In 2016‑17, growth is expected to moderate slightly to 1.5 per cent, with further declines in private investment as the Ichthys LNG project nears completion. This will be partly offset by strengthening public investment, with the Territory Government’s $1.7 billion infrastructure spend, combined with expected Commonwealth Government expenditure, largely relating to defence capital works projects.
The Territory’s population growth has moderated to 0.1 per cent in 2014, following high levels in recent years. In 2015, population growth is estimated to have strengthened by 0.6 per cent, as the workforce requirements for the Ichthys LNG project drew people to the Territory.
Over 2016 and 2017, population growth is forecast to be 1.0 per cent, remaining below historical averages, before transitioning to 1.5 per cent around 2019.
Employment growth in the Territory is estimated to improve to 1.5 per cent in 2015‑16, slightly below the long‑term average, but recovering from a decrease in 2014‑15. Going forward, employment growth is expected to soften, reflecting an anticipated slowdown in engineering and dwelling construction activity. The Territory’s unemployment rate is forecast to increase in 2015‑16 and return close to historical trend levels in the medium term. Despite this forecast increase, the Territory’s unemployment rate is expected to remain one of the lowest of all jurisdictions.

Overview 7
Budget Strategy and Outlook
The Darwin consumer price index (CPI) is estimated to contract by 0.3 per cent in 2015‑16, before a modest return to growth in 2016‑17 and 2017‑18. The forecast change in the Darwin CPI reflects the effect of moderate population and employment growth, along with lower input and labour costs, and the continuing effect of lower fuel prices, electricity prices and housing costs, particularly lower rents. The Darwin CPI is forecast to return towards long‑term trend growth beyond 2019‑20.
Wage growth in the Territory is expected to moderate to 2.2 per cent in 2015‑16, and remain subdued over the medium term, following the forecast slowdown in employment growth and the moderation in CPI.
Despite facing a range of challenges following sustained periods of record growth, the Territory is well positioned to take advantage of a number of opportunities likely to re‑shape the structure of the Territory economy throughout the forecast period and the next decade.
The Territory’s position as a gateway to Asia, key defence hub, world renowned tourist attractions and a rich diversity of mineral, gas, petroleum and agricultural resources all provide the strategic opportunities to underpin future growth. These strategic advantages also provide opportunities for growth in service industries such as health, education and research.

8
2016-17 Budget

Fiscal Outlook and Strategy 9
Budget Strategy and Outlook
Chapter 2 Fiscal Outlook and StrategyOverview
The information provided in this chapter meets the requirement under section 10(1)(a) of the Fiscal Integrity and Transparency Act (FITA) for each fiscal outlook report to contain updated financial projections for the budget year and the following three financial years for the general government and non financial public sectors. It also complies with section 2(2) of FITA, which requires the public release of a fiscal strategy statement, including an assessment of the Government’s adherence to its fiscal strategy targets.
The full set of financial statements are presented in Chapter 8, with this chapter providing:
•a comparison of the projections in the 2016‑17 Budget, with those provided in the April 2015‑16 Budget and the 2015‑16 Mid‑Year Report;
•a discussion of the forward estimates; and
•an assessment of projections against the fiscal strategy targets.
As outlined in Chapter 1, the updated financial projections have been significantly influenced by recent reductions in revenue estimates, largely a reduced GST revenue share together with lower stamp duty and mining royalty collections, reflecting moderation in the property market and the mining sectors. The effect of these reductions, combined with spending decisions aimed at stimulating the Territory economy, has resulted in a delay in the return to a surplus position until 2019‑20. It has also resulted in the projected outcomes in the Budget and forward estimates worsening from those estimated at the time of the 2015‑16 Budget and the 2015‑16 Mid‑Year Report.
General Government Sector Net Operating BalanceTable 2.1 highlights the movements in the general government operating balance and compares the updated projections with those published at the time of the 2015‑16 Budget (April 2015) and the 2015‑16 Mid‑Year Report (December 2015).
Table 2.1: General Government Sector – Net Operating Balance
2015‑16 2016‑17 2017‑18 2018‑19 2019‑20
Estimate Budget Forward Estimate
$M $M $M $M $M
2015‑16 Budget 227 233 187 78 n.a.
2015‑16 Mid‑Year Report 248 232 160 49 n.a.
2016‑17 Budget 242 70 ‑ 19 ‑ 56 23
Variation from 2015‑16 Budget 15 ‑ 163 ‑ 206 ‑ 134 n.a.
n.a.: not available at the time of publishing the 2015‑16 Budget and 2015‑16 Mid‑Year ReportSource: Department of Treasury and Finance
As shown in Table 2.1, a general government operating surplus of $242 million is estimated for 2015‑16, a $15 million improvement on the $227 million surplus projected at the time of the April 2015 Budget.
From 2016‑17 the substantial reductions in revenue estimates have put growing pressure on the Territory’s Budget. As a result, from 2016‑17, the operating balance is worse in all years than

10 Fiscal Outlook and Strategy
2016-17 Budget
projected in the 2015 Budget, with operating deficits now forecast in 2017‑18 and 2018‑19 before returning to surplus in 2019‑20, reflecting the realignment of expenditure requirements to estimated revenue projections.
GST revenue, which remains the Territory’s largest revenue source, has been significantly reduced since the last Budget. The Territory’s GST revenue is expected to be $145 million lower in 2016‑17 than estimated in the 2015 Budget, largely due to a downward revision to the GST relativity. The lower relativity, as recommended by the Commonwealth Grants Commission (CGC), is mainly due to three factors:
•a decline in the Territory’s population growth, which reduced its share of the national population and resulted in the CGC assessing the Territory as needing to spend less on new infrastructure;
•above average growth in the Territory’s assessed capacity to collect payroll tax; and
•a decline nationally in the use of community health services in remote areas, combined with an increase in non‑state sector provision of these services in the Territory, which reduced the Territory’s assessed expenditure needs.
The reduction in GST revenue flows through to all forward estimate years, being an average of $188 million per annum, and results in minimal growth in the Territory’s GST revenue between 2015‑16 and 2017‑18.
The lower stamp duty and royalty revenues are not as high as the GST reduction, however they still represent an average annual reduction of $72 million ongoing from the Budget year and therefore result in less available capacity to meet ongoing expenditure needs. The stamp duty reduction is due to a softening in the property market that resulted in both lower volumes of transactions and slightly lower values. The introduction of the First Home Owner Discount on established homes has also reduced revenue estimates in 2016‑17 by a further $5.5 million. The reduced royalty estimates are based on the advice of royalty payers and are due to a decline in both the demand for, and prices of, commodities.
In addition to reduced revenues, there have been some increases to expenditure across the forward estimates when compared to the 2015‑16 Budget. The increases are the result of new Government decisions aimed at stimulating the economy, together with higher demand for government services, partially offset by further efficiency measures. Policy decisions of government are explained later in this chapter and in more detail in Chapter 4: Budget Initiatives.
Non Financial Public Sector Fiscal BalanceThe general government sector excludes public non financial corporations, such as the Power and Water Corporation, Territory Generation and Jacana Energy. Therefore the fiscal balance measure is assessed at the non financial public sector to ensure the financial performance of these entities is reflected in Government’s fiscal targets and outcomes.
Table 2.2 Non Financial Public Sector – Fiscal Balance
2015‑16 2016‑17 2017‑18 2018‑19 2019‑20Estimate Budget Forward Estimate
$M $M $M $M $M2015‑16 Budget ‑ 285 ‑ 174 9 35 n.a.2015‑16 Mid‑Year Report ‑ 274 ‑ 211 ‑ 27 ‑ 1 n.a.2016‑17 Budget ‑ 153 ‑ 794 ‑ 413 ‑ 148 12Variation from 2015‑16 Budget 132 ‑ 620 ‑ 422 ‑ 183 n.a.
n.a.: not available at the time of publishing the 2015‑16 Budget and 2015‑16 Mid‑Year ReportSource: Department of Treasury and Finance

Fiscal Outlook and Strategy 11
Budget Strategy and Outlook
As shown in Table 2.2, the fiscal balance, which includes net investment in capital spending, is now projected to be a $153 million deficit in 2015‑16, an improvement of $132 million when compared to the original 2015 Budget. The improved outcome in 2015‑16 is largely due to the transfer of capital expenditure, from 2015‑16 into 2016‑17, for Remote Indigenous Housing and various road programs.
However the transfer has contributed to an increase in the deficit for 2016‑17, with significant deficits now projected from 2016‑17 through to 2018‑19. For 2016‑17 the fiscal deficit is $794 million but forecast to reduce over the forward estimates to a small surplus of $12 million in 2019‑20.
The increased deficits in 2016‑17 and 2017‑18 incorporate the changes affecting the lower operating results, together with Government’s intention to stimulate the economy and protect jobs by increasing infrastructure investment across the Territory. This includes the reinvestment of the Port of Darwin lease proceeds as well as the continued investment in Building the Territory projects funded from the TIO sale proceeds.
As foreshadowed in the 2015 Mid‑Year Report, the long‑term lease of the Port of Darwin was finalised on 16 November 2015. The Port of Darwin lease was primarily aimed at securing the future growth of the Port and the Territory economy more broadly. However, the $506 million lease proceeds has also provided an opportunity to reinvest $431 million of the proceeds into immediate and longer term stimulus packages for the benefit of the Territory, with the remaining $75 million being used to reduce the Territory’s debt position.
Part of the $431 million reinvestment includes a further $100 million, in addition to the $200 million previously set aside, in the Northern Territory Infrastructure Development Fund (NTIDF). The intention is that the $300 million investment from the Territory will enable the attraction of a further $1.2 billion from private sector investors, both nationally and internationally. The $1.5 billion NTIDF will potentially generate up to $4.5 billion of infrastructure investment, largely within the Territory.
Overall, while the Territory Government achieved a fiscal balance surplus in 2014‑15, the recent reductions in revenue estimates has meant it is unreasonable for the government to continue to target a further fiscal surplus in 2017‑18 at the expense of protecting jobs and maintaining investment activity in the Territory economy. As a result the target of eliminating the fiscal balance deficit has been delayed by two years to 2019‑20.
12 Fiscal Outlook and Strategy
2016-17 Budget
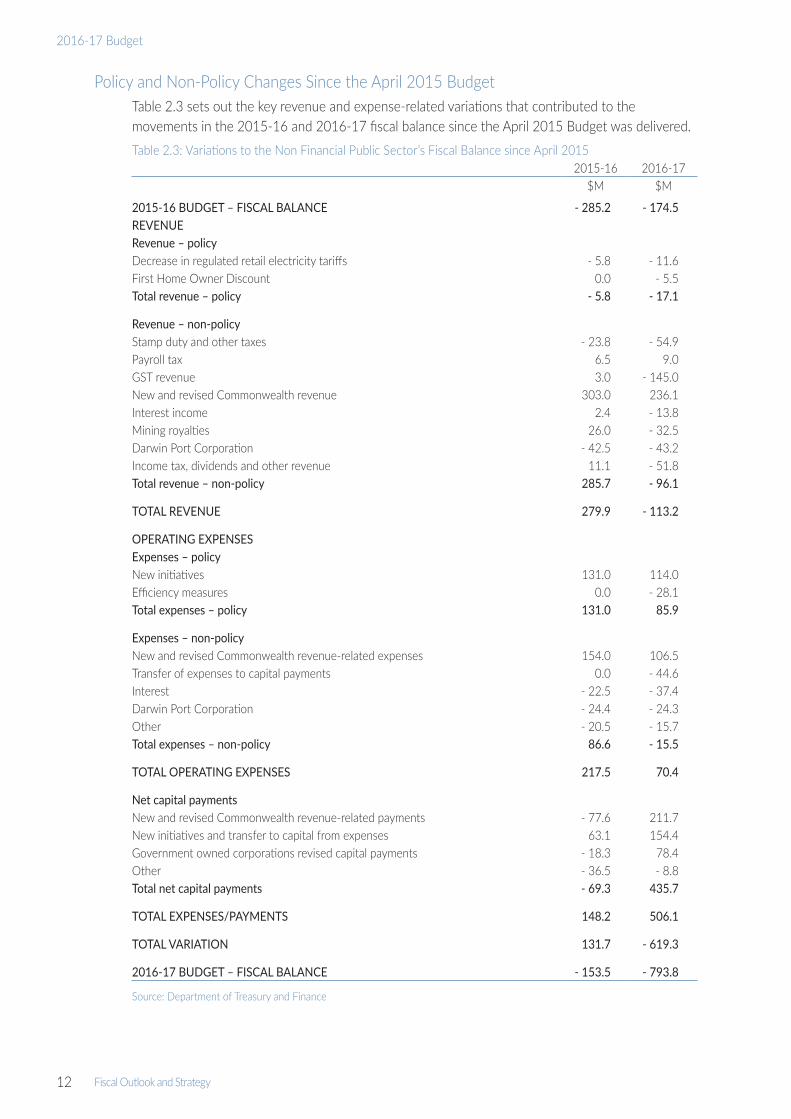
Policy and Non‑Policy Changes Since the April 2015 BudgetTable 2.3 sets out the key revenue and expense‑related variations that contributed to the movements in the 2015‑16 and 2016‑17 fiscal balance since the April 2015 Budget was delivered.Table 2.3: Variations to the Non Financial Public Sector’s Fiscal Balance since April 2015
2015‑16 2016‑17$M $M
2015‑16 BUDGET – FISCAL BALANCE ‑ 285.2 ‑ 174.5REVENUERevenue – policyDecrease in regulated retail electricity tariffs ‑ 5.8 ‑ 11.6First Home Owner Discount 0.0 ‑ 5.5Total revenue – policy ‑ 5.8 ‑ 17.1
Revenue – non‑policyStamp duty and other taxes ‑ 23.8 ‑ 54.9Payroll tax 6.5 9.0GST revenue 3.0 ‑ 145.0New and revised Commonwealth revenue 303.0 236.1Interest income 2.4 ‑ 13.8Mining royalties 26.0 ‑ 32.5Darwin Port Corporation ‑ 42.5 ‑ 43.2Income tax, dividends and other revenue 11.1 ‑ 51.8Total revenue – non‑policy 285.7 ‑ 96.1
TOTAL REVENUE 279.9 ‑ 113.2
OPERATING EXPENSESExpenses – policyNew initiatives 131.0 114.0Efficiency measures 0.0 ‑ 28.1Total expenses – policy 131.0 85.9
Expenses – non‑policyNew and revised Commonwealth revenue‑related expenses 154.0 106.5Transfer of expenses to capital payments 0.0 ‑ 44.6Interest ‑ 22.5 ‑ 37.4Darwin Port Corporation ‑ 24.4 ‑ 24.3Other ‑ 20.5 ‑ 15.7Total expenses – non‑policy 86.6 ‑ 15.5
TOTAL OPERATING EXPENSES 217.5 70.4
Net capital paymentsNew and revised Commonwealth revenue‑related payments ‑ 77.6 211.7New initiatives and transfer to capital from expenses 63.1 154.4Government owned corporations revised capital payments ‑ 18.3 78.4Other ‑ 36.5 ‑ 8.8Total net capital payments ‑ 69.3 435.7
TOTAL EXPENSES/PAYMENTS 148.2 506.1
TOTAL VARIATION 131.7 ‑ 619.3
2016‑17 BUDGET – FISCAL BALANCE ‑ 153.5 ‑ 793.8
Source: Department of Treasury and Finance

Fiscal Outlook and Strategy 13
Budget Strategy and Outlook
In total, the policy and non‑policy changes present a net fiscal balance improvement of $131.7 million in 2015‑16 and a worsening of $619.3 million in 2016‑17. The key policy and non‑policy changes are discussed in further detail below.
Revenue Changes Non financial public sector revenue is expected to increase by $279.9 million in 2015‑16, but decrease by $113.2 million in 2016‑17. The revenue‑related policy changes since the April 2015 Budget are:
•a reduction of $5.8 million in 2015‑16 and $11.6 million ongoing from 2016‑17 for the 5 per cent cut in regulated retail electricity tariffs introduced on 1 January 2016; and
•a reduction of $5.5 million in stamp duty receipts in 2016‑17 related to the First Home Owner Discount of up to $10 000 on the purchase of an established home.
The non‑policy revenue‑related variations since the 2015‑16 Budget result in an increase of $285.7 million in 2015‑16 and a reduction of $96.1 million in 2016‑17. The main changes are:
•a decrease in stamp duty and other taxes of $23.8 million in 2015‑16 and $54.9 million in 2016‑17, largely due to reduced volumes and values of property transactions reflecting a softening in the Territory’s property market;
•an increase in payroll tax of $6.5 million in 2015‑16 and $9 million in 2016‑17 due to growth in both employment and wages during 2015‑16, particularly among the larger employers making up the Territory’s payroll tax base;
•GST revenue is projected to marginally increase by $3 million in 2015‑16 related to growth in collections. For 2016‑17, the estimated revenue has been substantially reduced by $145 million reflecting the 5.1 per cent decrease in the Territory’s GST relativity and a lower share of the national population than projected last year, partially offset by the an upward revision in estimated GST revenue collections. The 2016‑17 decrease flows through to all forward years;
•an increase in tied funding from the Commonwealth in the form of specific purpose payments (SPPs) and national partnership (NP) agreements of $303 million in 2015‑16 and $236.1 million in 2016‑17, largely related to Indigenous essential services, health, education, police and roads. The key variations include:
− $145.2 million in 2015‑16 to bring forward funding for municipal and essential services from future years ($134 million) and the Indigenous Housing Healthy Homes program ($11.2 million) as part of the NP on Remote Aboriginal Investment (formerly Stronger Futures) in the Northern Territory;
− $16.6 million in 2015‑16 for remote projects including, remote infrastructure, land administration and transitional accommodation facilities;
− $45.3 million in 2015‑16 and $34.8 million in 2016‑17 for various roads programs;
− $27.4 million in 2016‑17 as part of the Commonwealth’s Asset Recycling Initiative;
− $22.3 million in 2016‑17 under the National Disaster Relief arrangements for expenditure incurred as a result of cyclones Lam and Nathan;
− $21.9 million in each of 2015‑16 and 2016‑17 for the Indigenous Head Deed agreement, which includes funding for primary health care, child and maternal health and chronic disease;
− $24.7 million in 2015‑16 and $13.5 million in 2016‑17 under the National Health Reform agreement;

14 Fiscal Outlook and Strategy
2016-17 Budget
− revised timing of health infrastructure funding, as agreed with the Commonwealth, for the Palmerston Regional Hospital, remote health centres and regional hospitals resulting in a reduction of $27 million in 2015‑16 and an increase of $47.3 million in 2016‑17;
− $8.4 million in 2015‑16 and $6.1 million in 2016‑17 to the Department of Education as part of the Students First agreement;
− $7.3 million in 2015‑16 and $16.9 million in 2016‑17 for the Wadeye multipurpose police station; and
− $4.3 million in 2015‑16 and $7.2 million in 2016‑17 under the NP for Legal Assistance Services.
•additional interest income of $2.4 million in 2015‑16, with a reduction of $13.8 million in 2016‑17 reflecting lower than expected returns on cash balances, investments and securities in line with market conditions;
• increased mining royalties of $26 million in 2015‑16, based on receipts received to date. However, the 2016‑17 estimates have been revised downwards by $32.5 million, based on the latest advice by royalty payers, consistent with the moderation in the mining sector, with the reduction flowing through to all forward years;
•a reduction of $42.5 million in 2015‑16 and $43.2 million in 2016‑17 as a result of the finalisation of the long‑term lease of the Port of Darwin and the subsequent wind‑up of the Darwin Port Corporation; and
•an increase in income tax, dividends and other revenue of $11.1 million in 2015‑16 and a reduction of $51.8 million in 2016‑17 resulting from the realignment of agency and other trading entities’ revenues and returns to government in line with performance.
Expense ChangesNon financial public sector operating expenses are projected to increase by $217.5 million in 2015‑16 and $70.4 million in 2016‑17.
In regards to policy‑related expense variations, new and expanded initiatives total $131 million and $114 million in 2015‑16 and 2016‑17, respectively. In 2016‑17 the new and expanded initiatives, some of which are one‑off, are partially offset by an increase in efficiency measures of $28.1 million.
The main new and expanded initiatives for 2015‑16 and 2016‑17 include:
•$42 million in 2015‑16 and $5 million in 2016‑17 as part of the $100 million Boosting our Economy stimulus package for a range of sporting, tourism, education, disability and transport infrastructure grants and minor upgrades, with the remaining $53 million being capital spending;
•$20 million in 2016‑17 for the Home Incentive Scheme for home owner‑occupiers to undertake minor improvements and or repairs and maintenance on their homes, utilising Territory small businesses;
•$21.2 million in 2016‑17 to support the construction of a Catholic primary school in Zuccoli;
•$20 million in 2015‑16 and $12.2 million in 2016‑17 to address increased demand in the adult and youth custodial system;
•$10 million ongoing, from 2015‑16, to support children in out of home care;
•$6.5 million in 2015‑16 and $21.3 million in 2016‑17 for remote infrastructure projects in Elliott and Arlparra;
•$8 million in 2016‑17 to boost tourism marketing in the Territory;

Fiscal Outlook and Strategy 15
Budget Strategy and Outlook
•$5 million contribution in 2015‑16 to redevelop the pool at the Parap Leisure and Sports Centre;
•$5 million in 2016‑17 to support the Menzies School of Health Research;
•$4.9 million in 2016‑17 for cardiothoracic and neurosurgical services in Darwin; and
•$8 million in 2015‑16 to for the Office of Major Projects, Infrastructure and Investment to continue to promote and attract investment to the Territory.
Further information on the policy initiatives in the Budget can be found in Chapter 4 of this Budget Paper.
The non‑policy expense variations increase by $86.6 million in 2015‑16, but decrease by $15.5 million in 2016‑17, with the following as the largest contributors:
•additional expenditure related to tied Commonwealth revenue variations described above, with $154 million in 2015‑16 and $106.5 million in 2016‑17;
•transfers of expenses to capital payments totalling $44.6 million in 2016‑17;
• lower interest expenses of $22.5 million in 2015‑16 and $37.4 million in 2016‑17, reflecting the improved 2014‑15 outcome and the Government’s revised borrowing program; and
•a reduction of $24.4 million in 2015‑16 and $24.3 million in 2016‑17 as a result of the finalisation of the long‑term lease of the Port of Darwin and the subsequent wind‑up of the Darwin Port Corporation.
Net Capital PaymentsThere have also been variations to net capital spending resulting in a reduction of $69.3 million in 2015‑16 and an increase of $435.7 million in 2016‑17 due to:
•variations associated with Commonwealth‑related payments including transfers between years resulting in a reduction of $77.6 million in 2015‑16 and an increase of $211.7 million in 2016‑17, mainly due to the revised timing of the Remote Housing NP, roads and health infrastructure projects;
•Additional capital funding of $63.1 million in 2015‑16 and $154.4 million in 2016‑17, with key variations including:
− $30 million in 2016‑17, including $20 million for skywalk adventure experiences in Territory parks and $10 million for the Arnhem Link and Maryvale roads, funded by the Port of Darwin lease proceeds;
− $53 million in 2015‑16 as part of the $100 million Boosting our Economy stimulus package for a range of education infrastructure projects;
− $49.3 million in 2016‑17 for Health’s Core Clinical System Renewal Program;
− $30 million in 2016‑17 for furniture, fittings and equipment, and information and communications technology (ICT) hardware and systems for the Palmerston Regional Hospital; and
− $20.2 million in 2016‑17 to support the implementation of the five‑year Housing Strategy, which includes the construction of around 270 new public housing dwellings.
•revised timing of capital programs within the Territory’s government owned corporations, resulting in an $18.3 million decrease in 2015‑16 and a $78.4 million increase in 2016‑17; and
•variations in other assets associated with revised land sales and movement in inventories, resulting in a reduction of $36.5 million in 2015‑16 and $8.8 million in 2016‑17.

16 Fiscal Outlook and Strategy
2016-17 Budget
2016‑17 Budget and 2017‑18 to 2019‑20 Forward Estimates Basis of Forward Estimates
In accordance with FITA, five years of estimates are maintained and used by Government, both as a policy and an operational tool. The Budget and Forward Estimates provides the framework within which agencies plan, and also forms the basis for the Government’s fiscal strategy.
Agency forward estimates vary in line with the application of parameters (inflators and deflators) to the Budget year on a no‑policy‑change basis. New policy and funding decisions linked to demand or cost growth also add to each agency’s budget and forward estimates. The main parameters used to adjust forward estimates are:
•wages – inflator;
•consumer price index (CPI) – inflator; and
•efficiency dividend – deflator.
Consistent with the Wages Policy, the wage inflator applied to employee costs in all years is 3 per cent.
A CPI factor of 0.5 per cent has been applied to operational costs in 2016‑17, consistent with the year‑on‑year to December 2015 CPI outcome, with 1.5 per cent estimated for 2017‑18 and 2.5 per cent ongoing from 2018‑19. However property management, undertaken on behalf of government by the Department of Corporate and Information Services, receives a higher parameter in line with contractual arrangements.
An additional growth parameter of 4 per cent is applied to wage and non‑wage expenditure for the Top End and Central Australia Health Services in recognition that hospital services and associated costs are generally demand driven.
An efficiency dividend is applied to operational and employee costs premised on agencies improving processes and technology and delivering services more efficiently over time, as is the case with private sector enterprises. An efficiency dividend of 2 per cent has been applied in 2016‑17, increasing to 3 per cent in 2017‑18, with 2 per cent ongoing from 2018‑19. Efficiency dividends are not applied to grants and some contractual obligations.
For Territory‑funded grants and subsidies, a composite factor is applied based on 75 per cent of the wages factor and 25 per cent of the CPI factor.
Operating Revenue – Forward EstimatesAs shown in Table 2.4, compared to 2015‑16, there is a significant decrease in total Territory revenue from 2016‑17 onwards, largely due to the reduction in taxation revenue, mining royalties and GST revenue. As a result, it is projected that total revenue will only return to 2015‑16 levels by 2019‑20.

Fiscal Outlook and Strategy 17
Budget Strategy and Outlook
Table 2.4: Non Financial Public Sector – Revenue
2015‑16 2016‑17 2017‑18 2018‑19 2019‑20
Estimate Budget Forward Estimate
$M $M $M $M $M
Revenue
Taxation revenue 602 577 596 612 629
GST revenue 3 274 3 263 3 306 3 474 3 698
Current grants 1 094 975 961 871 904
Capital grants 354 385 204 42 21
Sales of goods and services 1 100 1 044 1 111 1 165 1 209
Interest income 92 88 90 92 94
Dividend and income tax equivalent income 20 12 10 7 7
Mining royalties income 194 132 132 132 132
Other 58 71 68 71 74
Total revenue 6 788 6 547 6 477 6 466 6 768
Year‑on‑year percentage increase (%) ‑ 2.8 ‑ 3.5 ‑ 1.1 ‑ 0.2 4.7
Source: Department of Treasury and Finance
Taxation revenue is the most significant component of the Territory’s own‑source revenue and is expected to decrease in all years, when compared with the April 2015 Budget projections. In addition, the Territory’s taxation revenue for 2016‑17 is expected to be lower than 2015‑16 by 4.2 per cent, to a total of $577 million. The reduction is primarily due to an expected reduction in stamp duty collections due to the softening in the property market and the introduction of the First Home Owner Discount on established dwellings. However it is anticipated that from 2016‑17 taxation revenue will increase by 2.9 per cent per annum on average over the forward estimates, albeit from a lower base, subsequently lower than the on average 8 per cent per annum growth experienced over the past decade.
The estimate for the Territory’s GST revenue in 2015‑16 has been revised up marginally by $3 million to $3274 million. However, as discussed previously, the estimate for 2016‑17 is $145 million lower, largely due to the decrease in the Territory’s relativity, as recommended by the CGC, with the reduction projected to flow through to all forward years. In absolute terms, the reduced relativity means from 2015‑16 to 2017‑18 the Territory’s GST revenue is almost flat. GST revenue is then expected to return to previous growth levels from 2017‑18, again off a much lower base.
Further details on GST revenue and its components can be found in Chapter 5 of this Budget Paper.
During each budget year there are significant changes in tied Commonwealth revenue estimates as funding agreements are finalised. These adjustments tend not to affect the fiscal outcomes over time, as increases in revenue are generally matched by a corresponding increase in expenditure. However, timing differences between when the tied revenue is received and the associated expenditure occurs, does introduce a degree of volatility affecting the budgeted and actual outcomes in a given year.
Current and capital grants increased by $303 million in 2015‑16 when compared to the April 2015 Budget, mainly due to the upfront payment of $134 million for the delivery of municipal and essential services in remote communities under the Remote Aboriginal Investment NP and increased funding for various road and health related agreements, offset by the revised timing of funding for health infrastructure projects.

18 Fiscal Outlook and Strategy
2016-17 Budget
From 2016‑17 current and capital grants are decreasing over the forward estimates as a result of agreements with the Commonwealth being for fixed periods and expiring. The most significant of which is Remote Housing, which concludes in 2017‑18 resulting in a reduction in current and capital grants in excess of $100 million in 2018‑19. This reduction is somewhat offset in 2019‑20 by a $42 million increase in assistance payments to the Territory from the Disability Care Australia Fund.
Revenue from the sales of goods and services in 2015‑16 is generally consistent with that published in the April 2015 Budget, but has been revised down in 2016‑17 and 2017‑18, largely a result of the winding up of the Darwin Port Corporation. The remainder of own‑source revenue is mainly attributable to mining royalties. Based on advice from royalty payers, and due to the expected continuation in the reduction in prices and demand for commodities in the mining sector, estimates for receipts from mining royalties have been revised down by an average of $32 million per annum from 2016‑17 onwards, when compared to the 2015 Budget.
Operating ExpensesTable 2.5 sets out the revised expense projections for total expenditures for 2015‑16, 2016‑17 and the forward estimates.
Table 2.5: Non Financial Public Sector – Expenditure
2015‑16 2016‑17 2017‑18 2018‑19 2019‑20
Estimate Budget Forward Estimate
$M $M $M $M $M
Expenses
Employee expenses 2 227 2 274 2 320 2 353 2 424
Superannuation expenses 355 351 349 349 351
Depreciation and amortisation 504 521 530 532 537
Other operating expenses 1 984 1 944 2 010 2 072 2 106
Interest expenses 296 276 284 295 302
Current grants 856 865 840 785 862
Capital grants 144 98 21 2 13
Subsidies and personal benefit payments 132 133 138 142 144
Total expenses 6 497 6 461 6 491 6 531 6 739
Year‑on‑year percentage increase (%) 6.8 ‑ 0.6 0.5 0.6 3.2
Net capital 994 1 375 905 590 527
Total expenditure 7 491 7 837 7 396 7 121 7 267
Year‑on‑year percentage increase (%) 12.2 4.6 ‑ 5.6 ‑ 3.7 2.0
Source: Department of Treasury and Finance
The Government remains committed to returning the Budget to a fiscal balance surplus, however recent reductions in revenue estimates has meant this would not have been achieved by 2017‑18 without significant cuts to both core services and infrastructure expenditure aimed at sustaining the Territory’s economy.
As mentioned earlier in this Chapter, additional efficiency dividends have been applied to the Budget year and all forward years to assist with partially offsetting the effect of lower revenues and the additional policy decisions made by Government. To ensure the Budget returns to surplus, expense growth has been kept below revenue growth by around 1.5 per cent in 2019‑20.
Fiscal Outlook and Strategy 19
Budget Strategy and Outlook
Employee expenses continue to account for about one third of total expenses over the forward estimate period and are estimated to increase on average from the budget year by 2.2 per cent, consistent with Government’s wages policy, which limits growth in wages to 3 per cent, offset by the efficiency dividend.
Underlying growth from the budget year in other operating expenses is estimated at around 2.7 per cent per annum on average. Consistent with the practices in other jurisdictions, included in expenditure estimates from 2017‑18 is a contingency reserve of around 1 per cent per annum. The reserve is there to meet one‑off unforeseen expenditure requirements, minor revenue variations and provide some limited capacity for new and expanded initiatives.
When compared to the April 2015 Budget, interest expenses are on average $44 million lower per annum over the forward estimates and are reflective of the improved 2014‑15 fiscal and net debt position, combined with Government’s decision to utilise $75 million from the Port of Darwin lease proceeds to reduce the Territory’s debt levels in 2015‑16.
The fluctuation in current and capital grants expense across the forward estimate period is in line with the timing of tied Commonwealth funding agreements, in particular, the revised funding arrangements under the Remote Aboriginal Investment and the Remote Housing NPs.
Net capital payments are higher than projected in the 2015 Budget for all years from 2016‑17 onwards, reflecting increased infrastructure investment in social and economic enabling projects partially funded by the sale of TIO and Port of Darwin lease. The investment in infrastructure, while remaining higher than historical levels, is reducing over the forward estimates period, with the reduction in 2018‑19 partially a result of the cessation of the Remote Housing agreement.
Key Fiscal Indicators – Balance SheetThe key measures for the balance sheet are net debt and the resulting net debt to revenue ratio.
Net debt is lower than projected in the 2015 Budget for 2015‑16 and 2016‑17, but is expected to increase in 2017‑18 and 2018‑19. The increases in the later years are as a result of the projected fiscal balance deficits, however both net debt and net debt to revenue are expected to reduce marginally in 2019‑20, consistent with the projected surplus in that year.
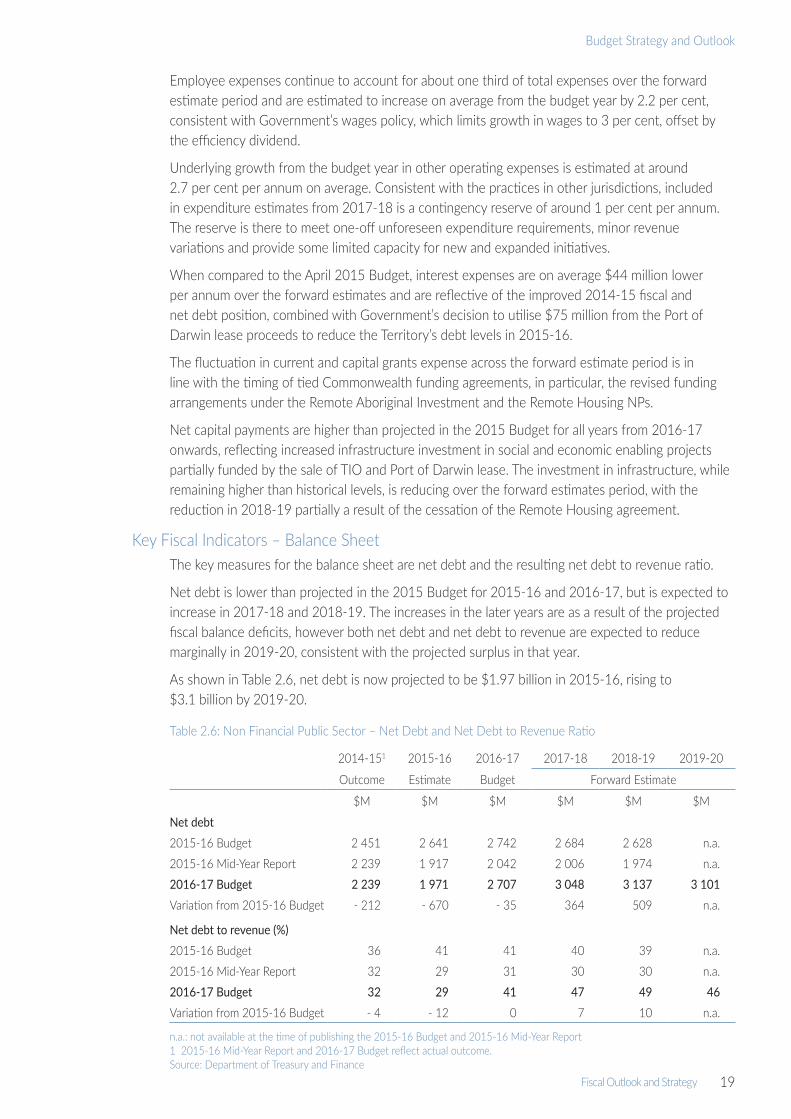
As shown in Table 2.6, net debt is now projected to be $1.97 billion in 2015‑16, rising to $3.1 billion by 2019‑20.
Table 2.6: Non Financial Public Sector – Net Debt and Net Debt to Revenue Ratio
2014‑151 2015‑16 2016‑17 2017‑18 2018‑19 2019‑20
Outcome Estimate Budget Forward Estimate
$M $M $M $M $M $M
Net debt2015‑16 Budget 2 451 2 641 2 742 2 684 2 628 n.a.2015‑16 Mid‑Year Report 2 239 1 917 2 042 2 006 1 974 n.a.2016‑17 Budget 2 239 1 971 2 707 3 048 3 137 3 101Variation from 2015‑16 Budget ‑ 212 ‑ 670 ‑ 35 364 509 n.a.
Net debt to revenue (%)2015‑16 Budget 36 41 41 40 39 n.a.2015‑16 Mid‑Year Report 32 29 31 30 30 n.a.2016‑17 Budget 32 29 41 47 49 46Variation from 2015‑16 Budget ‑ 4 ‑ 12 0 7 10 n.a.
n.a.: not available at the time of publishing the 2015‑16 Budget and 2015‑16 Mid‑Year Report1 2015‑16 Mid‑Year Report and 2016‑17 Budget reflect actual outcome.Source: Department of Treasury and Finance

20 Fiscal Outlook and Strategy
2016-17 Budget
The $670 million reduction in net debt in 2015‑16 is due to the $212 million improved outcome for 2014‑15 and the Port of Darwin lease proceeds, slightly offset by a net increase in expenses in 2015‑16. The increased net debt from 2017‑18 largely reflects the Territory’s reduced revenue base, and the decision to reinvest the proceeds from the TIO sale and the Port of Darwin lease into economic infrastructure, along with a range of other initiatives to stimulate the Territory economy.
As a result, the net debt to revenue ratio is projected to peak at 49 per cent in 2018‑19 before reducing to 46 per cent by 2019‑20.
Assessment of Updated Fiscal Outlook Against the Fiscal StrategyThis section focuses on the assessment of the Government’s adherence to its fiscal objectives and targets. It builds on the earlier section of this chapter addressing the requirement of FITA that each fiscal outlook report contains an explanation of the factors and considerations that contribute to any material differences between the updated financial projections and expected outcomes for the key fiscal indicators as specified in the Government’s fiscal strategy statement.
Key Fiscal IndicatorsThe key indicators against which the Government’s compliance with its fiscal policy can be measured and assessed are:
•the non financial public sector’s fiscal balance;
•the general government sector’s net operating balance;
•the rate of return earned on capital employed by government owned corporations;
•the Territory’s taxation effort compared with other jurisdictions; and
•the non financial public sector’s net debt to total revenue ratio.
Key fiscal target: by 2017‑18 the fiscal imbalance in the Territory’s non financial public sector is to be eliminatedThe fiscal balance is an operating statement measure that differs from the net operating balance as it includes spending on capital items but excludes depreciation. A fiscal surplus indicates that a government is saving more than enough to finance all its investment spending. A fiscal deficit position indicates that a government’s level of investment is greater than its level of savings.
As highlighted in the 2014‑15 Treasurer’s Annual Financial Report the Government achieved this element three years before its stated target. At the time of the April 2015 Budget a modest fiscal balance surplus of $9 million was projected for the 2017‑18 target year, increasing to $35 million in 2018‑19. However due to the revenue reductions in excess of $200 million per annum estimated from 2016‑17, fiscal deficits are now projected until 2018‑19 before returning to a modest surplus in 2019‑20 (Table 2.2).
In light of the significant reductions in revenue, achieving a fiscal surplus in 2019‑20 will remain challenging for Government and require an increased focus on expenditure needs that can be met by the available revenue, along with maintaining the focus on improving the commercial performance of the Territory’s government owned corporations.
Associated fiscal outcome: by 2016‑17, the Territory’s general government sector is achieving a net operating surplusThe net operating balance is measured by the general government sector’s total annual revenues less its total annual operating expenses (including annual depreciation, a non‑cash expense). A net operating deficit indicates that total annual operating expenses exceed total annual revenues.

Fiscal Outlook and Strategy 21
Budget Strategy and Outlook
As highlighted by the operating surpluses achieved in 2013‑14 and 2014‑15, the Government has met this element of the strategy three years ahead of the fiscal strategy target. Operating surpluses continue to be projected in 2015‑16 and 2016‑17, however due to the revenue reductions, operating deficits are now projected in 2017‑18 and 2018‑19 before a return to surplus in 2019‑20.
In the absence of significant increases in revenue, the Government will need to ensure expenditure growth remains below revenue growth in 2019‑20 and maintain its focus on service delivery improvements to ensure the current projected surplus for 2019‑20 is achieved (Table 2.1).
Associated fiscal outcome: by 2016‑17, taxation effort in the Territory’s general government sector is more on par with the average effort of the statesTaxation effort assesses the extent to which a particular jurisdiction’s capacity to raise revenue is above or below the Australian average of 100 per cent. This measure is a lagging indicator as the CGC updates the information annually based on the actual outcome of the previous year. The Territory’s taxation effort has improved from 88 per cent in 2013‑14 to 104 per cent in 2014‑15, the latest year assessed by the CGC.
Significant increases in tax collections and mining royalties, reflecting strengthening economic conditions in the Territory at that time and a one‑off high value commercial transaction in 2014‑15 resulted in a significant improvement in the Territory’s revenue‑raising effort.
Given that Territory taxation revenues peaked in 2014‑15, the latest assessment year, and are projected to be lower in 2015‑16 and all forward years, it is expected the Territory’s taxation effort will moderate back to, or below, the average of the states at the next update.
The Territory’s revenue effort is described in more detail in Chapter 6 of this Budget Paper.
Associated fiscal outcome: by 2016‑17, the Territory’s government owned corporation is moving towards commercial rates of return on capital employedUpon the initial implementation of this fiscal measure in the 2013‑14 Budget, the Territory had only one government owned corporation, the Power and Water Corporation (PWC). However, as a result of the utilities reform agenda, PWC was separated into three distinct entities, Territory Generation, Jacana Energy and PWC. In order to provide a more accurate assessment against this element of the fiscal strategy, the three entities have been consolidated to remove transactions between each other.
The commercial rate of capital employed associated with this target is 6 per cent. In the 2016‑17 Budget the government owned corporations average rate of return is around 4 per cent across the forward estimate period. An increase in revenues or further efficiencies will be required to achieve the targeted rate of return.
Associated fiscal outcome: by 2020, the Territory’s non financial public sector net debt as a percentage of revenue is returning towards 60 per centAs discussed earlier in this chapter, the net debt to revenue projections have deteriorated since the April 2015 Budget. Notwithstanding, this element of the fiscal strategy continues to be achieved well before the stated 2020 target. The net debt to revenue ratio for the non financial public sector is projected to be 41 per cent in 2016‑17 and, while increasing over the forward estimates to 46 per cent by 2019‑20 (Table 2.6), remains well below the 60 per cent target.
Maintaining this element of the fiscal strategy is contingent on all other elements of the strategy being met and further improving over time.

22 Fiscal Outlook and Strategy
2016-17 Budget
ConclusionReturning the Territory’s finances to an ongoing sustainable position and reducing the projected debt burden has been a priority for the Government over the last four years. The Government achieved its key fiscal strategy target of eliminating the fiscal deficit by 2017‑18 by achieving a fiscal surplus of $286 million in 2014‑15. However significant reductions in revenues, largely outside the Territory’s control, and efforts to sustain the economy has resulted in the re‑emergence of fiscal deficits over the short term. As a result, additional measures have been taken by the Government in the 2016‑17 Budget to ensure that eliminating the fiscal deficit remains achievable over the budget cycle with a modest $12 million surplus projected in 2019‑20.
As demonstrated by the projections in the 2016‑17 Budget, achieving a surplus remains a challenge given the Territory has no control over its largest revenue source, the GST. In order to mitigate against the risk of continuing lower GST revenue outcomes, the focus needs to remain on maintaining recurrent expenditure growth at levels lower than revenue growth.

Risks and Contingent Liabilities 23
Budget Strategy and Outlook
Chapter 3Risks and Contingent Liabilities
As required under section 10(1)(e) of Fiscal Integrity and Transparency Act (FITA) each fiscal outlook report is required to contain ‘a statement of the risks, quantified as far as practicable, that could materially affect the updated financial projections, including any contingent liabilities and any Government negotiations that have yet to be finalised’.
This chapter outlines the potential effect of risks to the Budget due to changes in revenue and expense estimates and the likelihood of contingent liabilities becoming actual liabilities.
Risks to the BudgetRevenue
GST RevenueVolatility in GST revenue represents the largest revenue risk for the Northern Territory, with GST revenue accounting for about 50 per cent of the Territory’s total revenue. The risk is clearly evident in the context of the development of the 2016‑17 Budget where GST revenue has been reduced by $145 million in the Budget year or around $750 million over the budget cycle, when compared to previous estimates. These changes in GST revenue estimates have significantly affected the Territory’s fiscal capacity in all years.
The Territory’s GST entitlement is dependent on three parameters, national GST collections, the Territory’s share of the national population and GST relativities as determined by the Commonwealth Treasurer based on recommendations from the Commonwealth Grants Commission (CGC). There are many variables that influence each of these parameters, adding to the complexity of forecasting GST revenue to the Territory over the budget and forward estimates period. In comparison to the Territory Budget, the Commonwealth has adopted different GST parameter estimates that reflect higher growth in the GST pool, maintaining the Territory’s GST relativity at 2016‑17 levels and a lower national population share. This reflects the difficulties in accurately estimating GST revenue over the forward estimates.
National GST Collections – The Territory’s estimates of national GST collections in 2016‑17 and over the forward estimates period are informed by the Commonwealth’s published advice and forecasts of national economic indicators.
The Territory’s GST revenue is directly affected by variations in national GST collections. A ±1 percentage point change in the GST collections growth rate is estimated to have a ±$31 million impact on the Territory’s GST revenue in 2016‑17. If variations of ±1 percentage point occurred in each of the budget and forward estimates years, the cumulative impact on Territory GST revenue is about ±$336 million.
Territory’s Share of National Population – The Territory’s population is estimated to increase by 0.6 per cent in 2015‑16 and to 1.0 per cent in each of 2016‑17 and 2017‑18. Over the forward estimates period the Territory’s population is estimated to increase to the long‑term average of 1.5 per cent by 2019‑20.
Overall, the Territory’s population is expected to grow at a slower rate than nationally over the budget and forward estimates period. Estimates of the Territory’s population growth relative to the national rate influence the Territory’s share of the national population, and therefore affect forecasts of the Territory’s GST revenue. The effect of a ±1 percentage point variation in the Territory’s forecast population growth is estimated at ±$31 million in 2016‑17, all other things being equal.

24 Risks and Contingent Liabilities
2016-17 Budget
The cumulative impact of a ±1 percentage point variation in the estimate of the Territory’s population growth rate over the budget and forward estimates period is about ±$332 million.
GST Relativities – The CGC is responsible for recommending GST relativities, which are updated each year to incorporate new data and changes in states’ fiscal capacities. In its 2016 Update, the CGC recommended a significant decrease in the Territory’s GST relativity from 5.57053 in 2015‑16 to 5.28450 in 2016‑17.
The impact of a 1 per cent variation in the Territory’s GST relativity is around ±$31 million per annum. A ±1 percentage point variation in the Territory’s GST relativity in each year of the forward estimates period would have a cumulative effect of around ±$130 million.
The above analysis examines the effect of variations in estimates of each parameter in isolation. However, these parameters often interact and, as a result, variations in each parameter could have a compounding or offsetting effect on GST revenue estimates.
Other Commonwealth Grants and SubsidiesCommonwealth funding is provided under either the Intergovernmental Agreement on Federal Financial Relations (IGA) through specific purpose payments (SPP), National Health Reform (NHR) payments, Students First – A Fairer Funding Agreement for Schools payments and National Partnership (NP) payments, or through Commonwealth own‑purpose expenses (COPEs) provided directly to agencies.
The IGA affords flexibility of expenditure across the relevant sector for SPPs (in 2016‑17 provided for skills and workforce, disability and housing sectors) without input controls, co‑investment and maintenance of effort requirements. These payments are ongoing and are indexed on a sector‑specific basis, providing a degree of certainty for the Territory’s budgeting, although adequacy of indexation in terms of capturing cost growth remains an ongoing risk.
NHR payments are predominantly based on either hospital activity or ‘block funding’ for smaller hospitals in recognition of their circumstances. A risk remains that the Territory’s circumstances will not be adequately recognised in the funding arrangements, therefore potentially affecting the adequacy of Commonwealth funding.
NP agreements continue to include many risks to states including co‑investment, input controls, burdensome reporting and administrative arrangements, and potential withdrawal of funding. The expiry of NP agreements, which by their nature are time limited, also potentially poses a risk to the Territory’s Budget, particularly where funding has raised service delivery expectations.
The Territory has six NP agreements, including schedules under agreements, for which funding is expected to expire during 2015‑16, totalling $16.3 million in 2015‑16. Funding associated with a further 17 NP agreements, including schedules under agreements, totalling $38.7 million is due to expire by the end of 2016‑17. Should the funding under these agreements not be renewed or rolled into an existing SPP, the Territory would need to either reduce service delivery levels or provide additional funding. In addition, timing of Commonwealth decisions regarding the treatment of expiring NP agreements and their funding is also critical to ensure continuity of service delivery or allow for alternative approaches to be considered should funding not be available.
The Commonwealth has not committed to funding arrangements for health and hospitals or school education beyond 2019‑20. With uncertainty around the long‑term funding arrangements for these core service areas, there is a further risk of reduced tied funding levels to all states and territories. Additionally, if future Commonwealth reform agendas are introduced that may affect delivery and funding arrangements for core government services and that do not adequately recognise the needs of the Territory, there is a risk that funding for these services may be insufficient to continue

Risks and Contingent Liabilities 25
Budget Strategy and Outlook
the current level of services, requiring either budget reprioritisation or a reduction in the scope of services provided.
Own‑Source RevenueThe amount of revenue received from Territory taxes and royalties is dependent on the performance of the Territory economy and other external factors. Forecasting such revenue involves judgements and assumptions made about the performance of the various economic factors and indicators that directly affect Territory taxes and royalties, such as growth in wages, employment, average hours worked, commodity prices, market activity and exchange rates.
It is difficult to accurately predict revenue collections into the future, particularly for the later years of the forward estimates. The most difficult source of revenue to forecast is mining royalty revenue because it is influenced by a number of factors, but predominantly mineral pricing, production levels and exchange rate conditions.
Mining revenue forecasts rely mainly on advice from mining companies of their expected liability for the financial year. Unpredicted market changes in mineral prices, production or exchange rates will have a material effect on this forecast.
Forecasting conveyance stamp duty is also difficult because it is linked to activity in the property market. The extent and timing of any market changes in terms of property prices and transaction levels is difficult to predict and can have a significant effect on conveyance duty collections. In addition, the Territory has a relatively small conveyance duty base, which includes valuable commercial properties such as pastoral properties and mining projects. These factors introduce significant variability in collections as a result of the impact of the duty collected from large commercial transactions.
In total, a variation of ±1 per cent to the parameters used to forecast Territory taxes and royalties would affect revenue by about $7 million for 2016‑17.
Expenses and PaymentsThe forward estimates for expenses are based on known policy decisions, with adjustments for non‑policy changes.
The most significant risk to the expense estimates is increasing budget pressure due to increased cost and demand influences.
Future enterprise bargaining agreements represent a risk to the Budget to the extent that the outcome of negotiations is over and above amounts currently factored into the forward estimates.
The 2016‑17 Budget includes an increase to the efficiency dividend in all years, from 1 per cent to 2 per cent in 2016‑17, 3 per cent in 2017‑18 and then 2 per cent in both 2018‑19 and 2019‑20. If agencies are unable to find efficiencies to this extent, there is a potential risk to the Budget and forward estimates.
In accordance with FITA, the 2016‑17 Budget includes forward estimates up to 2019‑20. There is the potential for the fiscal aggregates beyond the forward estimates period to be affected by existing commitments. These could either take the form of recurrent costs not expected to crystallise until later in the forward estimates period, recurrent initiatives that roll out over time and have therefore not yet reached their peak of funding, or capital infrastructure for which the associated recurrent costs are not fully incorporated into forward years as their completion falls either close to or outside of the forward estimates period.

26 Risks and Contingent Liabilities
2016-17 Budget
Government Owned CorporationsPower and Water Corporation (PWC) has now been structurally separated into three government owned corporations, PWC, Territory Generation and Jacana Energy. While it is expected that this reform will result in future operational efficiencies, there is a risk of higher costs in the short term as each entity focuses on business improvements.
All three government owned corporations have incorporated future efficiencies into their 2016‑17 Statements of Corporate Intent. If they are unable to achieve their Statement of Corporate Intent targets they will represent an ongoing risk to the Budget.
Risks to Economic ForecastsEconomic forecasts published in the Northern Territory Economy book are subject to a number of upside and downside risks and uncertainties. Economic conditions in the Territory also tend to be highly volatile due to the relatively small size of the Territory’s economy and this is often reflected in the available data, which can be subject to significant revisions.
The availability, range of sources and volatility of data for the Territory’s economy presents an underlying risk to forecasts, particularly in relation to the reporting of capital expenditure for major projects. Some data is confidentialised, making it difficult to report when actual expenditure occurs. There are also difficulties associated with the measurement of interstate trade flows, and other complexities associated with the balancing item of GSP, the components of which are not published publicly.
Most significant for Territory forecasts is the timing of the Ichthys LNG project. Given the size of the project, it has been factored into current forecasts based on publicly available information, including timing of completion and anticipated commencement of production. However any delays in the transition of the project from construction to the production and export phase has potential to influence a range of economic indicators, particularly GSP growth, employment and population forecasts.
There are also a range of other major projects not included in the Territory’s economic forecasts, given the uncertainty around final investment decisions, timing, levels of proposed expenditure and other impacts on the economy, including projects such as the Northern Gas Pipeline, the Darwin luxury hotel development, Project Sea Dragon and some initiatives outlined in the 2016 Defence White Paper.
The Territory economy is heavily exposed to changes in the global economy. Movements in global commodity prices can have significant impacts on the viability of mining activity in the Territory, as experienced in recent years. Also global oil prices can have impacts on the cost of living and doing business in the Territory, affecting not only the price of automotive fuel for consumers, but also transport costs, as well as others goods and services.
Movements in the Australian dollar against other currencies (mainly the United States dollar) will influence the cost of the Territory’s imports and the competitiveness of Territory goods and services exports, largely affecting industries such as tourism, agriculture and mining and manufacturing.
Economic conditions in other Australian jurisdictions also present risks to the Territory’s economic forecasts. This includes effects on the labour market and interstate migration flows. The relative labour market conditions in other jurisdictions can affect the availability of labour in the Territory. Interest rate movements also present an uncertainty for the Territory economy, particularly influencing business, residential property and household consumption and investment.

Risks and Contingent Liabilities 27
Budget Strategy and Outlook
Adverse weather conditions and natural disasters (such as cyclones, flooding, drought and climate variability) are also key risks to many of the Territory’s economic forecasts and have the potential to place upwards pressures on food prices, due to effects on agricultural production across the country.
Contingent LiabilitiesContingent liabilities are potential future costs to Government that may arise from guarantees, indemnities, legal and contractual claims and hence they constitute a risk to the Territory’s financial position.
Contingent liabilities have the potential to materially affect the Budget due to the likelihood of an actual liability arising. Therefore, where possible, the potential extent of the actual liability should be quantified.
Material contingent liabilities of the Territory are defined as guarantees and indemnities with potential exposure greater than $5 million and are disclosed in annual financial statements of the Territory in accordance with Australian Accounting Standards requirements.
With the exception of Darwin Port Corporation’s (DPC) contingent liabilities now assumed by the Territory Government following its long‑term lease in November 2015, and contingent liabilities associated with electricity, gas and water supply, which ceased during 2015, quantifiable and unquantifiable contingent liabilities remain unchanged since the November 2015‑16 Mid‑Year Report and the 2014‑15 Treasurer’s Annual Financial Report (TAFR).
As at the date of this report, no transaction or event of a material nature has occurred that would crystallise the contingent liabilities reported in this section.
Quantifiable Contingent LiabilitiesDetails of estimated amounts of remaining material quantifiable contingent liabilities as at 30 June 2015, resulting from guarantees or indemnities granted by the Territory, are presented in Table 3.1.
Table 3.1: Material Quantifiable Contingent Liabilities
Estimated Quantifiable Contingent Liability as at
30 June 2015
$M
Public Trustee Common Fund 1 32
Source: Department of Treasury and Finance
The Public Trustee Common Fund 1, which had a reported total of $32 million as at 30 June 2015, is government guaranteed.
Under section 97 of the Public Trustee Act, the Treasurer indemnifies the Common Fund against any deficiencies in money available to meet claims on it. The Common Fund is a repository for all moneys received by the Public Trustee on behalf of estates, trusts or persons, and earns interest. Money to the credit of the Common Fund is invested according to the directions issued by an Investment Board.
Although a material statutory contingent liability exists, the prospect of this contingent liability being called upon is considered low.
28 Risks and Contingent Liabilities
2016-17 Budget
Unquantifiable Contingent LiabilitiesUnquantifiable contingent liabilities exist, which could pose a risk to the Government’s financial projections.
TransportThe Territory has contingent liabilities in this category that relate to indemnities and guarantees provided in support of the Adelaide to Darwin railway project.
The AustralAsia Railway Corporation (AARC) and the Territory and South Australian governments have entered into a concession arrangement for the Adelaide to Darwin railway on a build, own, operate and transfer‑back basis.
Unquantifiable contingent liabilities of the Territory in relation to the Adelaide to Darwin railway project relate to the following:
• joint guarantee of the obligations of AARC; and
• indemnities granted in relation to title over the railway corridor (title is secure but the indemnity continues).
Prior to the long‑term lease of the Port of Darwin, the railway corridor interfacing the port was owned by DPC, which leased the facilities to the concession holder. As part of the restructure, the railway corridor was transferred to the Territory, and leased to the concession holder. There are contingent liabilities that arise out of any loss or claim incurred or suffered as a result of the Territory’s failure to comply with its environmental obligation contained in the lease. The lease contains similar indemnities given by the lessee with respect to contamination caused by the lessee and a failure to comply with its environmental obligations. To the extent that DPC had contingent liabilities prior to the Port of Darwin transaction, the Territory Government has the same contingent liabilities now.
AARC and the governments have comprehensive risk management procedures in place for all events that would give rise to liabilities.
The Territory Government has entered into agreements for the relocation of fuel terminals from near the Darwin central business district to the East Arm industrial estate. The agreements provide for certain unquantifiable contingent liabilities to be provided to the developer of the new fuel terminal and an oil company. Government has put in place comprehensive risk management processes to address potential exposure.
The Territory has assumed DPC’s indemnity in relation to certain remedial works at East Arm Port. The indemnity covers third‑party claims, loss, damage, cost and expenses that may be incurred or sustained by Shell arising out of any breach of the Territory’s obligation under the agreement, or in connection with any failure of defect in the integrity of the bunker lines, as well as rectification of damage to the wharf. Comprehensive risk management procedures are in place to minimise risk exposure to the Territory.
Contingent considerations in relation to the long‑term lease of the Port of Darwin are considered unlikely and consequently no contingent liabilities have been disclosed at this time. The Territory will continue to assess any risks under the arrangement and determine whether any future disclosure is required.
Health and Community Services The Territory has granted a series of health‑related indemnities for various purposes including indemnities to specialist medical practitioners employed or undertaking work in public hospitals, indemnities provided to medical professionals requested to give expert advice on inquiries before the Medical Board and indemnities to midwives.

Risks and Contingent Liabilities 29
Budget Strategy and Outlook
Although the risks associated with health indemnities are potentially high, the beneficiaries of the indemnities are highly trained and qualified professionals. The indemnities generally cannot be called upon where there is wilful or gross misconduct on the part of the beneficiary.
There are no reportable contingent liabilities in this category.
Government AdministrationWhere the Territory has invited the participation of private sector persons and government officers on boards of government owned or funded companies, the Territory may grant indemnities to the board members to cover them for any losses that may result from good faith actions.
These indemnities are generally consistent with cover available through Directors and Officers Insurance and the policy of issuing an indemnity rather than purchasing commercial insurance is in line with the Government’s self‑insurance arrangements.
In relation to corporations established in accordance with the Government Owned Corporations Act, an indemnity given by the Territory to board members is limited to actions arising from compliance with a direction issued by the shareholding minister or the portfolio minister pursuant to the Government Owned Corporations Act.
The resulting contingent liabilities are considered low risk as board members are professionals, selected based on their expertise and knowledge. Further, the indemnities are restricted to good faith actions only. These contingent liabilities are unquantifiable.
Indemnities are also granted to the Commonwealth and other entities involved in funding or sponsoring activities and programs initiated or undertaken by the Territory. Under the indemnities, the Territory generally accepts liability for damage or losses occurring as a result of the activities or programs and acknowledges that, while the Commonwealth or another party has contributed financially or provided in‑kind support, the Territory is ultimately liable for the consequences of the activity or program.
Although the resulting contingent liability may, depending on the activity undertaken, not always be low risk, the Territory’s financial exposure is no greater than would have been the case without funding or sponsorship assistance. These contingent liabilities are unquantifiable.
Where the Territory is engaged in legal proceedings and disputes, due to the wide variety and nature of these cases and the uncertainty of any potential liability, no value can be attributed to these cases. In addition, the attribution of value to those cases also has the potential to prejudice the outcome of the proceedings and disputes.
The Government has indemnified private sector insurers that provide workers compensation insurance in the Territory. The indemnity covers insurers for losses that arise as a result of acts of terrorism.
Except for the terrorism indemnity, which is unquantifiable, there are no reportable contingent liabilities in this category.
Secure FacilitiesThe Territory has contingent liabilities in this category that relate to indemnities and guarantees provided in support of the Darwin Correctional Precinct that was constructed and is operated under a public private partnership agreement.
The Territory has indemnified the proponent for losses arising from uninsurable risks. Except for this indemnity, which is unquantifiable, there are no other reportable contingent liabilities in this category.

30 Risks and Contingent Liabilities
2016-17 Budget
FinanceThe Territory’s financial management framework is underpinned by centralised banking arrangements. The sole provider of banking‑related services has been granted indemnities under the whole of government banking contract. These indemnities are considered not to involve significant risk.
There are no reportable contingent liabilities in this category.
Property and Business ServicesAgreements for leases or licences of property, plant or equipment generally contain standard indemnity provisions, similar to those commonly found in commercial leases, covering the lessor or licensor for any losses suffered as a result of the lease or licence arrangement. The contingent liabilities resulting from the indemnities are unquantifiable.
The granting of a concession to Darwin Cove Convention Centre Pty Ltd, gives rise to contingent liabilities associated with:
•discriminatory changes in law;
•environmental clean‑up costs;
• incentive payments to the operator if performance targets established for the centre are exceeded; and
•negotiated payments to the operator in the early years of the centre’s operation.
For the categories listed above, neither the probability nor the amount that the Territory might be called upon to pay at some future date can be determined reliably. As a result, these items are regarded as contingent liabilities, where the existence of an actual liability in the future will be confirmed only by the occurrence of uncertain future events that lie outside the control of the Territory.
A contingent asset also arises as a consequence of the concession arrangement. The Territory Availability Payment (TAP) is recognised as a liability on the general government sector and whole of government balance sheets. However, the Territory has the right to recover up to 75 per cent of that liability if the operator should not achieve certain performance criteria. Because neither the probability of such a recovery nor the amount that might be recovered can be determined reliably, the part of the TAP that may be subject to abatement is classified as a contingent asset.

Budget Initiatives 31
Budget Strategy and Outlook
Chapter 4Budget Initiatives
This chapter summarises the Government’s new initiatives for expenditure and revenue included in the 2016-17 Budget. A discussion on revenue initiatives is also presented in the last section of this chapter.
For more detail on initiatives, as well as capital works projects proceeding in 2016-17, refer to Budget Paper No. 3.
Expenditure Initiatives2015‑16 Estimate
2016‑17 Budget
$000 $000
Department of the Chief MinisterFunding to support the Territory’s capacity in countering violent extremism 80
Upgrades to the Alice Springs Women’s Shelter 100
Feasibility study into seniors’ villages in the Top End and Central Australia 300
Tropical cyclones Lam and Nathan Community Recovery Fund 2 500
Funding to support Major Events including the extension of Red CentreNATs sanction agreement 6 393 4 649
Northern Territory Ice Action Plan 300 700
Additional funding for the Office of Major Projects, Infrastructure and Investment 8 044
Increased support for Territory show societies 2 800
Increased support for Festivals NT 250
Total 17 487 8 629
Northern Territory Police, Fire and Emergency Services Replacement of the high-rise aerial fire and rescue service appliance 1 300
Rollout of body-worn video devices for Territory police 2 000
Replacement of ultra-high frequency radio equipment and infrastructure across the Territory 7 154
Additional funding for repairs and maintenance 1 547
Review into streamlining law enforcement functions and capability 200
Territory-wide random drug driver testing regime 361
Support for the facial recognition system 570
Implement an electronic rostering system to streamline frontline services and improve service delivery 375
Additional police officers in Wadeye 1 526
Replacement of the speed camera and infringement system, and the SaFER firearm licensing and registration system
1 635
Increase police presence in Groote Eylandt 500
Total 17 168
Tourism NTMarketing activities and support for additional airline services 8 000
Tourism infrastructure grants program (Boosting our Economy) 5 000
Total 13 000
(continued)

32 Budget Initiatives
2016-17 Budget
2015‑16 Estimate
2016‑17 Budget
$000 $000
Land Development Corporation Funding to progress the Marine Industry Park, Katherine Business Park and Tiwi development projects 1 900 3 005
Total 1 900 3 005
Department of BusinessFunding to support small businesses, through a voucher program for home-owner occupiers to undertake minor improvements to their homes
412 20 000
Knowledge Territory Initiatives, including the establishment of the independent Office of the Chief Scientist and the new Cadetship program
3 020
NT Expo trade show 250
Implementation of a new system for NT WorkSafe and occupational licences 1 024
Funding to deliver October Business Month 250
Support for the establishment of crocodile farming businesses in East Arnhem 400
Territory Government Business Engagement Strategy 400
Funding for food services in the Territory 400
Total 1 062 25 094
Office of the Commissioner for Public EmploymentFunding to support the NTPS Indigenous Employment and Career Development Strategy 2015-2020 400
Total 400
Department of Corporate and Information ServicesExpand telecommunications services in remote communities 5 000 5 000
Project management of the Department of Health’s Core Clinical Systems Renewal Program 56 200
Replace the Territory Government Identity and Access Management System 1 500
Development and management of a Government Grants Management System 250 470
Total 5 250 63 170
Department of Treasury and FinanceContribution towards upgrades at Owen Springs and Tennant Creek power stations 50 000
Additional funding for First Home Owner Grants due to increased demand 4 891 4 891
Total 54 891 4 891
Department of Lands, Planning and the EnvironmentBuilding advisory services 530
Ludmilla Creek flood mitigation works (Boosting our Economy) 2 000
Delivery of Government's building reform agenda 678
Governance arrangements to support the Environment Division 783
Funding to manage Frances Bay Mooring Basin and associated wharves, including design works to replace the lock gates
1 250
Total 2 000 3 241
(continued)
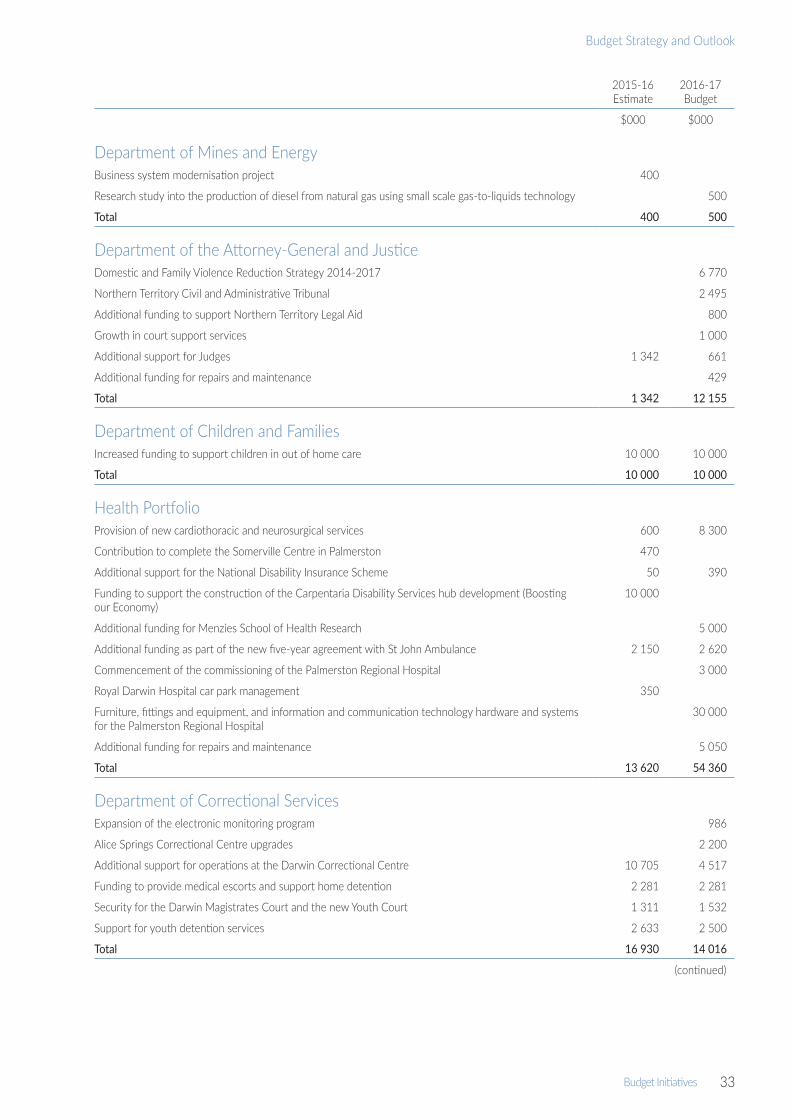
Budget Initiatives 33
Budget Strategy and Outlook
2015‑16 Estimate
2016‑17 Budget
$000 $000
Department of Mines and EnergyBusiness system modernisation project 400
Research study into the production of diesel from natural gas using small scale gas-to-liquids technology 500
Total 400 500
Department of the Attorney-General and JusticeDomestic and Family Violence Reduction Strategy 2014-2017 6 770
Northern Territory Civil and Administrative Tribunal 2 495
Additional funding to support Northern Territory Legal Aid 800
Growth in court support services 1 000
Additional support for Judges 1 342 661
Additional funding for repairs and maintenance 429
Total 1 342 12 155
Department of Children and FamiliesIncreased funding to support children in out of home care 10 000 10 000
Total 10 000 10 000
Health PortfolioProvision of new cardiothoracic and neurosurgical services 600 8 300
Contribution to complete the Somerville Centre in Palmerston 470
Additional support for the National Disability Insurance Scheme 50 390
Funding to support the construction of the Carpentaria Disability Services hub development (Boosting our Economy)
10 000
Additional funding for Menzies School of Health Research 5 000
Additional funding as part of the new five-year agreement with St John Ambulance 2 150 2 620
Commencement of the commissioning of the Palmerston Regional Hospital 3 000
Royal Darwin Hospital car park management 350
Furniture, fittings and equipment, and information and communication technology hardware and systems for the Palmerston Regional Hospital
30 000
Additional funding for repairs and maintenance 5 050
Total 13 620 54 360
Department of Correctional ServicesExpansion of the electronic monitoring program 986
Alice Springs Correctional Centre upgrades 2 200
Additional support for operations at the Darwin Correctional Centre 10 705 4 517
Funding to provide medical escorts and support home detention 2 281 2 281
Security for the Darwin Magistrates Court and the new Youth Court 1 311 1 532
Support for youth detention services 2 633 2 500
Total 16 930 14 016
(continued)

34 Budget Initiatives
2016-17 Budget
2015‑16 Estimate
2016‑17 Budget
$000 $000
Department of EducationInfrastructure works in non-government schools (Boosting our Economy) 10 000
Additional repairs and maintenance for government schools (Boosting our Economy) 5 000
Operational funding for the Larapinta Child and Family Centre 500
Operational funding for the Palmerston special school and the Nhulunbuy regional boarding facility 3 300
Grant funding to support the construction of a Catholic primary school in Zuccoli 21 200
Increased student enrolments in government schools in 2016 3 594 7 186
Total 18 594 32 186
Department of TransportSupport for regular public transport air services between Darwin, Katherine, Tennant Creek and Alice Springs 1 000 1 000
Continue the regional bus program and trial new intra-town passenger services in priority areas 760
Additional funding for repairs and maintenance 2 955
Total 1 000 4 715
Department of Primary Industry and FisheriesFunding to support research farms and develop a strategic plan for future farming operations 1 200
Grant to establish a vapour heat treatment plant to support the Territory mango industry 2 000
Bush tucker industry research and development study to establish a national industry hub based in Alice Springs 500
Total 3 700
Department of Land Resource ManagementMary River saltwater intrusion repairs and maintenance 800
Cabomba eradication program at Darwin River Dam 850
Enhanced gamba grass mitigation and fire response for the Darwin rural area 500
Total 2 150
Department of Arts and MuseumsNorthern Territory Heritage Enhancement Action Plan 350 2 875
Internet access in remote Indigenous communities 470
Funding to deliver the key outcomes of the Arts and Cultural Policy 250
Increased funding for the Northern Territory Arts Grants program 1 000
Additional support for the screen industry sector 500
Additional funding for the Museum and Art Gallery of the Northern Territory 598 1 000
Planning study for Aboriginal cultural centres 1 000
75th Anniversary of the Bombing of Darwin – ‘The Territory Remembers’ 750 1 500
Total 1 698 8 595
(continued)
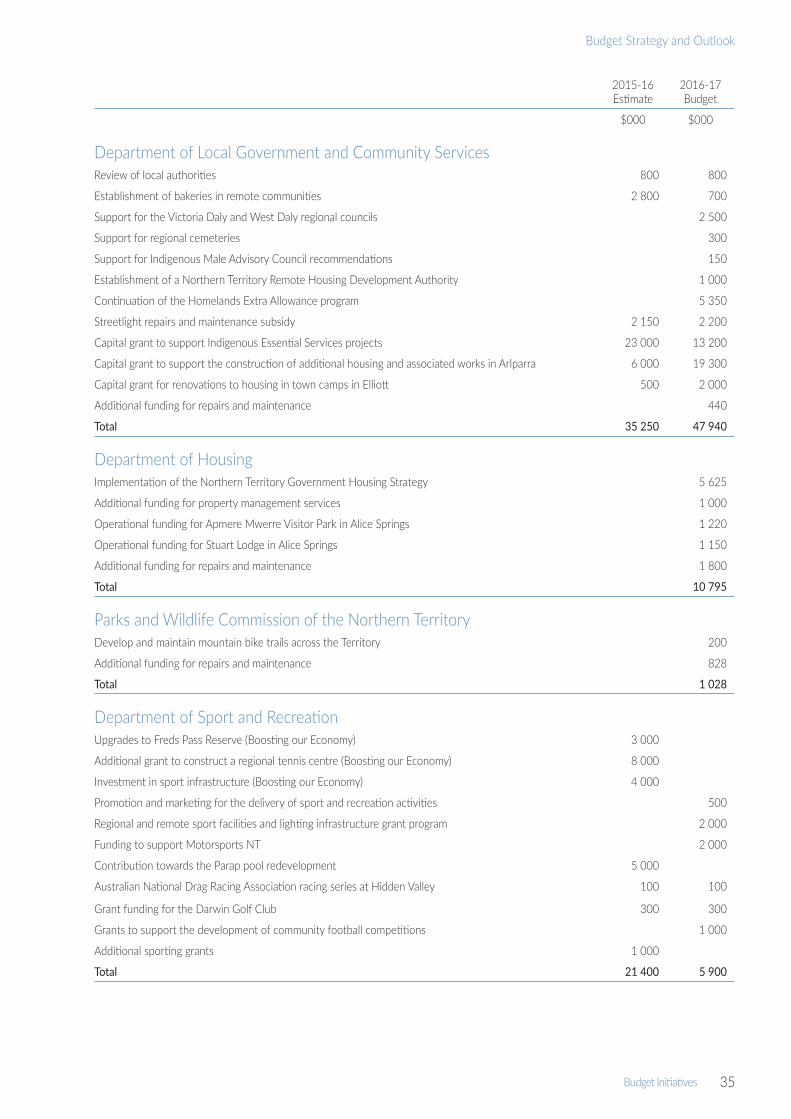
Budget Initiatives 35
Budget Strategy and Outlook
2015‑16 Estimate
2016‑17 Budget
$000 $000
Department of Local Government and Community ServicesReview of local authorities 800 800
Establishment of bakeries in remote communities 2 800 700
Support for the Victoria Daly and West Daly regional councils 2 500
Support for regional cemeteries 300
Support for Indigenous Male Advisory Council recommendations 150
Establishment of a Northern Territory Remote Housing Development Authority 1 000
Continuation of the Homelands Extra Allowance program 5 350
Streetlight repairs and maintenance subsidy 2 150 2 200
Capital grant to support Indigenous Essential Services projects 23 000 13 200
Capital grant to support the construction of additional housing and associated works in Arlparra 6 000 19 300
Capital grant for renovations to housing in town camps in Elliott 500 2 000
Additional funding for repairs and maintenance 440
Total 35 250 47 940
Department of HousingImplementation of the Northern Territory Government Housing Strategy 5 625
Additional funding for property management services 1 000
Operational funding for Apmere Mwerre Visitor Park in Alice Springs 1 220
Operational funding for Stuart Lodge in Alice Springs 1 150
Additional funding for repairs and maintenance 1 800
Total 10 795
Parks and Wildlife Commission of the Northern TerritoryDevelop and maintain mountain bike trails across the Territory 200
Additional funding for repairs and maintenance 828
Total 1 028
Department of Sport and RecreationUpgrades to Freds Pass Reserve (Boosting our Economy) 3 000
Additional grant to construct a regional tennis centre (Boosting our Economy) 8 000
Investment in sport infrastructure (Boosting our Economy) 4 000
Promotion and marketing for the delivery of sport and recreation activities 500
Regional and remote sport facilities and lighting infrastructure grant program 2 000
Funding to support Motorsports NT 2 000
Contribution towards the Parap pool redevelopment 5 000
Australian National Drag Racing Association racing series at Hidden Valley 100 100
Grant funding for the Darwin Golf Club 300 300
Grants to support the development of community football competitions 1 000
Additional sporting grants 1 000
Total 21 400 5 900
36 Budget Initiatives
2016-17 Budget
Revenue InitiativesThe key 2016-17 Budget revenue initiative is the introduction of a first home owner stamp duty discount, described below.
Stamp Duty MeasureFirst Home Owner DiscountFirst home buyers purchasing an established home will be eligible for the First Home Owner Discount. The new initiative provides a discount of up to 50 per cent, with a maximum discount of $10 000, on the stamp duty otherwise payable when first home buyers purchase an established home.
The First Home Owner Discount is intended to provide a short-term stimulus to a slowing residential property market and assist home buyers seeking to enter the housing market for the first time by reducing the barrier of upfront transaction costs. For example, on a home valued at $450 000, the effect of the discount is to reduce stamp duty payable from about $20 000 to $10 000.
The discount applies from 24 May 2016 to 30 June 2017 and is expected to provide $5.5 million in extra assistance to Territory home buyers. The stamp duty discount on established homes is designed to complement the First Home Owner Grant, which applies to newly constructed homes.

Intergovernmental Financial Relations and Issues 37
Budget Strategy and Outlook
Chapter 5Intergovernmental Financial Relations IssuesOverview
In 2016-17 the Territory is expecting to receive $4624 million in Commonwealth funding, representing about 71 per cent of the Territory’s total non financial public sector revenue. This comprises $3267 million in untied payments, largely GST revenue, and $1357 million in tied grants.
GST revenue is the largest single fiscal transfer from the Commonwealth, representing about 50 per cent of the Territory’s total revenue. In 2016-17, the Territory is expected to receive $3263 million in GST revenue, an $11 million decrease from the estimate of $3274 million for 2015-16. The decrease is driven by a reduction in the Territory’s GST relativity from 5.57053 to 5.28450 and a reduction in the Territory’s share of the national population, partially offset by an increase in the GST pool.
Growth in GST revenue over the three years to 2017-18 is estimated to be minimal, increasing from $3274 million in 2015-16 to $3306 million in 2017-18, hindering the Territory’s capacity to meet its fiscal targets.
The decrease in the Territory’s GST relativity reflects the outcome of the Commonwealth Grants Commission’s (CGC’s) Report on GST Revenue Sharing Relativities 2016 Update. The main contributors to the lower relativity were a decline in the Territory’s population growth, above average growth in the Territory’s assessed capacity to collect payroll tax and a decline nationally in the use of community health services in remote areas combined with an increase in non-state sector provision of these services in the Territory.
Tied Commonwealth revenue is estimated to contribute $1357 million or 21 per cent of the Territory’s total revenue in 2016-17 compared to $1444 million in 2015-16. The lower revenue in 2016-17 is mostly attributed to reduced National Partnership (NP) payments, which is explained in detail later in this chapter. In October 2015, the states and territories made a submission to the Commonwealth Treasurer on the Future of Expiring Agreements, which highlighted the limitations of the current process for negotiating tied funding. In particular, the states noted the weakening of key principles of the Intergovernmental Agreement on Federal Financial Relations (IGA), including the increasing use of input controls and highly prescriptive performance benchmarks, and reiterated the need for a more collegial approach to engaging and fostering genuine partnerships on nationally significant service delivery priorities.
Federal Financial RelationsAustralia’s system of federal financial relations is characterised by a comparatively high level of vertical fiscal imbalance, necessitating significant revenue transfers from the Commonwealth to the states. These transfers are in recognition that states’ expenditure obligations under the Australian Constitution far outweigh their capacities to raise revenue, while for the Commonwealth, the opposite is true.
Chart 5.1 highlights the level of vertical fiscal imbalance in Australia. In 2014-15, states were responsible for around 42 per cent of total Commonwealth and state government expenditure in Australia, but only raised around 26 per cent of total revenue. Conversely, the Commonwealth raised around 74 per cent of total Commonwealth and state revenue, but its expenditure obligations only accounted for around 58 per cent of total expenditure. As a result, the Commonwealth makes

38 Intergovernmental Financial Relations and Issues
2016-17 Budget
transfers to the states to support the provision of states’ expenditure obligations, such as health care, education, public safety and transport.
Chart 5.1: Comparison of Commonwealth and States’ Total Expenditure and Revenues, 2014-15
Source: Commonwealth 2014-15 Final Budget Outcome; State and Territory 2014-15 Annual Financial Reports
Further to the high level of vertical fiscal imbalance, the Australian federation is also characterised by significant differences in the fiscal capacities of the states, or horizontal fiscal imbalance, which is a factor of differences in states’ demographic, geographic and economic circumstances. Consequently, the Commonwealth provides differing levels of per capita funding to each state. Table 5.1 shows that in 2014-15 Commonwealth payments accounted for 69 per cent of the Territory’s revenue, compared to an average of 44 per cent across the states.
Table 5.1: Commonwealth Funding as a Percentage of States’ Total General Government Revenue, 2014-15
NSW Vic Qld WA SA Tas ACT NT Average
Revenue from the Commonwealth, $ per capita 4 200 3 939 4 612 3 544 4 839 5 802 5 055 17 714 4 380
Commonwealth proportion of total state revenue, % 46 44 44 33 49 58 43 69 44
Source: Commonwealth 2014-15 Final Budget Outcome; State and Territory 2014-15 Annual Financial Reports
Commonwealth funding to the Territory includes both general revenue assistance (comprising GST revenue and grants in lieu of uranium royalties arising from the Commonwealth’s ownership of uranium), which the Territory can use in accordance with its policy priorities, and tied funding to be used for specific purposes, predominantly in the form of specific purpose payments (SPPs) and NP payments. The majority of Commonwealth revenue to the Territory is provided under the IGA. Funding is also provided through Commonwealth own purpose expenses (COPEs), which are primarily fee-for-service arrangements payable to either government or non-government entities. COPE funding is excluded from IGA payment arrangements.
Table 5.2 shows that in 2016-17, total Commonwealth payments to the Territory are estimated to be $4624 million, of which 29 per cent comprises tied funding, with a further 71 per cent comprising GST revenue and grants in lieu of uranium royalties.
Compared with 2015-16, total revenue from the Commonwealth is expected to decrease by $98 million, or around 2 per cent, in 2016-17. The decrease is primarily due to the one-off $134 million upfront payment of the Municipal and Essential Services Implementation Plan under the former NP agreement on Stronger Futures in the Northern Territory (now the NP on Northern Territory Remote Aboriginal Investment) in 2015-16.
0
10
20
30
40
50
60
70
80
90
100
Revenue ExpenditureCommonwealth States
%

Intergovernmental Financial Relations and Issues 39
Budget Strategy and Outlook
Table 5.2: Components of Territory Revenue1
2015-16 Budget
2015-16 Estimate
2016-17 Budget
$M $M $MGeneral revenue assistance
GST revenue2 3 271 3 274 3 263
Grants in lieu of uranium royalties 4 4 4Tied revenue
Specific Purpose Payments 43 43 44
Students First funding3 275 288 334
National Partnership payments 470 686 578
National Health Reform funding 175 199 206
Other Commonwealth payments4 158 218 195Total Commonwealth revenue 4 417 4 722 4 624
Territory own-source revenue 2 091 2 066 1 923
Total revenue 6 508 6 788 6 547
1 Includes non financial public sector.2 Includes balancing adjustments for over/under payments of GST in the previous financial year.3 Includes payments ‘through’ the Territory for non-government schools.4 For consistency of reporting with the Commonwealth, funding under the Natural Disaster Relief and Recovery Arrangements is
reported as tied funding. Source: Department of Treasury and Finance
Intergovernmental Agreement on Federal Financial Relations The IGA, agreed by all states and the Commonwealth in 2008, provides a framework for national collaboration on policy development and service delivery, and facilitates the implementation of nationally important economic and social reforms.
The aim of the IGA is to improve the effectiveness of government services through:
•fair and sustainable federal financial arrangements;
•clearly defined roles and responsibilities between the Commonwealth and states;
•enhanced public accountability through simpler, standardised and more transparent performance reporting;
•performance reporting that focuses on the achievement of outcomes and outputs;
•reduced administration and compliance overheads;
•elimination of financial and other input controls imposed on states, for service delivery, in Commonwealth funding agreements; and
•the equalisation of fiscal capacities between states.
These arrangements are formalised through:
•National Agreements (NAs) for significant state services (health care, school education, skills and workforce development, disability, affordable housing and Indigenous reform);
•NP agreements for nationally significant reforms, service delivery initiatives and or projects; and
•the provision of GST revenue to the states, with all proceeds from the GST provided on an untied basis and distributed among the states in accordance with the principle of horizontal fiscal equalisation (HFE).

40 Intergovernmental Financial Relations and Issues
2016-17 Budget
GST RevenueGST revenue is the largest revenue transfer from the Commonwealth, representing an estimated 52 per cent of Commonwealth payments to the states. For the Territory, GST revenue is estimated to account for about 71 per cent of total Commonwealth payments in 2016-17.
A state’s GST revenue entitlement is dependent on three factors: national GST collections; the state’s GST per capita relativity, as recommended by the CGC; and the state’s share of the national population. The Commonwealth determines states’ GST entitlements by multiplying each state’s population by its GST relativity to derive its weighted population. A state’s share of GST revenue is equivalent to its share of the weighted population.
Table 5.3 shows historical actuals from 2011-12 and the parameters used to estimate the Territory’s GST revenue in the 2016-17 Budget.
Table 5.3: Territory GST Revenue Parameter Estimates
2011-12Actual
2012-13Actual
2013-14Actual
2014-15Actual
2015-16Estimate
2016-17Budget
2017-18Forward Estimate
GST collections ($M) 46 040 48 061 51 090 54 342 57 385 60 427 63 629
Territory GST relativity 5.35708 5.52818 5.31414 5.66061 5.57053 5.28450 5.11577
Territory share of national population (%)
1.0336 1.0342 1.0404 1.0340 1.0252 1.0179 1.0107
Territory GST revenue1 ($M) 2 507 2 793 2 828 3 226 3 274 3 263 3 306
Change in Territory GST revenue (%) 11.4 1.3 14.1 1.5 - 0.3 1.3
1 GST revenue amounts for 2011-12 to 2015-16 include balancing adjustments for the over/underpayment of GST revenue to the Territory in the preceding year.
Source: Commonwealth Grants Commission, Department of Treasury and Finance
As Table 5.3 shows, the Territory’s GST revenue can be highly volatile, with annual growth rates ranging between 1.3 and 14.1 per cent in the period 2012-13 to 2015-16, due to the combined changes in shares of the national population, GST relativities and GST collections. This presents a significant challenge in attempting to forecast GST parameters, especially relativities, into the future.
In 2015-16, the Territory is expected to receive $3274 million in GST revenue, representing a 1.5 per cent increase from 2014-15. This marginal year-on-year increase of $48 million in the Territory’s GST revenue is due to an estimated 5.6 per cent increase in the GST pool, offset by the impact of decreases in the Territory’s share of the national population from 1.0340 per cent to 1.0252 per cent and the Territory’s GST relativity from 5.66061 to 5.57053. The Territory’s estimated GST revenue for 2015-16 also reflects a negative $8 million adjustment to account for the overpayment of GST revenue to the Territory in 2014-15.
In 2016-17, the Territory’s GST revenue is expected to decrease by 0.3 per cent, or $11 million, to $3263 million. The decrease is due to a substantial 5.1 per cent reduction in the Territory’s GST relativity (from 5.57053 to 5.28450) and a further reduction in the Territory’s share of the national population (from 1.0252 to 1.0179 per cent), which more than offsets the estimated 5.3 per cent increase in the GST pool.
As shown in Table 5.4, when compared to the 2015-16 Budget, the current estimate of GST revenue for 2015-16 remains largely unchanged whereas for 2016-17 GST revenue is expected to be $145 million lower.

Intergovernmental Financial Relations and Issues 41
Budget Strategy and Outlook
Table 5.4: Factors Contributing to the Revision in the Territory’s GST Revenue Estimate
2015-16 2016-17
$M $M
GST revenue
As at 2015-16 Budget 3 271 3 408
As at 2016-17 Budget 3 274 3 263
Difference 3 - 145
Change caused by:
National GST collections 39 40
Relativities 0 - 156
Population - 28 - 28
Interactions1 - 9 - 1
Total 3 - 145
1 Impact of rounding and the interaction between the updated parameters in the calculation of states’ GST shares.Source: Department of Treasury and Finance
As mentioned earlier, the volatility experienced in the Territory’s annual GST revenue growth in recent years represents a significant challenge in attempting to forecast estimates of the Territory’s share of the GST from 2016-17 onwards.
Of the three GST parameters, the GST relativity is the most challenging to forecast, given the wide range of factors influencing relativities. In calculating GST relativities, the CGC considers:
•the average state policy and revenue raised by states for seven-own source revenue categories, each made up of a number of subcategories or assessments (for example, the Mining Revenue category is made of seven individual mineral assessments, a residual ‘other minerals’ assessment and a ‘grants in lieu of royalties’ assessment);
•average state policy and spending in 13 expenditure categories, each made up of a number of subcategories or assessments (for example, the Health category comprises separate assessments for admitted patients, emergency departments, non-admitted patients, non-hospital patient transport and community health);
•the amount of Commonwealth-tied payments received by each state; and
•how each state’s revenue-raising capacity and expenditure-related needs differ from the state average.
Generally, the four large states have greater influence than the smaller states on the average revenue and expenditure against which all states’ fiscal capacities are assessed. In recent years, changes in relativities have been driven mainly by the revenue assessments, particularly in the mining revenue category (dominated by Western Australia) and the stamp duty category (dominated by New South Wales and Victoria). In 2014-15, Western Australia accounted for 60 per cent of all mining revenue assessed by the CGC, while New South Wales and Victoria accounted for 64 per cent of stamp duty revenue. Consequently, a large change in the factors that drive these states’ revenue collections, such as commodity and residential property prices, would have a significant affect on GST relativities, particularly for the smaller states.
Given the current uncertainty surrounding changes in these factors in the short to medium term, it is difficult to reliably forecast GST relativities over the forward estimates. While it is possible to forecast the general trajectory of the Territory’s GST relativities over this period, it is harder to reliably estimate the magnitude of the year-to-year changes, which may have a significant impact on the Territory’s GST revenue.

42 Intergovernmental Financial Relations and Issues
2016-17 Budget
As a result, the Territory has adopted a conservative approach to estimating its GST relativity for 2017-18 which continues the recent downward trajectory in the CGC’s recommended relativities. Based on this approach, the Territory’s relativity is estimated to fall to 5.11577 in 2017-18. Combined with the other GST parameters (GST pool and population share), the Territory is estimated to receive around $3306 million in GST revenue in 2017-18.
Table 5.5 compares the Territory’s estimated GST revenue with the Commonwealth’s 2016-17 Budget estimates. While the Territory and Commonwealth estimates align for 2016-17, the Commonwealth has higher estimates of the Territory’s GST revenue from 2017-18 onwards. This is primarily due to the Commonwealth holding the Territory’s and all states’ relativity constant at 2016-17 levels and estimating a higher GST pool, offset by a lower population share.
Table 5.5: Comparison between Territory and Commonwealth 2016 Budget GST Revenue Estimates
2015-16 2016-17 2017-18 2018-19 2019-20
$M $M $M $M $M
GST revenue
Territory 2016-17 Budget 3 274 3 263 3 306 3 474 3 698
Commonwealth 2016-17 Budget 3 2601 3 262 3 422 3 590 3 736
Difference - 14 - 1 116 116 38Change caused by new:
National GST collections 3 13 16 17 - 5
Relativities 0 0 110 116 75
Population - 17 - 14 - 10 - 17 - 32
Total - 14 - 1 116 116 38
1 Includes an adjustment to reflect a negative $8 million to account for the overpayment of GST revenue in 2014-15.Source: Department of Treasury and Finance
A ±1 per cent variation in the Territory’s GST relativity would change the Territory’s GST revenue by around ±$30 million, however the cumulative impact of potentially large variations in the Territory’s forecast GST relativities over the forward estimates could be substantial. Further details on the impact of variations in the each of the GST parameters are provided in Chapter 2.
GST RelativitiesThe GST relativity component determines whether a state will receive more or less than its population share of the GST revenue pool. The relativities are calculated by the CGC, as the independent body responsible for recommending to the Commonwealth Treasurer the distribution of GST revenue between the states each year, in accordance with the principle of HFE. The CGC defines HFE as:
State governments should receive funding from the pool of goods and services tax such that, after allowing for material factors affecting revenues and expenditures, each would have the fiscal capacity to provide services and the associated infrastructure at the same standard, if each made the same effort to raise revenue from its own sources and operated at the same level of efficiency (CGC 2015 Review Final Report).
HFE aims to ensure each state has the fiscal capacity to provide its citizens with the same access to government services and infrastructure, no matter where they live. In order to assess states’ fiscal capacities, the CGC determines an ‘average’ state policy by examining what states do across all areas of state responsibility, and takes into account unavoidable differences between states that affect their capacities to deliver an average level of services, such as population characteristics, geographic size and remoteness, structure of economies and natural resource endowments.

Intergovernmental Financial Relations and Issues 43
Budget Strategy and Outlook
The Territory requires significantly more than its population share of the GST pool to provide services at national average levels, due to the significantly higher costs of providing services compared with elsewhere, and the relatively higher demand for government services in the Territory. The major drivers of the Territory’s above-average service delivery costs are its small and sparsely distributed population (a significant proportion of which resides in remote areas), a relatively large Indigenous population, isolation from major supply centres in the eastern states and the lack of economies of scale in service delivery and central administration.
It is important to note that states’ shares of GST revenue change over time as factors affecting state revenues and expenses change. For example, a state’s health expenditure needs will increase over time if it has an increasing share of the national elderly population, or a state’s share of GST revenue will decrease over time if its capacity to raise revenue from its own sources increases relative to other states’ revenue-raising capacities (all other things remaining equal).
States are sometimes classified into ‘donor’ and ‘recipient’ states, where the donor states are those that receive less than their population share of GST revenue and the recipient states are those that receive more. Chart 5.2 shows changes in the contributions of the donor states to the redistribution of GST revenue to the other states. It shows that between 2004-05 and 2006-07, New South Wales and Victoria were the only donor states, with all other states receiving more than their population share of GST revenue. It also shows that Western Australia increasingly became a donor state from 2007-08, while Queensland was also a donor state between 2008-09 and 2012-13.
The change in the status of these states from recipients to donors during this period reflects their increased revenue-raising capacities due to significant growth in the mining industry. Since then, Queensland has become a recipient state, mainly due to the impact of natural disasters on its capacity to raise mining revenue, while Western Australia is expected to receive a higher proportion of GST revenue from 2016-17 onwards, reflecting the negative impact of recent declines in iron ore prices on its revenue-raising capacity. Consequently, New South Wales and Victoria will likely account for an increasing share of GST redistribution going forward.
Chart 5.2: ‘Donor’ States’ Share of the Redistribution of GST Revenue to Other States
Source: Commonwealth Grants Commission
0
20
40
60
80
100
01 02 03 04 05 06 07 08 09 10 11 12 13 14 15 16 17
NSW Vic Qld WA
%
Year ended June

44 Intergovernmental Financial Relations and Issues
2016-17 Budget
Commonwealth Grants Commission Report on GST Revenue-Sharing Relativities – 2016 UpdateIn April 2016, the CGC released its Report on GST Revenue Sharing Relativities – 2016 Update, which recommended a decrease in the Territory’s GST relativity from 5.57053 to 5.28450 (Table 5.6). The effect of the decline in the Territory’s GST relativity is a decrease in its share of the GST collections from 5.7 per cent in 2015-16 to 5.4 per cent in 2016-17.
The CGC estimates the financial impact of the change in relativities by applying the 2016 Update relativities to the Commonwealth’s latest GST pool and population estimates for 2015-16. This isolates the impact of changes in relativities from that of changes in state populations and the GST pool. Based on this approach, the CGC estimates that the decline in the Territory’s GST relativity will reduce the Territory’s GST revenue by $182 million. On a per capita basis, the Territory is the most adversely affected state, with an illustrative GST reduction of around $730 per capita, which is almost seven times the reduction in the GST revenue of Tasmania, the next most adversely affected state.
Table 5.6: CGC Estimates of the GST Impact of 2016 Update Relativities
NSW VIC Qld WA SA TAS ACT NT
2015-16 0.94737 0.89254 1.12753 0.29999 1.35883 1.81906 1.10012 5.57053
2016-17 0.90464 0.90967 1.17109 0.30330 1.41695 1.77693 1.15648 5.28450
Impact ($M) - 850 248 520 20 245 - 57 55 - 182
Impact ($ per capita) - 109 41 106 8 142 - 110 138 - 730
Source: CGC 2016 Update
The main contributors to the decline in the Territory’s GST relativity in the 2016 Update are the following changes in the Territory’s circumstances between the years assessed in the 2015 Review and the 2016 Update:
•the Territory’s lower population growth, which reduced its share of the national population and resulted in the CGC assessing the Territory as needing to spend less on new infrastructure;
•above average growth in the Territory’s assessed capacity to collect payroll tax; and
•a decline nationally in the use of community health services in remote areas, combined with an increase in non-state sector provision of these services in the Territory, which reduced the Territory’s assessed expenditure needs.
Given the zero-sum nature of GST distribution, changes in the circumstances of other states also have an impact on the Territory’s GST share.
National GST CollectionsNational GST collections are expected to increase by 5.6 per cent in 2015-16, 5.3 per cent per annum between 2016-17 and 2018-19, and then returning to long-term trend growth by 2019-20. GST collections are significantly affected by consumer sentiment and the resulting consumption patterns, particularly in relation to discretionary spending on goods and services that are subject to GST.
Since the introduction of the GST in July 2000, there has been a notable shift in consumer spending patterns from items that attract GST (mainly discretionary spending) to those that are GST-exempt, resulting in a moderation in GST collections over time. The shift mainly reflects the higher growth in prices and demand for non-discretionary items such as health and education since the introduction of the GST. The trend is expected to continue over the forward estimates period, with growth in GST collections averaging 5.4 per cent per annum.

Intergovernmental Financial Relations and Issues 45
Budget Strategy and Outlook
Chart 5.3 shows the proportion of private consumption attributable to items that attract GST was on a downward trajectory between 2005-06 and 2012-13, reflecting a decline in consumer spending on discretionary items. Overall private consumption as a proportion of gross domestic product (GDP) also trended downwards over this period, reflecting an increase in consumer saving, particularly in the immediate aftermath of the global financial crisis. Since 2012-13, private consumption has increased as a proportion of GDP, supported mainly by low interest rates. This is expected to continue over the budget and forward estimates period, however consumer spending on items that attract GST is unlikely to return to the pre-2007-08 levels in the medium term.
Chart 5.3: Index of GST and Private Consumption as a Proportion of GDP
Source: Department of Treasury and Finance
PopulationThe final component that determines a state’s share of the GST revenue is its share of the national population. This estimate is influenced by the population growth rate in all states, not just the individual state’s actual population growth.
The Territory’s population is estimated to grow by 0.6 per cent in 2015-16 and 1.0 per cent in each of 2016-17 and 2017-18, and 1.3 per cent in 2018-19, returning closer to the long-term average of 1.5 per cent by 2019-20. Chapter 4 of the Northern Territory Economy book provides more detail on the Territory’s population characteristics and forecast growth patterns.
Specific Purpose PaymentsSPPs are provided by the Commonwealth to support states to achieve the outputs and outcomes of the relevant sector’s NA established under the IGA. In 2016-17 it is expected there will be three SPPs associated with an NA (disability, affordable housing, and skills and workforce development). Under the IGA, SPP funding is ongoing, indexed annually and untied within the relevant sector. SPP’s are distributed amongst the states on a population-share basis.
In 2016-17, the Territory expects to receive $43.7 million in SPPs for skills and workforce development, affordable housing and disability. Table 5.7 provides estimates of SPPs to be received by the Territory in 2015-16 and 2016-17.
0.90
0.92
0.94
0.96
0.98
1.00
1.02
1.04
1.06
03 04 05 06 07 08 09 10 11 12 13 14 15 16 17 18 19 20
GST / Private consumption
Private consumption / GDP
Index: 2002-03 = 100
Year ended June

46 Intergovernmental Financial Relations and Issues
2016-17 Budget
Table 5.7: Specific Purpose Payments 2015-16
Estimate2016-17 Budget
$M $M
National Disability 14.7 15.1
National Skills and Workforce Development 14.8 15.0
National Affordable Housing 13.5 13.6
Total 43.0 43.7
Source: Department of Treasury and Finance
National Partnership PaymentsThe IGA established NP agreements to implement projects of national importance and or involving significant reform or service delivery initiatives. NP agreements have been agreed for initiatives across a broad range of state services, including where the initiatives relate to reform directions that are described in an existing NA. Project agreements (PAs), a simpler form of NP agreements, are for initiatives that have relatively low funding and are considered low risk. Some NP agreements require implementation plans (IPs) or schedules to be developed to outline state-specific arrangements where sufficient detail cannot be provided in the overarching NP agreement.
The Territory currently has around 40 NP agreements and PAs. NP payments are now the major source of tied Commonwealth funding, with the Territory expected to receive NP revenue of $686 million in 2015-16 and $578 million in 2016-17. While NP payments may be provided as an upfront payment to facilitate initiatives, the majority are paid on achievement of specified performance benchmarks or milestones. The Commonwealth and Territory also provide own-purpose funding for a small number of NPs. Table 5.8 provides estimates of NP revenue by each agency responsible for delivering the service in the Territory.Table 5.8: National Partnership Payments
2015-16 Estimate
2016-17 Budget
$M $M
Department of the Chief Minister 4.0 1.7
Northern Territory Police, Fire and Emergency Services 37.9 39.5
Tourism NT 0.8 0.8
Department of Business 11.8 14.8
Department of Lands, Planning and the Environment 0.0 5.6
Department of Mines and Energy 4.3 10.0
Department of the Attorney-General and Justice 4.3 7.2
Department of Children and Families 18.5 16.9
Department of Health 90.6 106.6
Department of Correctional Services 0.3 0.3
Department of Education 53.1 39.3
Department of Transport 148.4 116.0
Department of Primary Industry and Fisheries 9.7 2.9
Department of Land Resource Management 0.6 2.8
Department of Local Government and Community Services 158.5 3.5
Department of Housing 142.8 210.0
Total1 685.6 577.9
1 Includes Department of Infrastructure-managed projects on behalf of government agencies.Source: Department of Treasury and Finance

Intergovernmental Financial Relations and Issues 47
Budget Strategy and Outlook
NP revenue included in the Territory’s Budget represents funding agreed by the Territory and Commonwealth governments, or included in the Commonwealth Budget. As additional agreements are finalised through the year, the Territory’s NP revenue for 2016-17 and forward estimates will be adjusted accordingly. The timing and quantum of revenue over the life of an agreement is dependent on the achievement of agreed milestones and or performance benchmarks, and the nature of the initiative.
The $107.7 million decrease in NP revenue from 2015-16 to 2016-17 largely reflects the upfront payment of funding for the Municipal and Essential Services IP under the former NPA on Stronger Futures in the Northern Territory, together with the funding profile across various capital initiatives, including the Land Transport Infrastructure programs, as well as the expiry of some NP agreements in 2015-16 (refer to Table 5.9). The key agreement receiving an increase in funding between 2015-16 and 2016-17 is the National Partnership for Remote Housing. This agreement provides capital funding for new houses and recurrent funding to help manage new and existing remote properties. The Territory is estimated to receive around $66.6 million under this agreement in 2015-16 and around $151 million in 2016-17.
Expiring National Partnership Agreements The Territory has six NP agreements, or schedules under agreements, for which funding expires during 2015-16, with a total of $16.3 million expected to be received in 2015-16. A further 19 NP agreements, or schedules under agreements, have funding due to expire by the end of 2016-17, for which total funding of $38.7 million is expected to be received in 2016-17. While the majority of these agreements have a high service delivery component, particularly in the sectors of skills, affordable housing, education and health, around 15 per cent of the total funding during this period is capital.
Table 5.9 shows the NP agreements for which funding is due to expire in 2015-16 and the Commonwealth funding expected to be received by the Territory.
Table 5.9: Expiring National Partnership Agreements
Expiring in 2015-16
$M
Trade Training Centres in Schools 8.3
Indigenous Teenage Sexual and Reproductive Health and Young Parent Support 3.9
Adult Public Dental Services 2.9
Supporting National Mental Health Reform 0.9
Water for the Future – sustainable rural water use and infrastructure 0.2
TAFE fee waivers for childcare qualifications 0.1
Total 16.3
Source: Department of Treasury and Finance
Under the IGA, the Council on Federal Financial Relations (CFFR), comprising all state, territory and Commonwealth treasurers, may make recommendations as to the treatment of funding under expiring NP agreements. States continue to report to CFFR on expiring NPs and seek a commitment from the Commonwealth to engage early on expiring agreements. Generally, details regarding the continuation of the majority of expiring NP agreements are not known until the Commonwealth Budget is handed down.
If Commonwealth funding is ceased, additional demands may be placed on state and territory finances, which may or may not accord with state and territory priorities. While the expiry of

48 Intergovernmental Financial Relations and Issues
2016-17 Budget
NP agreements that focus on discrete initiatives (such as infrastructure) can be relatively easily managed by states and territories, it is more problematic where the NP agreement creates expectations of ongoing service delivery. The effect of expiring NP agreements on the Territory’s budget remains a risk and will continue to be closely monitored.
Commonwealth Revenue Received by Territory AgenciesDetails of the significant SPPs and NP payments received by Territory agencies are provided in the following section.
Department of BusinessNational Skills and Workforce Development Specific Purpose PaymentThe National Skills and Workforce Development SPP supports the achievement of the objectives included in the National Agreement on Skills and Workforce Development. In 2016-17, the Territory expects to receive $15 million for the National Skills and Workforce Development SPP.
The NA on Skills and Workforce Development aims to achieve a vocational education and training (VET) system that delivers a more productive and highly skilled workforce, enabling all working-age Australians to participate effectively in the labour market and contribute to Australia’s economic future. It was revised in April 2012 and while it maintains a broadly similar intent to the previous NA, the revised agreement has a stronger focus on VET reform and economic participation.
National Partnership Agreement on Skills ReformThe NP agreement on Skills Reform sets out specific initiatives to be achieved under the national skills reform agenda, which in turn supports the principles articulated in the revised NA on Skills and Workforce Development. The NP agreement aims to create a more accessible and equitable training system for working-age Australians and increase the transparency, quality, efficiency and responsiveness of the VET sector to individuals, employers and industry. Funding provided under the NP agreement supports implementation of the reforms and the delivery of increased training outcomes. In 2016-17, the Territory expects to receive $5.3 million under the NP agreement on Skills Reform.
Department of Mines and EnergyProject Agreement for the Management of the Former Rum Jungle Mine SiteThe Project Agreement for the Management of the Former Rum Jungle Mine Site aims to support delivery of the Rum Jungle Mine Site Rehabilitation Project (stage 2) at the former Rum Jungle site, Rum Jungle Creek South, Mt Burton and Mt Fitch sites. The Territory is expected to receive funding of approximately $4.3 million in 2015-16 and $10 million in 2016-17.
Department of HealthNational Health Reform AgreementThe National Health Reform (NHR) Agreement provides a framework for reforms of public hospital funding and governance across Australia and was signed by the Council of Australian Governments (COAG) in August 2011. The NHR agreement aims to improve both health outcomes for all Australians and the sustainability of the Australian health system, and builds on the service delivery principles and objectives for the health system agreed in the National Healthcare Agreement.
From 1 July 2014, new funding arrangements for hospitals under the NHR agreement were implemented resulting in public hospitals being funded based on levels of activity. The activity-based funding (ABF) arrangements aim to improve patient access to services and increase

Intergovernmental Financial Relations and Issues 49
Budget Strategy and Outlook
public hospital efficiencies by funding-agreed services based on a national efficient price rather than a historical basis.
In its 2014-15 Budget, the Commonwealth withdrew its commitment to the NHR Agreement from 2017-18 onwards, limiting growth in its contribution to hospital funding to indexation by the consumer price index (CPI) and population growth instead of growth in hospital activity, creating significant financial uncertainty for the states.
Subsequently, at the 1 April 2016 COAG, meeting a Heads of Agreement on Public Hospital Funding was signed, outlining the Commonwealth’s contribution to health funding from 1 July 2017 to 30 June 2020. The revised arrangement continues the funding arrangements of the NHR agreement, but caps the growth in the Commonwealth’s contribution nationally at 6 per cent. This is considered to be an interim arrangement until a longer-term agreement on health and hospitals funding is agreed.
In 2016-17, the Territory anticipates receiving $206 million, to support the implementation of the NHR agreement through funding for hospital services, teaching, training and research, and public health activities.
National Disability Specific Purpose PaymentThe National Disability SPP supports the achievement of outputs and outcomes under the National Disability Agreement, which aims to enable people with a disability to achieve economic participation and social inclusion, and to enjoy choice, wellbeing and the opportunity to live as independently as possible. It also aims to ensure families and carers of people with a disability are well supported. The Commonwealth has assumed funding and policy responsibility for all aged care services for non-Indigenous people aged 65 years and over, and Indigenous people aged 50 years and over. The Territory has funding and program responsibility for basic community care services for people under these ages in line with its principal responsibility for the delivery of other disability services under the National Disability Agreement. In 2016-17, the Territory expects to receive $15.1 million for the National Disability SPP.
Project Agreement for National Critical Care and Trauma Response CentreThe PA for National Critical Care and Trauma Response Centre supports the continued operation and development of the Centre in Darwin, as a hub for emergency care and health responses to incidents of national and international significance, and for maintaining and building disaster response research and education capabilities, with $15.7 million expected to be received in 2016-17.
National Partnership Agreement on Health InfrastructureThe NP agreement on Health Infrastructure encompasses existing Health and Hospital Fund infrastructure projects in the Territory, including the establishment of new and redevelopment of existing remote health centres as well as minor upgrades to most regional hospitals. Other infrastructure initiatives include the development of the Palmerston Regional Hospital and remote renal and dialysis facilities. The Territory anticipates it will receive $67 million in 2016-17 for health infrastructure initiatives.
Department of EducationStudents First – A Fairer Funding Agreement for SchoolsFrom 1 January 2014, the Commonwealth commenced a new national funding arrangement for schools under the Students First program. This program focuses on the key areas of teacher quality, school autonomy, engaging parents in education and strengthening the curriculum.

50 Intergovernmental Financial Relations and Issues
2016-17 Budget
Changes to the Students First funding arrangements from 2018 were announced as part of the Commonwealth’s 2014-15 Budget, whereby funding to the states will be determined by the CPI with an allowance for changes in enrolments.
The Commonwealth subsequently announced, as part of its 2016-17 Budget, it will provide additional funding between 2018 and 2020 for both government and non-government schools. At the national level, this additional funding is expected to grow by 3.56 per cent each year, with an allowance for changes in enrolments, and is contingent on reform efforts to improve education outcomes. It is estimated the Territory will receive around $35 million in additional funding during this period. The Territory expects to receive Commonwealth funding totalling $334 million in 2016-17.
National Partnership Agreement on Universal Access to Early Childhood EducationThe Territory continues to participate in the NP agreement on Universal Access to Early Childhood Education, which aims to improve access to quality early childhood education and preschool programs in the year before full-time schooling. The Territory expects to receive $5.1 million in 2016-17 from the Commonwealth under this agreement.
Department of TransportNational Partnership Agreements as part of the Infrastructure Investment Program and Infrastructure Growth Package in the Northern TerritoryThe NP agreements that are part of the Infrastructure Investment Program and Infrastructure Growth Package in the Northern Territory aim to improve the productivity, efficiency and safety of an integrated national land transport network in the Territory, to enhance Australia’s economic growth and international competitiveness. They encompass a number of road programs including national network construction and maintenance and off-network projects. In 2016-17, the Territory anticipates receiving $116 million under these NP agreements.
Department of HousingNational Affordable Housing Specific Purpose PaymentThe National Affordable Housing SPP supports the achievement of the National Affordable Housing agreement’s objectives. In 2016-17, the Territory expects to receive $13.6 million for the National Affordable Housing SPP to fund supported accommodation projects.
The National Affordable Housing agreement aims to provide support and accommodation for people who are homeless or at risk of homelessness, to assist people with social housing and those in the private rental market who are purchasing houses. Improving affordable housing opportunities and reducing overcrowding for Indigenous people is a specific focus of this agreement.
National Partnership Agreement on Remote HousingThe NP agreement on Remote Housing, which replaces the former NP agreement on Remote Indigenous Housing, aims to facilitate significant reform in the provision of housing for Indigenous people in remote communities and to address overcrowding, homelessness, poor housing conditions and severe housing shortages in these communities. Key elements of the NP on Remote Housing include: increasing the supply of new houses; improving the condition of existing houses; ensuring social housing is well maintained and managed; and providing opportunities for Indigenous employment and business engagement. In 2016-17 it is anticipated that the Territory will receive $151 million under this agreement.
As part of the NP on Northern Territory Remote Aboriginal Investment, the Territory also anticipates receiving Commonwealth funding of $51.9 million in 2016-17 for housing-related works in remote areas.

Intergovernmental Financial Relations and Issues 51
Budget Strategy and Outlook
Multi-Agency AgreementsNational Partnership on Northern Territory Remote Aboriginal InvestmentThe Stronger Futures in the Northern Territory NP agreement was signed by the Commonwealth and Territory governments in August 2012 and was a 10-year funding package that commenced in 2012-13, totalling $3.5 billion. It’s aim was to improve Indigenous outcomes through the program areas of health; schooling; community safety and justice; tackling alcohol abuse; child, youth, family and community wellbeing; housing; municipal and essential services; Alice Springs transformation; remote engagement and coordination; and jobs.
In 2014 negotiations commenced with the Commonwealth to reduce the number of IPs under the agreement, with the objective of clarifying or amending performance benchmarks, reducing reporting burden and increasing flexibility regarding the purpose to which the Stronger Futures investment was directed.
The renegotiation has resulted in a rebadging of the former agreement into the National Partnership on Northern Territory Remote Aboriginal Investment (NTRAI). Under NTRAI, the Territory will be eligible to receive up to $1028.7 million between 2015-16 and 2021-22, including funding for non-government schools of around $42.6 million. This represents an increase in NP funding of about $71 million, compared to funding under Stronger Futures. The increase is largely due to the reclassification of some COPE funding to NP funding.
NTRAI is more streamlined, with fewer IPs and reporting requirements. The renegotiation process has enabled Territory agencies to develop IPs that better align agreed outcomes, outputs and milestones with Government strategies, rather than based on inputs prescribed by the Commonwealth.
Eight agencies are directly engaged in delivering initiatives under this agreement, with Commonwealth NP payments of $161.5 million anticipated to be received in 2016-17. Commonwealth and Territory own-purpose funding will also contribute to the achievement of this NP’s outcomes.
Performance ReportingA key principle of the IGA is enhanced accountability to both governments and the public through simpler, standardised and more transparent performance reporting. Performance measures in both NAs and NPs are required to be outcome and or output focused and reported in a timely manner. The Productivity Commission is tasked with preparing performance reports on progress under NAs and a range of significant NP agreements, with its second progress report released in April 2016.
The Productivity Commission’s 2016 Report provides a high-level overview of performance against the majority of benchmarks and indicators for six NAs, updating a number of results since the 2015 Report. The 2016 Report shows that nationally there has been mixed progress against performance benchmarks. Since 2015, the Territory has seen improvements in relation to various healthcare, education and affordable housing indicators.
The Territory has highlighted a number of issues for consideration as part of any future reports, including the need to have credible indicators, trajectory mapping that emphasises improvements in states performance and gaps in Indigenous data, particularly remote area reporting, and good contextual information.

52 Intergovernmental Financial Relations and Issues
2016-17 Budget
Tax ReformIn 2015, the Commonwealth and the states considered a number of options for the reform of Australia’s tax system. Specifically, the Commonwealth’s stated aim is to reform Australia’s tax mix without increasing the overall tax burden. The key concern of the states was addressing the fiscal gap created by the Commonwealth’s decision in its 2014-15 Budget to reduce the indexation of health and education funding from 2017-18.
In April 2016, COAG considered economic and federation reform, including discussions on health and education funding. As noted above, COAG agreed to continue the funding arrangements under the NHR agreement to 30 June 2020, and to conclude discussions on new funding arrangements for schools education by early 2017.
COAG also discussed the issue of vertical fiscal imbalance and agreed to consider proposals to share personal income tax revenue, raised by the Commonwealth, with the states. The proposal is aimed at providing states with access to a broad revenue base aligned to economic growth, increased fiscal autonomy by transitioning tied grants to untied funding arrangements, and greater flexibility to meet ongoing expenditure needs. Options under this proposal are being progressed by Council on Federal Financial Relations (CFFR).
Department of Treasury and Finance is working collaboratively with the Commonwealth and other states to progress this.
National Disability Insurance SchemeThe National Disability Insurance Scheme (NDIS) was a key recommendation from the Productivity Commission’s report into a national long-term disability care and support scheme. The NDIS will reform the way the Commonwealth and states fund and deliver disability services in Australia.
The NDIS is aimed at providing lifelong care and support for people with a significant disability, including greater choice and control over the supports received and a focus on early intervention.
In December 2012, COAG signed an Intergovernmental Agreement for the NDIS launch. The agreement sets out the objectives, roles and responsibilities of all parties during the first stage of the NDIS and provides a framework for progressing to a full scheme.
In May 2016, the Territory Government signed a bilateral agreement for transition to full-scheme that provides for a staged region-by-region rollout, built on the lessons learnt from the Barkly trial.
Indigenous Expenditure Report The Indigenous Expenditure Report (IER) provides nationally comparable information on Commonwealth and state government expenditure for services provided to Indigenous people. The objective of the IER is to facilitate, over time, an understanding of the link between expenditure and outcomes for Indigenous people and to provide additional information to support the development of policies aimed at closing the gap in outcomes between the Indigenous and non-Indigenous populations.
The latest edition of the IER was released in December 2014 and pertains to general government expenditure on services related to Indigenous people in 2012-13. The key findings from the 2014 IER for the Territory were:
• in 2012-13, the Territory spent $2.7 billion on services related to Indigenous people, equating to 55.5 per cent of the Territory’s total general government expenditure. In comparison, Indigenous people represent 30 per cent of the Territory’s population;

Intergovernmental Financial Relations and Issues 53
Budget Strategy and Outlook
•expenditure on Indigenous-related services was highest in the areas of safe and supportive communities ($742 million), healthy lives ($683 million) and home environment ($569 million);
•on a per capita basis, Territory expenditure on services related to Indigenous people was 2.7 times higher than those related to non-Indigenous people; and
•the per capita expenditure on services related to Indigenous people in the Territory was $38 074. This was the highest of all states with expenditure highest in the areas of safe and supportive communities ($10 427 per capita), followed by healthy lives ($9603 per capita) and home environment ($7998 per capita).
In 2015, the Productivity Commission commenced a review of the IER, which is investigating ways to further enhance the policy relevance of the IER and potentially combining it with the Overcoming Indigenous Disadvantage (OID) Report. While the IER reports on government expenditure on services to Indigenous people in a single year, the OID Report measures the wellbeing of Indigenous people across areas such as early childhood development, home environment and economic participation.
With the input of a number of Territory Government agencies, the Department of Treasury and Finance coordinated the preparation of a whole of government submission to the Review. The Territory submission highlighted the importance of the IER as a source of information on Indigenous-related expenditure and supported proposals to provide additional information in the report, subject to feasibility. The submission also opposed the proposal to combine the IER and OID Reports, as the two reports, while complementary, are focused on different aspects and the information they provide cannot be directly linked.
The outcomes of the Review will be known later this year and will inform the development of the next IER, scheduled to be released in 2017.

54
2016-17 Budget
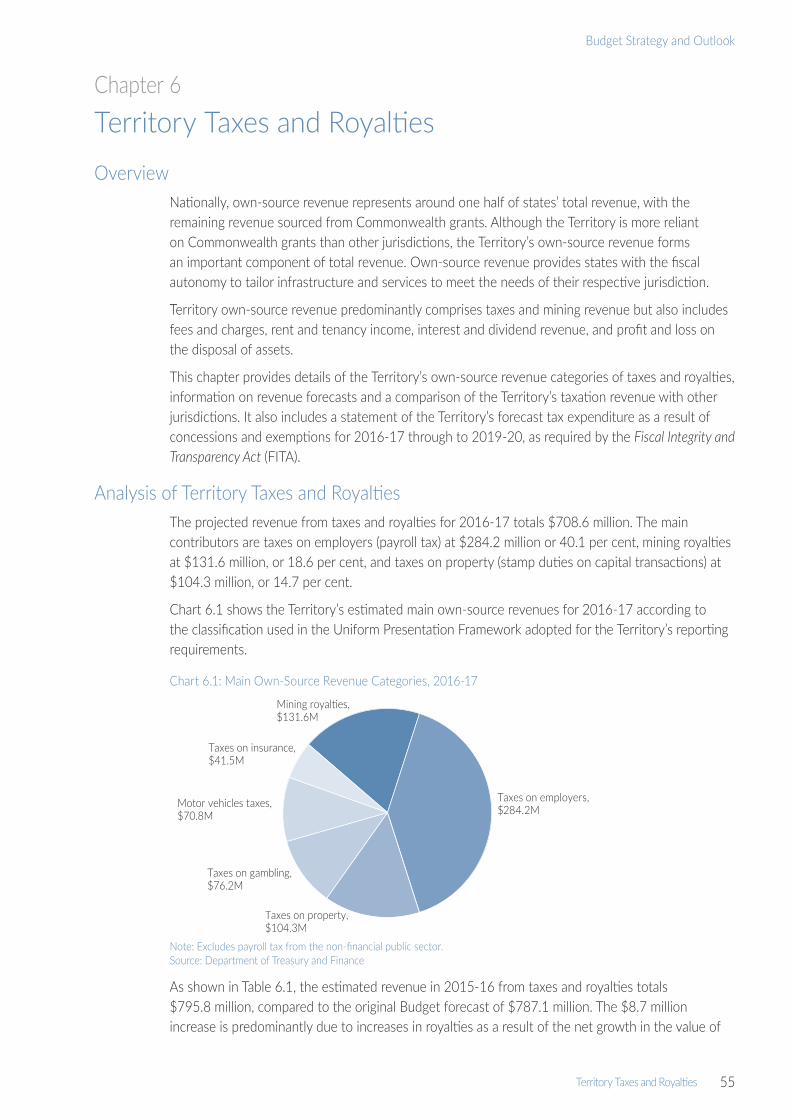
Territory Taxes and Royalties 55
Budget Strategy and Outlook
Chapter 6Territory Taxes and RoyaltiesOverview
Nationally, own‑source revenue represents around one half of states’ total revenue, with the remaining revenue sourced from Commonwealth grants. Although the Territory is more reliant on Commonwealth grants than other jurisdictions, the Territory’s own‑source revenue forms an important component of total revenue. Own‑source revenue provides states with the fiscal autonomy to tailor infrastructure and services to meet the needs of their respective jurisdiction.
Territory own‑source revenue predominantly comprises taxes and mining revenue but also includes fees and charges, rent and tenancy income, interest and dividend revenue, and profit and loss on the disposal of assets.
This chapter provides details of the Territory’s own‑source revenue categories of taxes and royalties, information on revenue forecasts and a comparison of the Territory’s taxation revenue with other jurisdictions. It also includes a statement of the Territory’s forecast tax expenditure as a result of concessions and exemptions for 2016‑17 through to 2019‑20, as required by the Fiscal Integrity and Transparency Act (FITA).
Analysis of Territory Taxes and RoyaltiesThe projected revenue from taxes and royalties for 2016‑17 totals $708.6 million. The main contributors are taxes on employers (payroll tax) at $284.2 million or 40.1 per cent, mining royalties at $131.6 million, or 18.6 per cent, and taxes on property (stamp duties on capital transactions) at $104.3 million, or 14.7 per cent.
Chart 6.1 shows the Territory’s estimated main own‑source revenues for 2016‑17 according to the classification used in the Uniform Presentation Framework adopted for the Territory’s reporting requirements.
Chart 6.1: Main Own‑Source Revenue Categories, 2016‑17
Note: Excludes payroll tax from the non‑financial public sector.Source: Department of Treasury and Finance
As shown in Table 6.1, the estimated revenue in 2015‑16 from taxes and royalties totals $795.8 million, compared to the original Budget forecast of $787.1 million. The $8.7 million increase is predominantly due to increases in royalties as a result of the net growth in the value of
Mining royalties, $131.6M
Taxes on employers,$284.2M
Taxes on property, $104.3M
Taxes on gambling, $76.2M
Motor vehicles taxes, $70.8M
Taxes on insurance, $41.5M

56 Territory Taxes and Royalties
2016-17 Budget
mineral production, partially offset by a decline in conveyance stamp duty from both lower prices and transaction volumes in the residential property sector.
For 2016‑17 moderate growth in most taxes is expected. The decline in taxes on property reflects the effect of several large one‑off commercial transactions inflating receipts in 2015‑16, an expectation that sales volumes and prices in the residential market will continue to be soft and the cost of introducing the First Home Owner Discount. The lower stamp duty combined with lower forecasts of mining and petroleum royalties, based on royalty payer estimates, means an overall decline of $87 million in own‑source revenue collections is expected in 2016‑17.
Table 6.1: Main Own‑Source Revenue Categories
2015‑16Budget
2015‑16 Estimate
2016‑17 Budget
$000 $000 $000
Mining and petroleum royalties 167 660 193 679 131 634
Taxes on employers 273 523 280 038 284 239
Taxes on property 151 847 137 975 104 295
Taxes on gambling 77 049 73 956 76 210
Motor vehicle taxes 71 953 68 977 70 803
Taxes on insurance 45 068 41 218 41 507
Total 787 100 795 843 708 688
Source: Department of Treasury and Finance
Revenue InitiativesThe 2016‑17 Budget includes a change in revenue policy, which was described in detail in Chapter 4. In summary, the policy change is the introduction of a First Home Owner Discount of up to 50 per cent, with a maximum saving of $10 000, for first home buyers purchasing established homes in the Territory from 24 May 2016 to 30 June 2017.
The First Home Owner Discount is intended to provide a short‑term stimulus to a slowing residential property market and assist home buyers seeking to enter the housing market for the first time by reducing the barrier of up‑front transaction costs. The initiative is expected to provide $5.5 million in extra assistance to Territory first home buyers.
Mining and Petroleum RevenueMining revenue is obtained from royalties levied on the recovery of mineral commodities from mining tenements in the Territory. Similarly, petroleum revenue accrues from royalties imposed on the production of petroleum resources in the Territory. Mineral and petroleum royalties are a charge for resource usage, payable to the Territory as the owner of the site or the mineral or petroleum rights over the site.
The Territory’s mining royalty revenues are generally based on a profit‑based regime specified under the Mineral Royalty Act. The other states generally use output‑based royalty schemes that impose a royalty rate on the value of production (ad valorem) or on the tonnage extracted. The Territory’s profit‑based regime uses the net value of a mine’s production to calculate royalty. This is the operating revenue derived from mining activities in excess of $50 000 after deducting allowable project costs, prior year carried forward losses, the cost of capital employed in the mine and the cost of capital and exploration expenditure on the mine site.
Mineral royalties are collected in the Territory from mining for gold, silver, bauxite, manganese, lead, zinc and limestone. The Territory is unable to impose royalties on uranium mined in the Territory

Territory Taxes and Royalties 57
Budget Strategy and Outlook
as, unlike the states, the Commonwealth retains the ownership of uranium. Nonetheless, the Territory receives a grant in lieu of uranium royalty from the Commonwealth. The only uranium mine in the Territory is the Ranger Project, which has an ad valorem royalty scheme settled by the Commonwealth. The Territory receives grant payments reflecting the royalty regime that applied at the time the Ranger Project arrangements were settled. However, Commonwealth legislation provides that royalty on any future uranium mines in the Territory will be based on the Territory’s Mineral Royalty Act. The royalties will continue to be paid to the Territory as a grant in lieu of royalty.
A key feature of the Territory’s Mineral Royalty Act is that both prices and mining costs, including mine setup costs carried forward to profitable years, are taken into account in royalty calculations. If commodity prices, production costs or the value of the Australian dollar rise or fall, royalty liabilities vary accordingly. This variability produces stronger growth in royalty revenues in times of high mineral prices than under ad valorem royalties.
In terms of petroleum royalties, the Territory’s Petroleum Act imposes an ad valorem royalty on the value of production, which is generally consistent with the position across Australia.
In 2015‑16, it is expected that the Territory will receive $193.7 million in mining and petroleum revenue, $26 million higher than forecast in the 2015 Budget.
Mining and petroleum revenue forecasts are reliant on advice from mining companies and petroleum producers of estimated liability and related company estimates of commodity price movements, production levels and the value of the Australian dollar. The forecast for royalty revenue in 2016‑17 is $131.6 million and is based on forecasts from royalty payers that, in line with the global commodity downturn, profitability will moderate considerably. In addition, forecasts are based on the assumption that the Australian dollar and commodity prices, especially in relation to gold, bauxite and manganese, do not materially change.
Taxation Revenue The Territory’s taxation revenue for 2015‑16 is expected to total $602.2 million. In 2016‑17, taxation revenue is expected to decrease by 4.2 per cent to $577.1 million.
The components of the Territory’s taxation revenue are payroll tax, stamp duty on conveyances, taxes on gambling, taxes on insurance, and motor vehicle fees and taxes. Table 6.2 shows the original Budget and revised Estimate of the Territory’s taxation revenue for 2015‑16 and the Budget for 2016‑17.

58 Territory Taxes and Royalties
2016-17 Budget
Table 6.2: Northern Territory Taxation Revenue
2015‑16 Budget
2015‑16 Estimate
2016‑17 Budget
$000 $000 $000
Taxes on employers
Payroll tax 273 523 280 038 284 239
Taxes on property
Conveyance and related duty 151 847 137 975 104 295
Taxes on the provision of goods and services
Taxes on gambling 77 049 73 956 76 210
Taxes on insurance 45 068 41 218 41 507
Taxes on use of goods and performance of activities
Motor vehicle taxes 71 953 68 977 70 803
Total 619 440 602 164 577 054
Source: Department of Treasury and Finance
Payroll TaxPayroll tax is payable in the Territory when the total annual Australian wages of an employer (or group of employers) exceeds the Territory’s annual threshold amount, which is $1.5 million. The threshold reduces proportionately if an employer pays wages in another state or territory. The threshold amount is a deduction from taxable wages, which operates so businesses with total Australian wages of up to $1.5 million do not pay any payroll tax. The deduction reduces by $1 for every $4 in wages paid by an employer above the $1.5 million threshold. This means that an employer who pays wages of $7.5 million or more does not receive a deduction.
Payroll tax is calculated at the rate of 5.5 per cent, based on taxable wages (less the deduction) paid by an employer for services rendered by employees in the Territory.
In 2015‑16, payroll tax revenue is expected to be $280 million, an increase of $6.5 million from the estimate of $273.5 million in the 2015 Budget. This reflects employment and wages growth in the Territory during 2015‑16, particularly among the larger employers making up the Territory’s payroll tax base.
In 2016‑17, payroll tax receipts are expected to remain relatively steady from the higher 2015‑16 base, at $284.2 million, reflecting projected employment growth and growth in average weekly earnings. Over the forward estimates period, payroll tax revenue is expected to increase at a rate of between 1.5 and 2.5 per cent per annum.
Stamp DutyConveyance and Related DutyThe Territory’s conveyance and related duty is derived from direct and indirect conveyances of dutiable property in the Territory. Such property comprises real estate and transfers of businesses.
Conveyance and related duty in the Territory is calculated by a formula that determines a rate applicable to the value of dutiable property conveyed. This is different from the other states, which levy stamp duty on the basis of marginal rates. A comparison of the Territory’s stamp duty regime with the other states is provided later in this chapter.
In 2015‑16, the Territory is expected to collect $138 million in conveyance and related duty, compared with $151.8 million estimated in the 2015 Budget. The decrease in collections is due mainly to a lower than predicted number of residential transactions and a decrease in the

Territory Taxes and Royalties 59
Budget Strategy and Outlook
average value of those transactions. The decrease is partially offset due to some large commercial transactions.
In 2016‑17, conveyance and related duty is estimated to decline further to $104.3 million, reflecting expectations that residential and commercial property stamp duty revenue will decrease, due to fewer high value commercial transactions, stable or lower prices and lower transaction volumes in the residential property market plus the cost of introducing the First Home Owner Discount.
Stamp Duty on Insurance Insurance duty is imposed on general insurance policies. Stamp duty on general insurance is calculated at a rate of 10 per cent of the premium paid on all general insurance products that relate to property or risk in the Territory. Where the policy also relates to a risk or property outside the Territory, the premium is apportioned.
Revenue from insurance duty is forecast to be $41.2 million in 2015‑16. Based on historical growth rates insurance duty is forecast to grow marginally to $41.5 million in 2016‑17, and 2 per cent per annum over the forward estimates.
Motor Vehicle Taxes Motor vehicle taxes comprise stamp duty on the transfer and initial registration of motor vehicles and motor vehicle registration fees.
Generally, stamp duty is levied on the purchase price of the vehicle at a rate of $3 per $100 or part thereof. Revenue from this source in 2015‑16 is estimated to be $21.7 million. In 2016‑17, it is expected to increase to $22.2 million, which includes the long‑term growth rate applied to the forward estimates of 2.5 per cent per annum.
Motor vehicle registrations comprise heavy vehicle and light vehicle registrations. Heavy vehicle registration fees are determined by the Standing Council on Transport and Infrastructure. Light vehicle registration fees are determined by each state. In the Territory, the light vehicle fee is calculated by reference to a differential rate scale based on the engine capacity of the vehicle. In 2015‑16, the Territory is forecast to receive $47.3 million in motor vehicle registration fees, increasing to $48.6 million in 2016‑17. The increase reflects long‑term growth rates plus the expected consumer price index adjustments to light vehicle registration fees, as these fees are expressed in revenue units that are indexed annually.
Gambling TaxesGambling taxes constitute a significant proportion of state revenues. In 2016‑17, gambling tax revenue is forecast to be $76.2 million, or the fourth largest contributor to own‑source revenue. The components of gambling taxes in the Territory are community gaming machine tax, lotteries tax, wagering tax, bookmaker tax, casino/internet tax and the community benefit levy.
In 2015‑16, the Territory expects to receive $74 million in gambling taxes, which is lower than the 2015 Budget forecast of $77 million.
Table 6.3 shows the estimated revenue from each of the Territory’s gambling taxes.
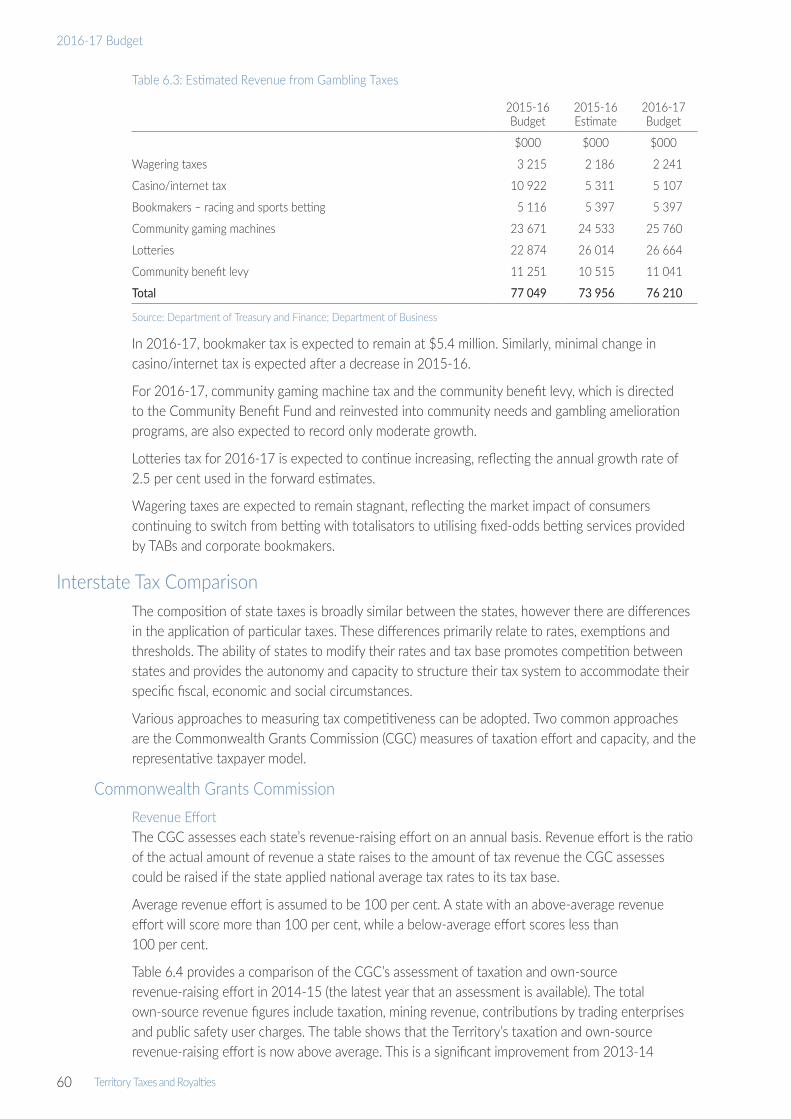
60 Territory Taxes and Royalties
2016-17 Budget
Table 6.3: Estimated Revenue from Gambling Taxes
2015‑16 Budget
2015‑16 Estimate
2016‑17 Budget
$000 $000 $000
Wagering taxes 3 215 2 186 2 241
Casino/internet tax 10 922 5 311 5 107
Bookmakers – racing and sports betting 5 116 5 397 5 397
Community gaming machines 23 671 24 533 25 760
Lotteries 22 874 26 014 26 664
Community benefit levy 11 251 10 515 11 041
Total 77 049 73 956 76 210
Source: Department of Treasury and Finance; Department of Business
In 2016‑17, bookmaker tax is expected to remain at $5.4 million. Similarly, minimal change in casino/internet tax is expected after a decrease in 2015‑16.
For 2016‑17, community gaming machine tax and the community benefit levy, which is directed to the Community Benefit Fund and reinvested into community needs and gambling amelioration programs, are also expected to record only moderate growth.
Lotteries tax for 2016‑17 is expected to continue increasing, reflecting the annual growth rate of 2.5 per cent used in the forward estimates.
Wagering taxes are expected to remain stagnant, reflecting the market impact of consumers continuing to switch from betting with totalisators to utilising fixed‑odds betting services provided by TABs and corporate bookmakers.
Interstate Tax ComparisonThe composition of state taxes is broadly similar between the states, however there are differences in the application of particular taxes. These differences primarily relate to rates, exemptions and thresholds. The ability of states to modify their rates and tax base promotes competition between states and provides the autonomy and capacity to structure their tax system to accommodate their specific fiscal, economic and social circumstances.
Various approaches to measuring tax competitiveness can be adopted. Two common approaches are the Commonwealth Grants Commission (CGC) measures of taxation effort and capacity, and the representative taxpayer model.
Commonwealth Grants CommissionRevenue EffortThe CGC assesses each state’s revenue‑raising effort on an annual basis. Revenue effort is the ratio of the actual amount of revenue a state raises to the amount of tax revenue the CGC assesses could be raised if the state applied national average tax rates to its tax base.
Average revenue effort is assumed to be 100 per cent. A state with an above‑average revenue effort will score more than 100 per cent, while a below‑average effort scores less than 100 per cent.
Table 6.4 provides a comparison of the CGC’s assessment of taxation and own‑source revenue‑raising effort in 2014‑15 (the latest year that an assessment is available). The total own‑source revenue figures include taxation, mining revenue, contributions by trading enterprises and public safety user charges. The table shows that the Territory’s taxation and own‑source revenue‑raising effort is now above average. This is a significant improvement from 2013‑14

Territory Taxes and Royalties 61
Budget Strategy and Outlook
when the Territory’s taxation and own‑source revenue effort was 88 per cent and 96 per cent, respectively.
Table 6.4: 2014‑15 Revenue Effort by Jurisdiction
NSW Vic Qld WA SA Tas ACT NT
% % % % % % % %
Total taxation 104 103 89 99 105 91 100 104
Total own‑source revenue 98 98 102 99 102 89 141 142
Source: Commonwealth Grants Commission 2016 Update
The unusually high Territory effort in 2014‑15 is due to the twin effects of a one‑off high value commercial transaction substantially increasing conveyance duty and a significant increase in assessed mining revenue effort between 2013‑14 and 2014‑15. The Territory’s unusually high total taxation and own‑source revenue‑raising effort is despite the position adopted by the Territory not to impose a land tax. It would be expected that the Territory’s effort will move back closer to the average of the states in the CGC’s 2015‑16 assessment, consistent with the Territory’s Fiscal Strategy.
Revenue Capacity States are limited to growing their own‑source revenues by either replacing current taxes with a new growth tax or by expanding existing tax bases. Nationally, state own‑source revenue comprises only about 50 per cent of total state revenue. However, in 2015‑16 the Territory’s taxation and royalty own‑source revenue is much lower, comprising about 12 per cent of total revenue for the non financial public sector.
The revenue limitations imposed on the states are the result of the Australian Constitution and Commonwealth‑state financial relations. For instance, states are unable to raise excise and customs duties and the Commonwealth has long assumed the collection of income tax.
In addition, state taxation policy provides a balance between raising sufficient revenue to deliver government services, minimising the tax burden on the community, fostering business development and creating a tax environment that is competitive with other jurisdictions.
Although all states face similar constraints in raising own‑source revenue, the Territory’s capacity to raise revenue is further weakened by its relatively small revenue base. This is illustrated in Table 6.5, which shows the CGC’s assessed revenue‑raising capacity for the major taxes and mining revenue. Revenue capacity is the ratio of the per capita amount a state could raise if it applied the national average policy to its tax base, compared to the per capita average revenue raised on the national tax base. This measure removes differences in state policies.
Table 6.5: Assessed Revenue‑Raising Capacity, 2014‑15
NSW Vic Qld WA SA Tas ACT NT
% % % % % % % %
Payroll tax 104 92 93 143 79 61 85 115
Land tax 103 106 98 117 66 57 65 76
Stamp duty 123 99 93 88 61 55 80 71
Insurance tax 105 93 100 98 112 81 95 94
Motor tax 89 102 104 116 105 114 85 91
Total taxation 108 98 96 113 80 70 84 92
Mining revenue 45 3 104 541 46 21 0 128
Source: Commonwealth Grants Commission 2016 Update

62 Territory Taxes and Royalties
2016-17 Budget
For most of the major state taxes, the Territory is assessed as having a relatively low capacity to raise revenue. In all categories other than payroll tax, especially land tax and conveyance duty, the Territory’s capacity is significantly below the national average of 100 per cent. This reflects the Territory’s different circumstances, such as a relatively small number of very high value commercial and residential properties, although average land prices in the Territory are higher than the national average.
The Territory is compensated for its relatively small own‑source revenue base by the CGC’s equalisation process through a higher share of GST revenue.
Representative Taxpayer ModelComparisons can also be made of states’ tax schemes by comparing the amount of tax payable by a representative household or firm. This approach takes into account the different circumstances of each state by applying each state’s tax rate to a representative or average standard.
Payroll TaxTable 6.6 compares the payroll tax rates and thresholds for each jurisdiction. The table shows that the Territory’s payroll tax annual threshold is the second highest in Australia and its payroll tax rate is equal to the national average.
Table 6.6: State and Territory Payroll Tax Rates and Annual Thresholds
NSW Vic Qld1 WA2 SA Tas ACT NT2 Average
Threshold ($M) 0.75 0.55 1.1 0.8 0.6 1.25 1.85 1.5 1.05
Rate (%) 5.45 4.85 4.75 5.5 4.95 6.1 6.85 5.5 5.49
1 Threshold reduces as an employer’s wages increase, so no exemption is provided for employers with wages over $5.5 million.2 Threshold reduces as an employer’s wages increase, so no exemption is provided for employers with wages over $7.5 million.Source: State legislation and information available at 3 May 2016
Table 6.7 provides the effective payroll tax rate at various wage levels for each jurisdiction after considering individual state thresholds and the payroll tax rates. For businesses with wages of $3 million and below, the Territory has a competitive payroll tax scheme with an effective tax rate below the national average. For very large businesses with wage costs of $20 million or more, the Territory has a more favourable effective payroll tax rate than the Australian Capital Territory and Tasmania, and is reasonably comparable to Western Australia and New South Wales.
Table 6.7: Effective State and Territory Payroll Tax Rates at Various Wage Levels
Wages NSW Vic Qld WA SA Tas ACT NT Average
$M % % % % % % % % %
1 1.36 2.18 0.00 1.10 1.98 0.00 0.00 0.00 0.83
2 3.41 3.52 2.67 3.30 3.47 2.29 0.51 1.72 2.61
3 4.09 3.96 3.76 4.03 3.96 3.56 2.63 3.44 3.68
4 4.43 4.18 4.30 4.40 4.21 4.19 3.68 4.30 4.21
5 4.63 4.32 4.63 4.62 4.36 4.58 4.32 4.81 4.53
10 5.04 4.58 4.75 5.06 4.65 5.34 5.58 5.50 5.06
20 5.25 4.72 4.75 5.28 4.80 5.72 6.22 5.50 5.28
Source: State legislation and information available at 3 May 2016
Stamp Duty on Conveyances in the TerritoryNon‑first homebuyers in the Territory receive a rebate of $7000 on the purchase of a new home to be used as a principal place of residence, which is equivalent to a stamp duty concession on around the first $231 500 of the value of the residence.
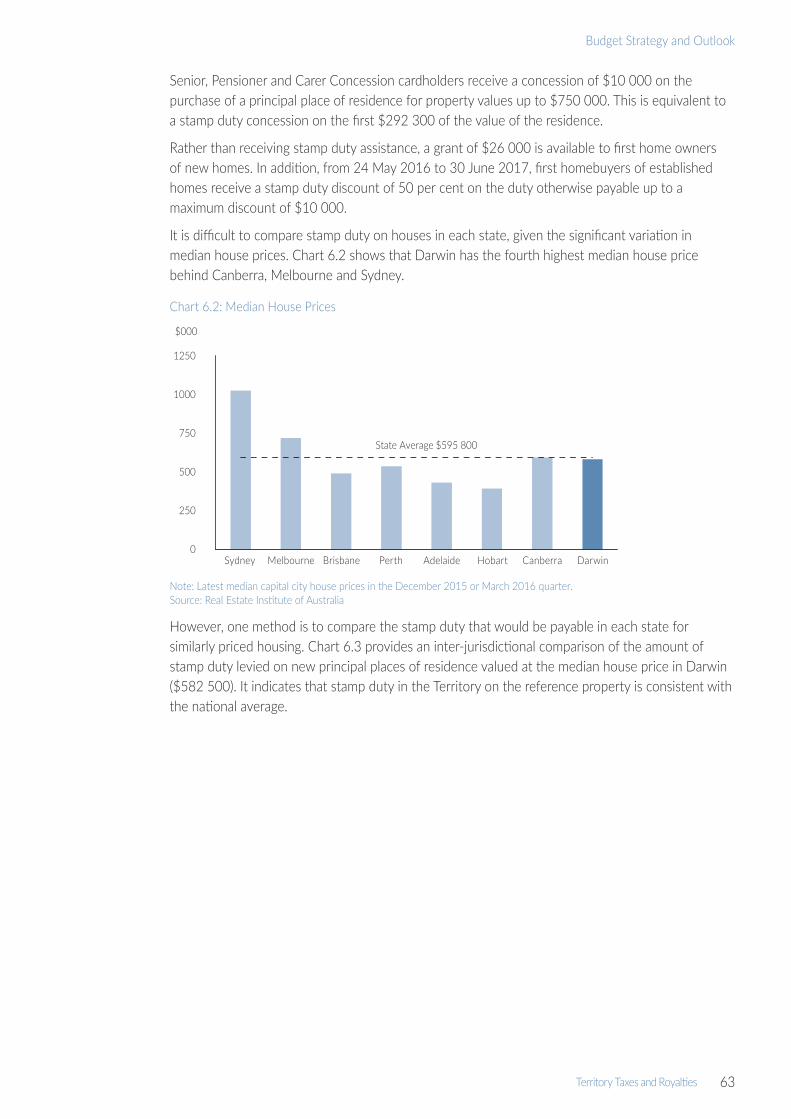
Territory Taxes and Royalties 63
Budget Strategy and Outlook
Senior, Pensioner and Carer Concession cardholders receive a concession of $10 000 on the purchase of a principal place of residence for property values up to $750 000. This is equivalent to a stamp duty concession on the first $292 300 of the value of the residence.
Rather than receiving stamp duty assistance, a grant of $26 000 is available to first home owners of new homes. In addition, from 24 May 2016 to 30 June 2017, first homebuyers of established homes receive a stamp duty discount of 50 per cent on the duty otherwise payable up to a maximum discount of $10 000.
It is difficult to compare stamp duty on houses in each state, given the significant variation in median house prices. Chart 6.2 shows that Darwin has the fourth highest median house price behind Canberra, Melbourne and Sydney.
Chart 6.2: Median House Prices
Note: Latest median capital city house prices in the December 2015 or March 2016 quarter.Source: Real Estate Institute of Australia
However, one method is to compare the stamp duty that would be payable in each state for similarly priced housing. Chart 6.3 provides an inter‑jurisdictional comparison of the amount of stamp duty levied on new principal places of residence valued at the median house price in Darwin ($582 500). It indicates that stamp duty in the Territory on the reference property is consistent with the national average.
0
250
500
750
1000
1250
Sydney Melbourne Brisbane Perth Adelaide Hobart Canberra Darwin
State Average $595 800
$000

64 Territory Taxes and Royalties
2016-17 Budget
Chart 6.3: Stamp Duty Payable on Purchase of Darwin Median‑Priced New House
Source: Real Estate Institute of Australia; state legislation and information available at 3 May 2016
Insurance DutyAs shown in Chart 6.4, the Territory is an average taxing jurisdiction for insurance. By comparison, the total tax load on insurance in New South Wales and Tasmania is significantly above the national average when fire service levies are taken into account.
All states impose taxes on general insurance premiums at rates between 9 per cent and 11 per cent, with New South Wales, Queensland and Tasmania having special rates on particular classes of general insurance business. The only exception is the Australian Capital Territory with tax at 2 per cent until 1 July 2016, when it will abolish insurance duty. All states, apart from Western Australia and the Northern Territory, also impose taxes on life insurance policies at different rates. In addition, New South Wales and Tasmania collect a portion of their fire service levies through a charge on insurers. While Tasmania raises a levy on insurance, a large proportion of the levy is sourced from a charge on property owners through local councils, which is similar to Victoria, Queensland, South Australia and Western Australia. The Territory does not impose any emergency or fire service levies on the general public, although, like the states, it does charge for commercial fire alarm monitoring.
Chart 6.4: Average State Tax Rate on General Insurance Premiums
Source: State legislation and information available at 3 May 2016
0
4
8
12
16
20
24
28
32
NSW Vic Qld WA SA Tas ACT NT
$000
Average stamp duty: $21 706
0
5
10
15
20
25
30
35
40
45
NSW Vic Qld WA SA Tas ACT NT
%
Stamp duty Fire service levy
State average including fire service levy State average
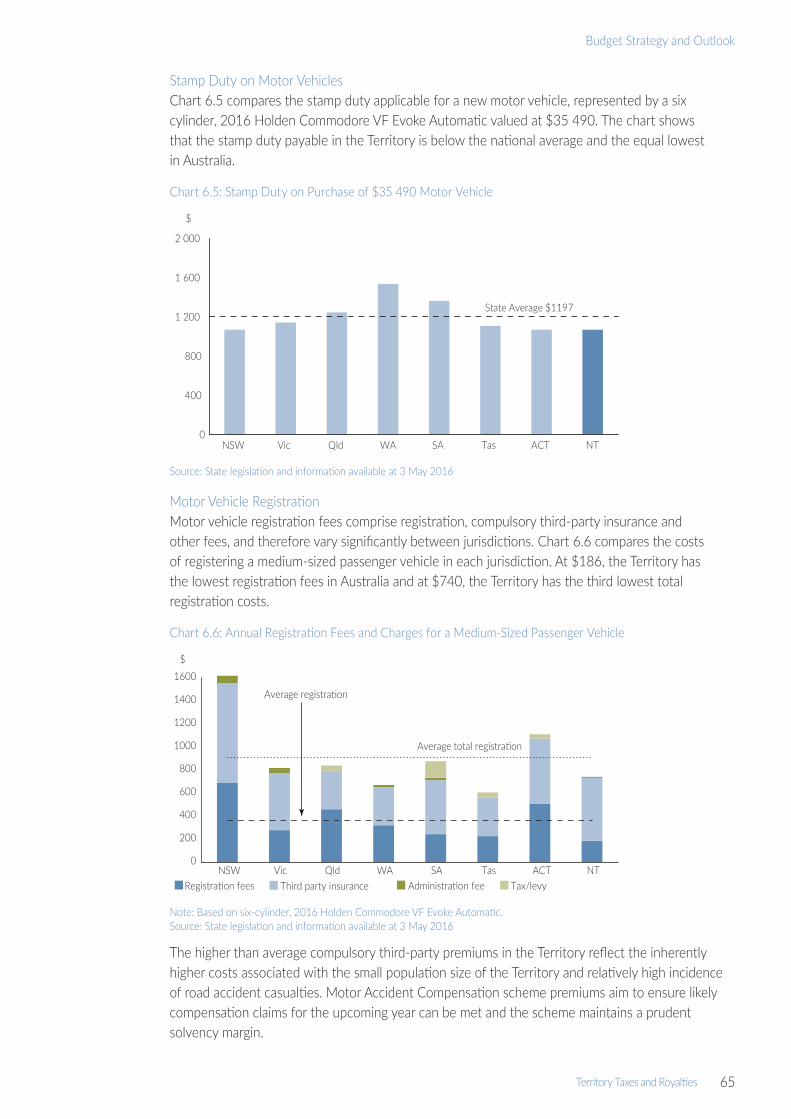
Territory Taxes and Royalties 65
Budget Strategy and Outlook
Stamp Duty on Motor Vehicles Chart 6.5 compares the stamp duty applicable for a new motor vehicle, represented by a six cylinder, 2016 Holden Commodore VF Evoke Automatic valued at $35 490. The chart shows that the stamp duty payable in the Territory is below the national average and the equal lowest in Australia.
Chart 6.5: Stamp Duty on Purchase of $35 490 Motor Vehicle
Source: State legislation and information available at 3 May 2016
Motor Vehicle Registration Motor vehicle registration fees comprise registration, compulsory third‑party insurance and other fees, and therefore vary significantly between jurisdictions. Chart 6.6 compares the costs of registering a medium‑sized passenger vehicle in each jurisdiction. At $186, the Territory has the lowest registration fees in Australia and at $740, the Territory has the third lowest total registration costs.
Chart 6.6: Annual Registration Fees and Charges for a Medium‑Sized Passenger Vehicle
Note: Based on six‑cylinder, 2016 Holden Commodore VF Evoke Automatic.Source: State legislation and information available at 3 May 2016
The higher than average compulsory third‑party premiums in the Territory reflect the inherently higher costs associated with the small population size of the Territory and relatively high incidence of road accident casualties. Motor Accident Compensation scheme premiums aim to ensure likely compensation claims for the upcoming year can be met and the scheme maintains a prudent solvency margin.
0
400
800
1 200
1 600
2 000
NSW Vic Qld WA SA Tas ACT NT
$
State Average $1197
0
200
400
600
800
1000
1200
1400
1600
NSW Vic Qld WA SA Tas ACT NT
$
Registration fees Third party insurance Administration fee Tax/levy
Average registration
Average total registration

66 Territory Taxes and Royalties
2016-17 Budget
Despite this, total registration costs in the Territory are still the third lowest in Australia and significantly below the national average. This is due to the low registration fees and that the Territory does not, unlike some jurisdictions, also add ancillary taxes and levies. These additional levies imposed in other jurisdictions include fire and emergency service levies, motor taxes, traffic improvement levies and road safety contributions.
Land Revenue This category includes taxes on the ownership of land, where the tax is based on the assessed unimproved value of the land. It also includes any metropolitan land planning, development and fire and emergency service levies included in the land tax base of some states.
Land tax is an important source of income for states, estimated to generate more than $7.2 billion in revenue in 2015‑16. Land tax is levied on the landowner’s total holdings of commercial land and investment residential property, although generally an exclusion is provided for land used for primary production. Land tax rates are generally progressive and most jurisdictions have tax‑free thresholds.
The Territory does not impose a land tax. However, in its 2016 Update, the CGC assessed that the Territory could raise about $66 million if it adopted the average state policies on land tax.
Tax Expenditure StatementTax concessions are often provided to benefit a specified activity or class of taxpayer. They are expenditures in the sense that their impact on the budget is similar to direct outlays and can be used to achieve similar goals to grant programs.
Tax expenditure can be provided in a variety of ways, including by way of exemption, deduction, rebate or a concessionary tax rate.
The tax expenditure statement details revenue estimated to be forgone by the Government or financial benefits obtained by taxpayers as a result of tax exemptions or concessions provided. Identifying this expenditure assists in providing a more accurate picture of the Government’s contributions by way of taxation concessions to assist various groups or industries.
The tax expenditure identified in this statement relates to the more important and material concessions available in the Territory. In accordance with FITA, the tax expenditure statement provides an estimate of expenditure in 2015‑16, and forecast information for 2016‑17 and the following three financial years.
MethodologyTax expenditure has been estimated by applying the benchmark rate of taxation to the forecast volume of activities or assets exempted by a particular concession. Only future events certain or highly likely to affect assumed tax bases or tax rates have been considered in estimating future tax expenditure. Otherwise, existing taxation arrangements are assumed to apply for future years.
Measuring tax expenditure requires the identification of:
•a benchmark tax base;
•concessionary taxed components of the benchmark tax base, such as specific activity or class of taxpayer; and
•a benchmark tax rate to apply to the concessionary taxed components of the tax base.
The establishment of a benchmark tax base provides a basis against which each tax concession can be evaluated. The aim of the benchmark is to determine which concessions are tax expenditures rather than structural elements of the tax.

Territory Taxes and Royalties 67
Budget Strategy and Outlook
By definition, tax expenditure comprises those tax concessions not included as part of the benchmark tax base.
Payroll TaxThe benchmark tax base for payroll tax is assumed to be all wages (as defined under the payroll tax legislation) paid in the Territory. The benchmark tax rate is 5.5 per cent.
Table 6.8: Payroll Tax Expenditure
2015‑16 2016‑17 2017‑18 2018‑19 2019‑20
Tax expenditure ($M) 209.0 214.0 219.0 224.2 229.5
Source: Department of Treasury and Finance
As data is not generally collected from employers that do not have a payroll tax liability, tax expenditure in relation to many payroll tax concessions is difficult to estimate. Accordingly, the reported estimated tax expenditure outlined in Table 6.8 was calculated by adding recorded tax concessions to a figure derived by comparing Australian Taxation Office data about wages paid by employers in the Territory to data reported by employers registered for payroll tax in the Territory. The difference provides a reasonable estimate of wages paid by non‑registered employers not subject to Territory payroll tax because of the small business exclusion (detailed below).
The reported estimated tax expenditure in relation to payroll tax mainly comprises the following exemptions.
Small Business ExclusionEmployers with wages below $1.5 million are not required to pay payroll tax, a saving of up to $82 500. Employers with payrolls over $1.5 million receive a deduction of up to $1.5 million, which reduces by $1 for every $4 in wages paid by the employer where the wages paid by the employer exceeds $1.5 million. This means employers with wages of $7.5 million or more will not receive a deduction and will pay payroll tax on the total wages paid by the employer.
Charities and Other Exempt BodiesNon‑profit organisations having a sole or dominant purpose that is charitable, benevolent, philanthropic or patriotic, are exempt from payroll tax to the extent that wages are paid for an employee’s services relating directly to the purpose for which the organisation was established. In addition, employment agencies providing temporary staff to exempt organisations are able to claim payroll tax exemptions for these wages.
Stamp Duty on ConveyancesThe benchmark tax base is assumed to be sales of all dutiable property, including chattels that are part of a transaction that conveys other dutiable property. The benchmark tax scale is the currently applicable stamp duty scale.
Table 6.9: Stamp Duty on Conveyances Expenditure
2015‑16 2016‑17 2017‑18 2018‑19 2019‑20
Tax expenditure ($M) 14.1 12.4 7.1 7.3 7.5
Source: Department of Treasury and Finance
Tax expenditure estimates in Table 6.9 are based on an historical revenue base indexed by normal growth parameters and mainly comprise the following concessions.

68 Territory Taxes and Royalties
2016-17 Budget
Corporate Reconstructions ExemptionCorporate groups formed by commonly owned corporations are able to reorganise the ownership of assets without incurring a stamp duty liability. The estimated tax expenditure is the actual stamp duty foregone for approved reconstruction exemptions.
Principal Place of Residence RebateHomebuyers who purchase a new home are entitled to a rebate of $7000 when purchasing a principal place of residence. Tax expenditure is estimated by actual collections in relation to the rebate.
Senior, Pensioner and Carer ConcessionA concession of $10 000 is provided for Senior, Pensioner and Carer Concession cardholders when purchasing a principal place of residence to the value of $750 000. Tax expenditure is estimated by actual collections in relation to the rebate.
First Home Owner DiscountFrom 24 May 2016 to 30 June 2017, first homebuyers of established homes receive a stamp duty discount of 50 per cent on the duty otherwise payable to a maximum discount of $10 000.
Other Conveyance Duty ExemptionsSeveral other conveyance stamp duty exemptions are provided that together result in significant revenue foregone by the Territory, the largest of these being exemptions for:
•property transferred to charitable organisations having a sole or dominant purpose that is charitable, benevolent, philanthropic or patriotic;
•the transfer of a company’s property, on its winding up, to a shareholder of the company entitled to the property on a distribution in‑kind;
•an exemption under the Commonwealth Family Law Act for instruments made pursuant to a court order that alter the interests of the parties to a marriage or de facto partnership; and
•the conveyance of property between partners of a de facto relationship on the breakdown of the relationship.
The estimated tax expenditure for these concessions is based on actual historical data collected in relation to the various exemptions granted and how these relate to overall conveyance stamp duty collections.
Stamp Duty on General Insurance PoliciesThe benchmark tax base is all classes of general insurance policies. This does not include life insurance policies, which are treated differently for stamp duty purposes. The benchmark tax rate is 10 per cent of the premium.
Table 6.10: Stamp Duty on General Insurance
2015‑16 2016‑17 2017‑18 2018‑19 2019‑20
Tax expenditure ($M) 25.3 25.5 25.8 26.0 26.2
Source: Department of Treasury and Finance
The Territory provides stamp duty concessions on certain insurance products to reduce the costs of such insurance, namely workers compensation insurance and private health insurance. Tax expenditure outlined in Table 6.10 has been estimated using total work health insurance policy premiums paid during past years compared to total payroll data of employers in the Territory and data on private health insurance premiums obtained from the Private Health Insurance Administration Council.

Territory Taxes and Royalties 69
Budget Strategy and Outlook
Motor Vehicle Registration FeesMotor vehicle registration concessions are available under the Northern Territory Pensioner and Carer Concession Scheme and to Northern Territory Seniors cardholders. Table 6.11 shows the motor vehicle registration fees expenditure. Actual registration fee data has been used to estimate this item of tax expenditure.
Table 6.11: Motor Vehicle Registration Fees Expenditure
2015‑16 2016‑17 2017‑18 2018‑19 2019‑20
Tax expenditure ($M) 2.7 2.7 2.7 2.7 2.7
Source: Department of Treasury and Finance

70
2016-17 Budget

The Territory Economy 71
Budget Strategy and Outlook
Chapter 7The Territory EconomyOverview
This overview section is a summarised assessment of the Northern Territory economy, including a brief description of recent performance and outlook across a number of key indicators including: economic growth, the structure of the economy, the external economic environment, population, labour market, and prices and wages. Table 7.1 shows the key economic indicators for the Territory, including forecasts for the budget and forward estimates period.
Table 7.1: Territory Key Economic Indicators (%)
2014‑15 2015‑16e 2016‑17f 2017‑18f 2018‑19f 2019‑20f
Gross state product1 10.5 2.1 1.5 5.0 4.1 3.8
State final demand1 8.3 ‑ 5.4 ‑ 2.3 ‑ 1.8 3.9 3.7
Population2 0.1 0.6 1.0 1.0 1.3 1.5
Employment3 ‑ 0.6 1.5 0.3 0.7 0.7 0.8
Unemployment rate4 4.2 4.6 4.4 4.4 4.7 4.7
Consumer price index3 1.4 ‑ 0.3 0.7 1.6 2.1 2.6
Wage price index3 2.6 2.2 1.9 2.3 2.5 2.7
e: estimate; f: forecast1 Year ended June, year‑on‑year percentage change, inflation adjusted.2 As at December, annual percentage change.3 Year ended June, year‑on‑year percentage change.4 Year average.Source: Department of Treasury and Finance, Australian Bureau of Statistics
Structure of the EconomyThe structure of the Territory economy is markedly different to the national economy, reflecting the Territory’s abundant natural resources, relatively large public sector and defence presence, and a small open economy that is significantly influenced by major projects.
The Territory economy has grown considerably over the past decade. Total gross state product (GSP) has grown from $15 billion in 2004‑05 to over $22 billion in 2014‑15, which represents an increase of nearly 50 per cent, with population increasing by an additional 40 000 people to just under 245 000 over this period. The Territory’s labour force has also expanded over this period, increasing by around 35 000 to nearly 140 000.
There has been a rapid expansion of the role that investment plays in driving the Territory’s economy, with investment contributing 48 per cent of state final demand in 2014‑15, compared to less than 30 per cent five years ago. Private investment represented 89 per cent of total investment in 2014‑15, compared to 74 per cent five years ago.
In recent years, largely due to the effect of major infrastructure projects, construction has overtaken mining as the largest single industry in the Territory. Construction, mining and manufacturing, and government and community services, combine to account for about half of the Territory’s GSP, compared to about a third of national gross domestic product (GDP) (Chart 7.1).

72 The Territory Economy
2016-17 Budget
Chart 7.1: Contributions to GSP, 2014‑15
GSP: gross state product1 Government and community services includes public administration and safety; education and training; and health care and
social assistance industries.2 Non‑industry components of GSP include ownership of dwellings, taxes less subsidies and statistical discrepancy.Source: ABS, Australian National Accounts: State Accounts, Cat. No. 5220.0
From 2016‑17, the Territory economy faces a range of challenges following a sustained period of record growth across most key industries. As the effect of large resource‑based projects move beyond their peak growth, GSP, business investment, employment and population are expected to moderate in the short term, from historical highs.
Despite these challenges, the Territory is well positioned to take advantage of a number of opportunities likely to re‑shape the structure of the Territory economy throughout the forecast period and into the next decade. The Territory’s position as a gateway to Asia, a key defence hub, world renowned tourist attractions and a rich diversity of mineral, gas, petroleum and agricultural resources, all provide the strategic opportunities required to underpin future growth. These strategic advantages also provide opportunities for growth in service industries such as health, education and research.
Economic GrowthThe Territory economy expanded by 10.5 per cent in 2014‑15, the highest rate of growth since 1998‑99. It was also the highest rate of growth among all jurisdictions and was more than four times the national growth rate of 2.3 per cent (Chart 7.2).
Business investment continued to be the major driver of economic growth in 2014‑15, increasing by 18.7 per cent, the fourth consecutive year of strong growth. The continued increase in business investment in 2014‑15 was driven by work on major projects, including the Ichthys liquefied natural gas (LNG) project and the Twin Bonanza gold project in the Tanami region. The value of business investment is expected to moderate to more historical levels over the coming years.
Growth in household consumption continued to slow in 2014‑15, increasing by 1.6 per cent compared to 2.0 per cent in the previous year. This was broadly in line with low population growth and a subdued labour market in 2014‑15.
Territory economic growth is expected to slow considerably to 2.1 per cent in 2015‑16, reflecting a marked decline in private investment compared to the record levels reached the previous year, as
Otherservices(24.3%)
Agriculture, forestry and fishing (1.5%)
Construction (21.6%)
Government and community services1 (19.0%)
Rental, hiring and real estate services (4.5%)
Transport, postal and warehousing (4.5%)Professional, scientific and technical services (3.2%)
Financial and insurance services (2.5%)Administrative and support services (2.4%)
Electricity, gas and water (1.9%)Accommodation and food services (1.7%)Arts and recreation services (1.1%)
Other services (1.5%)
Mining and manufacturing (14.9%)
Retail and wholesale trade (4.3%)
Information media, telecommunications (1.0%)
Non-industry2 (14.3%)

The Territory Economy 73
Budget Strategy and Outlook
well as slower growth in household consumption. However, this follows a sustained period of strong economic growth, with GSP increasing by about 50 per cent since 2004‑05.
Growth is expected to moderate slightly in 2016‑17 as work on the Ichthys LNG project nears completion and dwelling investment remains subdued.
Chart 7.2: Change in GSP and GDP1
GSP: gross state product; GDP: gross domestic product1 Inflation adjusted.Source: ABS, Australian National Accounts: State Accounts, Cat. No. 5220.0
InvestmentThe balance between consumption and investment in the Territory has shifted over the past few years following high levels of activity associated with major projects. In 2014‑15, investment increased by 16.8 per cent, the fourth consecutive year of strong growth. As a result, investment contributed 48 per cent of state final demand in the year, compared to its average contribution over the past 20 years of around 30 per cent (Chart 7.3).
Chart 7.3: Territory Investment and Consumption as a Proportion of State Final Demand1
1 Current prices.Source: ABS, Australian National Accounts: State Accounts, Cat. No. 5220.0
0
2
4
6
8
10
12
NSW Vic SA Tas ACTQld WA NT Aust2013-14 2014-15
%
0102030405060708090
100
95 96 97 98 99 00 01 02 03 04 05 06 07 08 09 10 11 12 13 14 15
Private consumption Public consumption Public investment Private investmentYear ended June
%

74 The Territory Economy
2016-17 Budget
Over the past few years, investment in the Territory has been driven by the construction industry and largely dominated by major projects in the resources sector. Work on these projects has either been completed, or is nearing completion. As a result, investment activity in the Territory is likely to slow over the coming years (Chart 7.4). However, there are a number of non‑resource projects currently underway, such as the Palmerston Regional Hospital, expansion works at the Owen Springs power station in Alice Springs, and upgrades to Alice Springs and Royal Darwin hospitals.
Chart 7.4: Territory Construction Work Done1 (moving annual total)
1 Inflation adjusted.Source: ABS, Construction Work Done, Cat. No. 8755.0
Residential construction activity is expected to contract in 2015‑16, largely as a result of a decline in the construction of units and townhouses. The decline follows a period of elevated levels of unit construction and is reflective of a return to the long‑term trend. House construction is expected to remain at elevated levels, reflecting continued land releases in a number of suburbs across the Territory.
Public investment is expected to contract in 2015‑16, as a result of the substantial impact the completion of the Darwin Correctional Centre had on the public investment results for 2014‑15 as reported by the Australian Bureau of Statistics (ABS). Nevertheless, public investment is expected to play an important role in supporting economic growth in the Territory in 2015‑16 and beyond, reflecting a number of Territory Government and defence infrastructure projects.
ConsumptionGrowth in household consumption is expected to soften in 2015‑16, resulting from subdued population growth over the year and a slowing housing market, reducing demand for consumer goods. However, this may be partly offset by an improvement in the Territory’s labour market over 2015‑16, which should support consumer confidence.
Over the medium term, growth in household consumption is expected to improve as the housing market and population growth begin to recover from recent lows. Growth in household consumption is expected to be supported by retail developments such as the new Gateway Shopping Centre in Palmerston and expansions at the Casuarina Square.
Growth in public consumption is expected to begin to return to longer‑term trend levels from 2015‑16, as national government consumption returns to growth following a period of decline. From 2016‑17, growth in public consumption is expected to be driven by the influence of initiatives such as Developing the North and the 2016 Defence White Paper, as well as the flow‑on effects from increased Territory Government infrastructure development.
0 1 2 3 4 5 6 7 8 9
10
00 01 02 03 04 05 06 07 08 09 10 11 12 13 14 15 16
$B
Year ended June
INPEX, Montara, mine expansions, Darwin Correctional Precinct
Blacktip,Montara,GEMCO
Alcan G3 refineryexpansion
DarwinLNG plant
Railway,Bayu -Undan gas field
INPEX workers' accommodation village
Engineering Non-residential Residential Total
The Territory Economy 75
Budget Strategy and Outlook
External Economic EnvironmentExternal influences both nationally and internationally can have a relatively large effect on the Territory economy. This is particularly prevalent, given the Territory’s relatively small size compared to other Australian jurisdictions and with a strong dependence on construction and mining as the major drivers of economic growth. These industries are typically dependent on overseas trade and investment and movements in global commodity prices.
National economic activity is also significant to the Territory, influencing changes to population, interstate trade, domestic tourism and the availability of workers to meet the Territory’s labour force needs. Further, domestic monetary policy set by the Reserve Bank of Australia (RBA) influences household consumption, business confidence and investment in the Territory,
From a global perspective, the Territory is strategically placed to benefit from strongly growing Asian economies, with Darwin located close to key Asian cities and the Territory’s major trading partners being China, Japan, Thailand, Indonesia and Vietnam. The global economy’s significance is largely reflected through overseas investment, international tourism and trade activity.
Global economic activity in 2015‑16 appears to be driven by three key influences, including a gradual slowdown and rebalancing of economic activity in China, steady growth in the United States, which has stimulated an appreciation in the US dollar, and a broad‑based decline in global commodity prices. These largely affected the Territory’s mining industry, with a number of mines closing in 2014‑15.
The IMF forecasts global growth of 3.2 per cent in 2016 and improving in the medium term. Growth in 2016 is largely attributed to emerging markets and developing economies (including China, India, Indonesia, Latin America and the Middle East), which are estimated to grow at 4.1 per cent in 2016. Growth in advanced economies (including the United States, the Euro area, Japan and the United Kingdom) is estimated at 1.9 per cent in 2016. Expectations for global growth also reflect expectations of continuing softness in commodity prices throughout the medium term.
The Australian economy is transitioning away from mining‑led growth. This is demonstrated in changes to GSP across jurisdictions over the past two years, with growth moderating in mining‑based states and strengthening in the southern and eastern states.
The 2016‑17 Commonwealth Budget forecasts economic growth in Australia to be 2.5 per cent in 2015‑16 and 2016‑17, increasing to 3.0 per cent in 2017‑18. This will likely be driven by investment from non‑resource sectors and domestic demand, as well as supported by low interest rates following the RBA lowering the cash rate to a record low of 1.75 per cent in May 2016. Performance of the national economy influences interstate trade, domestic tourism and employment.
International TradeIn 2014‑15, the Territory’s net international trade balance decreased to $1.2 billion, down from $3.4 billion in 2013‑14. This was driven by a decline in exports, largely as a result of decreases in world commodity prices for mining‑related products, as well as an increase in imports mainly related to construction of the Ichthys LNG project.
In 2015‑16, the value of the Territory’s net exports is expected to increase slightly. This is due to a combination of lower levels of imports, as fewer pre‑assembled modules for the Ichthys LNG project arrive, as well as higher levels of livestock and commodities exports (including an increase in exports from the Darwin LNG plant) in the year.

76 The Territory Economy
2016-17 Budget
From 2016‑17, imports into the Territory are expected to continue to contract as construction of the Ichthys LNG project nears completion, contributing to an increase in net exports. Exports from the Ichthys LNG project are expected to commence from 2017‑18. This will provide a substantial boost to Territory exports and is expected to be a key driver of economic growth in that year and to continue to support Territory net exports into the future.
PopulationThe Territory’s population, representing about 1 per cent of the total Australian population, resides in the third largest Australian jurisdiction by geographical area. The population is also relatively young, with a median age of 32.2 years, in comparison with 37.4 years for Australia. Population change within the Territory is characterised by volatility, mainly driven by movement of the non‑Indigenous population to and from the Territory, largely in response to employment opportunities within and outside the Territory.
The Territory’s estimated resident population was 244 307 people as at 30 June 2015, a 0.4 per cent increase from 30 June 2014. Annual growth in the Territory was below national growth over the same period (1.4 per cent), and below the Territory’s 20‑year average of 1.6 per cent.
At June 2015 population growth attributable to natural increase (births minus deaths) and net overseas migration (NOM) was partially offset by population loss from net interstate migration (NIM) (Chart 7.5). Natural increase is a stable contributor to annual population growth in the Territory and has been the major driver of growth over the past 20 years. NOM returned close to long‑term trend levels following record numbers of international arrivals in 2012‑13. NIM was close to its lowest level in 20 years, primarily attributable to a decline in interstate arrivals.
Population growth is forecast to remain slightly below the historical average over 2016 and 2017 at 1.0 per cent, before transitioning to 1.5 per cent around 2019, slightly below the long‑term average.
Chart 7.5: Components of Territory Population Growth (moving annual total)
Source: ABS, Australian Demographic Statistics, Cat. No. 3101.0
- 4
- 2
0
2
4
6
8
95 96 97 98 99 00 01 02 03 04 05 06 07 08 09 10 11 12 13 14 15
Total growth
Natural increase
Net overseas migration
Net interstate migration
Year ended June
Number (persons) (000)

The Territory Economy 77
Budget Strategy and Outlook
Labour MarketThe Territory consistently has low unemployment and high labour force participation compared to other Australian jurisdictions. These features mean the Territory is reliant on interstate and overseas workers to meet growth in the demand for labour associated with major projects and other economic activity.
The construction industry’s contribution to the Territory’s employment has been strong in recent years, with a high level of residential construction and construction associated with the Ichthys LNG project. However, labour market conditions in the Territory moderated in 2014‑15. Employment levels decreased by 0.6 per cent to an annual average of 131 350 (Chart 7.6). The decrease in employment is likely due to easing in the mining sector and a moderation in residential building activity.
In 2014‑15, the Territory’s average annual unemployment rate decreased by 0.2 percentage points to 4.2 per cent, recording the lowest annual average unemployment rate of all jurisdictions. The Territory’s participation rate averaged 74.2 per cent, while the national annual average rate was 64.8 per cent.
The construction phase of the Ichthys LNG project is expected to see employment continue to increase in the short term with this effect already showing in stronger year‑to‑date employment growth figures in 2015‑16. Employment growth for 2016‑17 is anticipated to be more modest, driven by smaller scale construction and strengthening growth in consumption as the Ichthys LNG project moves into the less labour‑intensive operational phase in 2017‑18.
The Territory’s unemployment rate is forecast to increase in 2015‑16 and return to historical trend levels in the medium term. Despite the forecast increase, the Territory’s unemployment rate is expected to remain one of the lowest of all jurisdictions.
Chart 7.6: Year‑on‑Year Change in Employment
Source: ABS, Labour Force, Australia, Cat. No. 6202.0
-2
0
2
4
6
8
06 07 08 09 10 11 12 13 14 15 16Year ended June
%
Territory
Australia

78 The Territory Economy
2016-17 Budget
Prices and WagesThe Darwin consumer price index (CPI) moderated from 3.7 per cent in 2013‑14 to 1.4 per cent in 2014‑15, primarily reflecting declines in the costs of transport (fuel and motor vehicle prices). The Darwin CPI is estimated to decline by 0.3 per cent in 2015‑16, based on the annual movement in the Darwin CPI to March 2016 (‑0.3 per cent), due to lower electricity prices, housing rents and transport costs.
Growth in the Darwin CPI is forecast to remain at modest levels through 2016‑17 to 2018‑19, returning towards the long‑term trend growth beyond 2019. The forecast of low growth in the Darwin CPI over the outlook period reflects the impact of moderate population and employment growth, along with lower input and labour costs, and continuing impact of lower fuel prices and housing conditions, particularly lower rents.
In 2014‑15, the Territory’s wage price index (WPI) recorded an increase of 2.6 per cent compared to 2.4 per cent nationally. WPI growth in the Territory reached historically low levels in 2014‑15, well below the 10‑year average increase of 3.6 per cent, mostly reflecting a decline in the private sector, consistent with softening demand for labour. Wage growth is expected to moderate to 2.2 per cent in 2015‑16, and remain subdued over the medium term, following the forecast slowdown in employment growth and the moderation in CPI.

Uniform Presentation Framework 79
Budget Strategy and Outlook
Chapter 8Uniform Presentation Framework
Under the Uniform Presentation Framework (UPF), the Commonwealth, state and territory governments have agreed to publish information in a standard format in their budget papers. The UPF is based on accounting standard AASB 1049 Whole of Government and General Government Sector Financial Reporting, which harmonises Government Finance Statistics and generally accepted accounting principles with the objective of improving the clarity and transparency of government financial statements.
The harmonised standard means that government financial reports are now presented on the same basis by all jurisdictions, resulting in greater transparency and consistency.
The Fiscal Integrity and Transparency Act requires that fiscal outlook reports be prepared in accordance with external reporting standards, including the Australian Accounting Standards or the UPF.
The tables in this chapter meet the Territory’s reporting obligations under both the Fiscal Integrity and Transparency Act and the UPF. They include, for each sector of government, a:
•Comprehensive Operating Statement;
•Balance Sheet; and
•Cash Flow Statement.
Also included are supplementary tables for the general government sector presenting:
•taxes;
•grant revenue and expenses;
•dividend and income tax equivalent income;
•general government operating expenses by function; and
•a revised 2016-17 Loan Council Allocation.
The financial statements for the general government, public non financial corporation and non financial public sectors include the revised 2015-16 Estimate, 2016-17 Budget and 2017-18 to 2019-20 Forward Estimates. The statements for the public financial corporation sector and total public sector present the 2015-16 Estimate only, with the remaining supplementary tables presenting both the 2015-16 Estimate and the 2016-17 Budget.

80 Uniform Presentation Framework
2016-17 Budget
Table 8.1
General Government Sector Comprehensive Operating Statement 2015-16 2016-17 2017-18 2018-19 2019-20
Estimate Budget Forward Estimates
$000 $000 $000 $000 $000
REVENUE
Taxation revenue 611 925 586 893 605 403 621 549 638 265
Current grants 4 368 487 4 238 247 4 266 900 4 344 081 4 601 663
Capital grants 340 056 370 982 190 499 34 705 15 615
Sales of goods and services 420 913 380 001 404 413 408 047 407 815
Interest income 92 011 88 037 89 704 92 209 94 330
Dividend and income tax equivalent income 92 285 53 426 61 295 47 885 93 360
Other revenue 249 419 173 619 172 996 172 761 171 610
TOTAL REVENUE 6 175 096 5 891 205 5 791 210 5 721 237 6 022 658
less EXPENSES
Employee benefits expense 2 115 269 2 166 756 2 224 490 2 261 868 2 335 196
Superannuation expenses
Superannuation interest cost 138 337 133 639 129 094 128 080 128 080
Other superannuation expenses 202 224 203 062 204 476 206 149 207 711
Depreciation and amortisation 323 535 331 062 330 946 328 956 327 636
Other operating expenses 1 526 827 1 462 984 1 498 959 1 516 316 1 564 782
Interest expenses 233 495 211 608 214 525 226 071 229 321
Other property expenses
Current grants 912 630 922 874 899 213 846 311 924 021
Capital grants 258 563 128 435 39 599 20 665 32 064
Subsidies and personal benefit payments 222 211 260 526 268 526 242 724 250 455
TOTAL EXPENSES 5 933 091 5 820 946 5 809 828 5 777 140 5 999 266
equals NET OPERATING BALANCE 242 005 70 259 ‑ 18 618 ‑ 55 903 23 392
plus Other economic flows – included in operating result
276 31 626 32 502 33 962 34 918
equals OPERATING RESULT 242 281 101 885 13 884 ‑ 21 941 58 310
plus Other economic flows – other comprehensive income
- 819 961 186 662 166 653 146 816 1 525
equals COMPREHENSIVE RESULT – total change in net worth before transactions with owners in their capacity as owners
‑ 577 680 288 547 180 537 124 875 59 835
NET OPERATING BALANCE 242 005 70 259 ‑ 18 618 ‑ 55 903 23 392
less Net acquisition of non financial assets
Purchases of non financial assets 836 869 1 125 536 764 130 487 889 374 710
Sales of non financial assets - 71 854 - 84 874 - 69 723 - 62 117 - 73 187
less Depreciation 323 535 331 062 330 946 328 956 327 636
plus Change in inventories
plus Other movements in non financial assets - 52 873
equals Total net acquisition of non financial assets 388 607 709 600 363 461 96 816 ‑ 26 113
equals FISCAL BALANCE ‑ 146 602 ‑ 639 341 ‑ 382 079 ‑ 152 719 49 505
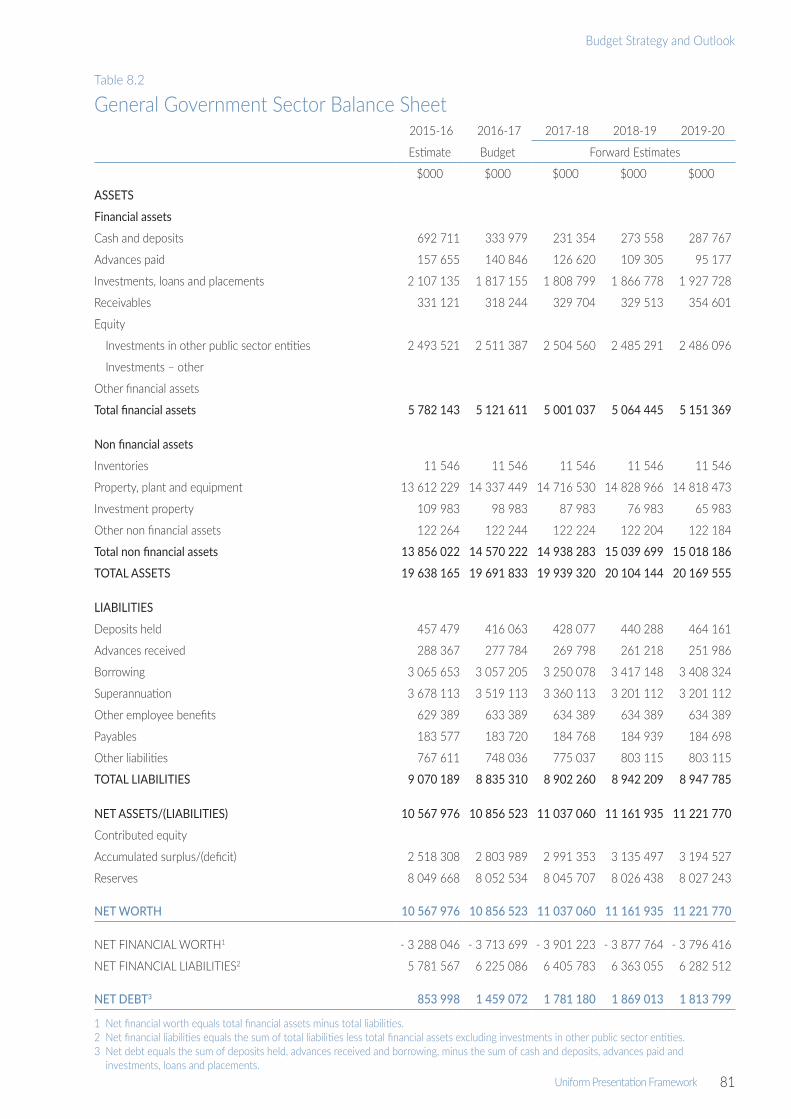
Uniform Presentation Framework 81
Budget Strategy and Outlook
Table 8.2
General Government Sector Balance Sheet 2015-16 2016-17 2017-18 2018-19 2019-20
Estimate Budget Forward Estimates
$000 $000 $000 $000 $000
ASSETS
Financial assets
Cash and deposits 692 711 333 979 231 354 273 558 287 767
Advances paid 157 655 140 846 126 620 109 305 95 177
Investments, loans and placements 2 107 135 1 817 155 1 808 799 1 866 778 1 927 728
Receivables 331 121 318 244 329 704 329 513 354 601
Equity
Investments in other public sector entities 2 493 521 2 511 387 2 504 560 2 485 291 2 486 096
Investments – other
Other financial assets
Total financial assets 5 782 143 5 121 611 5 001 037 5 064 445 5 151 369
Non financial assets
Inventories 11 546 11 546 11 546 11 546 11 546
Property, plant and equipment 13 612 229 14 337 449 14 716 530 14 828 966 14 818 473
Investment property 109 983 98 983 87 983 76 983 65 983
Other non financial assets 122 264 122 244 122 224 122 204 122 184
Total non financial assets 13 856 022 14 570 222 14 938 283 15 039 699 15 018 186
TOTAL ASSETS 19 638 165 19 691 833 19 939 320 20 104 144 20 169 555
LIABILITIES
Deposits held 457 479 416 063 428 077 440 288 464 161
Advances received 288 367 277 784 269 798 261 218 251 986
Borrowing 3 065 653 3 057 205 3 250 078 3 417 148 3 408 324
Superannuation 3 678 113 3 519 113 3 360 113 3 201 112 3 201 112
Other employee benefits 629 389 633 389 634 389 634 389 634 389
Payables 183 577 183 720 184 768 184 939 184 698
Other liabilities 767 611 748 036 775 037 803 115 803 115
TOTAL LIABILITIES 9 070 189 8 835 310 8 902 260 8 942 209 8 947 785
NET ASSETS/(LIABILITIES) 10 567 976 10 856 523 11 037 060 11 161 935 11 221 770
Contributed equity
Accumulated surplus/(deficit) 2 518 308 2 803 989 2 991 353 3 135 497 3 194 527
Reserves 8 049 668 8 052 534 8 045 707 8 026 438 8 027 243
NET WORTH 10 567 976 10 856 523 11 037 060 11 161 935 11 221 770
NET FINANCIAL WORTH1 - 3 288 046 - 3 713 699 - 3 901 223 - 3 877 764 - 3 796 416
NET FINANCIAL LIABILITIES2 5 781 567 6 225 086 6 405 783 6 363 055 6 282 512
NET DEBT3 853 998 1 459 072 1 781 180 1 869 013 1 813 799
1 Net financial worth equals total financial assets minus total liabilities.2 Net financial liabilities equals the sum of total liabilities less total financial assets excluding investments in other public sector entities.3 Net debt equals the sum of deposits held, advances received and borrowing, minus the sum of cash and deposits, advances paid and
investments, loans and placements.

82 Uniform Presentation Framework
2016-17 Budget
Table 8.3
General Government Sector Cash Flow Statement2015-16 2016-17 2017-18 2018-19 2019-20 Estimate Budget Forward Estimates
$000 $000 $000 $000 $000Cash receipts from operating activitiesTaxes received 611 775 586 893 605 403 621 549 638 265Receipts from sales of goods and services 353 211 311 389 336 301 339 442 339 403Grants and subsidies received 4 708 543 4 609 229 4 457 399 4 378 786 4 617 278Interest receipts 92 011 88 037 89 704 92 209 94 330Dividends and income tax equivalents 92 812 73 888 56 812 55 999 68 272Other receipts 465 457 398 024 397 537 397 526 394 987Total operating receipts 6 323 809 6 067 460 5 943 156 5 885 511 6 152 535Cash payments for operating activitiesPayments for employees - 2 408 197 - 2 471 775 - 2 539 694 - 2 586 127 - 2 667 381Payment for goods and services - 1 665 232 - 1 648 705 - 1 637 212 - 1 654 841 - 1 722 773Grants and subsidies paid - 1 331 786 - 1 311 669 - 1 207 338 - 1 109 700 - 1 206 540Interest paid - 233 814 - 211 760 - 214 526 - 226 277 - 229 433Other payments Total operating payments ‑ 5 639 029 ‑ 5 643 909 ‑ 5 598 770 ‑ 5 576 945 ‑ 5 826 127NET CASH FLOWS FROM OPERATING ACTIVITIES 684 780 423 551 344 386 308 566 326 408Cash flows from investments in non financial assetsSales of non financial assets 71 854 84 874 69 723 62 117 73 187Purchases of non financial assets - 836 869 -1 125 536 - 764 130 - 487 889 - 374 710Net cash flows from investments in non financial assets ‑ 765 015 ‑1 040 662 ‑ 694 407 ‑ 425 772 ‑ 301 523NET CASH FROM OPERATING ACTIVITIES AND INVESTMENTS IN NON FINANCIAL ASSETS
‑ 80 235 ‑ 617 111 ‑ 350 021 ‑ 117 206 24 885
Net cash flows from investments in financial assets for policy purposes1
443 536 1 809 14 226 17 315 14 128
Net cash flows from investments in financial assets for liquidity purposes
194 188 317 017 36 269 - 28 606 - 30 621
NET CASH FLOWS FROM INVESTING ACTIVITIES - 127 291 - 721 836 - 643 912 - 437 063 - 318 016Net cash flows from financing activitiesAdvances received (net) - 37 948 - 10 583 - 7 986 - 8 580 - 9 232Borrowing (net) - 645 590 - 8 448 192 873 167 070 - 8 824Deposits received (net) 208 389 - 41 416 12 014 12 211 23 873Other financing (net) NET CASH FLOWS FROM FINANCING ACTIVITIES - 475 149 - 60 447 196 901 170 701 5 817NET INCREASE/DECREASE IN CASH HELD 82 340 - 358 732 - 102 625 42 204 14 209Net cash flows from operating activities 684 780 423 551 344 386 308 566 326 408Net cash flows from investments in non financial assets - 765 015 -1 040 662 - 694 407 - 425 772 - 301 523CASH SURPLUS (+)/DEFICIT (‑) ‑ 80 235 ‑ 617 111 ‑ 350 021 ‑ 117 206 24 885Future infrastructure and superannuation contributions/ earnings2
- 21 526 - 24 441 - 25 907 - 27 461 - 29 109
UNDERLYING SURPLUS (+)/DEFICIT (‑) ‑ 101 761 ‑ 641 552 ‑ 375 928 ‑ 144 667 ‑ 4 224Additional information to the Cash Flow StatementCASH SURPLUS (+)/DEFICIT (-) - 80 235 - 617 111 - 350 021 - 117 206 24 885Acquisitions under finance leases and similar arrangements ABS GFS SURPLUS (+)/DEFICIT (-) including finance leases and similar arrangements
- 80 235 - 617 111 - 350 021 - 117 206 24 885
1 Includes equity acquisitions, disposals and privatisations (net).2 Contributions for future infrastructure and superannuation requirements.

Uniform Presentation Framework 83
Budget Strategy and Outlook
Table 8.4
Public Non Financial Corporation Sector Comprehensive Operating Statement2015-16 2016-17 2017-18 2018-19 2019-20
Estimate Budget Forward Estimates
$000 $000 $000 $000 $000
REVENUE
Current grants 148 596 187 757 192 863 164 327 171 201
Capital grants 104 705 45 145 31 585 26 340 24 023
Sales of goods and services 703 351 687 368 730 515 780 305 824 343
Interest income 4 256 3 797 3 293 3 216 3 544
Other revenue 28 095 31 709 29 025 32 599 36 665
TOTAL REVENUE 989 003 955 776 987 281 1 006 787 1 059 776
less EXPENSES
Employee benefits expense 111 803 107 340 95 457 90 991 89 250
Superannuation expenses 16 324 16 905 17 096 16 934 16 934
Depreciation and amortisation 180 061 190 090 198 680 203 220 209 006
Other operating expenses 491 725 514 106 544 852 589 321 574 637
Interest expenses 66 424 68 189 72 683 72 174 76 663
Other property expenses 33 974 19 306 24 434 20 637 42 542
Current grants 500 225 231 237 243
Capital grants
Subsidies and personal benefit payments 1 824 1 907 1 898 1 941 1 984
TOTAL EXPENSES 902 635 918 068 955 331 995 455 1 011 259
equals NET OPERATING BALANCE 86 368 37 708 31 950 11 332 48 517
plus Other economic flows – included in operating result - 45 899 - 12 367 - 11 519 - 10 047 - 3 956
equals OPERATING RESULT 40 469 25 341 20 431 1 285 44 561
plus Other economic flows – other comprehensive income
- 1 118 057 - 34 - 74 - 3 - 23
equals COMPREHENSIVE RESULT – total change in net worth before transactions with owners in their capacity as owners
‑ 1 077 588 25 307 20 357 1 282 44 538
NET OPERATING BALANCE 86 368 37 708 31 950 11 332 48 517
less Net acquisition of non financial assets
Purchases of non financial assets 228 891 335 774 210 262 165 883 227 043
Sales of non financial assets - 1 026 - 154 - 1 359 - 1 359
less Depreciation 180 061 190 090 198 680 203 220 209 006
plus Change in inventories - 8 328 6 344 5 275 5 290 5 305
plus Other movements in non financial assets 14 675 18 740 19 228 19 729 19 965
equals Total net acquisition of non financial assets 55 177 169 742 35 931 ‑ 13 677 41 948
equals FISCAL BALANCE 31 191 ‑ 132 034 ‑ 3 981 25 009 6 569

84 Uniform Presentation Framework
2016-17 Budget
Table 8.5
Public Non Financial Corporation Sector Balance Sheet 2015-16 2016-17 2017-18 2018-19 2019-20
Estimate Budget Forward Estimates
$000 $000 $000 $000 $000
ASSETS
Financial assets
Cash and deposits 203 438 167 588 178 285 189 384 208 250
Advances paid
Investments, loans and placements
Receivables 192 585 168 121 165 541 170 490 177 171
Equity 3 3 3 3 3
Other financial assets
Total financial assets 396 026 335 712 343 829 359 877 385 424
Non financial assets
Inventories 176 922 183 266 188 541 193 831 199 136
Property, plant and equipment 3 342 493 3 502 419 3 534 016 3 515 595 3 552 527
Investment property
Other non financial assets 61 639 72 503 56 251 44 617 44 283
Total non financial assets 3 581 054 3 758 188 3 778 808 3 754 043 3 795 946
TOTAL ASSETS 3 977 080 4 093 900 4 122 637 4 113 920 4 181 370
LIABILITIES
Deposits held 909 909 909 909 909
Advances received
Borrowing 1 319 736 1 414 788 1 443 983 1 455 983 1 494 983
Superannuation
Other employee benefits 48 786 50 214 51 512 52 851 54 221
Payables 51 801 65 885 66 679 71 278 72 676
Other liabilities 83 958 72 348 76 625 69 239 94 116
TOTAL LIABILITIES 1 505 190 1 604 144 1 639 708 1 650 260 1 716 905
NET ASSETS/(LIABILITIES) 2 471 890 2 489 756 2 482 929 2 463 660 2 464 465
Contributed equity 613 301 628 301 628 301 628 301 628 301
Accumulated surplus/(deficit) 1 071 998 1 074 898 1 068 145 1 048 879 1 049 707
Reserves 786 591 786 557 786 483 786 480 786 457
TOTAL EQUITY 2 471 890 2 489 756 2 482 929 2 463 660 2 464 465
NET FINANCIAL WORTH1 - 1 109 164 - 1 268 432 - 1 295 879 - 1 290 383 - 1 331 481
NET DEBT2 1 117 207 1 248 109 1 266 607 1 267 508 1 287 642
1 Net financial worth equals total financial assets minus total liabilities.2 Net debt equals the sum of deposits held, advances received and borrowing, minus the sum of cash and deposits, advances paid and
investments, loans and placements.

Uniform Presentation Framework 85
Budget Strategy and Outlook
Table 8.6
Public Non Financial Corporation Sector Cash Flow Statement 2015-16 2016-17 2017-18 2018-19 2019-20
Estimate Budget Forward Estimates
$000 $000 $000 $000 $000Cash receipts from operating activitiesReceipts from sales of goods and services 611 975 709 424 728 949 771 236 813 689Grants and subsidies received 252 374 232 900 224 448 190 667 195 226Interest receipts 4 282 3 854 3 281 3 210 3 534Other receipts 21 733 12 680 9 797 12 870 16 700Total operating receipts 890 364 958 858 966 475 977 983 1 029 149Cash payments for operating activitiesIncome tax equivalents paid - 34 988 - 33 571 - 22 695 - 19 137 - 41 023Payments for employees - 139 498 - 132 656 - 121 089 - 116 310 - 114 554Payment for goods and services - 460 977 - 513 384 - 533 832 - 577 379 - 568 580Grants and subsidies paid - 2 324 - 2 132 - 2 129 - 2 178 - 2 227Interest paid - 70 702 - 68 198 - 72 679 - 72 172 - 76 663Other payments Total operating payments ‑ 708 489 ‑ 749 941 ‑ 752 424 ‑ 787 176 ‑ 803 047
NET CASH FLOWS FROM OPERATING ACTIVITIES 181 875 208 917 214 051 190 807 226 102Cash flows from investments in non financial assetsSales of non financial assets 1 026 154 1 359 1 359Purchases of non financial assets - 228 891 - 335 774 - 210 262 - 165 883 - 227 043Net cash flows from investments in non financial assets ‑ 228 891 ‑ 334 748 ‑ 210 108 ‑ 164 524 ‑ 225 684NET CASH FROM OPERATING ACTIVITIES AND INVESTMENTS IN NON FINANCIAL ASSETS
‑ 47 016 ‑ 125 831 3 943 26 283 418
Net cash flows from investments in financial assets for policy purposes1
- 8 614
Net cash flows from investments in financial assets for liquidity purposes
NET CASH FLOWS FROM INVESTING ACTIVITIES - 237 505 - 334 748 - 210 108 - 164 524 - 225 684Net cash flows from financing activitiesAdvances received (net) Borrowing (net) 62 061 95 052 29 195 12 000 39 000Deposits received (net) Dividends paid - 21 439 - 20 071 - 22 441 - 27 184 - 20 552Other financing (net) 65 365 15 000 NET CASH FLOWS FROM FINANCING ACTIVITIES 105 987 89 981 6 754 - 15 184 18 448NET INCREASE/DECREASE IN CASH HELD 50 357 - 35 850 10 697 11 099 18 866Net cash flows from operating activities 181 875 208 917 214 051 190 807 226 102Net cash flows from investments in non financial assets - 228 891 - 334 748 - 210 108 - 164 524 - 225 684Dividends paid - 21 439 - 20 071 - 22 441 - 27 184 - 20 552
CASH SURPLUS (+)/DEFICIT (‑) ‑ 68 455 ‑ 145 902 ‑ 18 498 ‑ 901 ‑ 20 134Additional information to the Cash Flow StatementCASH SURPLUS (+)/DEFICIT (-) - 68 455 - 145 902 - 18 498 - 901 - 20 134Acquisitions under finance leases and similar arrangements ABS GFS SURPLUS (+)/DEFICIT (-) including finance leases and similar arrangements
- 68 455 - 145 902 - 18 498 - 901 - 20 134
1 Includes equity acquisitions, disposals and privatisations (net).

86 Uniform Presentation Framework
2016-17 Budget
Table 8.7
Non Financial Public Sector Comprehensive Operating Statement 2015-16 2016-17 2017-18 2018-19 2019-20
Estimate Budget Forward Estimates
$000 $000 $000 $000 $000
REVENUE
Taxation revenue 602 164 577 054 595 569 611 817 628 533
Current grants 4 368 079 4 238 247 4 267 400 4 344 581 4 602 163
Capital grants 354 133 385 211 203 925 42 432 20 560
Sales of goods and services 1 099 702 1 043 887 1 111 421 1 165 177 1 209 167
Interest income 92 011 88 037 89 704 92 209 94 330
Dividend and income tax equivalent income 20 246 11 679 9 677 6 697 7 085
Other revenue 251 299 202 897 199 581 202 920 205 835
TOTAL REVENUE 6 787 634 6 547 012 6 477 277 6 465 833 6 767 673
less EXPENSES
Employee benefits expense 2 227 072 2 274 096 2 319 947 2 352 859 2 424 446
Superannuation expenses
Superannuation interest cost 138 337 133 639 129 094 128 080 128 080
Other superannuation expenses 216 383 217 802 219 407 220 918 222 480
Depreciation and amortisation 503 596 521 152 529 626 532 176 536 642
Other operating expenses 1 983 890 1 943 503 2 010 195 2 072 455 2 106 421
Interest expenses 295 663 276 000 283 915 295 029 302 440
Other property expenses
Current grants 855 739 865 080 839 906 785 450 861 564
Capital grants 144 224 97 519 21 440 2 052 12 986
Subsidies and personal benefit payments 132 422 132 695 137 599 141 936 144 438
TOTAL EXPENSES 6 497 326 6 461 486 6 491 129 6 530 955 6 739 497
equals NET OPERATING BALANCE 290 308 85 526 ‑ 13 852 ‑ 65 122 28 176
plus Other economic flows – included in operating result - 45 623 19 259 20 983 23 915 30 962
equals OPERATING RESULT 244 685 104 785 7 131 ‑ 41 207 59 138
plus Other economic flows – other comprehensive income
- 822 365 183 762 173 406 166 082 697
equals COMPREHENSIVE RESULT – total change in net worth before transactions with owners in their capacity as owners
‑ 577 680 288 547 180 537 124 875 59 835
NET OPERATING BALANCE 290 308 85 526 ‑ 13 852 ‑ 65 122 28 176
less Net acquisition of non financial assets
Purchases of non financial assets 1 065 760 1 461 310 974 392 653 772 601 753
Sales of non financial assets - 71 854 - 85 900 - 69 877 - 63 476 - 74 546
less Depreciation 503 596 521 152 529 626 532 176 536 642
plus Change in inventories - 8 328 6 344 5 275 5 290 5 305
plus Other movements in non financial assets - 38 198 18 740 19 228 19 729 19 965
equals Total net acquisition of non financial assets 443 784 879 342 399 392 83 139 15 835
equals FISCAL BALANCE ‑ 153 476 ‑ 793 816 ‑ 413 244 ‑ 148 261 12 341

Uniform Presentation Framework 87
Budget Strategy and Outlook
Table 8.8
Non Financial Public Sector Balance Sheet 2015-16 2016-17 2017-18 2018-19 2019-20
Estimate Budget Forward Estimates
$000 $000 $000 $000 $000
ASSETS
Financial assets
Cash and deposits 692 740 334 008 231 383 273 587 287 796
Advances paid 157 655 140 846 126 620 109 305 95 177
Investments, loans and placements 2 107 135 1 817 155 1 808 799 1 866 778 1 927 728
Receivables 466 421 441 032 443 416 453 301 460 360
Equity
Investments in other public sector entities 21 631 21 631 21 631 21 631 21 631
Investments – other 3 3 3 3 3
Other financial assets
Total financial assets 3 445 585 2 754 675 2 631 852 2 724 605 2 792 695
Non financial assets
Inventories 188 468 194 812 200 087 205 377 210 682
Property, plant and equipment 16 954 722 17 839 868 18 250 546 18 344 561 18 371 000
Investment property 109 983 98 983 87 983 76 983 65 983
Other non financial assets 183 903 194 747 178 475 166 821 166 467
Total non financial assets 17 437 076 18 328 410 18 717 091 18 793 742 18 814 132
TOTAL ASSETS 20 882 661 21 083 085 21 348 943 21 518 347 21 606 827
LIABILITIES
Deposits held 254 979 249 413 250 730 251 842 256 849
Advances received 288 367 277 784 269 798 261 218 251 986
Borrowing 4 385 389 4 471 993 4 694 061 4 873 131 4 903 307
Superannuation 3 678 113 3 519 113 3 360 113 3 201 112 3 201 112
Other employee benefits 678 175 683 603 685 901 687 240 688 610
Payables 220 132 234 416 236 244 241 016 242 155
Other liabilities 809 530 790 240 815 036 840 853 841 038
TOTAL LIABILITIES 10 314 685 10 226 562 10 311 883 10 356 412 10 385 057
NET ASSETS/(LIABILITIES) 10 567 976 10 856 523 11 037 060 11 161 935 11 221 770
Contributed equity
Accumulated surplus/(deficit) 3 590 306 3 878 887 4 059 498 4 184 376 4 244 234
Reserves 6 977 670 6 977 636 6 977 562 6 977 559 6 977 536
NET WORTH 10 567 976 10 856 523 11 037 060 11 161 935 11 221 770
NET FINANCIAL WORTH1 - 6 869 100 - 7 471 887 - 7 680 031 - 7 631 807 - 7 592 362
NET FINANCIAL LIABILITIES2 6 890 731 7 493 518 7 701 662 7 653 438 7 613 993
NET DEBT3 1 971 205 2 707 181 3 047 787 3 136 521 3 101 441
1 Net financial worth equals total financial assets minus total liabilities.2 Net financial liabilities equals the sum of total liabilities less total financial assets excluding investments in other public sector entities.3 Net debt equals the sum of deposits held, advances received and borrowing, minus the sum of cash and deposits, advances paid and
investments, loans and placements.

88 Uniform Presentation Framework
2016-17 Budget
Table 8.9
Non Financial Public Sector Cash Flow Statement 2015-16 2016-17 2017-18 2018-19 2019-20
Estimate Budget Forward Estimates
$000 $000 $000 $000 $000
Cash receipts from operating activitiesTaxes received 602 164 577 054 595 569 611 817 628 533Receipts from sales of goods and services 940 554 997 331 1 041 743 1 087 503 1 130 101Grants and subsidies received 4 721 285 4 623 456 4 471 325 4 387 013 4 622 725Interest receipts 92 011 88 037 89 704 92 209 94 330Dividends and income tax equivalents 36 129 20 246 11 678 9 678 6 697Other receipts 486 831 410 438 407 059 410 121 411 412Total operating receipts 6 878 974 6 716 562 6 617 078 6 598 341 6 893 798Cash payments for operating activitiesPayments for employees - 2 538 032 - 2 594 592 - 2 650 949 - 2 692 713 - 2 772 195Payment for goods and services - 2 101 014 - 2 138 341 - 2 147 264 - 2 208 762 - 2 268 095Grants and subsidies paid - 1 094 478 - 1 095 128 - 998 945 - 929 438 - 1 018 988Interest paid - 300 234 - 276 104 - 283 924 - 295 239 - 302 562Other payments Total operating payments ‑ 6 033 758 ‑ 6 104 165 ‑ 6 081 082 ‑ 6 126 152 ‑ 6 361 840NET CASH FLOWS FROM OPERATING ACTIVITIES 845 216 612 397 535 996 472 189 531 958Cash flows from investments in non financial assetsSales of non financial assets 71 854 85 900 69 877 63 476 74 546Purchases of non financial assets - 1 065 760 - 1 461 310 - 974 392 - 653 772 - 601 753Net cash flows from investments in non financial assets ‑ 993 906 ‑ 1 375 410 ‑ 904 515 ‑ 590 296 ‑ 527 207NET CASH FROM OPERATING ACTIVITIES AND INVESTMENTS IN NON FINANCIAL ASSETS
‑ 148 690 ‑ 763 013 ‑ 368 519 ‑ 118 107 4 751
Net cash flows from investments in financial assets for policy purposes1
500 287 16 809 14 226 17 315 14 128
Net cash flows from investments in financial assets for liquidity purposes
194 188 317 017 36 269 - 28 606 - 30 621
NET CASH FLOWS FROM INVESTING ACTIVITIES - 299 431 - 1 041 584 - 854 020 - 601 587 - 543 700Net cash flows from financing activitiesAdvances received (net) - 37 948 - 10 583 - 7 986 - 8 580 - 9 232Borrowing (net) - 583 529 86 604 222 068 179 070 30 176Deposits received (net) 158 030 - 5 566 1 317 1 112 5 007Other financing (net) NET CASH FLOWS FROM FINANCING ACTIVITIES - 463 447 70 455 215 399 171 602 25 951NET INCREASE/DECREASE IN CASH HELD 82 338 - 358 732 - 102 625 42 204 14 209Net cash flows from operating activities 845 216 612 397 535 996 472 189 531 958Net cash flows from investments in non financial assets - 993 906 - 1 375 410 - 904 515 - 590 296 - 527 207CASH SURPLUS (+)/DEFICIT (‑) ‑ 148 690 ‑ 763 013 ‑ 368 519 ‑ 118 107 4 751Future infrastructure and superannuation contributions/earnings2
- 21 526 - 24 441 - 25 907 - 27 461 - 29 109
UNDERLYING SURPLUS (+)/DEFICIT (‑) ‑ 170 216 ‑ 787 454 ‑ 394 426 ‑ 145 568 ‑ 24 358Additional information to the Cash Flow StatementCASH SURPLUS (+)/DEFICIT (-) - 148 690 - 763 013 - 368 519 - 118 107 4 751Acquisitions under finance leases and similar arrangements
ABS GFS SURPLUS (+)/DEFICIT (-) including finance leases and similar arrangements
- 148 690 - 763 013 - 368 519 - 118 107 4 751
1 Includes equity acquisitions, disposals and privatisations (net).2 Contributions for future infrastructure and superannuation requirements.

Uniform Presentation Framework 89
Budget Strategy and Outlook
Table 8.10
Public Financial Corporation Sector Comprehensive Operating Statement2015-16 Estimate
$000
REVENUE
Current grants
Capital grants
Sales of goods and services 822
Interest income 238 896
Other revenue
TOTAL REVENUE 239 718
less EXPENSES
Employee benefits expense 853
Superannuation expenses 100
Depreciation and amortisation
Other operating expenses 1 597
Interest expenses 216 922
Other property expenses 6 074
Current grants
Capital grants
Subsidies and personal benefit payments
TOTAL EXPENSES 225 546
equals NET OPERATING BALANCE 14 172
plus Other economic flows – included in operating result
equals OPERATING RESULT 14 172
plus Other economic flows – other comprehensive income
equals COMPREHENSIVE RESULT – total change in net worth before transactions with owners in their capacity as owners
14 172
NET OPERATING BALANCE 14 172
less Net acquisition of non financial assets
Purchases of non financial assets
Sales of non financial assets
less Depreciation
plus Change in inventories
plus Other movements in non financial assets
equals Total net acquisition of non financial assets
equals FISCAL BALANCE 14 172
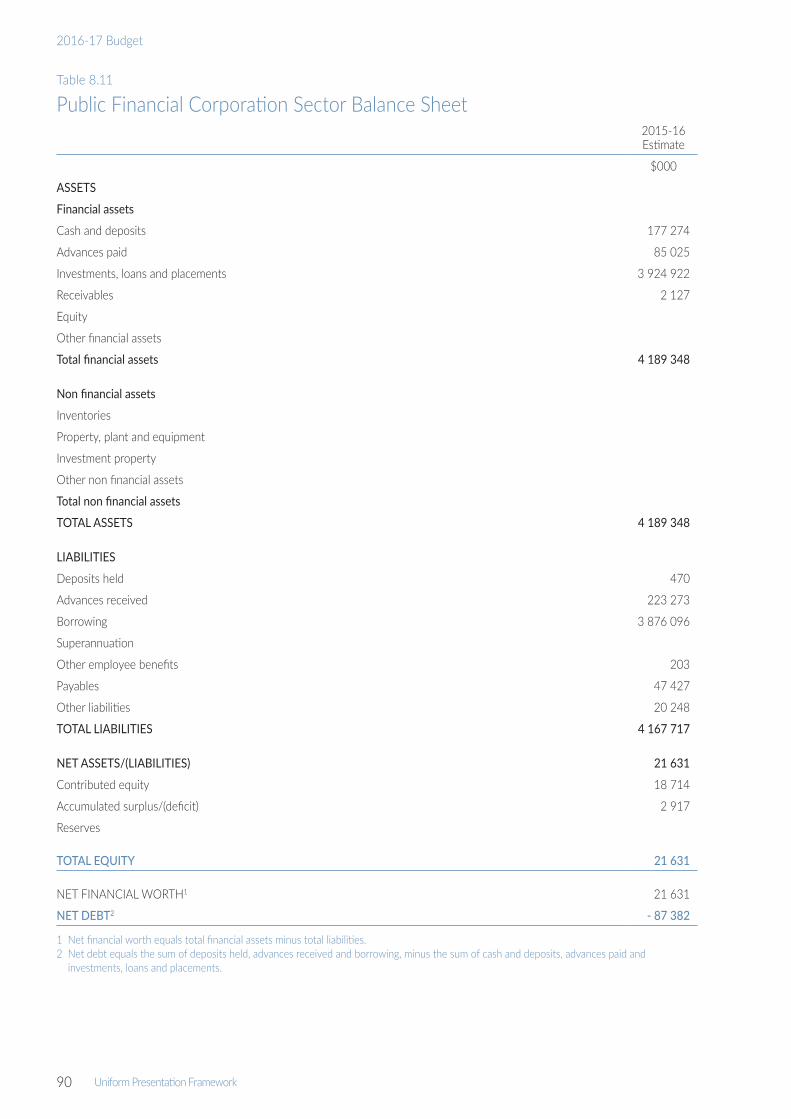
90 Uniform Presentation Framework
2016-17 Budget
Table 8.11
Public Financial Corporation Sector Balance Sheet2015-16 Estimate
$000
ASSETS
Financial assets
Cash and deposits 177 274
Advances paid 85 025
Investments, loans and placements 3 924 922
Receivables 2 127
Equity
Other financial assets
Total financial assets 4 189 348
Non financial assets
Inventories
Property, plant and equipment
Investment property
Other non financial assets
Total non financial assets
TOTAL ASSETS 4 189 348
LIABILITIES
Deposits held 470
Advances received 223 273
Borrowing 3 876 096
Superannuation
Other employee benefits 203
Payables 47 427
Other liabilities 20 248
TOTAL LIABILITIES 4 167 717
NET ASSETS/(LIABILITIES) 21 631
Contributed equity 18 714
Accumulated surplus/(deficit) 2 917
Reserves
TOTAL EQUITY 21 631
NET FINANCIAL WORTH1 21 631
NET DEBT2 ‑ 87 382
1 Net financial worth equals total financial assets minus total liabilities.2 Net debt equals the sum of deposits held, advances received and borrowing, minus the sum of cash and deposits, advances paid and
investments, loans and placements.
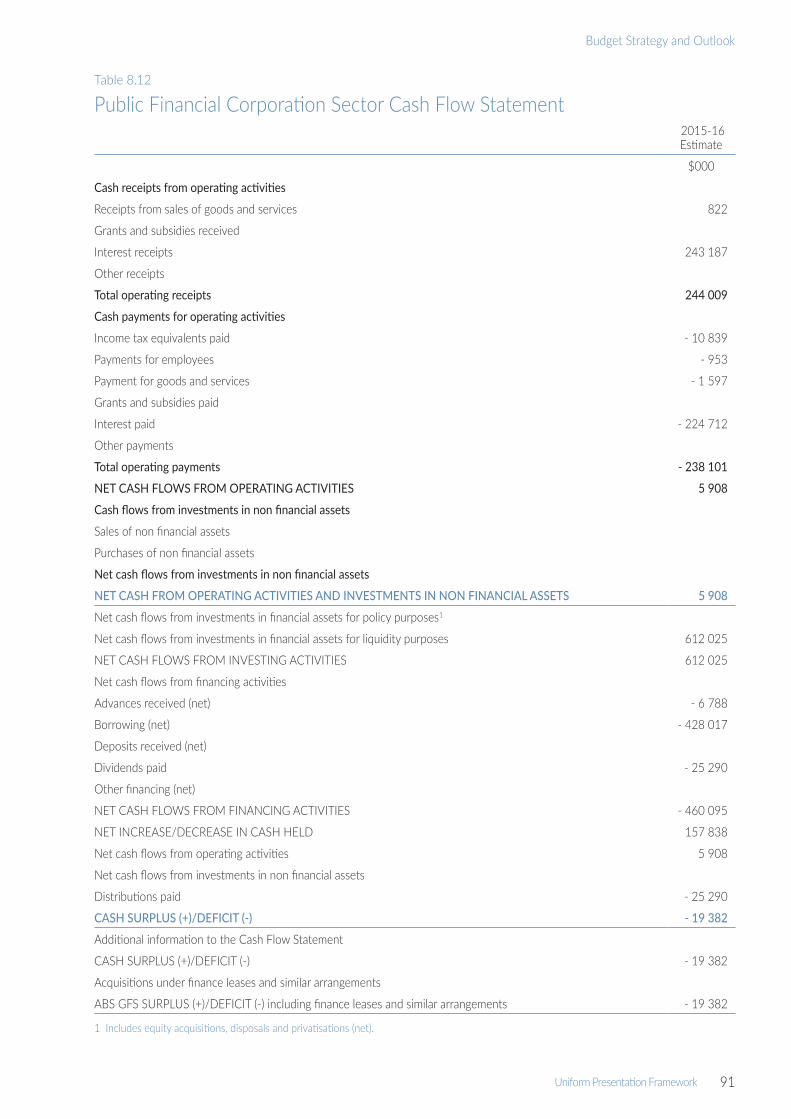
Uniform Presentation Framework 91
Budget Strategy and Outlook
Table 8.12
Public Financial Corporation Sector Cash Flow Statement 2015-16 Estimate
$000
Cash receipts from operating activities
Receipts from sales of goods and services 822
Grants and subsidies received
Interest receipts 243 187
Other receipts
Total operating receipts 244 009
Cash payments for operating activities
Income tax equivalents paid - 10 839
Payments for employees - 953
Payment for goods and services - 1 597
Grants and subsidies paid
Interest paid - 224 712
Other payments
Total operating payments ‑ 238 101
NET CASH FLOWS FROM OPERATING ACTIVITIES 5 908
Cash flows from investments in non financial assets
Sales of non financial assets
Purchases of non financial assets
Net cash flows from investments in non financial assets
NET CASH FROM OPERATING ACTIVITIES AND INVESTMENTS IN NON FINANCIAL ASSETS 5 908
Net cash flows from investments in financial assets for policy purposes1
Net cash flows from investments in financial assets for liquidity purposes 612 025
NET CASH FLOWS FROM INVESTING ACTIVITIES 612 025
Net cash flows from financing activities
Advances received (net) - 6 788
Borrowing (net) - 428 017
Deposits received (net)
Dividends paid - 25 290
Other financing (net)
NET CASH FLOWS FROM FINANCING ACTIVITIES - 460 095
NET INCREASE/DECREASE IN CASH HELD 157 838
Net cash flows from operating activities 5 908
Net cash flows from investments in non financial assets
Distributions paid - 25 290
CASH SURPLUS (+)/DEFICIT (‑) ‑ 19 382
Additional information to the Cash Flow Statement
CASH SURPLUS (+)/DEFICIT (-) - 19 382
Acquisitions under finance leases and similar arrangements
ABS GFS SURPLUS (+)/DEFICIT (-) including finance leases and similar arrangements - 19 382
1 Includes equity acquisitions, disposals and privatisations (net).

92 Uniform Presentation Framework
2016-17 Budget
Table 8.13
Total Public Sector Comprehensive Operating Statement 2015-16 Estimate
$000
REVENUE
Taxation revenue 602 164
Current grants 4 368 079
Capital grants 354 133
Sales of goods and services 1 099 023
Interest income 92 211
Dividend and income tax equivalent income
Other revenue 251 243
TOTAL REVENUE 6 766 853
less EXPENSES
Employee benefits expense 2 227 925
Superannuation expenses
Superannuation interest cost 138 337
Other superannuation expenses 216 427
Depreciation and amortisation 503 596
Other operating expenses 1 983 986
Interest expenses 273 889
Other property expenses
Current grants 855 739
Capital grants 144 224
Subsidies and personal benefit payments 132 422
TOTAL EXPENSES 6 476 545
equals NET OPERATING BALANCE 290 308
plus Other economic flows – included in operating result - 45 623
equals OPERATING RESULT 244 685
plus Other economic flows – other comprehensive income - 822 365
equals COMPREHENSIVE RESULT – total change in net worth before transactions with owners in their capacity as owners
‑ 577 680
NET OPERATING BALANCE 290 308
less Net acquisition of non financial assets
Purchases of non financial assets 1 065 760
Sales of non financial assets - 71 854
less Depreciation 503 596
plus Change in inventories - 8 328
plus Other movements in non financial assets - 38 198
equals Total net acquisition of non financial assets 443 784
equals FISCAL BALANCE ‑ 153 476

Uniform Presentation Framework 93
Budget Strategy and Outlook
Table 8.14
Total Public Sector Balance Sheet 2015-16 Estimate
$000
ASSETS
Financial assets
Cash and deposits 692 740
Advances paid 157 655
Investments, loans and placements 2 107 135
Receivables 446 123
Equity
Investments in other public sector entities
Investments – other 3
Other financial assets
Total financial assets 3 403 656
Non financial assets
Inventories 188 468
Property, plant and equipment 16 954 722
Investment property 109 983
Other non financial assets 183 903
Total non financial assets 17 437 076
TOTAL ASSETS 20 840 732
LIABILITIES
Deposits held 78 175
Advances received 224 493
Borrowing 4 538 685
Superannuation 3 678 113
Other employee benefits 678 378
Payables 265 380
Other liabilities 809 532
TOTAL LIABILITIES 10 272 756
NET ASSETS/(LIABILITIES) 10 567 976
Contributed equity
Accumulated surplus/(deficit) 3 593 223
Reserves 6 974 753
NET WORTH 10 567 976
NET FINANCIAL WORTH1 - 6 869 100
NET DEBT2 1 883 823
1 Net financial worth equals total financial assets minus total liabilities.2 Net debt equals the sum of deposits held, advances received and borrowing, minus the sum of cash and deposits, advances paid and
investments, loans and placements.

94 Uniform Presentation Framework
2016-17 Budget
Table 8.15
Total Public Sector Cash Flow Statement2015-16 Estimate
$000
Cash receipts from operating activities
Taxes received 602 164
Receipts from sales of goods and services 939 875
Grants and subsidies received 4 721 285
Interest receipts 92 011
Other receipts 486 831
Total operating receipts 6 842 166
Cash payments for operating activities
Payments for employees - 2 538 985
Payment for goods and services - 2 101 110
Grants and subsidies paid - 1 094 478
Interest paid - 281 759
Other payments
Total operating payments ‑ 6 016 332
NET CASH FLOWS FROM OPERATING ACTIVITIES 825 834
Cash flows from investments in non financial assets
Sales of non financial assets 71 854
Purchases of non financial assets - 1 065 760
Net cash flows from investments in non financial assets ‑ 993 906
NET CASH FROM OPERATING ACTIVITIES AND INVESTMENTS IN NON FINANCIAL ASSETS ‑ 168 072
Net cash flows from investments in financial assets for policy purposes1 500 287
Net cash flows from investments in financial assets for liquidity purposes 194 188
NET CASH FLOWS FROM INVESTING ACTIVITIES - 299 431
Net cash flows from financing activities
Advances received (net) - 6 788
Borrowing (net) - 437 469
Deposits received (net) 192
Other financing (net)
NET CASH FLOWS FROM FINANCING ACTIVITIES - 444 065
NET INCREASE/DECREASE IN CASH HELD 82 338
Net cash flows from operating activities 825 834
Net cash flows from investments in non financial assets - 993 906
CASH SURPLUS (+)/DEFICIT (‑) ‑ 168 072
Future infrastructure and superannuation contributions/earnings2 - 21 526
UNDERLYING SURPLUS (+)/DEFICIT (‑) ‑ 189 598
Additional information to the Cash Flow Statement
CASH SURPLUS (+)/DEFICIT (-) - 168 072
Acquisitions under finance leases and similar arrangements
ABS GFS SURPLUS (+)/DEFICIT (-) including finance leases and similar arrangements - 168 072
1 Includes equity acquisitions, disposals and privatisations (net).2 Contributions for future infrastructure and superannuation requirements.

Uniform Presentation Framework 95
Budget Strategy and Outlook
Table 8.16
General Government Sector Taxes 2015-16Estimate
2016-17Budget
$M $M
Taxes on employers’ payroll and labour force 290 294
Payroll taxes 290 294
Taxes on property 138 104
Stamp duties on financial and capital transactions 138 104
Taxes on the provision of goods and services 115 118
Taxes on gambling 74 76
Taxes on insurance 41 42
Taxes on the use of goods and performance of activities 69 71
Motor vehicle registration fees 69 71
TOTAL TAXES 612 587
Table 8.17
State and Territory General Government Sector Grant Revenue2015-16Estimate
2016-17Budget
$M $M
Current grant revenue
Current grants from the Commonwealth (including for on-passing)
National partnership payments 412 259
Specific purpose payments 321 344
General purpose grants 3 635 3 634
Total current grant revenue 4 368 4 238
Capital grant revenue
Capital grants from the Commonwealth (including for on-passing)
National partnership payments 274 318
Specific purpose payments 20 33
General purpose grants 46 19
Total capital grant revenue 340 371
TOTAL GRANTS REVENUE 4 709 4 609

96 Uniform Presentation Framework
2016-17 Budget
Table 8.18
State and Territory General Government Sector Grant Expenses2015-16Estimate
2016-17Budget
$M $M
Current grant expenses including subsidies and personal benefit payments
Local Government 130 134
Private and not-for-profit sector (including for on-passing) 777 778
Grants to other sectors of Government 58 58
Other 169 214
Total current grant expenses including subsidies and personal benefit payments 1 134 1 184
Capital grant expenses
Local Government 16 26
Private and not-for-profit sector (including for on-passing) 90 71
Grants to other sectors of Government 91 31
Other 62
Total capital grant expenses 259 128
TOTAL GRANT EXPENSES 1 393 1 312
Table 8.19
General Government Sector Dividend and Income Tax Equivalent Income 2015-16Estimate
2016-17Budget
$M $M
Dividend and income tax equivalent income from public non financial corporations sector 72 41
Dividend and income tax equivalent income from public financial corporations sector 20 12
TOTAL DIVIDEND AND INCOME TAX EQUIVALENT INCOME 92 53

Uniform Presentation Framework 97
Budget Strategy and Outlook
Table 8.20
General Government Sector Operating Expenses 2015-16Estimate
2016-17Budget
$M $M
General public services 129 119
Public order and safety 734 730
Education 1 091 1 134
Health 1 364 1 396
Social security and welfare 394 386
Housing and community amenities 675 605
Recreation and culture 253 223
Fuel and energy 147 140
Agriculture, forestry, fishing and hunting 91 87
Mining, manufacturing and construction 37 38
Transport and communications 262 260
Other economic affairs 192 194
Other purposes 565 508
TOTAL OPERATING EXPENSES 5 933 5 821
Table 8.21
2016-17 Loan Council AllocationLoan Council
AllocationBudget-time
Estimate
$M $M
General government sector cash deficit (+)/surplus (-) 113 617
Public non financial corporations sector cash deficit (+)/surplus (-) 55 146
Non financial public sector cash deficit (+)/surplus (-) 168 763
less Acquisitions under finance leases and similar arrangements
equals ABS GFS cash deficit (+)/surplus (-) 168 763
less Net cash flows from investments in financial assets for policy purposes 18 17
plus Memorandum items
2016‑17 LOAN COUNCIL NOMINATION 150 746
Tolerance limit (2% of non financial public sector cash receipts from operating activities) 136
Change in loan council allocation 596
Note: This table sets out the Territory’s 2016-17 Loan Council Allocation (LCA) Budget update of $746 million as compared to that nominated and endorsed with the Loan Council of $150 million. Nominations for 2016-17 were provided by all jurisdictions on the basis of policies commenced up to and included in their Mid-Year budget updates. The budget-time estimate reflects reduced revenues combined with spending decisions aimed at stimulating the Territory Economy, including reinvesting the proceeds from the long-term lease of the Port of Darwin into infrastructure projects.

98
2016-17 Budget

Appendix B 99
Budget Strategy and Outlook
Appendices

100
2016-17 Budget

101
Budget Strategy and Outlook
Appendix A
Appendix AClassification of Entities in the Northern TerritoryTotal Public Sector
Non Financial Public SectorGeneral GovernmentAboriginal Areas Protection AuthorityAuditor‑General’s OfficeAustralAsia Railway Corporation1
Batchelor Institute of Indigenous Tertiary Education1
Central Australia Health Service2
Central Holding AuthorityDarwin Waterfront Corporation1
Data Centre Services2
Department of Arts and Museums Department of the Attorney‑General and JusticeDepartment of BusinessDepartment of the Chief MinisterDepartment of Children and FamiliesDepartment of Corporate and Information ServicesDepartment of Correctional ServicesDepartment of Education Department of HealthDepartment of HousingDepartment of InfrastructureDepartment of Land Resource ManagementDepartment of Lands, Planning and the EnvironmentDepartment of the Legislative AssemblyDepartment of Local Government and Community ServicesDepartment of Mines and EnergyDepartment of Primary Industry and FisheriesDepartment of Sport and Recreation Department of TransportDepartment of Treasury and FinanceDesert Knowledge Australia1
Motor Accidents (Compensation) Commission1
Museums and Art Galleries Board of the Northern Territory1
Nominal Insurer’s Fund1
Northern Territory Electoral CommissionNorthern Territory Legal Aid Commission1
Northern Territory Major Events Company Pty Ltd1
Northern Territory Police, Fire and Emergency ServicesNT Build Statutory Corporation1
NT Fleet2
NT Home Ownership2
Office of the Commissioner for Public EmploymentOmbudsman’s OfficeParks and Wildlife Commission of the Northern TerritoryTerritory Wildlife Parks2
Top End Health Service2
Tourism NT
Public Non Financial CorporationsIndigenous Essential Services Pty Ltd1
Jacana Energy1,3
Land Development Corporation2
Power and Water Corporation1,3
Territory Generation1,3
Public Financial CorporationNorthern Territory Treasury Corporation2
1 Non‑budget sector entity.2 Government business division.3 Government owned corporation.
102 Appendix B
2016-17 Budget
Appendix B Glossary
Advances/Advances PaidLoans acquired for policy rather than liquidity management purposes. Included are long‑term and short‑term loans, non‑marketable debentures, and long‑term and short‑term promissory agreements (bonds and bills) issued to public sector units for achieving government policy objectives.
AgencyA unit of government administration, or office or statutory corporation, nominated in an Administrative Arrangements Order for the purposes of the Financial Management Act and including, where the case requires, a part or division (by whatever name called) of an agency.
AppropriationAn authority given by the Legislative Assembly to make payments, now or at some future time, for the purposes stated, up to the limit of the amount in the particular Act.
Australian Accounting StandardsStatements of accounting standards that can be applied in the preparation and presentation of financial statements.
Capital GrantsTransactions in which the ownership of an asset (other than cash and inventories) is transferred from one institutional unit to another, cash is transferred to enable the recipient to acquire another asset, or the funds realised by the disposal of another asset are transferred, for which no economic benefits of equal value are receivable or payable in return.
Cash Surplus/DeficitReported in the Cash Flow Statement and measures the net impact of cash flows during the period. It equals net cash flows from operating activities plus net cash flows from acquisition and disposal of non‑financial assets, less distributions paid, less value of assets acquired under finance leases and similar arrangements.
Commonwealth Own‑Purpose Expenses Payments by the Commonwealth for goods and services and associated transfer payments for the conduct of its general government activities.
Community Service Obligation (CSO)A community service obligation arises when the Government requires a government business division or government owned corporation to carry out activities that it would not choose to do on a commercial basis or would only do at higher commercial prices. CSOs allow the Government to achieve identifiable community or social objectives that would not be achieved if left to commercial considerations.
Comprehensive ResultThe net result of all items of income and expense recognised for the period. It is the aggregate of the operating result and other movements in equity, other than transactions with owners as owners.
Appendix B 103
Budget Strategy and Outlook
Consumer Price IndexA general comparative indicator of the prices paid by household consumers for a specific basket of goods and services in one period relative to the cost of the same basket in a base period.
Contingent LiabilityA potential financial obligation arising out of a condition, situation, guarantee or indemnity, the ultimate effect of which will be confirmed only on the occurrence or non‑occurrence of one or more uncertain future events.
Current GrantsAmounts payable or receivable for current purposes for which no economic benefits of equal value are receivable or payable in return.
Finance LeaseLease agreements that transfer substantially all the risks and benefits relating to ownership of an asset from the lessor (legal owner) to the lessee (party using the asset).
Financial AssetAny asset that is:
•cash;
•an equity instrument of another entity;
•a contractual right:
− to receive cash or another financial asset from another entity; or
− to exchange financial assets or financial liabilities with another entity under conditions potentially favourable to the entity; or
•a contract that will or may be settled in the entity’s own equity instruments and is:
− a non‑derivative for which the entity is or may be obliged to receive a variable number of the entity’s own equity instruments; or
− a derivative that will or may be settled other than by the exchange of a fixed amount of cash or another financial asset for a fixed number of the entity’s own equity instruments.
For this purpose, the entity’s own equity instruments do not include instruments that are themselves contracts for the future receipt or delivery of the entity’s own equity instruments.
Fiscal Balance (Net Lending/Borrowing)Fiscal balance, also referred to as net lending/borrowing, is an operating statement measure that differs from the net operating balance as it includes spending on capital items but excludes depreciation. A net lending (or fiscal surplus) balance indicates a government is saving more than enough to finance all its investment spending. A net borrowing (or fiscal deficit) position indicates a government’s level of investment is greater than its level of savings.
General Government SectorDefined in Government Finance Statistics as an entity or group of entities that are mainly engaged in the production of goods and/or services outside the normal market mechanism. Goods and services are provided free of charge or at nominal charges well below costs of production.

104 Appendix B
2016-17 Budget
Generally Accepted Accounting Principles Term used to describe broadly the body of principles that governs the accounting for financial transactions underlying the preparation of a set of financial statements.
Government Business Division A Territory‑controlled trading entity that follows commercial practices and is required to comply with competitive neutrality principles.
Government Finance Statistics (GFSs)Refers to statistics that measure the financial transactions of governments and reflect the impact of those transactions on other sectors of the economy. GFSs in Australia are developed by the Australian Bureau of Statistics in conjunction with all governments and are mainly based on international statistical standards, developed in consultation with member countries by the International Monetary Fund.
Government Owned CorporationAn entity in which its objectives are to operate at least as efficiently as any corporate business and maximise sustainable return to government. The Government Owned Corporations Act adopts the shareholder model of corporate governance. The Territory has three government owned corporations, Power and Water Corporation, power generation (Territory Generation) and power retail corporation (Jacana Energy).
Government Purpose ClassificationClassifies outlays or expenditure transactions by the purpose served, for example, health or education.
GrantsTransactions in which one unit provides goods, services, assets (or extinguishes a liability) or labour to another unit without receiving approximately equal value in return. Grants can be either of a current or capital nature (see current grants and capital grants).
Grants can be paid as general purpose grants, which refer to grants not subject to conditions regarding their use. Alternatively, they may be paid as specific purpose grants, which are paid for a particular purpose and/or have conditions attached regarding their use.
Grants for On‑PassingAll grants paid to one institutional sector (for example, a state general government) to be passed to another institutional sector (for example, local government or a non‑profit institution).
Gross Domestic Product The total value of goods and services produced in Australia over the period for final consumption. Intermediate goods, or those used in the production of other goods, are excluded. Gross domestic product can be calculated by summing total output, total income or total expenditure.
Gross State ProductSimilar to gross domestic product except it measures the total value of goods and services produced in a jurisdiction. It is the sum of all income, namely wages, salaries and profits, plus indirect taxes less subsidies. It can also be calculated by measuring expenditure, where it is the sum of state final demand and international and interstate trade, changes in the level of stocks and a balancing item.

Appendix B 105
Budget Strategy and Outlook
GuaranteeAn undertaking to answer for the debt or obligations of another person or entity.
IndemnityA written undertaking to compensate, protect or insure another person or entity against future financial loss, damage or liability.
Loan Council The Australian Loan Council coordinates borrowing by Commonwealth and state governments. Current arrangements seek to emphasise transparency of public sector finances, through financial market scrutiny of proposed borrowing to restrict borrowing to prudent levels.
Loan Council Allocation The nomination to the Loan Council of the level of financing required.
Memorandum Items – Loan CouncilMemorandum items are used to adjust the cash surplus/deficit to include in the Loan Council Allocation certain transactions that may have the characteristics of public sector borrowings but do not constitute formal borrowings.
National Partnership AgreementsNational Partnership agreements are agreements between the Commonwealth, states and territories with defined objectives, outcomes, outputs and performance measures related to the delivery of projects of national significance or to facilitate reforms.
Net Acquisition/(Disposal) of Non‑Financial Assets from TransactionsPurchases (or acquisitions) of non‑financial assets less sales (or disposals) of non‑financial assets less depreciation plus changes in inventories and other movements in non‑financial assets.
Purchases and sales (or net acquisitions) of non‑financial assets generally include accrued expenses and payables for capital items. Purchases exclude non‑produced assets and valuables, which are included in other movements in non‑financial assets.
Net Actuarial GainsIncludes actuarial gains and losses on defined benefit superannuation plans.
Net Cash Flows from Investments in Financial Assets (Liquidity Management Purposes)Cash receipts from liquidation or repayment of investments in financial assets for liquidity management purposes less cash payments for such investments. Investment for liquidity management purposes means making funds available to others with no policy intent and with the aim of earning a commercial rate of return.
Net Cash Flows from Investments in Financial Assets (Policy Purposes) Cash receipts from liquidation or repayment of investments in financial assets for policy purposes less cash payments for acquiring financial assets for policy purposes. Acquisition of financial assets for policy purposes is distinguished from investments in financial assets (liquidity management purposes) by the underlying government motivation for acquiring the assets. Acquisition of financial assets for policy purposes is motivated by government policies such as encouraging the development of certain industries or assisting citizens affected by natural disasters.

106 Appendix B
2016-17 Budget
Net DebtNet debt measures a government’s net stock of selected gross financial liabilities less financial assets.
Net debt equals the sum of deposits held, advances received, government securities, loans and other borrowing less the sum of cash and deposits, advances paid, and investments, loans and placements.
Net Financial LiabilitiesTotal liabilities less financial assets, other than equity in public non financial corporations and public financial corporations. This measure is broader than net debt as it includes significant liabilities, other than borrowings (for example, accrued employee liabilities such as superannuation and long service leave entitlements). For the public non financial corporation and public financial corporation sectors, it is equal to negative net financial worth.
Net Financial WorthA measure of a government’s net holdings of financial assets. It is calculated from the Uniform Presentation Framework Balance Sheet as financial assets minus liabilities. Net financial worth is a broader measure than net debt as it incorporates provisions (such as superannuation, but excludes depreciation and doubtful debts) as well as holdings of equity. Net financial worth includes all classes of financial assets and liabilities.
Net Operating Balance The revenue from transactions minus expenses from transactions. It is a summary measure of the ongoing sustainability of operations and excludes gains and losses resulting from changes in price levels and other changes in the volume of assets. It is the component of the change in net worth that is due to transactions and can be attributed directly to government policies.
Net WorthProvides a relatively comprehensive picture of a government’s overall financial position. It is calculated as total assets less total liabilities less shares and other contributed capital. It includes a government’s non‑financial assets such as land and other fixed assets, which may be sold and used to repay debt, as well as its financial assets and liabilities including debtors, creditors and superannuation liabilities. Net worth also shows asset acquisitions over time, giving an indication of the extent to which borrowings are used to finance asset purchases, rather than only current expenditure.
Non Financial AssetsAssets that are not financial assets, predominantly land and other fixed assets.
Non Financial Public SectorThe sector formed through a consolidation of the general government and public non financial corporation subsectors.
Other Economic FlowsChanges in the volume or value of an asset or liability that do not result from transactions (such as revaluations and other changes in the volume of assets).

Appendix B 107
Budget Strategy and Outlook
Other Superannuation ExpenseIncludes all superannuation expenses from transactions except superannuation interest cost. It generally includes current service cost, which is the increase in entitlements associated with the employment services provided by employees in the current period. Superannuation actuarial gains/losses are excluded as they are considered other economic flows.
PayablesIncludes short‑term and long‑term trade debt and accounts payable, grants and interest payable.
Public Financial CorporationsGovernment‑controlled entities that perform central bank functions and/or have the authority to incur liabilities and acquire financial assets in the market on their own account.
Public Non Financial CorporationsPublic enterprises primarily engaged in the production of goods or services of a non‑financial nature, for sale in the market place at prices that aim to recover most of the costs involved.
ReceivablesIncludes short‑term and long‑term trade credit and accounts receivable, grants, taxes and interest receivable.
Sale of Goods and ServicesRevenue from the direct provision of goods and services and includes fees and charges for services rendered, sale of goods and services, fees from regulatory services and work done as an agent for private enterprises. It also includes rental income under operating leases and on produced assets such as buildings and entertainment, but excludes rental income from the use of non‑produced assets such as land. User charges include sale of goods and services revenue.
Specific Purpose PaymentsA Commonwealth financial contribution to support state delivery of services in a particular sector. Payments are made from the Commonwealth Treasury to state treasuries and are appropriated to the relevant Territory agency.
State Final DemandFinal consumption expenditure plus gross fixed capital formation in each jurisdiction. It represents the total expenditure on consumption and investment in a jurisdiction.
Superannuation Interest CostThe expense resulting from the increase in the liability due to the fact that, for all participants in the scheme, retirement (and death) is one year nearer, and so one fewer discount factors must be used to calculate the present value of the benefits for each future year. Interest cost is the increase during a period in the present value of a defined benefit obligation that arises because the benefits are one period closer to settlement, as per the relevant accounting standard. The cost is measured net of the return on plan assets of defined benefit schemes.
Tax Equivalents RegimeThe mechanism to ensure government business divisions and government owned corporations incur similar tax liabilities to privately owned organisations. Thus, greater parity exists between the cost structures of government‑controlled trading entities and the private sector, aiding in the achievement of competitive neutrality.

108 Appendix B
2016-17 Budget
Total Public SectorThe total public sector is formed through a consolidation of the non financial public sector and public financial corporations.
Treasurer’s AdvanceAn appropriation purpose of that name as specified in an Appropriation Act, which provides a pool of funds specifically set aside in each Budget to meet one‑off unexpected costs that arise during the year and are substantial enough to warrant additional appropriation.
Uniform Presentation FrameworkA uniform reporting framework agreed by the Australian Loan Council in 2000, which is a revision of the agreement reached at the 1991 Premiers’ Conference. The Uniform Presentation Framework (UPF) was further updated and re‑issued in April 2008 to incorporate accounting standard AASB 1049 Whole of Government and General Government Sector Financial Reporting. The UPF specifies that the Commonwealth, state and territory governments will present a minimum set of budget and financial outcome information on the Government Finance Statistics basis, according to an agreed format and specified Loan Council reporting arrangements.