budget notes long-term care homes & services · city council approve the 2019 staff recommended...
TRANSCRIPT

BUDGET NOTES
Long-Term Care Homes & Services What We Do
We are leaders in excellence and ground-breaking services for healthy aging, who provide a continuum of high quality
long-term care services to eligible adults in both long-term care homes and the community. Long-Term Care Homes &
Services (LTCHS) is responsible for maintaining 10 long-term care homes, with an asset book value of $248.829
million, in a state of good repair to meet Ministry of Health and Long-Term Care (MOHLTC) requirements and to ensure
the safety and comfort of our residents. These homes operate 24 hours a day, 365 days a year, providing permanent,
convalescent, and short-stay admissions. We also provide community support programs, including adult day programs,
supportive housing services, and homemakers and nursing services which provide a support system to help clients
maintain their independence and live in their own home. Long-Term Care Homes & Services delivers the following
services:
Long-Term Care Homes
Community Based Programs
Long-Term Care Homes & Services has stewardship over 10 long-term homes.
Why We Do It
The need for long-term care services is becoming increasingly important as the population ages, acuity and complexity
of resident care needs rises and the demand for specialized services increases. Long-Term Care Homes & Services
supports healthy aging strategies by providing increasingly complex interventions for responsive behaviour, associated
dementias and mental illness. In the community, our services enable residents to maintain independence either in their
own home or in supportive housing.
Our Experience & Success
•Continued implementation of the Council approved 2016-2020 LTCHS Service Plan and supported leadership excellence in healthy aging through continuous improvement, customer service, education, innovation, research, teamwork, partnerships and technology.
•Enhanced quality of care and quality of life for residents by refining and refreshing our Approach to Care model through implementation of new technology and cultivation of new programs and services to better meet the emerging needs of residents.
Key Challenges
•Aging demographic, acuity and complexity of resident care needs continues to rise requiring additional specialized services.
•Maintaining the City’s ten (10) LTC homes in a state of good repair to ensure the safety, security and comfort of residents; mitigate risk to the City; and comply with all legislated requirements.
•Advance the Provincially mandated redevelopment of five (5) of the ten (10) City operated long-term care homes (1,232 of its 2,641 Ministry approved beds) to meet new design standards.
Priority Actions
•Additional funding is included to meet the rising resident acuity and to maintain service level standards ($2.363 million gross, $0 net) and to add specialized staff to provide behavioural support programs to residents ($1.892 million gross $0 net).
• Implement new Approach of Care to transform provision of services by promoting best nursing practices at the bedside, interprofessional collaboration, and seamless coordination of care to improve resident outcomes and satisfaction with care.
•Funding is included to advance the capital maintenance plan to continue to maintain all ten (10) City operated long-term care homes in a state of good repair until redevelopment is possible.

2019 Operating Budget & 2019 - 2028 Capital Plan Long-Term Care Homes & Services
toronto.ca/budget2019 Budget Notes | Page 2 of 39
Budget At A Glance
Our Key Service Levels
Source of Image: www.icons8.com
Key Service Deliverables
Who We Serve
Long-Term Care Homes
Residents
Persons recovering from surgery or illness
Persons requiring respite
Family Caregivers (short-stay)
Staff & Volunteers Beneficiaries
Family Members & Partners
Healthcare Partners
Local Health Integration Networks
Ministry of Health & Long-Term Care
Community Based Programs
Frail Seniors
Persons (adults) with Disabilities
Persons with chronic illness over the age of 59 years
Beneficiaries
Family Members & Partners
Toronto Public Health
Housing Providers, including Toronto Community Housing
Healthcare Partners
Local Health Integration Networks Ministry of Health & Long-Term Care
Long-Term Care Homes
operate 365 days, 24hours/day
Convalescent Care program is operational
365 days, 24 hours/day
Behavioural Support services are available
365 days, 24 hours/day
The Adult Day Program operates from Monday-
Friday, 52 weeks per year
Supportive Housing Services are provided
365 days, 24 hours/per year
Homermakers & Nurses services are provided from
Monday-Friday, 52 weeks per year
STAFF RECOMMENDED OPERATING BUDGET
$Million 2019 2020 2021
Gross Expenditures $268.5 $271.2 $272.7
Revenues $219.1 $220.2 $221.4
Net Expenditures $49.4 $51.0 $51.3
Approved Positions 2,426.6 2,440.0 2,455.0
STAFF RECOMMENDED 10-YEAR CAPITAL PLAN
$Million 2019 2020-2028 Total
Gross Expenditures $10.9 $73.0 $83.9
Debt $7.0 $60.7 $67.7
Note: Excluding 2018 carry forward funding to 2019
Continue with the implementation of a multi-year Electronic Healthcare Record System (eHCR) project to modernize documentation of resident health records using technology
Continue the capital maintenance plan to address the required SOGR and Health and Safety requirements at 10 long-term care homes.
Deliver exemplary care and services through a continuum of care
Serve vulnerable individuals and respond to emerging community needs
Lead advances in long-term care and support services to seniors
Build capacity through high performing teams and strong partnerships
2019 Operating Budget & 2019 - 2028 Capital Plan Long-Term Care Homes & Services
toronto.ca/budget2019 Budget Notes | Page 3 of 39
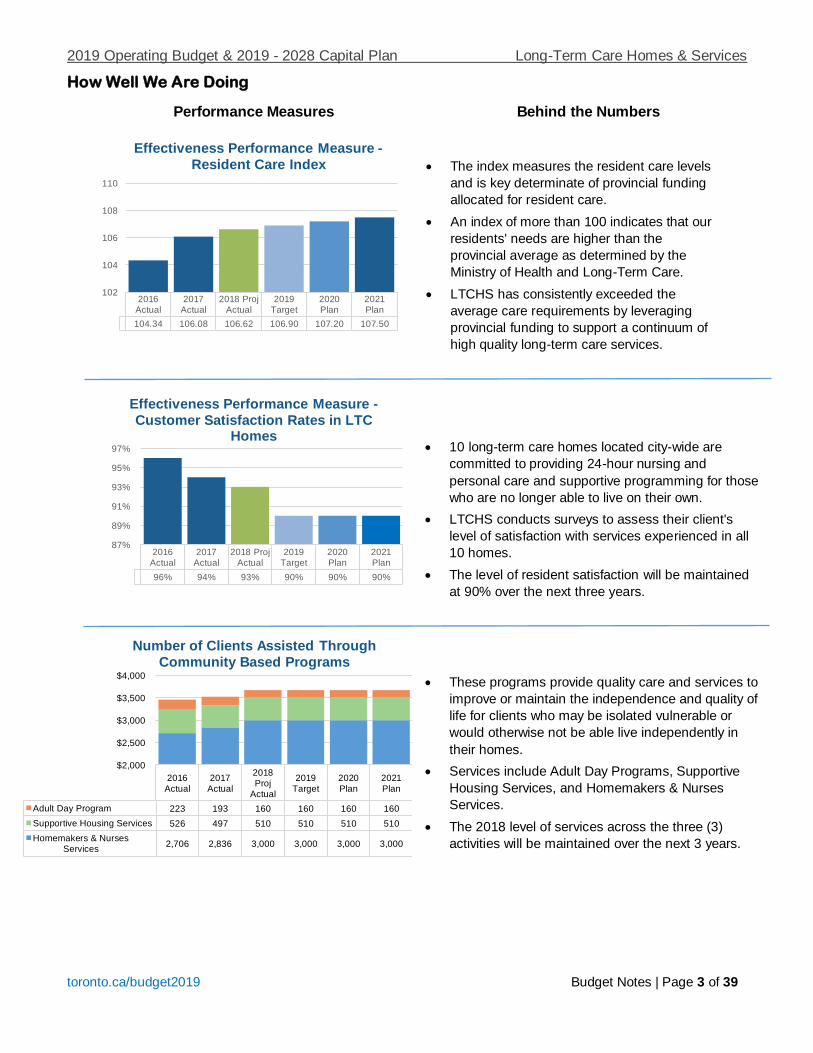
How Well We Are Doing
Performance Measures Behind the Numbers
The index measures the resident care levels
and is key determinate of provincial funding
allocated for resident care.
An index of more than 100 indicates that our
residents' needs are higher than the
provincial average as determined by the
Ministry of Health and Long-Term Care.
LTCHS has consistently exceeded the
average care requirements by leveraging
provincial funding to support a continuum of
high quality long-term care services.
10 long-term care homes located city-wide are
committed to providing 24-hour nursing and
personal care and supportive programming for those
who are no longer able to live on their own.
LTCHS conducts surveys to assess their client's
level of satisfaction with services experienced in all
10 homes.
The level of resident satisfaction will be maintained
at 90% over the next three years.
These programs provide quality care and services to
improve or maintain the independence and quality of
life for clients who may be isolated vulnerable or
would otherwise not be able live independently in
their homes.
Services include Adult Day Programs, Supportive
Housing Services, and Homemakers & Nurses
Services.
The 2018 level of services across the three (3)
activities will be maintained over the next 3 years.
2016
Actual
2017
Actual
2018
Proj
Actual
2019
Target
2020
Plan
2021
Plan
Adult Day Program 223 193 160 160 160 160
Supportive Housing Services 526 497 510 510 510 510
Homemakers & Nurses
Services2,706 2,836 3,000 3,000 3,000 3,000
$2,000
$2,500
$3,000
$3,500
$4,000
Number of Clients Assisted Through Community Based Programs
2016
Actual
2017
Actual
2018 Proj
Actual
2019
Target
2020
Plan
2021
Plan
96% 94% 93% 90% 90% 90%
87%
89%
91%
93%
95%
97%
Effectiveness Performance Measure -Customer Satisfaction Rates in LTC
Homes
2016
Actual
2017
Actual
2018 Proj
Actual
2019
Target
2020
Plan
2021
Plan
104.34 106.08 106.62 106.90 107.20 107.50
102
104
106
108
110
Effectiveness Performance Measure -
Resident Care Index

2019 Operating Budget & 2019 - 2028 Capital Plan Long-Term Care Homes & Services
toronto.ca/budget2019 Budget Notes | Page 4 of 39
CONTENTS Page
5 RECOMMENDATIONS
7 2019 STAFF RECOMMENDED OPERATING BUDGET
16 2019 - 2028 STAFF RECOMMENDED CAPITAL
BUDGET & PLAN
24 ISSUES FOR DISCUSSION
29 APPENDICES
30 1. 2019 Organization Chart
31 2. 2019 Operating Budget by Service
32 3. 2019 Service Levels
33 4. Summary of 2019 Recommended Service Changes
34 5. Summary of 2019 Recommended New & Enhanced Service Priorities
N/A 6. 2019 User Fee Rate Changes
35 7. 2019 Capital Budget; 2020 - 2028 Capital Plan
36 8. 2019 Cash Flow & Future Year Commitments
37 9. 2019 Capital Budget with Financing Detail
38 10. Reserve and Reserve Fund Review
Program / Agency:
Reg Paul
General Manager
Tel: (416) 392-8896
Email: [email protected]
Corporate:
Ritu Sadana
Manager, Financial Planning
Tel: (416) 395-6449
Email: [email protected]

2019 Operating Budget & 2019 - 2028 Capital Plan Long-Term Care Homes & Services
toronto.ca/budget2019 Budget Notes | Page 5 of 39
RECOMMENDATIONS

2019 Operating Budget & 2019 - 2028 Capital Plan Long-Term Care Homes & Services
toronto.ca/budget2019 Budget Notes | Page 6 of 39
RECOMMENDATIONS
The City Manager and Chief Financial Officer & Treasurer recommend that:
1. City Council approve the 2019 Staff Recommended Operating Budget for Long-Term Care Homes & Services of
$268.500 million gross, $49.429 million net for the following services:
Service: Gross ($000s)
Net ($000s)
Long-Term Care Homes & Services 255,228.8 47,859.7
Community Based Programs 13,270.9 1,569.3
Total Program Budget 268,499.7 49,429.0
2. City Council approve the 2019 service levels for Long-Term Care Homes & Services as outlined in Appendix 3
of this report, and associated staff complement of 2,426.6 positions, comprised entirely of operating positions.
3. City Council approve the 2019 Staff Recommended Capital Budget for Long-Term Care Homes & Services with
a total project cost of $8.590 million, and 2019 cash flow of $11.676 million and future year commitments of $3.198
million comprised of the following:
a. New Cash Flow Funds for:
1. Five new / change in scope sub-projects with a 2019 total project cost of $8.590 million that require
cash flows of $5.790 million in 2019 and future year cash flow commitments of $2.800 million for 2020
2. Five previously approved sub-projects with a 2019 cash flow of $3.750 million; and future year
cash flow commitments of $0.398 million for 2020;
3. Three previously approved sub-projects with carry forward funding from 2017 and prior years
requiring 2019 cash flow of $1.346 million that requires Council to reaffirm its commitment; and
b. 2018 approved cash flow for 4 previously approved sub-projects with carry forward funding from 2018
into 2019 totalling $0.790 million.
5. City Council approve the 2020 - 2028 Staff Recommended Capital Plan for Long-Term Care Homes & Services
of $69.819 million in project estimates, comprised of $5.177 million for 2020; $7.977 million for 2021; $8.150 million
for 2022; $8.150 million for 2023; $8.073 million for 2024; $8.073 million for 2025; $8.073 million for 2026; $8.073
million for 2027, and $8.073 million for 2028.

2019 Operating Budget & 2019 - 2028 Capital Plan Long-Term Care Homes & Services
toronto.ca/budget2019 Budget Notes | Page 7 of 39
2019 STAFF RECOMMENDED OPERATING BUDGET

2019 Operating Budget & 2019 - 2028 Capital Plan Long-Term Care Homes & Services
toronto.ca/budget2019 Budget Notes | Page 8 of 39
`PROGRAM MAP
2019 OPERATING BUDGET HIGHLIGHTS
2019 Staff Recommended Operating Budget $268.5M
Long-Term Care Homes & Services
Provides a variety of long‐term health care services for residents in the City’s long‐term care homes and for vulnerable individuals who reside in the community. As leaders in excellence and ground-breaking services for healthy aging, we are committed to providing exemplary long-term care
services and to actively participating in the creation of an effective continuum of care through strong partnerships with other healthcare organizations and community partners. Long-Term Care Homes & Services is committed to providing a co-ordinated and comprehensive approach to care that
recognizes the holistic needs, values, strengths and desires of each individual resident and client.
Long-Term Care Homes
Community Based Programs
Homemakers & Nurses Services
Adult Day Program
Supportive Housing Services
• 0.8% Budget decrease compared to the 2018 Approved Net Operating Budget.
• $0.248M Base Expenditure Changes from inflationary increases in salary and non-salary budgets.
• $0.615M Efficiency savings achieved through streamlining, transformation and modernization of
care model by using new technology and restructuring of administrative support.
• $1.892M New/enhanced funding to meet Provincial accountability requirements required to respond to the emerging needs within the long-term care system. 100% Provincially funded.
• 2020/2021 Increases primarily for known inflationary adjustments for salaries and benefits.
Long-Term Care Homes, $255.2, 95%
Community Based
Programs, $13.3, 5%
By Service
Prov / Fed, $163.3, 61%
User Fees & Other, $55.8, 21%
Property Tax, $49.4, 18%
By Funding Source

2019 Operating Budget & 2019 - 2028 Capital Plan Long-Term Care Homes & Services
toronto.ca/budget2019 Budget Notes | Page 9 of 39
2019 OPERATING BUDGET OVERVIEW
Table 1: 2019 Staff Recommended Operating Budget and Plan by Service
EQUITY IMPACTS
Increasing services for vulnerable seniors, persons with low income, and persons with disabilities living in
City directly-operated long-term care homes: Long-Term Care Homes & Services' 2019 Staff Recommended
Operating Budget includes funding for enhanced services in nursing hours to meet the complex care requirements
of existing and future residents, which will have a positive impact on vulnerable, low income seniors and person
with disabilities. This service expansion aligns with the goals of the Poverty Reduction Strategy and Toronto
Seniors Strategy.
Mitigating negative equity impacts for vulnerable seniors, persons with low income, and persons with
disabilities: The budget also includes efficiency savings, which will have low negative impacts on vulnerable, low
income seniors and persons with disabilities. Efficiencies include realignment of familiar staff and/or adjustments to
familiar staff work times and/or locations. Long-Term Care Homes & Services will work within existing resources to
mitigate negative impacts from these efficiencies.
Incremental Change
(In $000s)
BudgetProjected
Actual*Base
New /
Enhanced
Total Staff
Recommended
Budget
By Service $ $ $ $ $ $ % $ $
Long-Term Care Homes
Gross Expenditures 249,480.4 244,307.9 253,411.3 1,817.4 255,228.8 5,748.4 2.3% 2,670.9 1,467.2
Revenue 201,218.5 198,453.8 205,551.7 1,817.4 207,369.1 6,150.6 3.1% 1,082.8 1,214.3
Net Expenditures 48,261.8 45,854.1 47,859.7 47,859.7 (402.2) (0.8%) 1,588.0 253.0
Community Based Programs
Gross Expenditures 13,135.5 13,004.1 13,196.7 74.2 13,270.9 135.5 1.0% 34.1 1.8
Revenue 11,561.8 11,446.2 11,627.5 74.2 11,701.7 139.9 1.2% 0.0 0.0
Net Expenditures 1,573.7 1,557.9 1,569.3 1,569.3 (4.4) (0.3%) 34.1 1.8
Total
Gross Expenditures 262,615.8 257,312.0 266,608.1 1,891.6 268,499.7 5,883.9 2.2% 2,705.0 1,469.1
Revenue 212,780.3 209,900.0 217,179.1 1,891.6 219,070.8 6,290.5 3.0% 1,082.8 1,214.3
Total Net Expenditures 49,835.5 47,412.0 49,428.9 49,428.9 (406.6) (0.8%) 1,622.1 254.8
Approved Positions 2,389.9 2,389.9 2,408.7 17.9 2,426.6 36.7 1.5% 13.4 15.0
* Year-End Projection Based on Q3 2018 Variance Report
2020
Plan
2021
PlanChanges
2018 2019
Base Changes ($0.407M Net)
• Salary & benefit increases primarily from arbitration award for CUPE local L79 Part-Time Unit.
• Inflationary cost increases for utilities of $0.326 million.
• Above pressures more than offset by the adjustment of budget to actual experience and efficiency savings achieved through streamlining of operations, transformation and modernization of care model by using new technology and realigning staff resources.
New/Enhanced Service Priorities ($1.892M Gross / $0 Net)
• 100% Provincial funding to meet the Provincial LTC accountability requirements required to respond to the emerging needs within the long-term care system.
• The increased funding in 2019 will allow homes to hire additional nursing staff and enhance behavioral support programs and the Supporting Housing program.
Future Year Plan
• Known inflationary increases in salaries and benefits.

2019 Operating Budget & 2019 - 2028 Capital Plan Long-Term Care Homes & Services
toronto.ca/budget2019 Budget Notes | Page 10 of 39
2019 Staff Recommended Operating Budget Changes by Service
The 2019 Staff Recommended Operating Budget for Long-Term Care Homes & Services is $5.884 million gross
and $0.406 million net or 0.8% lower than the 2018 Council Approved Operating Budget. Table 2 below
summarizes the key cost drivers to maintain current service levels, recommended service changes that exceed the
budget target as well as recommended new and enhanced service priorities to meet outcomes.
Table 2: 2019 Staff Recommended Operating Budget Changes by Service
Note:
1. For additional information, refer to Appendix 4 (page 33) for a more detailed listing and descriptions of the 2019 Staff Recommended Service Changes and Appendix 5 (page 34) for the 2019 Staff Recommended New and Enhanced Service Priorities, respectively.
Long-Term
Care Homes
Community
Based
Programs
(In $000s) $ $ $ Positions
2018 Council Approved Operating Budget (Net) 48,261.8 1,573.7 49,835.5 2,389.9
Base Expenditure Changes:
Economic Factors
Hydro & Utility Inflationary Increases 325.7 325.7
Salaries and Benefits
COLA, Progression Pay, Step Increase and Benefits 1,997.1 72.2 2,069.3
Other Base Expenditure Changes
Interdivisional charges (Housing Unit 50% of PDO temp 1-yr position) and recoveries
from capital(71.4) (71.4)
Resident Acuity and Service Level Standards ($2.363M Gross) to maintain existing
support requirements0.0 23.7
Adjustment of Budget to Actual Experience (244.6) (3.4) (248.0)
Sub-total Base Expenditure Changes 2,006.8 68.8 2,075.6 23.7
Base Revenue Changes:
Level of Care Funding and User Fees (1,961.7) (65.7) (2,027.3)
Sub-total Base Revenue Changes (1,961.7) (65.7) (2,027.3)
Service Changes:
Service Efficiencies
Consolidate & Streamline Operations (181.1) (7.6) (188.7) (0.9)
Transformation and Modernization of Model of Care (101.7) (101.7)
Restructuring of Administrative Support (164.4) (164.4) (4.0)
Sub-total Service Changes1 (447.3) (7.6) (454.8) (4.9)
Total Base Changes 45.1 3.2 48.3 23.7
New & Enhanced Services:
Enhanced Service Priorities
Provincial LTC Program Accountability Requirements ($1.892M Gross) 0.0 0.0 0.0 17.9
Sub-total New & Enhanced Priorities1 17.9
Total 2019 Staff Recommended Operating Budget (Net) (402.2) (4.4) (406.6) 36.7
Services
Total

2019 Operating Budget & 2019 - 2028 Capital Plan Long-Term Care Homes & Services
toronto.ca/budget2019 Budget Notes | Page 11 of 39
Long-Term Care Homes Provide 24-hour resident-focused care and service including nursing and
personal care, behavioural support programs, medical services, recreational programming, dietetics and food
services, laundry, social work, spiritual and religious care, housekeeping, maintenance, trust and administrative
services. Lesbian, gay, bi and transgender (LGBT) supports, community outreach and extensive volunteer
programs are also available. Each home features a welcoming environment, offering special services and
programs, including language and cultural partnerships, designed to provide the best possible quality of life and to
respond to the needs of each individual resident. Homes provide permanent admission and may also offer
convalescent and/or short-stay admissions.
2019 Staff Recommended Operating Budget $255.2M
Refer to Appendix 2 (page 31) for the 2019 Staff Recommended Operating Budget by Service.
Key Service Levels
Refer to Appendix 3 (page 32) for a complete list of the 2019 Staff Recommended Service Levels for this Service.
Service Performance Measures
Long-Stay Home Services provides 24-hour care to
vulnerable individuals who require specific medical and
therapeutic services in a supportive environment on an
ongoing basis.
The occupancy rate will stay steady at 97% based on the
total number of resident days that long-stay beds are
occupied against the total number of long-stay bed days
available.
The Convalescent Care Program provides 24-hour care
to seniors who require specific medical and therapeutic
services in a supportive environment for a period of up to
90 continuous days per calendar year.
The occupancy rate of 80% is based on the total number
of residents occupying convalescent care beds against
the total number of convalescent care bed days
available.
Long-Term Care Homes operate 365days, 24 hours/day
Convalescent Care program is operational 365 days, 24 hours/day
Behavioural Support Care services are provided 365days, 24 hours/day
2016Actual
2017Actual
2018Proj
Actual
2019Target
2020Plan
2021Plan
99% 98% 97% 97% 97% 97%
95%
97%
99%
Effectiveness Performance Measure -Occupancy Rate of Long-Stay Home
Services
2016Actual
2017Actual
2018Proj
Actual
2019Target
2020Plan
2021Plan
80% 81% 80% 80% 80% 80%
78%
80%
82%
Effectiveness Performance Measure -Occupancy Rate of Convalescent Care
Services
Long-Term Care Homes, $255.2, 100%
Service BudgetBy Activity
Prov / Fed, $151.8, 59%
User Fees & Other, $55.5, 22%
Property Tax, $47.9, 19%
Service Budget By Funding Source

2019 Operating Budget & 2019 - 2028 Capital Plan Long-Term Care Homes & Services
toronto.ca/budget2019 Budget Notes | Page 12 of 39
Community Based Programs provide supports to help clients maintain their independence and live in
their own home. Programs are an integral part of the continuum of care that is available to ensure clients receive
the right level of care at the right time and place.
2019 Staff Recommended Operating Budget $13.3M
Refer to Appendix 2 (page 31) for the 2019 Staff Recommended Operating Budget by Service.
Key Service Levels
Refer to Appendix 3 (page 32) for a complete list of the 2019 Staff Recommended Service Levels for this Service.
Service Performance Measures
Represents the total number of clients assisted
through Community Based Programming in a 12
month period.
In 2018, it is projected that a total of 3,670 clients
will be supported and that this level of service will
be maintained over the next 3 years.
LTCHS conducts surveys for clients to assess
client satisfaction with services provided by asking
if the respondent would recommend the Community
Based Program received to others.
The level of resident satisfaction for the three (3)
support programs are projected to meet the
program's threshold of 95%.
The Adult Day Program operates from Monday-Friday, 52 weeks per year.
Supportive Housing Services are provided 365 days per year
Homemakers & Nurses services are provided from Monday-Friday, 52weeks per year
2016
Actual
2017
Actual
2018
Proj
Actual
2019
Target
2020
Plan
2021
Plan
Adult Day Program 223 193 160 160 160 160
Supportive Housing Services 526 497 510 510 510 510
Homemakers & Nurses
Services2,706 2,836 3,000 3,000 3,000 3,000
$2,000
$2,500
$3,000
$3,500
$4,000
Number of Clients Assisted Through Community Based Programs
2016
Actual2017
Actual
2018
Proj
Actual
2019
Target2020
Plan2021
Plan
Adult Day Program 100% 100% 95% 95% 95% 95%
Supportive Housing
Services96% 94% 95% 95% 95% 95%
Homemakers &
Nurses Services97% 95% 95% 95% 95% 95%
90%
92%
94%
96%
98%
100%
Effectiveness Performance Measure -Client Satisfaction Rate
Homemakers & Nurses Services, $6.3, 47%
Adult Day Program, $1.6, 12%
Supportive Housing Services, $5.4, 41%
Service BudgetBy Activity
Prov / Fed, $11.5, 86%
User Fees & Donations, $0.2, 2%
Property Tax, $1.6, 12%
Service Budget By Funding Source

2019 Operating Budget & 2019 - 2028 Capital Plan Long-Term Care Homes & Services
toronto.ca/budget2019 Budget Notes | Page 13 of 39
2018 OPERATING PERFORMANCE
2018 Service Performance
Key Service Accomplishments:
Implemented new nursing infrastructure by delineating the roles and responsibilities of clinical and operational
nursing leadership enhancing the home’s inter-professional teams.
Continued implementation of the Council-approved 2016-2020 LTCHS Service Plan and supported leadership
excellence in healthy aging through continuous improvement, customer service, education, innovation,
research, teamwork, partnerships and technology.
Advanced the implementation of the Council-approved LTCHS Capital Renewal Plan to address mandatory
redevelopment of five (5) long-term care homes to meet new design standards required by the Ministry of
Health and Long-Term Care (MOHLTC).
Enhanced quality of care and quality of life for residents by refining and refreshing the division’s Approach to
Care model.
Cultivated new programs and services to better meet the emerging needs of residents such as introducing a
clinical resource library and the Java Music Club program.
Developed and implemented standardized systems and processes that improved data accuracy.
Shared innovations and best practices as leaders in excellence and ground-breaking services for healthy aging
at provincial conferences.
Organized the 27th annual Toronto Challenge fund and awareness raising event to benefit over 40 non-profit
organizations that are improving the quality of life for Toronto seniors.
Introduced management leadership rounds to contribute to a positive work environment with opportunities to
connect with staff, identify and eliminate obstacles, increasing engagement and building trust through timely
follow up and effective communication.
Introduced the Just Culture Incident Protocol to support implementation of Quality of Care Information
Protection Act, 2016 (QCIPA).
Surveyed stakeholders on research opportunities within long-term care homes and community support
programs to assist operational outcomes, quality of life and care excellence for residents and clients.
Developed a specialized services model to better support and address the needs of an aging population with
lived experience of homelessness and/or previous shelter use as these eligible clients transition into long-term
care from Seaton House.
Status Update on 2018 Council Approved New & Enhanced Services
During the 2018 Budget process, City Council approved $2.069 million gross and $0 net for a new and enhanced
service priority in the 2018 Operating Budget for Long-Term Care Homes & Services. The implementation and
results to-date are highlighted below:
Resident Acuity and Service Level Standards ($2.069 million gross and $0 net, 17.9 permanent positions).
Fully funded by the Province, 22 direct care staff were hired in 2018 to support the relative intensification in
resident needs for nursing, personal care and rehabilitation. The Ministry of Health and Long-Term Care
(MOHLTC) measures acuity and adjusts funding annually to all long-term care homes in order to maintain the
necessary care and service levels ranging from level of care staffing, raw food and physiotherapy services.

2019 Operating Budget & 2019 - 2028 Capital Plan Long-Term Care Homes & Services
toronto.ca/budget2019 Budget Notes | Page 14 of 39
2018 Financial Performance
Table 3: Budget vs. Actual by Category of Expenditures and Revenues
Long-Term Care Homes & Services is projecting a net favourable variance of $2.424 million at year-end, primarily
from a favourable gross expenditure variance of $5.304 million due to underspending in 100% claims based
programs which is offset by underachieved revenues of $2.880 million to reflect lower than planned provincial
subsidies for 100% claims based programs.
For additional information regarding the 2018 Q3 operating variances and year-end projections, please refer to the
attached link for the report entitled "Operating Variance Report for the Nine-Month Period Ended September 30,
2018", adopted by City Council at its meeting on December 13, 2018.
http://app.toronto.ca/tmmis/viewAgendaItemHistory.do?item=2019.CC1.7
Impact of 2018 Operating Variance on the 2019 Staff Recommended Operating Budget
The favourable 2018 year-end variance is not anticipated to continue into 2019. Provincial long-term care
funding is highly complex and often targeted for specific initiatives. Accordingly, LTCHS carefully controls its
operating budget by ensuring that no spending occurs until anticipated provincial subsidy increases and/or
adjustments are confirmed.
The 2019 Staff Recommended Operating Budget has been developed based on reasonable assumptions with
respect to the timing and amount of expected funding levels from the MOHLTC.
2019
2017 2018
2018
Projected
Total Staff
Recommended
Category Actual Budget Actual * Budget
(In $000s) $ $ $ $ $ %
Salaries and Benefits 199,406.4 212,862.3 207,558.5 217,784.3 4,922.0 2.3%
Materials & Supplies 19,805.4 21,658.8 21,658.8 22,553.6 894.8 4.1%
Equipment 3,672.4 3,249.2 4,249.2 3,497.6 248.4 7.6%
Service and Rent 19,551.9 21,961.2 20,961.2 21,720.6 (240.5) (1.1%)
Contribution To Capital
Contribution To Reserves/Reserve Funds 1,954.2 1,959.8 1,959.8 1,959.8
Other Expenditures 178.2 192.4 192.4 192.4
Inter-Divisional Charges 869.2 732.1 732.1 791.4 59.3 8.1%
Total Gross Expenditures 245,437.7 262,615.8 257,312.0 268,499.7 5,883.9 2.2%
Inter-Divisional Recoveries 79.3 104.4 104.4 273.0 168.6 161.5%
Provincial Subsidies 145,167.3 160,624.1 157,743.8 163,287.4 2,663.3 1.7%
Federal Subsidies
Other Subsidies
User Fees & Donations 54,019.1 51,575.3 51,575.3 54,875.3 3,300.0 6.4%
Licences & Permits Revenue
Transfers From Capital 300.0 300.0 300.0
Contribution From Reserves/Reserve Funds
Sundry and Other Revenues 528.8 176.5 176.5 335.0 158.5 89.8%
Total Revenues 199,794.5 212,780.3 209,900.0 219,070.8 6,290.5 3.0%
Total Net Expenditures 45,643.2 49,835.5 47,412.0 49,428.9 (406.6) (0.8%)
Approved Positions 2,373.9 2,389.9 2,389.0 2,426.6 36.7 1.5%
* Year-End Projection Based on Q3 2018 Variance Report
2019 Change from
2018 Approved
Budget

2019 Operating Budget & 2019 - 2028 Capital Plan Long-Term Care Homes & Services
toronto.ca/budget2019 Budget Notes | Page 15 of 39
This Page Intentionally Left Blank

2019 Operating Budget & 2019 - 2028 Capital Plan Long-Term Care Homes & Services
toronto.ca/budget2019 Budget Notes | Page 16 of 39
2019 – 2028 STAFF RECOMMENDED CAPITAL BUDGET AND PLAN

2019 Operating Budget & 2019 - 2028 Capital Plan Long-Term Care Homes & Services
toronto.ca/budget2019 Budget Notes | Page 17 of 39
10-YEAR CAPITAL PLAN HIGHLIGHTS
Reserve Funds,
$16.2, 19%
Debt/CFC, $67.7, 81%
By Funding Source
• $2.052M Continue the implementation of the
service improvement project, Electronic Health Record System to enable electronic documentation of health records.
• $0.144M Begin the service improvement, Work Order Managment System project to investigate the feasibility of leveraging SAP-functionality to automate and modernize the existing work order tracking and asset management process.
• $4.265M Continue to implement projects to ensure that long-term care homes remain compliant with provincial health and safety standards.
• $4.425M Complete health and safety projects including building upgrades, electrical, mechanical and speciality system repairs to maintain the long-term care homes in a state of good repair.
• $30.922M Health & Safety projects to
ensure the 10 long-term care homes are in compliance with Ministry of Health and Long-Term Care (MOHLTC) requirements.
• $50.387M State of Good Repair projects
which include building upgrades, electrical, mechanical and specialty systems repairs and upgrades to the existing homes to prevent major capital costs through regular maintainence.
• $2.780M Service Improvement projects that will modernize service delivery by integrating technology solutions; electronically documenting resident health care records and support case-based decisions; and undertaking a feasibility study to automate tracking of work orders to better manage City's assets.
Reserve Funds,
$3.8, 35%Debt/CFC, $7.0, 65%
By Funding Source
Health & Safety,
$4.3, 39%
SOGR, $4.4, 41%
Service Improvement, $2.2, 20%
2019 Staff RecommendedCapital Budget $10.886M
By Project Category
Health & Safety,
$30.9, 37%
SOGR, $50.4, 60%
Service Improvement, $2.6, 3%
2019-2028 Staff RecommendedCapital Budget and Plan $83.903M
By Project Category

2019 Operating Budget & 2019 - 2028 Capital Plan Long-Term Care Homes & Services
toronto.ca/budget2019 Budget Notes | Page 18 of 39
2019 – 2028 CAPITAL BUDGET & PLAN OVERVIEW
Chart 1: 10-Year Capital Plan Overview
`
2019 2020 2021 2022 20232019 -
2023
5-Year
Total
Percent
BudgetProjected
Actual
Gross Expenditures by Project Category:
Health & Safety 7,328 4,265 2,873 2,973 2,973 2,973 16,057 36.9%
Legislated
SOGR 3,492 4,425 5,104 5,004 5,177 5,177 24,887 57.2%
Service Improvement 1,352 2,196 398 2,594 6.0%
Growth Related
Total by Project Category 12,172 10,886 8,375 7,977 8,150 8,150 43,538 100.0%
Program Debt Target 7,040 6,327 6,327 6,500 6,500 32,694
Financing:
Debt 7,684 7,040 6,327 6,327 6,500 6,500 32,694 75.1%
Reserves/Reserve Funds 3,050 3,846 2,048 1,650 1,650 1,650 10,844 24.9%
Development Charges
Provincial/Federal
Debt Recoverable
Other Revenue 1,438
Total Financing 12,172 10,886 8,375 7,977 8,150 8,150 43,538 100.0%
By Status:
2018 Capital Budget & Approved Future Year (FY) Commitments 12,172 10,035 3,438 3,438 7.9%
Changes to Approved FY Commitments 312 398 710 1.6%
2019 New/Change in Scope & FY Commitments 5,790 2,800 8,590 19.7%
2020 - 2023 Capital Plan Estimates 5,177 7,977 8,150 8,150 29,454 67.7%
2-Year Carry Forward for Reapproval 1,346 1,346 3.1%
1-Year Carry Forward to 2019 790
Total Gross Annual Expenditures & Plan 12,172 10,886 8,375 7,977 8,150 8,150 43,538 100.0%
Asset Value ($) at year-end 248,829 248,829 248,829 248,829 248,829 248,829 248,829
Yearly SOGR Backlog Estimate (not addressed by current plan)
Accumulated Backlog Estimate (end of year) 4,507 4,507 4,507 4,507 4,507 4,507 4,507
Backlog: Percentage of Asset Value (%) 1.8% 1.8% 1.8% 1.8% 1.8% 1.8%
Debt Service Costs 278 899 896 833 848 3,754
Operating Impact on Program Costs
New Positions
2019 Staff Recommended Capital Budget and 2020 - 2023 Capital Plan
2018
-
2,000
4,000
6,000
8,000
10,000
12,000
14,000
2018
Budget
2018
Projected Actual
2019
Staff Recommended
Budget
2020
Plan
2021
Plan
2022
Plan
2023
Plan
($00
0s)
2018 Carry Forward (into 2019) Gross Expenditures Debt Program Debt Target
Carry Fwd to 2019

2019 Operating Budget & 2019 - 2028 Capital Plan Long-Term Care Homes & Services
toronto.ca/budget2019 Budget Notes | Page 19 of 39
Chart 2: 10-Year Capital Plan Overview (Continued)
`
2024 2025 2026 2027 2028 2019 - 2028
10-Year
Total
Percent
Gross Expenditures by Project Category:
Health & Safety 2,973 2,973 2,973 2,973 2,973 30,922 36.9%
Legislated
SOGR 5,100 5,100 5,100 5,100 5,100 50,387 60.1%
Service Improvement 2,594 3.1%
Growth Related
Total by Project Category 8,073 8,073 8,073 8,073 8,073 83,903 100.0%
Program Debt Target 7,000 7,000 7,000 7,000 7,000 67,694
Financing:
Debt 7,000 7,000 7,000 7,000 7,000 67,694 80.7%
Reserves/Reserve Funds 1,073 1,073 1,073 1,073 1,073 16,209 19.3%
Development Charges
Provincial/Federal
Debt Recoverable
Other Revenue
Total Financing 8,073 8,073 8,073 8,073 8,073 83,903 100.0%
By Status:
2018 Capital Budget & Approved Future Year (FY) Commitments 3,438 4.1%
Changes to Approved FY Commitments 710 0.8%
2019 New/Change in Scope & FY Commitments 8,590 10.2%
2024 - 2028 Capital Plan Estimates 8,073 8,073 8,073 8,073 8,073 69,819 83.2%
2-Year Carry Forward for Reapproval 1,346 1.6%
Total Gross Annual Expenditures & Plan 8,073 8,073 8,073 8,073 8,073 83,903 100.0%
Asset Value($) at year-end 248,829 248,829 248,829 248,829 248,829 248,829
Yearly SOGR Backlog Estimate (not addressed by current plan)
Accumulated Backlog Estimate (end of year) 4,507 4,507 4,507 4,507 4,507 4,507
Backlog: Percentage of Asset Value (%) 1.8% 1.8% 1.8% 1.8% 1.8%
Debt Service Costs 870 913 913 913 913 8,277
Operating Impact on Program Costs
New Positions
2024 - 2028 Staff Recommended Capital Plan
0
1,000
2,000
3,000
4,000
5,000
6,000
7,000
8,000
9,000
2024 Plan 2025 Plan 2026 Plan 2027 Plan 2028 Plan
($00
0s)
Gross Expenditures Debt Program Debt Target

2019 Operating Budget & 2019 - 2028 Capital Plan Long-Term Care Homes & Services
toronto.ca/budget2019 Budget Notes | Page 20 of 39
Staff Recommended 10-Year Capital Plan by Project Category
Table 4: Summary of Capital Projects by Project Category
2019 - 2028 Key Capital Projects
The 10-Year Staff Recommended Capital Plan is critical to maintaining the City’s ten (10) long-term care homes
ensuring the safety, security and comfort of residents; mitigating risk to the City; and meeting compliance with all
legislated requirements.
Health and Safety
Health and Safety projects account for $30.922 million or 36.9% of the total 10-Year Staff Recommended
Capital Plan's expenditures. These projects, funded from debt and from the Homes for the Aged reserve funds,
support the general repairs and minor upgrades required to satisfy health and safety standards for all 10 homes
as follows:
Building Upgrades ($5.850 million) – Funding is provided for critical repairs to flooring, roofing, windows,
doors, paving & grounds and minor structural repairs.
Electrical ($12.074 million) – These funds are for work required for lighting upgrades, general electrical and
nurse call systems.
Mechanical ($10.973 million) – Funding is included for work on cooling and heating plants, HVAC control
systems and ventilation systems.
Speciality Systems ($2.025 million) – Funding is provided for capital maintenance work on elevators and
security equipment.
State of Good Repair (SOGR)
SOGR projects account for $50.387 million or 60.2% of the total 10-Year Staff Recommended Capital Plan's
spending. Debt funds provide the primary funding source for these projects to maintain homes in a state of
good repair to prevent major capital costs.
Building Upgrades ($28.251 million) – Funding is provided for planned repairs to flooring, roofing, paving &
grounds, accessibility upgrades, waterproofing and minor structural repairs.
Electrical ($6.905 million) – These funds are for work required for lighting retrofits, fire alarm system
replacements, nurse call systems, emergency generators and switchgear replacements.
(In $000s)
Total
App'd
Cash
Flows to
Date*
2019
Budget
2020
Plan
2021
Plan
2022
Plan
2023
Plan
2024
Plan
2025
Plan
2026
Plan
2027
Plan
2028
Plan
2019 - 2028
Total
Total
Project
Cost
Total Expenditures by Category
Health & Safety 30,922
BUILDING UPGRADES 650 650 650 650 650 650 650 650 650 5,850 5,850
ELECTRICAL 1,275 1,111 1,211 1,211 1,211 1,211 1,211 1,211 1,211 1,211 12,074 12,074
MECHANICAL 2,990 887 887 887 887 887 887 887 887 887 10,973 10,973
SPECIALTY SYSTEMS - 225 225 225 225 225 225 225 225 225 2,025 2,025
Sub-Total 4,265 2,873 2,973 2,973 2,973 2,973 2,973 2,973 2,973 2,973 30,922 30,922
State of Good Repair 50,387
BUILDING UPGRADES 2,790 2,829 2,829 2,829 2,829 2,829 2,829 2,829 2,829 2,829 28,251 28,251
ELECTRICAL 810 810 810 810 733 733 733 733 733 6,905 6,905
MECHANICAL 371 371 371 371 371 371 371 371 371 3,339 3,339
SPECIALTY SYSTEMS 1,635 1,094 994 1,167 1,167 1,167 1,167 1,167 1,167 1,167 11,892 11,892
Sub-Total 4,425 5,104 5,004 5,177 5,177 5,100 5,100 5,100 5,100 5,100 50,387 50,387
Service Improvement 3,296
Electronic Healthcare System 702 2,052 398 2,450 3,152
Work Order Management System 144 144 144
Sub-Total 702 2,196 398 2,594 3,296
Total Expenditures by Category (excluding carry
forward from 2018) 702 10,886 8,375 7,977 8,150 8,150 8,073 8,073 8,073 8,073 8,073 83,903 84,605
*Life to Date approved cash flows are provided for multi-year capital projects with cash flow approvals prior to 2018, excluding ongoing capital projects (i.e. Civic Improvement projects)

2019 Operating Budget & 2019 - 2028 Capital Plan Long-Term Care Homes & Services
toronto.ca/budget2019 Budget Notes | Page 21 of 39
Mechanical ($3.339 million) – Funding is provided for plumbing upgrades, heating/cooling plant upgrades,
and ventilation system upgrades.
Speciality Systems ($11.892 million) – Funding is provided for maintenance work on elevator systems,
laundry and kitchen equipment, resident lift systems and security systems.
Service Improvement
Service Improvement projects amount to $2.450 million or 2.9% of the total 10-Year Staff Recommended
Capital Plan's expenditures and are fully funded through the Homes for the Aged reserve.
The Electronic Healthcare Record System project ($2.450 million) is a multi-year project with total costs of
$3.152 million of which $0.702 million has been spent to date. This project will deliver a technology
solution to document resident health records and support case-based decisions.
The Work Order Management System (Seed) project ($0.144 million) will investigate the feasibility of using
SAP-functionality to automate and track work orders and to manage assets more effectively and efficiently.
The program will assess if this system meets all requirements before proceeding with an implementation
plan and to assess future business and cost requirements.
State of Good Repair (SOGR) Funding & Backlog
Long-Term Care Homes & Services' capital maintenance program ensures that life safety issues are addressed
and that all ten long-term care homes are maintained in a state of good repair to avoid future major costs from
becoming necessary.
The 10-Year Staff Recommended Capital Plan will fund $50.387 million of SOGR projects within Long-Term Care
Homes & Services over the 10-year period, providing an average of $5.039 million annually. This funding will
ensure the safety, security and comfort of residents as well as mitigate risks to the City while complying with the
Ministry of Health and Long-Term Care (MOHLTC) requirements.
The accumulated backlog at the end of 2018 is estimated to be $4.507 million. Continuous SOGR funding through
the 10-year period will ensure the backlog is maintained at $4.507 million or 1.8% of the asset replacement value of
$248.829 million.
Chart 3: Total SOGR Funding & Backlog
In $ Millions 2018 2019 2020 2021 2022 2023 2024 2025 2026 2027 2028
SOGR Funding 3.492 4.425 5.104 5.004 5.177 5.177 5.100 5.100 5.100 5.100 5.100
Accumulated Backlog Est. 4.507 4.507 4.507 4.507 4.507 4.507 4.507 4.507 4.507 4.507 4.507
Backlog % of Asset Value 1.8% 1.8% 1.8% 1.8% 1.8% 1.8% 1.8% 1.8% 1.8% 1.8% 1.8%
Total Asset Value 248.829 248.829 248.829 248.829 248.829 248.829 248.829 248.829 248.829 248.829 248.829
0.0%
5.0%
10.0%
15.0%
20.0%
25.0%
30.0%
0.000
1.000
2.000
3.000
4.000
5.000
6.000
2018 2019 2020 2021 2022 2023 2024 2025 2026 2027 2028
Ba
cklo
g %
Ass
et
Va
lue
SOGR Funding Accumulated Backlog Est. Backlog % of Asset Value
In $
Mil
lio
ns
2019 Operating Budget & 2019 - 2028 Capital Plan Long-Term Care Homes & Services
toronto.ca/budget2019 Budget Notes | Page 22 of 39
2018 CAPITAL PERFORMANCE
2018 Project Delivery
During 2018, Long-Term Care Homes & Services accomplished the following capital projects and activities:
Procured a cloud-based solution and commenced the implementation of a new electronic healthcare record (eHCR) and resident information management system that will support financial and clinical care management
in all long-term care homes.
Collaborated with Children's Services to build a new Children's Day Care at Bendale Acres that will open in
early 2019
Continued implementation of LTCHS's capital maintenance program by ensuring that life safety issues were
addressed and that homes were maintained in a state of good repair, mitigating risk to the City, and meeting
compliance with all legislated requirements.
Status Update on Council Approved New Capital Projects in the 2018 Capital Budget
During the 2018 Budget process, City Council approved 4 new capital sub-projects totalling $5.890 million in cash
flow funding with $4.180 million debt funding included in the 2018 Capital Budget for Long-Term Care Homes &
Services. This investment is included in the ongoing capital maintenance program which is in keeping with
LTCHS' objectives to ensure all health and safety issues are addressed and that the physical assets are maintained
in a state of good repair. The implementation status is detailed below:
Building, Electrical and Mechanical maintenance work was completed at Bendale Acres which included HVAC
upgrades, window replacements, exterior glazing and masonry replacement and enhancements to visitor
reception areas.
At Castleview Wychwood Towers long-term care home upgrades were completed to resident bathing and
washrooms, dining areas, flooring and service elevators. The home also converted a controlled smoking room
to a resident laundry room.
Additional upgrades were made to: Nursing call and fire alarm systems (Cummer Lodge), service elevators
(Fudger House), building automation (Wesburn Manor), HVAC systems (Seven Oaks), solarium upgrades
(True Davidson Acres) and enhancements to visitor reception areas (Lakeshore Lodge).
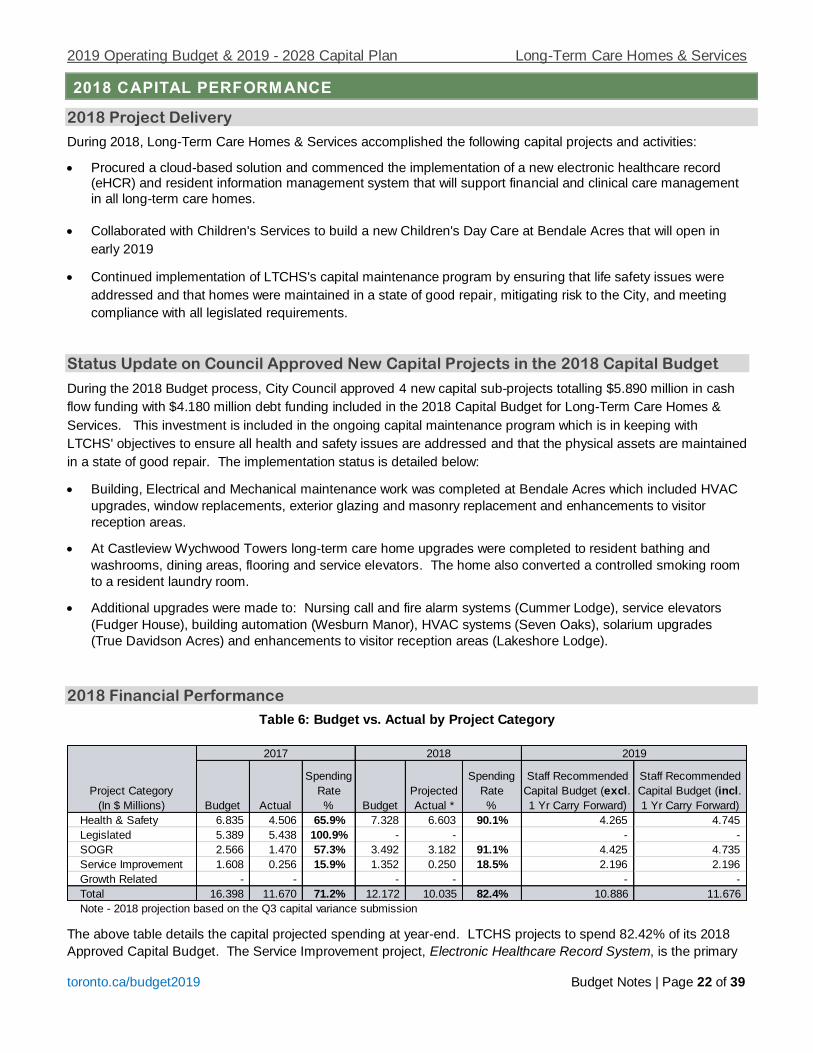
2018 Financial Performance
Table 6: Budget vs. Actual by Project Category
The above table details the capital projected spending at year-end. LTCHS projects to spend 82.42% of its 2018
Approved Capital Budget. The Service Improvement project, Electronic Healthcare Record System, is the primary
Budget Actual
Spending
Rate
% Budget
Projected
Actual *
Spending
Rate
%
Staff Recommended
Capital Budget (excl.
1 Yr Carry Forward)
Staff Recommended
Capital Budget (incl.
1 Yr Carry Forward)
Health & Safety 6.835 4.506 65.9% 7.328 6.603 90.1% 4.265 4.745
Legislated 5.389 5.438 100.9% - - - -
SOGR 2.566 1.470 57.3% 3.492 3.182 91.1% 4.425 4.735
Service Improvement 1.608 0.256 15.9% 1.352 0.250 18.5% 2.196 2.196
Growth Related - - - - - -
Total 16.398 11.670 71.2% 12.172 10.035 82.4% 10.886 11.676
Note - 2018 projection based on the Q3 capital variance submission
2019
Project Category
(In $ Millions)
2017 2018

2019 Operating Budget & 2019 - 2028 Capital Plan Long-Term Care Homes & Services
toronto.ca/budget2019 Budget Notes | Page 23 of 39
reason for underspending in 2018. This project experienced significant challenges in procuring a vendor due to the
strict requirements surrounding compliance with data sensitivity and security. The vendor has been procured and
the project is anticipated to be completed in 2020.
For additional information regarding the 2018 Q3 capital variances and year-end projections for Long-Term Care
Homes & Services, please refer to the attached link for the report entitled "Capital Variance Report for the Nine-
Month Period Ended September 30, 2018" adopted by City Council at its meeting on December 13, 2018.
http://app.toronto.ca/tmmis/viewAgendaItemHistory.do?item=2019.CC1.8
Impact of the 2018 Capital Variance on the 2019 Staff Recommended Capital Budget
As a result of the delays in the capital project described in the 2018 Q3 Capital Variance Report, funding of
$0.790 million is being carried forward from 2018 for inclusion in the 2019 Staff Recommended Capital Budget
to continue the capital work.
In addition, $1.346 million in cash flow funding for Health and Safety projects (2017 H&S Life Safety Systems
and 2017 H&S HVAC) and the Electronic Healthcare System project is being carried forward from 2017, funded
from the Homes for the Aged Reserve and requires Council to reaffirm its commitment, consistent with the
treatment of funding being carried forward 2 or more years.
The 2019 - 2028 Staff Recommended Capital Budget and Plan includes revised cash flow funding estimates for the Electronic Healthcare System project. The Program has realigned cash flow estimates in 2019 based on the revised project timelines and activities.
2019 Operating Budget & 2019 - 2028 Capital Plan Long-Term Care Homes & Services
toronto.ca/budget2019 Budget Notes | Page 24 of 39
ISSUES FOR DISCUSSION

2019 Operating Budget & 2019 - 2028 Capital Plan Long-Term Care Homes & Services
toronto.ca/budget2019 Budget Notes | Page 25 of 39
ISSUES IMPACTING THE 2019 BUDGET
2019 Budget Overview
2019 Operating Budget:
Long-Term Care Homes & Services (LTCHS) provides a variety of long-term health care services for over
2,600 residents, primarily adults whose average age is 85 +, with multiple diagnoses and varying degrees of
physical frailties, cognitive impairment and complex care needs in the City's 10 long–term care homes through
permanent, convalescent, and short-stay programs.
In addition, the Program provides community-based services to clients through community support programs,
including adult day programs, supportive housing services, and homemaking services.
All services delivered by the Program are provincially regulated under the Long-Term Care Homes Act,
2007, Home Care and Community Services Act, 1994 and Homemakers and Nurses Services Act, 1990.
Long-Term Care Homes & Services (LTCHS) is guided by its CARE (Compassion | Accountability | Respect |
Excellence) values and is committed to providing a co-ordinated and comprehensive approach to resident care
that recognizes the holistic needs, values, strengths and desires of each individual resident and client.
Ministry of Health and Long-Term Care (MOHLTC) provides operating funds for nursing and personal care,
programming and support services, and covers a portion of residents’ accommodation costs, if needed (based
on a standardized income test). Residents contribute toward their accommodation costs (e.g. housekeeping,
food, laundry, lighting and heating) through a “resident co-payment.” The City funds approximately 18% of the
Program’s Operating Budget.
The City of Toronto is facing significant issues and challenges:
As verified by the 2016 Census, Toronto has an aging population, and it is expected that the growing
population of seniors (65 and older) will accelerate and by 2031, one-quarter of the City's population will be
over the age of 60 years which poses significant challenges as it would require both systems and capacity
to provide quality care and service.
As the population ages and lives longer, in addition to the capacity issues, the resident acuity continues to
rise requiring more complex interventions and the need for specialized services.
Included in the 2019 Staff Recommended Operating Budget is additional provincial funding of $2.360 million to
add 23.7 full time equivalent positions necessary to support the relative intensification in residents' needs for
nursing, personal care and rehabilitation. Additionally, provincial funding of $1.892 million is included as the
"Provincial LTC Program Accountability Requirements" enhancement to add 17.9 nursing positions to enhance
behavioural support programs and the Supportive Housing Program necessary to meet higher service
accountability requirements set out by MOHLTC and LHINs.
Acknowledging the need to increase the capacity of long-term care beds in Ontario, the Province has
committed to create 15,000 new LTC beds by 2022 and another 15,000 over the next decade to respond to the
demand and to reduce the waitlists for LTC placement, included in the Province's Aging with Confidence:
Ontario's Action Plan for Seniors.
City Council, at its meeting of May 22, 2018, adopted CD28.1, Ontario's Action Plan for Seniors Includes a
Focus on Long-Term Care and made several recommendations including directing the General Manager,
Long-Term Care Homes & Services to enter into discussions with Provincial officials to improve capital and
operating funding and to strengthen the City's role in service planning for long-term care services, and
report back on progress in 2019.
The Program will work closely with the Province and LHINs to meet the challenges placed on the City and
seize the opportunities that will ensure high quality long-term care services are available for Torontonians
for generations to come.

2019 Operating Budget & 2019 - 2028 Capital Plan Long-Term Care Homes & Services
toronto.ca/budget2019 Budget Notes | Page 26 of 39
10-Year Capital Plan:
The 2018 Council Approved Capital Budget for LTCHS was $12.172 million primarily dedicated towards the
capital maintenance program to maintain the City's long-term care homes at its current level of state of good
repair and to complete the service improvement project, Electronic Healthcare Record System, initiated in
2016, to enable electronic documentation of health records.
LTCHS experienced significant delays in the delivery of the Electronic HealthCare Record System project
since its inception, related to both procurement and cloud based privacy reviews (this is the first CoT cloud-
based solution with personal health data), that contributed towards a spend rate of 71.2%. The unspent
cash flow funding, that includes 2-year carry forward funding from 2017, has been carried forward into
2019.
The Staff Recommended 2019-2028 Capital Plan of $83.903 million, invests heavily in the capital maintenance
program, which is in keeping with LTCHS' objectives to ensure all health and safety issues are addressed and
that the physical assets are maintained in a state of good repair to ensure safe and secure places for residents
and visitors.
The Staff Recommended 10-Year Capital Plan reflects an increase of $1.956 million or 2.6% in capital funding
when compared to the 2018-2027 Approved Capital Plan with key changes summarized as follows:
Due to slight delays of ongoing electrical and mechanical repairs in Health and Safety systems, $0.244
million in debt funding previously approved in 2017 will be re-budgeted in 2019.
Due to revised project delivery schedule and timelines for the Electronic HealthCare Record System
project, $1.102 million in funding from the Homes for the Aged Reserve previously approved in 2017 will be
re-budgeted in 2019, with previously planned cash flow funding from 2018 re-phased to 2019 and 2020.
Additionally, the project costs have been adjusted by an additional $0.312 million in 2019 and $0.398
million in 2020 with funding provided from the Homes for the Aged Reserve to reflect the changed
timelines. With the procurement of a vendor now complete, the project is expected to be completed by
2020.
A new project, the Workflow Order Management System has been added to the plan with seed funding of
$0.144 million in 2019 from the Homes for the Aged Reserve to undertake a feasibility study to evaluate
options to modernize the existing work order tracking and asset management process, which is mostly
manual, by implementing technological solutions, including automation and leveraging the SAP Work-Order
System application used by other City divisions.
Despite added capital investments as noted above, Long-Term Care Homes & Services still requires $521.441
million, in capital funding that cannot be accommodated in the 2019-2028 Staff Recommended Capital Budget
and Plan. These unmet capital needs are discussed in detail in the following sections.
Additional Service Demands
Capital Unmet Needs Not Included in the 2019 – 2028 Staff Recommended Capital
Budget and Plan
The LTCHS Capital Renewal Plan, approved by City Council in November 2015, identified the mandatory
redevelopment of 5 homes with an inventory of 1,232 beds to meet the new provincial design standards and
modernize environments. The redevelopment of the 4 sites (the fifth site, is captured under the George Street
Revitalization Project), envisioned to replace the existing inventory will require funding of $396.000 million, with
the City initially funding this as debt.
The MOHLTC provides a Construction Funding Subsidy (CFS) on a per bed per day basis (per diem) over
25 years, to support the costs of developing and/or redeveloping an eligible LTC home subject to all
applicable requirements. The per diem commences once the home admits its first resident. The CFS does

2019 Operating Budget & 2019 - 2028 Capital Plan Long-Term Care Homes & Services
toronto.ca/budget2019 Budget Notes | Page 27 of 39
not cover the cost of land. The MOHLTC will provide funding on a per diem basis totaling $198.421 million
($137.542 million for the 4 sites plus $60.879 million for 378 LTC beds at the George Street Revitalization
project) over a 25-year period following project completion of redeveloping 1232 beds
City Council at its meeting of May 22, 2018 adopted CD28.1, "Ontario's Action Plan for Seniors Includes a
Focus on Long-Term Care," acknowledging the Provincial commitment of creating 15,000 new LTC beds by
2022 and another 15,000 over the next decade to respond to the demand and to reduce the waitlists for LTC
placement. http://app.toronto.ca/tmmis/viewAgendaItemHistory.do?item=2018.CD28.1
In the same meeting, City Council, in recognition of the opportunities presented to Toronto, deemed it
feasible to increase capacity by adding more LTC beds into larger vertical communities, along with
affordable housing, community hubs and co-located City services to address the needs of vulnerable and
aging populations.
In addition to several recommendations to the Province to augment operating and capital funding to
Toronto, City Council adopted the goal of 2,018 beds for the four locations where additional capacity was
identified, representing an increase of 978 beds to the existing inventory of 2641 beds, and would be the
first increase in City operated beds in approximately 30 years. Council requested the increased bed target
be incorporated in the LTCHS capital renewal plan and requested the General Manager, LTCHS to
continue collaboration with Shelter, Support and Housing Administration, Social Development, Finance and
Administration and other City Divisions in the renewal and redevelopment of the sites.
One of the four sites where additional bed capacity was identified falls beyond the 10-year Capital Plan,
resulting in the potential to add 614 new beds within the 10-year Capital Plan. The total cost of the bed
expansion proposed by Council brings the total unmet needs to $626.070 million ($521.441 million over a
10-year period and $104.629 million beyond 2028) as summarized in the table below.
Table 8: Unmet Capital Needs Not Included in the Staff Recommended 10-Year Capital Plan
The "Unmet Capital Needs" identified by Long-Term Care Homes & Services as noted in the table above will
require additional debt funding to proceed. The "Unmet Capital Needs" identified above cannot be
accommodated within the City's current debt targets given the limitations on debt servicing costs and therefore
were not included in the 10-Year Capital Plan for LTCHS. These projects will be included on the list of
unfunded capital needs to be considered for funding in future years with other corporate priorities.
# of
Beds
Non-Debt
Funding
Debt
Funding
Project
Cost
# of
Beds
Non-Debt
Funding
Debt
Funding
Project
Cost
# of
Beds
Non-Debt
Funding
Debt
Funding
Project
Cost
2019-
2023
2024-
2028
CWT Redevelopment 456 256 41.230 73.770 115.000 256 41.230 58.627 99.857 512 82.461 132.396 214.857 5.943 208.914
Esther Shiner Blvd. 127 160 25.769 57.231 83.000 268 43.163 49.724 92.887 428 68.932 106.955 175.887 102.988 72.899
Lakeshore Lodge
Redevelopment150 192 30.923 48.577 79.500 0 192 30.923 48.577 79.276 1.700 77.576
Seven Oaks
Redevelopment 3 249 246 39.620 78.880 118.500 90 14.495 23.055 37.550 336 54.115 101.935 156.050 51.421 104.629
Fudger House 4 250 0 0
George Street
Revitalization 5 0 378 0 378
Total Costs of Base
+ Expansion1232 1232 137.542 258.458 396.000 614 98.889 131.405 230.294 1846 236.431 389.863 626.070 110.631 410.810 104.629
(2) Council bed target includes redevelopment beyond 10-year Capital Plan and is intended to maximize potential site capacity.
(3) Planned completion of Seven Oaks is in 2030 at a cost of $104.6M from 2029-2030 ($69.0M in Debt and $35.6M in Non-Debt).
(5) To be delivered by Shelter, Support & Housing Administration but recoverable debt will be realized from LTC portion of project.
(4) Fudger House is not currently included in 10-Year Plan. The estimated cost is $164.0M ($58.6M in non-debt funding and $105.4M debt funding) based on 364 beds
with a construction period from 2029-2035. Including Fudger House in the above tables increases the total number of beds per Expansion from 614 to 978.
2029-
20302
Cash Flow
(In $ Millions)
Expansion
(as requested by Council)Project
Current
# of
Beds
Redevelopment1
(Base Level)Total Project Cost
(1) The Redevelopment Plan assumes the mandated replacement of 1,232 existing beds. The replacement beds will be distributed to optimize operational efficiency.

2019 Operating Budget & 2019 - 2028 Capital Plan Long-Term Care Homes & Services
toronto.ca/budget2019 Budget Notes | Page 28 of 39
OTHER ISSUES IMPACTING THE 2019 BUDGET
Modernization, Transformation and Innovation Initiatives
Long-Term Care Homes & Services has undertaken a multi-year approach to implement modernization and
transformation initiatives aimed at increasing efficiency and to improve the service delivery to meet the evolving
needs of residents. Below are initiatives that have been undertaken:
In 2017, the Program implemented a quality improvement project using Lean Six Sigma methodologies to
streamline the steps in the admissions process, enhance dining services by reducing service times and to reduce
the Convalescent Care application review process from 5 days to 1 day. LTCHS also implemented wireless Voice
Over Internet Protocol (VOIP) phones for improved communication between families, residents and staff and a call-
centre software by the Centralized Call-In-Unit (CCIU) that included call management and tracking features to
improve the analysis of shift replacement data for planning purposes and increased employee satisfaction.
In 2018, the Program focused on realigning the Rehabilitation Assistant (RA) staff duties from providing assistance
to physiotherapists to supporting nurses in ongoing restorative care and services, recognizing the availability of
provincial funding accessible to physiotherapists to provide their own assistants. This initiative provided service
efficiency savings of $0.356 million and strengthened restorative and rehabilitation care to all residents.
The 2019 Staff Recommended Operating Budget, includes the implementation of two transformation and
modernization of care initiatives by using new technology and realigning the administrative and staff resources as
follows:
Initially implemented in 2016, the Electronic Healthcare Record System (eHCR) will be operational in 2019 and
will modernize the capturing and management of resident information. This state-of-the-art technology will
replace an outdated manual system currently in use and will provide the advantages of providing timely metrics
and aid in decision making. This initiative will also reduce manual process and paperwork which will enable
staff to provide more time towards direct care in order to improve quality of care and create greater client
satisfaction.
The Transformation & Modernization of Care (savings in 2019 of $0.102 million from a reduction of 2 positions)
will transform care and services provided to residents through the promotion of best nursing practices at the
bedside, the improvement of inter-professional collaboration, and the seamless coordination of care that will
improve resident outcomes and increase the overall satisfaction of residents, family and staff. This initiative will
also enhance staff competencies and accountability and will optimize succession planning and recruitment of
talented employees to ensure the continuity of service delivery that will further strengthen resident and family
centred care.
Continued efforts will be made to explore opportunities to further modernize, transform and innovate service
delivery by developing partnerships to advance healthy aging strategies including creation of community hubs, safe
spaces for seniors and vulnerable individuals.

2019 Operating Budget & 2019 - 2028 Capital Plan Long-Term Care Homes & Services
toronto.ca/budget2019 Budget Notes | Page 29 of 39
APPENDICES

2019 Operating Budget & 2019 - 2028 Capital Plan Long-Term Care Homes & Services
toronto.ca/budget2019 Budget Notes | Page 30 of 39
Appendix 1
2019 Organization Chart
The 2019 total staff complement includes the General Manager and staff for a total of 2,425.6 positions, comprising
0 capital positions and 2,426.6 operating positions as summarized in the table below.
2019 Total Complement
CategorySenior
Management
Management
with Direct
Reports
Management
without Direct
Reports/Exempt
Professional &
Clerical
Union Total
Permanent 1.0 163.7 2.0 2,259.9 2,426.6
Temporary - - -
Total Operating 1.0 163.7 2.0 2,259.9 2,426.6
Permanent - - -
Temporary - - -
Total Capital - - - - -
Grand Total 1.0 163.7 2.0 2,259.9 2,426.6
Operating
Capital
2019 Operating Budget & 2019 - 2028 Capital Plan Long-Term Care Homes & Services
toronto.ca/budget2019 Budget Notes | Page 31 of 39
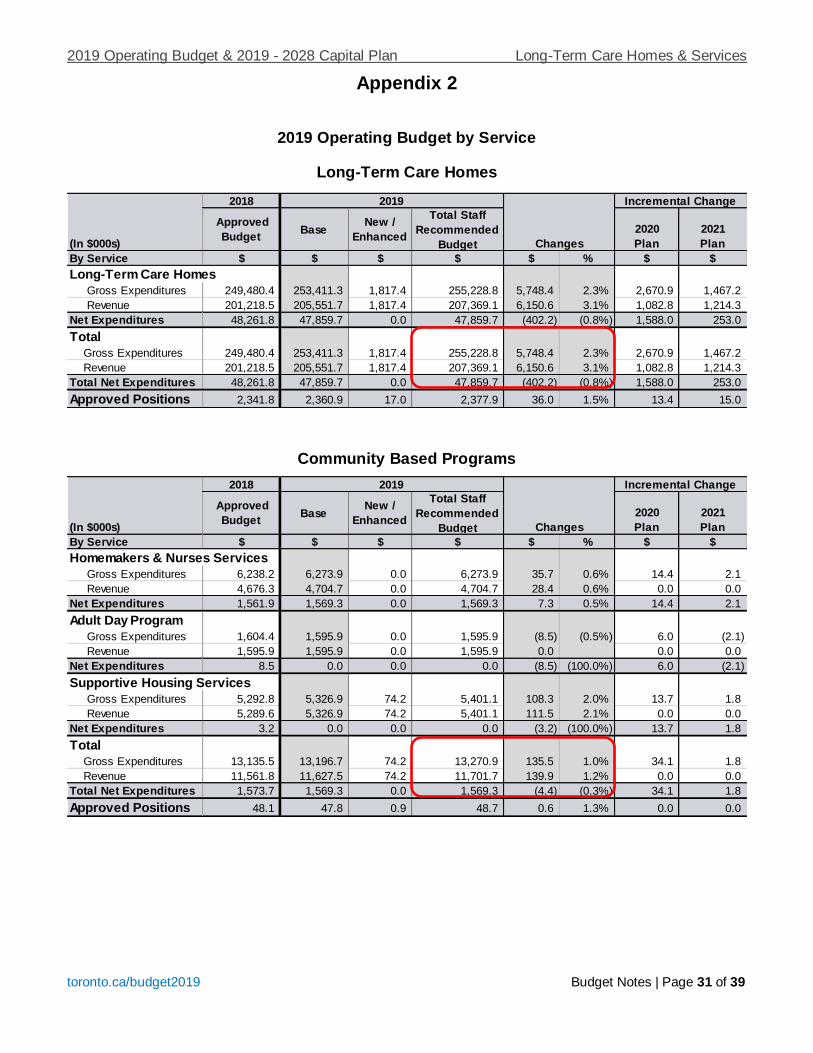
Appendix 2
2019 Operating Budget by Service
Long-Term Care Homes
Community Based Programs
Incremental Change
(In $000s)
Approved
BudgetBase
New /
Enhanced
Total Staff
Recommended
Budget
By Service $ $ $ $ $ % $ $
Long-Term Care Homes
Gross Expenditures 249,480.4 253,411.3 1,817.4 255,228.8 5,748.4 2.3% 2,670.9 1,467.2
Revenue 201,218.5 205,551.7 1,817.4 207,369.1 6,150.6 3.1% 1,082.8 1,214.3
Net Expenditures 48,261.8 47,859.7 0.0 47,859.7 (402.2) (0.8%) 1,588.0 253.0
Total
Gross Expenditures 249,480.4 253,411.3 1,817.4 255,228.8 5,748.4 2.3% 2,670.9 1,467.2
Revenue 201,218.5 205,551.7 1,817.4 207,369.1 6,150.6 3.1% 1,082.8 1,214.3
Total Net Expenditures 48,261.8 47,859.7 0.0 47,859.7 (402.2) (0.8%) 1,588.0 253.0
Approved Positions 2,341.8 2,360.9 17.0 2,377.9 36.0 1.5% 13.4 15.0
2018 2019
Changes
2020
Plan
2021
Plan
Incremental Change
(In $000s)
Approved
BudgetBase
New /
Enhanced
Total Staff
Recommended
Budget
By Service $ $ $ $ $ % $ $
Homemakers & Nurses Services
Gross Expenditures 6,238.2 6,273.9 0.0 6,273.9 35.7 0.6% 14.4 2.1
Revenue 4,676.3 4,704.7 0.0 4,704.7 28.4 0.6% 0.0 0.0
Net Expenditures 1,561.9 1,569.3 0.0 1,569.3 7.3 0.5% 14.4 2.1
Adult Day Program
Gross Expenditures 1,604.4 1,595.9 0.0 1,595.9 (8.5) (0.5%) 6.0 (2.1)
Revenue 1,595.9 1,595.9 0.0 1,595.9 0.0 0.0 0.0
Net Expenditures 8.5 0.0 0.0 0.0 (8.5) (100.0%) 6.0 (2.1)
Supportive Housing Services
Gross Expenditures 5,292.8 5,326.9 74.2 5,401.1 108.3 2.0% 13.7 1.8
Revenue 5,289.6 5,326.9 74.2 5,401.1 111.5 2.1% 0.0 0.0
Net Expenditures 3.2 0.0 0.0 0.0 (3.2) (100.0%) 13.7 1.8
Total
Gross Expenditures 13,135.5 13,196.7 74.2 13,270.9 135.5 1.0% 34.1 1.8
Revenue 11,561.8 11,627.5 74.2 11,701.7 139.9 1.2% 0.0 0.0
Total Net Expenditures 1,573.7 1,569.3 0.0 1,569.3 (4.4) (0.3%) 34.1 1.8
Approved Positions 48.1 47.8 0.9 48.7 0.6 1.3% 0.0 0.0
2018
Changes
2020
Plan
2021
Plan
2019

2019 Operating Budget & 2019 - 2028 Capital Plan Long-Term Care Homes & Services
toronto.ca/budget2019 Budget Notes | Page 32 of 39
Appendix 3
2019 Service Levels
Long-Term Care Homes
Overall, the 2019 Service Levels are consistent with the approved 2018 Service Levels for Long-Term Care Homes.
Community Based Programs
Overall, the 2019 Service Levels are consistent with the approved 2018 Service Levels for Community-Based
Programs.
Activity Type Service Level Description Status 2016 2017 2018 2019
Approved 366 365 365 365
Actual 366 365 365
Approved 366 365 365 365
Actual 366 365 365
Approved 366 365 365 365
Actual 366 365 365
Approved 366 365 365 365
Actual 366 365 365
Resident Care - Long Stay
# of days long-term care homes for
extended period of time is operational
for 24 hours/day
Resident Care - Short Stay
# of days short-stay admission
program is operational for 24
hours/day
Behavioural Support Care# of days behaviour support program
is operational for 24 hours/day
Convalescent Care# of days convalescent care program
is operational for 24 hours/day
Activity Type Service Level Description Status 2016 2017 2018 2019
Approved 52 52 52 52
Actual 52 52 52
Approved 366 365 365 365
Actual 366 365 365
Approved 52 52 52 52
Actual 52 52 52
Homemakers & Nurses
ServicesHomemaking
# of weeks the homemaking service
is available from Monday to Friday
Adult Day Program Adult Day Services# of weeks the adult day program is
operational from Monday to Friday
Supportive Housing
ServicesPersonal Care and Homemaking
# of days the personal care and
homemaking services is provided for
24 hours/day

2019 Operating Budget & 2019 - 2028 Capital Plan Long-Term Care Homes & Services
toronto.ca/budget2019 Budget Notes | Page 33 of 39
Appendix 4
Summary of 2019 Service Changes
$ $ #
Gross Net Gross Net Gross Net Pos. Net Pos. Net Pos.
Service Efficiencies
Consolidate & Streamline Operations (341.1) (181.1) (7.6) (7.6) (348.7) (188.7) (0.9) 2.4 0.8
Transformation and Modernization of Model of Care (101.7) (101.7) (101.7) (101.7) 2.0 2.1
Restructuring of Administrative Support (164.4) (164.4) (164.4) (164.4) (4.0) 13.2 17.0
Sub-Total (607.3) (447.3) (7.6) (7.6) (614.8) (454.8) (4.9) 17.6 19.9
Total 2019 Service Changes (607.3) (447.3) (7.6) (7.6) (614.8) (454.8) (4.9) 17.6 19.9
2020 Plan 2021 Plan
Service Changes Total Service Changes Incremental Change
Description ($000s)
Long-Term Care
Homes
Community Based
Programs
2019 Operating Budget - Staff Recommended Service ChangesSummary by Service ($000's)
505.68 Service: Long-Term Care Homes
Total Staff Recommended Changes: (341.1) (160.0) (181.1) (0.91) 2.6 1.1
7.99 Service: LTCHS - Community Based Programs
Total Staff Recommended Changes: (7.6) 0.0 (7.6) 0.02 (0.2) (0.2)
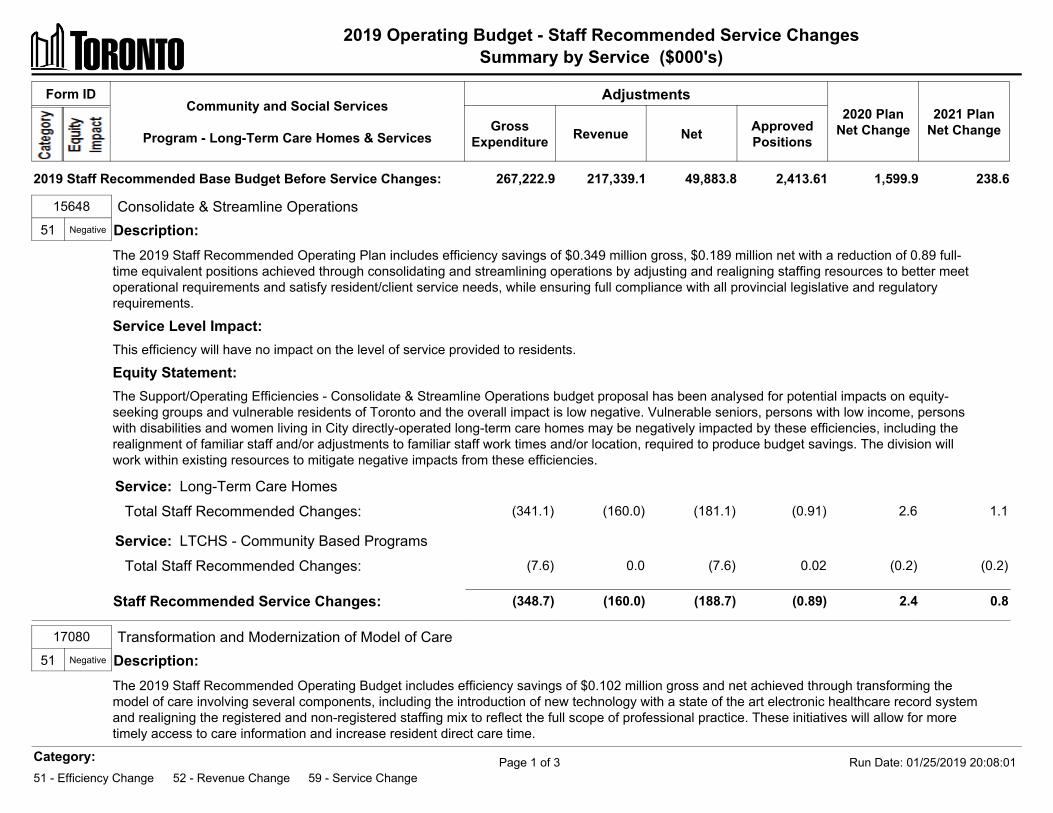
15648 Consolidate & Streamline Operations51 Negative Description:
The 2019 Staff Recommended Operating Plan includes efficiency savings of $0.349 million gross, $0.189 million net with a reduction of 0.89 full-time equivalent positions achieved through consolidating and streamlining operations by adjusting and realigning staffing resources to better meetoperational requirements and satisfy resident/client service needs, while ensuring full compliance with all provincial legislative and regulatoryrequirements.
Service Level Impact:This efficiency will have no impact on the level of service provided to residents.
Staff Recommended Service Changes: (348.7) (160.0) (188.7) (0.89) 2.4 0.8
Equity Statement:The Support/Operating Efficiencies - Consolidate & Streamline Operations budget proposal has been analysed for potential impacts on equity-seeking groups and vulnerable residents of Toronto and the overall impact is low negative. Vulnerable seniors, persons with low income, personswith disabilities and women living in City directly-operated long-term care homes may be negatively impacted by these efficiencies, including therealignment of familiar staff and/or adjustments to familiar staff work times and/or location, required to produce budget savings. The division willwork within existing resources to mitigate negative impacts from these efficiencies.
17080 Transformation and Modernization of Model of Care51 Negative Description:
The 2019 Staff Recommended Operating Budget includes efficiency savings of $0.102 million gross and net achieved through transforming themodel of care involving several components, including the introduction of new technology with a state of the art electronic healthcare record systemand realigning the registered and non-registered staffing mix to reflect the full scope of professional practice. These initiatives will allow for moretimely access to care information and increase resident direct care time.
Form IDCommunity and Social Services
Program - Long-Term Care Homes & Services
Adjustments2020 Plan
Net Change2021 Plan
Net ChangeGrossExpenditure Revenue Net Approved
Positions
2019 Staff Recommended Base Budget Before Service Changes: 267,222.9 217,339.1 49,883.8 2,413.61 1,599.9 238.6
Category:51 - Efficiency Change 52 - Revenue Change 59 - Service Change
Run Date: 01/25/2019 20:08:01Page 1 of 3

2019 Operating Budget - Staff Recommended Service ChangesSummary by Service ($000's)
105.81 Service: Long-Term Care Homes
Total Staff Recommended Changes: (101.7) 0.0 (101.7) 0.00 2.0 2.1
Service Level Impact:Service levels will be fully maintained and the effectiveness and quality of care and service will be improved. This efficiency will allow for more timelyaccess to care information and increase resident direct care time.
Staff Recommended Service Changes: (101.7) 0.0 (101.7) 0.00 2.0 2.1
Equity Statement:The Transformation & Modernization of Care budget proposal has been analyzed for potential impacts on equity-seeking groups and vulnerableresidents of Toronto and the overall impact is low negative. Vulnerable seniors, persons with low-income, persons with disabilities and women livingin City directly-operated long-term care homes may be impacted as realignment of registered and non-registered staff is required to support theintroduction of new electronic healthcare record system and resulting efficiencies required to produce budget savings. The division will work withinexisting resources to mitigate negative impacts from these efficiencies.
198.64 Service: Long-Term Care Homes
17326 Restructuring of Administrative Support51 Negative Description:
The 2019 Staff Recommended Operating Plan includes an efficiency savings of $0.164 million gross, $0.164 million net with a reduction of 4.0FTEpositions. Following an in-depth review of administrative support functions within LTCHS, opportunities to streamline business processes wereidentified including consolidating the programs human resources into fewer, but more specialized and skilled positions. The restructuring of theadministrative support functions in each of the homes and at the head office is expected to provide operational efficiencies.
Service Level Impact:Service levels will be fully maintained and the effectiveness and quality of care and service is expected to improve.
Equity Statement:The Restructuring of Administrative Support budget proposal has been analysed for potential impacts on equity-seeking groups and vulnerableresidents of Toronto and the overall impact is low negative. Vulnerable seniors, persons with low income, persons with disabilities and women livingin City directly-operated long-term care homes may be negatively impacted by these efficiencies, including the realignment of familiar staff and/oradjustments to familiar staff work times and/or location, required to produce budget savings. The division will work within existing resources tomitigate negative impacts from these efficiencies.
Form IDCommunity and Social Services
Program - Long-Term Care Homes & Services
Adjustments2020 Plan
Net Change2021 Plan
Net ChangeGrossExpenditure Revenue Net Approved
Positions
Category:51 - Efficiency Change 52 - Revenue Change 59 - Service Change
Run Date: 01/25/2019 20:08:01Page 2 of 3

2019 Operating Budget - Staff Recommended Service ChangesSummary by Service ($000's)
Total Staff Recommended Changes: (164.4) 0.0 (164.4) (4.00) 13.2 17.0
Staff Recommended Service Changes: (164.4) 0.0 (164.4) (4.00) 13.2 17.0
Form IDCommunity and Social Services
Program - Long-Term Care Homes & Services
Adjustments2020 Plan
Net Change2021 Plan
Net ChangeGrossExpenditure Revenue Net Approved
Positions
Summary:
Staff Recommended Service Changes: (614.8) (160.0) (454.8) (4.89) 17.6 19.9
Staff Recommended Base Budget: 266,608.1 217,179.1 49,428.9 2,408.72 1,617.6 258.5
Category:51 - Efficiency Change 52 - Revenue Change 59 - Service Change
Run Date: 01/25/2019 20:08:01Page 3 of 3

2019 Operating Budget & 2019 - 2028 Capital Plan Long-Term Care Homes & Services
toronto.ca/budget2019 Budget Notes | Page 34 of 39
Appendix 5
Summary of 2019 New / Enhanced Service Priorities
$ $ Position
Gross Net Gross Net Gross Net # Net Pos. Net Pos.
Enhanced Service Priorities
Staff Initiated:
Provincial LTC Program Accountability Requirements 1,817.4 74.2 1,891.6 17.9 4.6 (3.7)
Sub-Total Staff Initiated 1,817.4 74.2 1,891.6 17.9 4.6 (3.7)
Total Enhanced Services 1,817.4 74.2 1,891.6 17.9 4.6 (3.7)
Total 2019 New / Enhanced Services 1,817.4 74.2 1,891.6 17.9 4.6 (3.7)
Incremental Change
New / Enhanced Service Description
(in $000s)
Long-Term Care
Homes
Community Based
Programs 2020 Plan 2021 Plan
New and Enhanced Services Priorities Total

2019 Operating Budget - Staff Recommended New and Enhanced ServicesSummary by Service ($000's)
3,659.6 Service: Long-Term Care Homes
Total Staff Recommended Changes: 1,817.4 1,817.4 0.0 17.00 4.3 (3.4)
149.84 Service: LTCHS - Community Based Programs
Total Staff Recommended Changes: 74.2 74.2 0.0 0.86 0.3 (0.3)
17592 Provincial LTC Program Accountability Requirements72 Positive Description:
The 2019 Staff Recommended Operating Budget provides funding of $1.892 million gross, $0 net to add 17.86 permanent positions to enhance thebehavioural support programs and the Supportive Housing Program. With 100% funding provided by the Ministry of Health and Long-Term Care(MOHLTC), LTCHS will hire specialized nursing staff that meet the criteria and conditions as set out by the Province and the 5 Greater Toronto Area(GTA) Local Health Integration Networks (LHINs).
Service Level Impact:Additional funding will allow LTCHS to support the rising needs of the existing client base specifically in behavioural support programs and theSupporting Housing Program which is required and crucial to meet higher service accountability requirements.
Staff Recommended New/Enhanced Services: 1,891.6 1,891.6 0.0 17.86 4.6 (3.7)
Equity Statement:The Provincial LTC Program Accountability Requirements budget proposal has been analysed for potential impacts on equity-seeking groups andvulnerable residents of Toronto and the overall impact is high positive. Vulnerable seniors, persons with low income, persons with disabilities andwomen living in City directly-operated long-term care homes will be positively impacted by the increase in nursing hours, 17.86 positions, critical tomeet the complex care requirements of existing and future residents and clients entering the City's long-term care (LTC) system.
Form IDCommunity and Social Services
Program - Long-Term Care Homes & Services
Adjustments2020 Plan
Net Change2021 Plan
Net ChangeGrossExpenditure Revenue Net Approved
Positions
Summary:
Staff Recommended New / Enhanced Services: 1,891.6 1,891.6 0.0 17.86 4.6 (3.7)
Run Date: 01/25/2019 20:14:06Page 1 of 1Category:71 - Operating Impact of New Capital Projects 74 - New Services72 - Enhanced Services-Service Expansion 75 - New Revenues

2019 Operating Budget & 2019 - 2028 Capital Plan Long-Term Care Homes & Services
toronto.ca/budget2019 Budget Notes | Page 35 of 39
Appendix 7
2019 Capital Budget; 2020 - 2028 Capital Plan Including Carry Forward Funding
(In $000s)
Total
App'd
Cash
Flows to
Date*
2019
Budget
2020
Plan
2021
Plan
2022
Plan
2023
Plan
2024
Plan
2025
Plan
2026
Plan
2027
Plan
2028
Plan
2019 -
2028
Total
Total
Project
Cost
Total Expenditures by Category
Health & Safety 31,402
BUILDING UPGRADES 650 650 650 650 650 650 650 650 650 5,850 5,850
ELECTRICAL 1,375 1,111 1,211 1,211 1,211 1,211 1,211 1,211 1,211 1,211 12,174 12,174
MECHANICAL 3,140 887 887 887 887 887 887 887 887 887 11,123 11,123
SPECIALTY SYSTEMS 230 225 225 225 225 225 225 225 225 225 2,255 2,255
Sub-Total 4,745 2,873 2,973 2,973 2,973 2,973 2,973 2,973 2,973 2,973 31,402 31,402
State of Good Repair 50,697
BUILDING UPGRADES 3,100 2,829 2,829 2,829 2,829 2,829 2,829 2,829 2,829 2,829 28,561 28,561
ELECTRICAL - 810 810 810 810 733 733 733 733 733 6,905 6,905
MECHANICAL - 371 371 371 371 371 371 371 371 371 3,339 3,339
SPECIALTY SYSTEMS 1,635 1,094 994 1,167 1,167 1,167 1,167 1,167 1,167 1,167 11,892 11,892
Sub-Total 4,735 5,104 5,004 5,177 5,177 5,100 5,100 5,100 5,100 5,100 50,697 50,697
Service Improvement 3,296
Electronic Healthcare System 702 2,052 398 2,450 3,152
Work Order Management System 144 144 144
Sub-Total 702 2,196 398 2,594 3,296
Total Expenditures by Category (including carry
forward from 2018) 702 11,676 8,375 7,977 8,150 8,150 8,073 8,073 8,073 8,073 8,073 84,693 85,395

Jan-17-2019 13:48:33 Page 1 of 3 Report 7C
Debt -Recoverable
ReservesReserveFunds
Capitalfrom
Current Other 1 Other2 DebtTotal
Financing
Sub- Project No. Project Name
PrioritySubProj No. Sub-project Name
Long Term Care Homes and Services
Report Phase 2 - Program 14 Long Term Care Homes and Services Program Phase 2 Sub-Project Category 01,02,03,04,05,06,07 Part B Sub-Project Status S2,S5,S6 Part C Sub-Project Status S2,S3,S4
Ward Stat. Cat.
Current and Future Year Cash Flow Commitments Financed By
Total Total Total
2019-2023 2024-2028 2019-20282020 2021 2022 2023
Current and Future Year Cash Flow Commitments
ProvincialGrants andSubsidies
DevelopmentCharges
FederalSubsidy2019
Gross Expenditures ($000's)
CITY OF TORONTO
HOM907345 BUILDING UPGRADES
0 3 HEALTH & SAFETY FUTURE YEARS 0 0 0 0 0 0 5,850 5,850001S6CW 0 650 650 650 650 2,600 3,250 5,850 0 0
0 4 SOGR FUTURE YEARS 0 0 10,315 0 0 0 12,846 23,161003S6CW 0 529 2,829 2,829 2,829 9,016 14,145 23,161 0 0
0 15 2018 SOGR Building Upgrades 0 0 1,310 0 0 0 1,300 2,610003S2CW 2,610 0 0 0 0 2,610 0 2,610 0 0
0 16 2019 SOGR Building Upgrades 0 0 1,650 0 0 0 1,140 2,790003S5CW 490 2,300 0 0 0 2,790 0 2,790 0 0
Sub-total 0 13,275 0 0 0 21,136 34,41103,100 3,479 3,479 3,479 3,479 17,016 17,395 34,411 0 00
HOM907346 ELECTRICAL
0 3 SOGR FUTURE YEARS 0 0 0 0 0 0 6,905 6,905003S6CW 0 810 810 810 810 3,240 3,665 6,905 0 0
0 7 HEALTH & SAFETY FUTURE YEARS 0 0 0 0 0 0 10,799 10,799001S6CW 0 1,111 1,211 1,211 1,211 4,744 6,055 10,799 0 0
0 12 2017 H&S LIFE SAFETY SYSTEMS 0 0 0 0 0 0 165 165001S2CW 165 0 0 0 0 165 0 165 0 0
0 13 2018 H&S Life Safety Systems 0 0 0 0 0 0 100 100001S2CW 100 0 0 0 0 100 0 100 0 0
0 14 2019 H&S Life Safety Systems 0 0 0 0 0 0 1,110 1,110001S4CW 1,110 0 0 0 0 1,110 0 1,110 0 0
Sub-total 0 0 0 0 0 19,079 19,07901,375 1,921 2,021 2,021 2,021 9,359 9,720 19,079 0 00
HOM907347 MECHANICAL
0 2 HEALTH & SAFETY FUTURE YEARS 0 0 0 0 0 0 7,483 7,483001S6CW 0 387 887 887 887 3,048 4,435 7,483 0 0
0 3 SOGR FUTURE YEARS 0 0 0 0 0 0 3,339 3,339003S6CW 0 371 371 371 371 1,484 1,855 3,339 0 0
0 15 2017 H&S HVAC 0 0 0 0 0 0 79 79001S2CW 79 0 0 0 0 79 0 79 0 0
0 17 2018 H&S HVAC 0 0 0 0 0 0 650 650001S2CW 650 0 0 0 0 650 0 650 0 0
0 19 2019 H&S HVAC 0 0 650 0 0 0 2,261 2,911001S5CW 2,411 500 0 0 0 2,911 0 2,911 0 0
Sub-total 0 650 0 0 0 13,812 14,46203,140 1,258 1,258 1,258 1,258 8,172 6,290 14,462 0 00
HOM907348 SPECIALTY SYSTEMS
0 2 HEALTH & SAFETY FUTURE YEARS 0 0 0 0 0 0 2,025 2,025001S6CW 0 225 225 225 225 900 1,125 2,025 0 0
0 3 SOGR FUTURE YEARS 0 0 0 0 0 0 10,257 10,257003S6CW 0 1,094 994 1,167 1,167 4,422 5,835 10,257 0 0
0 20 2018 H&S Specialty Systems 0 0 0 0 0 0 230 230001S2CW 230 0 0 0 0 230 0 230 0 0
0 22 2019 SOGR Specialty Systems 0 0 0 0 0 0 1,635 1,635003S4CW 1,635 0 0 0 0 1,635 0 1,635 0 0
Sub-total 0 0 0 0 0 14,147 14,14701,865 1,319 1,219 1,392 1,392 7,187 6,960 14,147 0 00

Jan-17-2019 13:48:33 Page 2 of 3 Report 7C
Debt -Recoverable
ReservesReserveFunds
Capitalfrom
Current Other 1 Other2 DebtTotal
Financing
Sub- Project No. Project Name
PrioritySubProj No. Sub-project Name
Long Term Care Homes and Services
Report Phase 2 - Program 14 Long Term Care Homes and Services Program Phase 2 Sub-Project Category 01,02,03,04,05,06,07 Part B Sub-Project Status S2,S5,S6 Part C Sub-Project Status S2,S3,S4
Ward Stat. Cat.
Current and Future Year Cash Flow Commitments Financed By
Total Total Total
2019-2023 2024-2028 2019-20282020 2021 2022 2023
Current and Future Year Cash Flow Commitments
ProvincialGrants andSubsidies
DevelopmentCharges
FederalSubsidy2019
Gross Expenditures ($000's)
CITY OF TORONTO
HOM908198 Electronic Healthcare System
0 1 Electronic Healthcare System 0 0 2,450 0 0 0 0 2,450004S2CW 2,052 398 0 0 0 2,450 0 2,450 0 0
Sub-total 0 2,450 0 0 0 0 2,45002,052 398 0 0 0 2,450 0 2,450 0 00
HOM908670 Work Order Management System
0 1 Design Phase 0 0 144 0 0 0 0 144004S4CW 144 0 0 0 0 144 0 144 0 0
Sub-total 0 144 0 0 0 0 1440144 0 0 0 0 144 0 144 0 00
Total Program Expenditure 0 0 16,519 0 0 0 68,174 84,693011,676 8,375 7,977 8,150 8,150 44,328 40,365 84,693 0 0

Jan-17-2019 13:48:33 Page 3 of 3 Report 7C
Ward Stat. Cat.
Debt -Recoverable
Reserves
ReserveFunds
Capitalfrom
Current Other 1 Other2 Debt
TotalFinancing
Sub- Project No. Project Name
Priority SubProj No. Sub-project Name
Financed By:
Total Total Total
2019-2023 2024-2028 2019-20282020 2021 2022 2023
Current and Future Year Cash Flow Commitments and Estimates
2019
Report Phase 2 - Program 14 Long Term Care Homes and Services Program Phase 2 Sub-Project Category 01,02,03,04,05,06,07 Part B Sub-Project Status S2,S5,S6 Part C Sub-Project Status S2,S3,S4
CITY OF TORONTO
Gross Expenditures ($000's)
Long Term Care Homes and Services
Current and Future Year Cash Flow Commitments and Estimates Financed By
ProvincialGrants andSubsidies
Federal DevelopmentSubsidy Charges
0 0 16,519 0 0 0 0 0 16,519Reserve Funds (Ind."XR" Ref.) 4,156 2,048 1,650 1,650 1,650 11,154 5,365 16,519 0 0
0 0 0 0 0 0 68,174 0 68,174Debt 7,520 6,327 6,327 6,500 6,500 33,174 35,000 68,174 0 0
Total Program Financing 0 0 16,519 0 0 0 68,174 0 84,69311,676 8,375 7,977 8,150 8,150 44,328 40,365 84,693 0 0
Status Code Description
S2 S2 Prior Year (With 2019 and\or Future Year Cashflow)
S3 S3 Prior Year - Change of Scope 2019 and\or Future Year Cost\Cashflow)
S4 S4 New - Stand-Alone Project (Current Year Only)
S5 S5 New (On-going or Phased Projects)
S6 S6 New - Future Year (Commencing in 2020 & Beyond)
Category Code Description
Health and Safety C0101
Legislated C0202
State of Good Repair C0303
Service Improvement and Enhancement C0404
Growth Related C0505
Reserved Category 1 C0606
Reserved Category 2 C0707

2019 Operating Budget & 2019 - 2028 Capital Plan Long-Term Care Homes & Services
toronto.ca/budget2019 Budget Notes | Page 36 of 39
Appendix 8
2019 Cash Flow and Future Year Commitments
(In $000s) 2019 2020 2021 2022 2023 2024 2025 2026 2027 2028
Total 2019
Cash Flow
& FY
Commits
Expenditures:
Previously Approved 6,284
BUILDING UPGRADES 2,610 2,610
ELECTRICAL 265 265
Electronic Healthcare System 2,052 398 2,450
MECHANICAL 729 729
Subtotal 5,886 398 6,284
New w/Future Year 8,590
BUILDING UPGRADES 490 2,300 2,790
ELECTRICAL 1,110 1,110
MECHANICAL 2,411 500 2,911
SPECIALTY SYSTEMS 1,635 1,635
Work Order Management System 144 144
Subtotal 5,790 2,800 8,590
Total Expenditure (including carry forward from
2018) 11,676 3,198 14,874
Financing: 14,874
Debt/CFC 7,520 1,150 8,670
Reserves/Res Funds 4,156 2,048 6,204
Total Financing 11,676 3,198 14,874

Jan-17-2019 13:50:54 Page 1 of 2 Report 7Ca
Debt -Recoverable
ReservesReserveFunds
Capitalfrom
Current Other 1 Other2 DebtTotal
Financing
Sub- Project No. Project Name
PrioritySubProj No. Sub-project Name
Long Term Care Homes and Services
Report Phase 2 - Program 14 Long Term Care Homes and Services Program Phase 2 Part B Sub-Project Status S2 Part C Sub-Project Status S2,S3,S4,S5 Sub-Project Category 01,02,03,04,05,06,07 User Fields ALL
Ward Stat. Cat.
Current and Future Year Cash Flow Commitments Financed By
Total Total Total
2019-2023 2024-2028 2019-20282020 2021 2022 2023
Current and Future Year Cash Flow Commitments
ProvincialGrants andSubsidies
DevelopmentCharges
FederalSubsidy2019
Gross Expenditures ($000's)
CITY OF TORONTO
HOM907345 BUILDING UPGRADES
0 15 2018 SOGR Building Upgrades 0 0 1,310 0 0 0 1,300 2,610003S2CW 2,610 0 0 0 0 2,610 0 2,610 0 0
0 16 2019 SOGR Building Upgrades 0 0 1,650 0 0 0 1,140 2,790003S5CW 490 2,300 0 0 0 2,790 0 2,790 0 0
Sub-total 0 2,960 0 0 0 2,440 5,40003,100 2,300 0 0 0 5,400 0 5,400 0 00
HOM907346 ELECTRICAL
0 12 2017 H&S LIFE SAFETY SYSTEMS 0 0 0 0 0 0 165 165001S2CW 165 0 0 0 0 165 0 165 0 0
0 13 2018 H&S Life Safety Systems 0 0 0 0 0 0 100 100001S2CW 100 0 0 0 0 100 0 100 0 0
0 14 2019 H&S Life Safety Systems 0 0 0 0 0 0 1,110 1,110001S4CW 1,110 0 0 0 0 1,110 0 1,110 0 0
Sub-total 0 0 0 0 0 1,375 1,37501,375 0 0 0 0 1,375 0 1,375 0 00
HOM907347 MECHANICAL
0 15 2017 H&S HVAC 0 0 0 0 0 0 79 79001S2CW 79 0 0 0 0 79 0 79 0 0
0 17 2018 H&S HVAC 0 0 0 0 0 0 650 650001S2CW 650 0 0 0 0 650 0 650 0 0
0 19 2019 H&S HVAC 0 0 650 0 0 0 2,261 2,911001S5CW 2,411 500 0 0 0 2,911 0 2,911 0 0
Sub-total 0 650 0 0 0 2,990 3,64003,140 500 0 0 0 3,640 0 3,640 0 00
HOM907348 SPECIALTY SYSTEMS
0 20 2018 H&S Specialty Systems 0 0 0 0 0 0 230 230001S2CW 230 0 0 0 0 230 0 230 0 0
0 22 2019 SOGR Specialty Systems 0 0 0 0 0 0 1,635 1,635003S4CW 1,635 0 0 0 0 1,635 0 1,635 0 0
Sub-total 0 0 0 0 0 1,865 1,86501,865 0 0 0 0 1,865 0 1,865 0 00
HOM908198 Electronic Healthcare System
0 1 Electronic Healthcare System 0 0 2,450 0 0 0 0 2,450004S2CW 2,052 398 0 0 0 2,450 0 2,450 0 0
Sub-total 0 2,450 0 0 0 0 2,45002,052 398 0 0 0 2,450 0 2,450 0 00
HOM908670 Work Order Management System
0 1 Design Phase 0 0 144 0 0 0 0 144004S4CW 144 0 0 0 0 144 0 144 0 0
Sub-total 0 144 0 0 0 0 1440144 0 0 0 0 144 0 144 0 00
Total Program Expenditure 0 0 6,204 0 0 0 8,670 14,874011,676 3,198 0 0 0 14,874 0 14,874 0 0

Jan-17-2019 13:50:54 Page 2 of 2 Report 7Ca
Ward Stat. Cat.
Debt -Recoverable
Reserves
ReserveFunds
Capitalfrom
Current Other 1 Other2 Debt
TotalFinancing
Sub- Project No. Project Name
Priority SubProj No. Sub-project Name
Financed By:
Total Total Total
2019-2023 2024-2028 2019-20282020 2021 2022 2023
Current and Future Year Cash Flow Commitments and Estimates
2019
Report Phase 2 - Program 14 Long Term Care Homes and Services Program Phase 2 Part B Sub-Project Status S2 Part C Sub-Project Status S2,S3,S4,S5 Sub-Project Category 01,02,03,04,05,06,07 User Fields ALL
CITY OF TORONTO
Gross Expenditures ($000's)
Long Term Care Homes and Services
Current and Future Year Cash Flow Commitments and Estimates Financed By
ProvincialGrants andSubsidies
Federal DevelopmentSubsidy Charges
0 0 6,204 0 0 0 0 0 6,204Reserve Funds (Ind."XR" Ref.) 4,156 2,048 0 0 0 6,204 0 6,204 0 0
0 0 0 0 0 0 8,670 0 8,670Debt 7,520 1,150 0 0 0 8,670 0 8,670 0 0
Total Program Financing 0 0 6,204 0 0 0 8,670 0 14,87411,676 3,198 0 0 0 14,874 0 14,874 0 0
Status Code Description
S2 S2 Prior Year (With 2019 and\or Future Year Cashflow)
S3 S3 Prior Year - Change of Scope 2019 and\or Future Year Cost\Cashflow)
S4 S4 New - Stand-Alone Project (Current Year Only)
S5 S5 New (On-going or Phased Projects)
Category Code Description
Health and Safety C0101
Legislated C0202
State of Good Repair C0303
Service Improvement and Enhancement C0404
Growth Related C0505
Reserved Category 1 C0606
Reserved Category 2 C0707

2019 Operating Budget & 2019 - 2028 Capital Plan Long-Term Care Homes & Services
toronto.ca/budget2019 Budget Notes | Page 37 of 39
Appendix 9
2019 Capital Budget with Financing Detail

Page 1 of 1 Report P2-1A
Sub-Project Summary
Project/Financing
Priority Project Project Name
(Phase 2) 14-Long Term Care Homes and Services Sub-Project Category: 01,02,03,04,05,06,07 Type: B Sub-Project Status: S2 Type: C Sub-Project Status: S2,S3,S4,S5
Jan-17-2019 13:52:25
2019 Financing
Start Date Developmt Charges
Reserves Other 1 Other 2ReserveFunds
CapitalFrom
Current
CompletionDate
Cash Flow FederalSubsidy
Provincial Grants
Subsidies
Debt - Recoverable
Debt
CITY OF TORONTO
Long Term Care Homes and Services
BUILDING UPGRADES HOM907345 0
2018 SOGR Building Upgrades0 15 01/01/2018 12/31/2019 2,610 0001,3100000 01,300
2019 SOGR Building Upgrades0 16 01/01/2019 12/31/2020 490 00000000 0490
Project Sub-total: 3,100 01,7900001,3100000
ELECTRICAL HOM907346 0
2017 H&S LIFE SAFETY SYSTEMS0 12 01/01/2017 12/31/2017 165 00000000 0165
2018 H&S Life Safety Systems0 13 01/01/2018 12/31/2019 100 00000000 0100
2019 H&S Life Safety Systems0 14 01/01/2019 12/31/2020 1,110 00000000 01,110
Project Sub-total: 1,375 01,37500000000
MECHANICAL HOM907347 0
2017 H&S HVAC0 15 01/01/2017 12/31/2018 79 00000000 079
2018 H&S HVAC0 17 01/01/2018 12/31/2019 650 00000000 0650
2019 H&S HVAC0 19 01/01/2019 12/31/2020 2,411 0006500000 01,761
Project Sub-total: 3,140 02,4900006500000
SPECIALTY SYSTEMS HOM907348 0
2018 H&S Specialty Systems0 20 01/01/2018 12/31/2019 230 00000000 0230
2019 SOGR Specialty Systems0 22 01/01/2019 12/31/2020 1,635 00000000 01,635
Project Sub-total: 1,865 01,86500000000
Electronic Healthcare System HOM908198 0
Electronic Healthcare System0 1 01/01/2015 12/31/2020 2,052 0002,0520000 00
Project Sub-total: 2,052 000002,0520000
Work Order Management System HOM908670 0
Design Phase0 1 01/01/2019 12/31/2019 144 0001440000 00
Project Sub-total: 144 000001440000
Program Total: 11,676 07,5200004,1560000
Status Code Description
S2 S2 Prior Year (With 2019 and\or Future Year Cashflow)
S3 S3 Prior Year - Change of Scope 2019 and\or Future Year Cost\Cashflow)
S4 S4 New - Stand-Alone Project (Current Year Only)
S5 S5 New (On-going or Phased Projects)
Category Code Description
Health and Safety C0101
Legislated C0202
State of Good Repair C0303
Service Improvement and Enhancement C0404

2019 Operating Budget & 2019 - 2028 Capital Plan Long-Term Care Homes & Services
toronto.ca/budget2019 Budget Notes | Page 38 of 39
Appendix 10
Inflows and Outflows to/from Reserves and Reserve Funds
2019 Operating Budget
Program Specific Reserve / Reserve Funds
Corporate Reserve / Reserve Funds
2019 2020 2021
$ $ $ $
Beginning Balance 25,869.7
Sick Leave Reserve Fund XR1007
Withdrawals (-)
Contributions (+) 1,544.8 1,544.8 1,544.8
Total Reserve / Reserve Fund Draws / Contributions 25,869.7
Other Program / Agency Net Withdrawals & Contributions
Balance at Year-End 25,869.7 - - -
* Based on 9-month 2018 Reserve Fund Variance Report
2019 2020 2021
$ $ $ $
Beginning Balance 31,921.8
Insurance XR1010
Withdrawals (-)
Contributions (+) 415.0 415.0 415.0
Total Reserve / Reserve Fund Draws / Contributions 31,921.8
Other Program / Agency Net Withdrawals & Contributions
Balance at Year-End 31,921.8 - - -
* Based on 9-month 2018 Reserve Fund Variance Report
Reserve / Reserve
Fund Number
Projected Balance
as of Dec. 31, 2018 *
Withdrawals (-) / Contributions (+)
Reserve / Reserve Fund Name
(In $000s)
Reserve / Reserve
Fund Number
Projected Balance
as of Dec. 31, 2018 *
Withdrawals (-) / Contributions (+)
Reserve / Reserve Fund Name
(In $000s)

2019 Operating Budget & 2019 - 2028 Capital Plan Long-Term Care Homes & Services
toronto.ca/budget2019 Budget Notes | Page 39 of 39
Inflows and Outflows to/from Reserves and Reserve Funds
2019 – 2028 Capital Budget and Plan
Program Specific Reserve / Reserve Funds
2019
Budget
2020
Plan
2021
Plan
2022
Plan
2023
Plan
2024
Plan
2025
Plan
2026
Plan
2027
Plan
2028
Plan Total
Beginning Balance 6,226 6,226 3,735 3,042 2,747 2,452 2,157 2,439 2,721 3,003 3,285
Withdrawals (-)
Capital Maintenance Draw (1,650) (1,650) (1,650) (1,650) (1,650) (1,073) (1,073) (1,073) (1,073) (1,073) (13,615)
Electronic Healthcare Record Draw (2,052) (398) (2,450)
Work Order Management System (144) (144)
Total Withdrawals (3,846) (2,048) (1,650) (1,650) (1,650) (1,073) (1,073) (1,073) (1,073) (1,073) (16,209)
Contributions (+)
Interst Income 10 10 10 10 10 10 10 10 10 10 100
Other contributions 1,345 1,345 1,345 1,345 1,345 1,345 1,345 1,345 1,345 1,345 13,450
Total Contributions 1,355 1,355 1,355 1,355 1,355 1,355 1,355 1,355 1,355 1,355 13,550
6,226 3,735 3,042 2,747 2,452 2,157 2,439 2,721 3,003 3,285 3,567 (2,659)
Reserve / Reserve
Fund Name
(In $000s) Project / Sub Project Name and Number
Projected
Balance as at
Dec 31, 2018 *
Contributions / (Withdrawals)
XR2103
Homes for the Aged
Balance at Year-End