budget hearing 081116anacortessd.ss10.sharpschool.com/userfiles/servers/server...• leadership team...
TRANSCRIPT

Anacortes School DistrictAnacortes School DistrictAnacortes School DistrictAnacortes School District
2016201620162016----2017201720172017
Budget
Budget Hearing – August 11, 2016

2016201620162016----2017 Budget 2017 Budget 2017 Budget 2017 Budget
Investment in PeopleInvestment in PeopleInvestment in PeopleInvestment in People: : : : • Workload relief• Competitive salary and benefits• Professional development• Time for deeper collaboration
Student Student Student Student access to access to access to access to teaching/learning teaching/learning teaching/learning teaching/learning that supports 21that supports 21that supports 21that supports 21stststst Century skills:Century skills:Century skills:Century skills:• Quality instruction• Digital conversion• Smaller class sizes
Fiscally responsible: Fiscally responsible: Fiscally responsible: Fiscally responsible: Maintains focus on student need, utilizing existing and additional resources, while maintaining a fiscally responsible reserve.

2016201620162016----2017 Budget2017 Budget2017 Budget2017 Budget
Resource Allocation Process Resource Allocation Process Resource Allocation Process Resource Allocation Process
February - March 2016:
• Building meetings with staff, principal, and finance director regarding status of budget and
confirmation of priorities from prior year
• Board retreat includes discussion of budget priorities
April – May 2016:
• Union negotiations
• Leadership team meetings to review and analyze all feedback received and prioritize
district wide needs
• Superintendent determines district needs to be included in draft budget
June – August 2016:
• Union negotiations
• Budget development

2016201620162016----2017 Budget 2017 Budget 2017 Budget 2017 Budget
Program ChangesProgram ChangesProgram ChangesProgram Changes
Staffing MSOC
Curriculum and Instruction:
Primary: lower class sizes x
AMS: change to 6 period day x
AHS: additional planning time x
District Wide: additional professional development time x
Instructional Support:
Secondary: complete rollout of 1:1 tech initiative x
AMS: additional cert support related to 6th grade move x
District Wide: additional technology coach x
District Wide: additional teacher directed time x

2016201620162016----2017 Budget 2017 Budget 2017 Budget 2017 Budget
10 Year Operating Trend10 Year Operating Trend10 Year Operating Trend10 Year Operating Trend(Revenue & Expenditures excluding Foundation Grants and Tech Levy)
Does not include fund balance

2016201620162016----2017 Budget 2017 Budget 2017 Budget 2017 Budget
Additional State ResourcesAdditional State ResourcesAdditional State ResourcesAdditional State Resources
Total Additional State Funding 973,000 Increase in State Funds (Pass Through):
Salary Increases 194,000
K-3 Class Size 408,000
SPED Funding 63,000
CTE Programs 14,000
LAP 7,000
Bilingual/Highly Capable 2,000
688,000
Increase in State Funds (not Pass Through):
Full Day Kindergarten 246,000
Increase BEA MSOC 35,000
ALE Programs 4,000
285,000
Increased Costs related to State Funding: (136,000)
Total Net Impact to Current Year Budget 149,000

12-13 12-13 12-13 12-13 ActualActualActualActual
13-14 13-14 13-14 13-14 ActualActualActualActual
14-15 14-15 14-15 14-15 ActualActualActualActual
15-16 15-16 15-16 15-16 ActualActualActualActual
16-17 16-17 16-17 16-17 ProjectedProjectedProjectedProjected
K-6 (K=1.0)K-6 (K=1.0)K-6 (K=1.0)K-6 (K=1.0) 1,393 1,426 1,441 1,460 1,500
7-87-87-87-8 384 386 426 451 425
9-129-129-129-12 808 822 794 792 796
RSRSRSRS 24 33 30 28 26
Total Total Total Total 2,609 2,667 2,691 2,731 2,747
Change Change Change Change (34) 58 24 40 16
Enrollment Projections Enrollment Projections Enrollment Projections Enrollment Projections (avg FTE, w/K=1.0)(avg FTE, w/K=1.0)(avg FTE, w/K=1.0)(avg FTE, w/K=1.0)

Certificated StaffCertificated StaffCertificated StaffCertificated Staff
CertificatedCertificatedCertificatedCertificated ContractedContractedContractedContracted TotalTotalTotalTotal
•2014-2015 Actual 151.82 1.00 152.82
•2015-2016 Actual 155.38 2.50 157.88
•difference = 5.06
•2016-2017 Budget 166.31 2.50 168.81
•difference = 10.93

Administrative StaffAdministrative StaffAdministrative StaffAdministrative Staff
•2014-2015 Actual 12.30
•2015-2016 Actual 13.00
•2016-2017 Budget 13.50
(.50 for planning principal for AHS reconstruction and renovation)

•2014-2015 Actual 93.08
•2015-2016 Budget 99.74
•2016-2017 Budget 102.85•difference = 3.11
Classified StaffClassified StaffClassified StaffClassified Staff

2016201620162016----2017 Budget : Allocation of Resources2017 Budget : Allocation of Resources2017 Budget : Allocation of Resources2017 Budget : Allocation of Resources
InstructionInstructionInstructionInstruction
Based Upon Teaching/Based Upon Teaching/Based Upon Teaching/Based Upon Teaching/Teaching SupportTeaching SupportTeaching SupportTeaching Support
(OSPI activities 22(OSPI activities 22(OSPI activities 22(OSPI activities 22----33)33)33)33)
$26,236,952(72% of total budget)
2016201620162016----2017 2017 2017 2017 Budget: Allocation of Resources Budget: Allocation of Resources Budget: Allocation of Resources Budget: Allocation of Resources
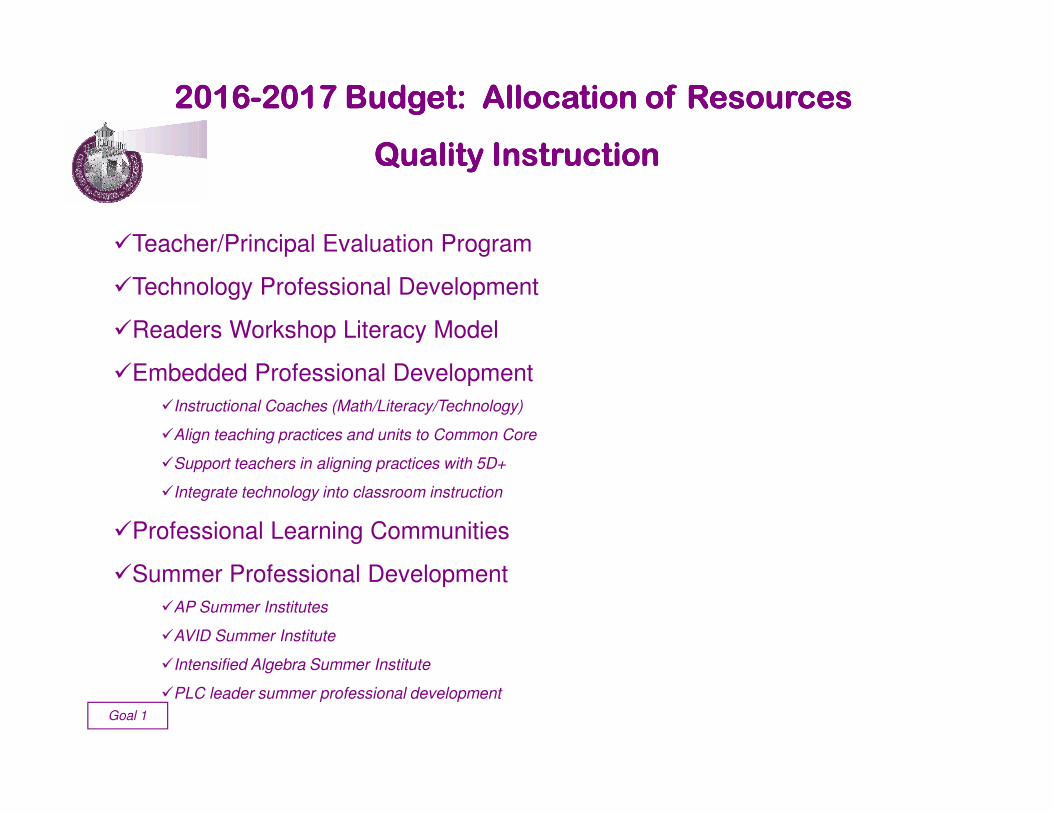
Quality InstructionQuality InstructionQuality InstructionQuality Instruction
�Teacher/Principal Evaluation Program
�Technology Professional Development
�Readers Workshop Literacy Model
�Embedded Professional Development
�Instructional Coaches (Math/Literacy/Technology)
�Align teaching practices and units to Common Core
�Support teachers in aligning practices with 5D+
�Integrate technology into classroom instruction
�Professional Learning Communities
�Summer Professional Development
�AP Summer Institutes
�AVID Summer Institute
�Intensified Algebra Summer Institute
�PLC leader summer professional development
Goal 1

2016201620162016----2017 2017 2017 2017 Budget: Allocation of Resources Budget: Allocation of Resources Budget: Allocation of Resources Budget: Allocation of Resources
School ReadySchool ReadySchool ReadySchool Ready
�District Preschool at Whitney
�Community Preschools at Whitney
�Early Childhood Position – Community Outreach
�Kindergarten Jump Start summer program
�Full Day Kindergarten District Wide
�WaKIDS support
�Child Find
�Birth to Five Support
�Leveled Literacy Intervention: K-4
�Smaller class sizes: K-3
Goal 2

2016201620162016----2017 2017 2017 2017 Budget: Allocation of Resources Budget: Allocation of Resources Budget: Allocation of Resources Budget: Allocation of Resources
Transition ReadyTransition ReadyTransition ReadyTransition Ready
�6th grade core block time
�PBIS student behavior program at elementary schools
�Support for 6-8 middle school transition
�Math support classes at AMS
�AVID professional development & support for AMS staff
�Two AVID classes for students at AMS
�Link Crew (AMS/AHS)
�Favorable counselor ratios at secondary
�AMS ELA block schedule
�Mental health support
�AHS CTE offerings to AMS Students
Goal 3

2016201620162016----2017 2017 2017 2017 Budget: Allocation of Resources Budget: Allocation of Resources Budget: Allocation of Resources Budget: Allocation of Resources
College/Career College/Career College/Career College/Career ReadyReadyReadyReady
�AP/Honors/STEM classes at AHS, including computer science
�New AP History/Environmental Science textbooks
�AMS advanced Science/Math/Spanish classes for AHS credits
�Advisory program at AHS
�Algebra I support
�AVID classes and teacher professional development at AHS
�Testing (PSAT taken by all sophomores, SAT administered at AHS)
�CTE & Skills Center program offerings
�Cap Sante High School (Alternative Learning/Online Learning)
�Credit Retrieval/APEX online learning at AHS
�Life Track/college completion data/college transcript search
�Favorable counselor ratio at AHS
Goal 4

13-14 13-14 13-14 13-14 ActualActualActualActual
14-15 14-15 14-15 14-15 ActualActualActualActual
15-16 15-16 15-16 15-16 BudgetBudgetBudgetBudget
16-17 16-17 16-17 16-17 ProjectedProjectedProjectedProjected % Chg% Chg% Chg% Chg
Property TaxesProperty TaxesProperty TaxesProperty Taxes 6,862,634 7,672,645 7,385,698 8,159,203 10.5%Local Non TaxLocal Non TaxLocal Non TaxLocal Non Tax 1,002,115 1,053,983 991,265 888,062 -10.4%State, GeneralState, GeneralState, GeneralState, General 14,282,685 15,008,354 16,685,659 17,987,997 7.8%State, SpecialState, SpecialState, SpecialState, Special 2,893,123 3,097,377 3,179,651 3,298,755 3.7%Federal, GeneralFederal, GeneralFederal, GeneralFederal, General 39,473 35,420 32,000 32,000 0.0%Federal, SpecialFederal, SpecialFederal, SpecialFederal, Special 1,366,128 1,440,505 1,493,727 1,556,983 4.2%Misc OtherMisc OtherMisc OtherMisc Other 141,147 57,379 28,000 34,000 21.4%Transfers (from CPF-Tech Levy)Transfers (from CPF-Tech Levy)Transfers (from CPF-Tech Levy)Transfers (from CPF-Tech Levy) 344,000 1,588,000 361.6%Addl Grants, etcAddl Grants, etcAddl Grants, etcAddl Grants, etc 500,000 500,000 0.0%
Total Total Total Total 26,587,305 28,365,663 30,640,000 34,045,000 11.1%
Revenues/ResourcesRevenues/ResourcesRevenues/ResourcesRevenues/Resources

13-14 13-14 13-14 13-14 ActualActualActualActual
14-15 14-15 14-15 14-15 BudgetBudgetBudgetBudget
15-16 15-16 15-16 15-16 BudgetBudgetBudgetBudget
16-17 16-17 16-17 16-17 ProjectedProjectedProjectedProjected % Chg% Chg% Chg% Chg
Regular Inst (BEA) Regular Inst (BEA) Regular Inst (BEA) Regular Inst (BEA) 16,522,618 17,457,545 19,472,079 23,124,063 18.8%Special EdSpecial EdSpecial EdSpecial Ed 3,026,447 3,260,200 3,438,160 3,870,266 12.6%Vocational EdVocational EdVocational EdVocational Ed 696,946 651,944 736,828 711,637 -3.4%Compensatory EdCompensatory EdCompensatory EdCompensatory Ed 869,488 939,336 973,633 987,564 1.4%Other Inst Prgms Other Inst Prgms Other Inst Prgms Other Inst Prgms 97,751 86,553 95,871 98,036 2.3% Private Foundation Grants Private Foundation Grants Private Foundation Grants Private Foundation Grants 423,161 - - Community Serv Community Serv Community Serv Community Serv 80,541 29,576 30,722 31,166 1.4%Support ServicesSupport ServicesSupport ServicesSupport Services 5,827,320 6,184,846 6,571,707 6,974,268 6.1%Addl Grants, etcAddl Grants, etcAddl Grants, etcAddl Grants, etc 500,000 500,000 500,000 0.0%
Total Total Total Total 27,544,272 29,110,000 31,819,000 36,297,000 14.1%
Expenditures - by ProgramExpenditures - by ProgramExpenditures - by ProgramExpenditures - by Program
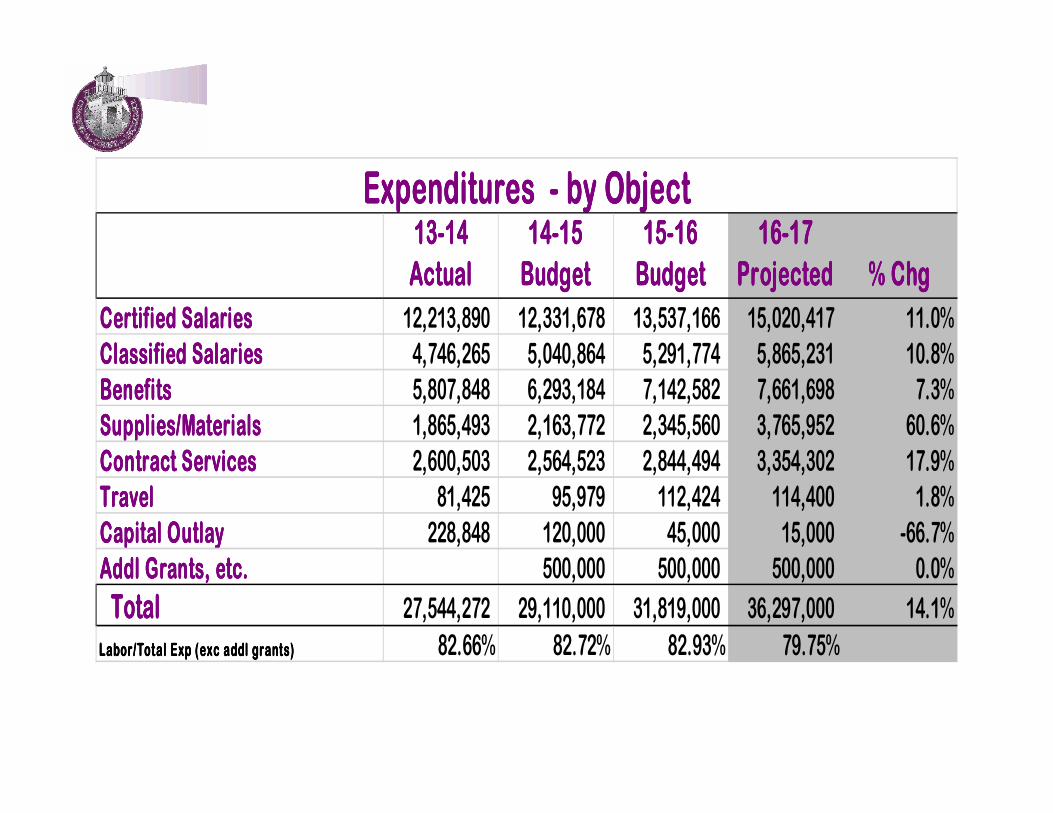
13-14 13-14 13-14 13-14 ActualActualActualActual
14-15 14-15 14-15 14-15 BudgetBudgetBudgetBudget
15-16 15-16 15-16 15-16 BudgetBudgetBudgetBudget
16-17 16-17 16-17 16-17 ProjectedProjectedProjectedProjected % Chg% Chg% Chg% Chg
Certified SalariesCertified SalariesCertified SalariesCertified Salaries 12,213,890 12,331,678 13,537,166 15,020,417 11.0%Classified SalariesClassified SalariesClassified SalariesClassified Salaries 4,746,265 5,040,864 5,291,774 5,865,231 10.8%BenefitsBenefitsBenefitsBenefits 5,807,848 6,293,184 7,142,582 7,661,698 7.3%Supplies/MaterialsSupplies/MaterialsSupplies/MaterialsSupplies/Materials 1,865,493 2,163,772 2,345,560 3,765,952 60.6%Contract ServicesContract ServicesContract ServicesContract Services 2,600,503 2,564,523 2,844,494 3,354,302 17.9%TravelTravelTravelTravel 81,425 95,979 112,424 114,400 1.8%Capital OutlayCapital OutlayCapital OutlayCapital Outlay 228,848 120,000 45,000 15,000 -66.7%Addl Grants, etc.Addl Grants, etc.Addl Grants, etc.Addl Grants, etc. 500,000 500,000 500,000 0.0%
Total Total Total Total 27,544,272 29,110,000 31,819,000 36,297,000 14.1%
Labor/Total Exp (exc addl grants)Labor/Total Exp (exc addl grants)Labor/Total Exp (exc addl grants)Labor/Total Exp (exc addl grants) 82.66% 82.72% 82.93% 79.75%
Expenditures - by ObjectExpenditures - by ObjectExpenditures - by ObjectExpenditures - by Object

2016201620162016----2017 2017 2017 2017 Budget Budget Budget Budget
Risk Factors/AssumptionsRisk Factors/AssumptionsRisk Factors/AssumptionsRisk Factors/Assumptions
�Enrollment Projection: Projected 2,747; every FTE = approx $6,500 Mitigation :Mitigation :Mitigation :Mitigation : Holdback 20% of building allocations until March 1
�Fuel Costs: Diesel est at $3.00/gallon; Utilities est at 10% increase
Mitigation:Mitigation:Mitigation:Mitigation: None, monitor costs compared to budget monthly
�Food Costs: Projected 10% inc.
Mitigation:Mitigation:Mitigation:Mitigation: None, monitor costs compared to budget monthly
�Staffing Costs: Labor costs = 79.8% of budget
Mitigation: Mitigation: Mitigation: Mitigation: None, monitor staffing with enrollment changes

2016201620162016----2017 2017 2017 2017 Budget Budget Budget Budget
MSOC DisclosureMSOC DisclosureMSOC DisclosureMSOC DisclosurePer the Supplemental Budget Section 502(8)(a)(ii) pages 206-207:
(ii) For the 2016-17 school year, as part of the budget development, hearing, and review process
required by chapter 28A.505 RCW, each school district must disclose: (A) The amount of state funding
to be received by the district under (a) and (d) of this subsection (8); (B) the amount the district
proposes to spend for materials, supplies, and operating costs; (C) the difference between these two
amounts; and (D) if (A) of this subsection (8) (a) (ii) exceeds (B) of this subsection (8) (a) (ii), any
proposed use of this difference and how this will improve student achievement.
State Revenue: MSOC Allocation 3,228,575$
Budgeted MSOC Expenditures:
Program 01 (Basic Education) 3,702,573
Program 02 (Alternative Learning) 10,400
Program 97 (District Wide Support) 1,839,900
Total Expenditures 5,552,873$
Revenues in Excess of Expenditures (2,324,298)$

13-14 13-14 13-14 13-14 ActualActualActualActual
14-15 14-15 14-15 14-15 ActualActualActualActual
15-16 15-16 15-16 15-16 BudgetBudgetBudgetBudget
16-17 16-17 16-17 16-17 ProjectedProjectedProjectedProjected
Beg FB - Restrict/Designated 712,944 135,836 100,000 95,000
Beg FB - Committed 1,634,600 1,706,000 250,000 73,000 Beg FB - Contingencies 177,000 - - - Beg FB - Assigned to Minimum FB 1,455,000 1,591,000 Beg FB - Assigned to Budget 1,070,000 691,000 1,049,000 1,584,000
Beg FB - Assigned/Unassigned 202,763 307,505 90,000 - Total Beg FB Total Beg FB Total Beg FB Total Beg FB 3,797,307 2,840,341 2,944,000 3,343,000
Revenues/Transfers 26,587,305 28,365,663 30,140,000 31,957,000 Addl Grants, etc. 500,000 500,000 Trans from other Fnd 1,588,000 Total Revenues Total Revenues Total Revenues Total Revenues 26,587,305 28,365,663 30,640,000 34,045,000
Expenditures 27,544,272 29,110,000 31,319,000 35,797,000 Addl Grants, etc. 500,000 500,000 Total Uses Total Uses Total Uses Total Uses 27,544,272 29,110,000 31,819,000 36,297,000
End FB - Restrict/Designated 135,836 162,262 100,000 95,000 End FB - Committed 1,706,000 250,000 - - End FB - Contingencies - - - - End FB - Assigned to Minimum FB 1,575,000 996,000 End FB - Assigned to Budget 691,000 929,000 - - End FB - Assigned/Unassigned 307,505 1,874,657 90,000 - Total Est End FB Total Est End FB Total Est End FB Total Est End FB 2,840,341 3,215,919 1,765,000 1,091,000
General Fund SummaryGeneral Fund SummaryGeneral Fund SummaryGeneral Fund Summary

2016201620162016----2017 Budget 2017 Budget 2017 Budget 2017 Budget
Investment in PeopleInvestment in PeopleInvestment in PeopleInvestment in People: : : : • Workload relief• Competitive salary and benefits• Professional development• Time for deeper collaboration
Student access to teaching/learning that supports 21Student access to teaching/learning that supports 21Student access to teaching/learning that supports 21Student access to teaching/learning that supports 21stststst Century Century Century Century skills:skills:skills:skills:
• Quality instruction• Digital conversion• Smaller class sizes
Fiscally responsible: Fiscally responsible: Fiscally responsible: Fiscally responsible: Maintains focus on student need, utilizing existing and additional resources, while maintaining a fiscally responsible reserve.

13-14 13-14 13-14 13-14 ActualActualActualActual
14-15 14-15 14-15 14-15 ActualActualActualActual
15-16 15-16 15-16 15-16 BudgetBudgetBudgetBudget
16-17 16-17 16-17 16-17 ProjectedProjectedProjectedProjected
Est Begin FBEst Begin FBEst Begin FBEst Begin FB 199,708 195,968 206,000 201,000 RevenuesRevenuesRevenuesRevenues 266,200 320,169 424,000 405,000 Total Resources Total Resources Total Resources Total Resources 465,908 516,137 630,000 606,000
ExpendituresExpendituresExpendituresExpenditures 269,940 308,900 453,000 424,000
Est End FBEst End FBEst End FBEst End FB 195,968 207,237 177,000 182,000
ASB Fund SummaryASB Fund SummaryASB Fund SummaryASB Fund Summary

13-14 13-14 13-14 13-14 ActualActualActualActual
14-15 14-15 14-15 14-15 ActualActualActualActual
15-16 15-16 15-16 15-16 BudgetBudgetBudgetBudget
16-17 16-17 16-17 16-17 ProjectedProjectedProjectedProjected
Est Begin FBEst Begin FBEst Begin FBEst Begin FB 130,977 62,427 55,655,000 73,792,000 Local TaxesLocal TaxesLocal TaxesLocal Taxes 931,635 1,494,314 1,588,000 DonationsDonationsDonationsDonations 1,003,009 - Bond ProceedsBond ProceedsBond ProceedsBond Proceeds 56,437,088 - Invest Earnings/GrantsInvest Earnings/GrantsInvest Earnings/GrantsInvest Earnings/Grants 27,645 14,032 74,686 200,000 Total Resources Total Resources Total Resources Total Resources 158,622 58,448,191 57,224,000 75,580,000
ExpendituresExpendituresExpendituresExpenditures 96,195 1,271,194 23,919,000 29,927,000 Transfers Out (to GF)Transfers Out (to GF)Transfers Out (to GF)Transfers Out (to GF) - 1,588,000
Est End FBEst End FBEst End FBEst End FB 62,427 57,176,997 33,305,000 44,065,000
Capital Projects Fund SummaryCapital Projects Fund SummaryCapital Projects Fund SummaryCapital Projects Fund Summary

13-14 13-14 13-14 13-14 ActualActualActualActual
14-15 14-15 14-15 14-15 ActualActualActualActual
15-16 15-16 15-16 15-16 BudgetBudgetBudgetBudget
16-17 16-17 16-17 16-17 ProjectedProjectedProjectedProjected
Est Begin FBEst Begin FBEst Begin FBEst Begin FB 1,686,014 1,440,675 1,680,000 2,169,000 Property TaxesProperty TaxesProperty TaxesProperty Taxes 2,805,572 2,765,815 3,973,275 5,649,937 Transfer from TVFTransfer from TVFTransfer from TVFTransfer from TVF 42,104 43,584 46,300 44,300 Total Resources Total Resources Total Resources Total Resources 4,533,690 4,250,074 5,699,575 7,863,237
Principal/InterestPrincipal/InterestPrincipal/InterestPrincipal/Interest 3,093,015 2,547,375 4,411,366 6,238,848
Est End FBEst End FBEst End FBEst End FB 1,440,675 1,702,699 1,288,209 1,624,389
Debt Service Fund SummaryDebt Service Fund SummaryDebt Service Fund SummaryDebt Service Fund Summary
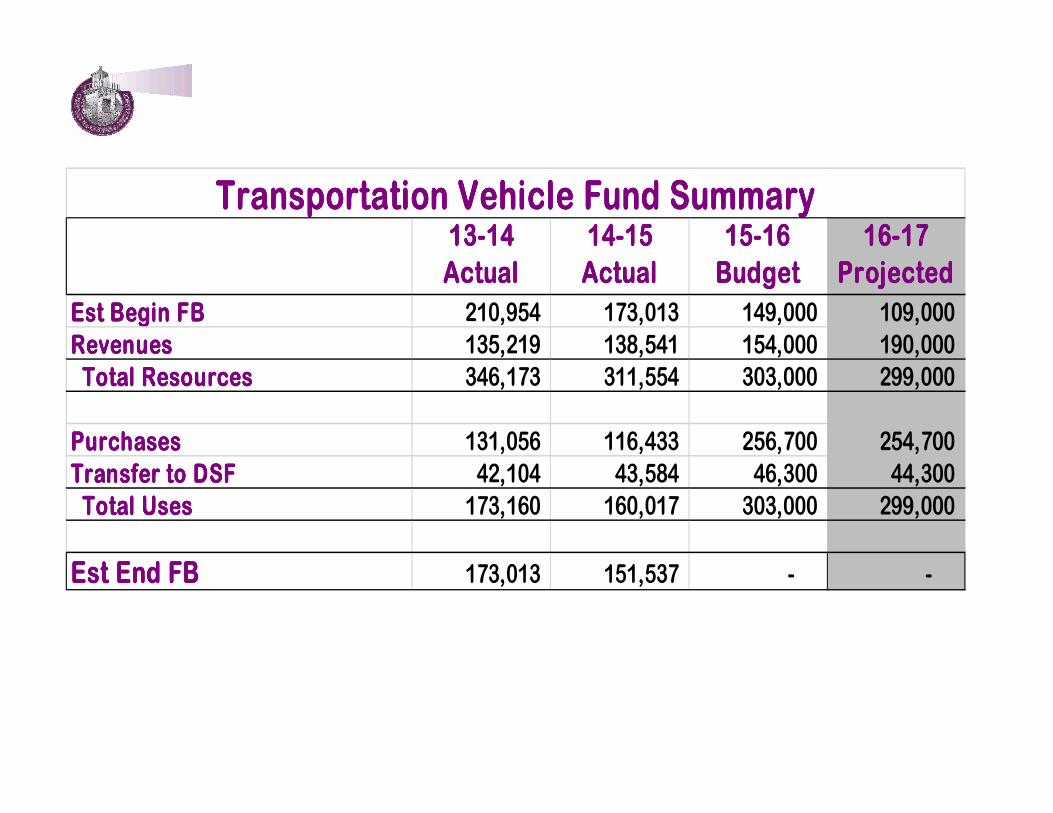
13-14 13-14 13-14 13-14 ActualActualActualActual
14-15 14-15 14-15 14-15 ActualActualActualActual
15-16 15-16 15-16 15-16 BudgetBudgetBudgetBudget
16-17 16-17 16-17 16-17 ProjectedProjectedProjectedProjected
Est Begin FBEst Begin FBEst Begin FBEst Begin FB 210,954 173,013 149,000 109,000 RevenuesRevenuesRevenuesRevenues 135,219 138,541 154,000 190,000 Total Resources Total Resources Total Resources Total Resources 346,173 311,554 303,000 299,000
PurchasesPurchasesPurchasesPurchases 131,056 116,433 256,700 254,700 Transfer to DSFTransfer to DSFTransfer to DSFTransfer to DSF 42,104 43,584 46,300 44,300 Total Uses Total Uses Total Uses Total Uses 173,160 160,017 303,000 299,000
Est End FBEst End FBEst End FBEst End FB 173,013 151,537 - -
Transportation Vehicle Fund SummaryTransportation Vehicle Fund SummaryTransportation Vehicle Fund SummaryTransportation Vehicle Fund Summary

QuestionsQuestionsQuestionsQuestions