budapest university of technology and economics department of measurement and information systems...
TRANSCRIPT

Budapest University of Technology and EconomicsDepartment of Measurement and Information Systems
Budapest University of Technology and EconomicsFault Tolerant Systems Research Group
OUTLIER DETECTION IN IT DATA
Agnes [email protected]
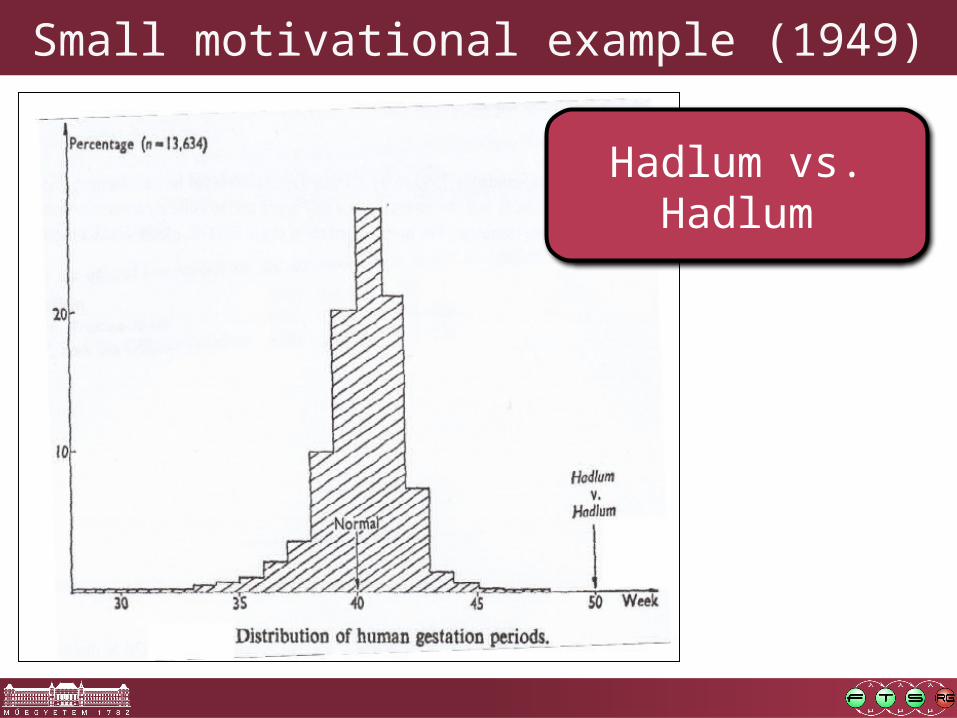
Small motivational example (1949)
Hadlum vs. Hadlum

Small motivational example (1949)
Source: http://www.siam.org/meetings/sdm10/tutorial3.pdf
Average: 280 days
(40 weeks)
Mrs. Hadlum: 349

From the system modelling aspect Goals of infrastructure data analysis: identify
o Operational domainso Domain boundarieso Transitions effectsoWithout one specific high level QoS metric
Carrier grade in telecommunication: 99.999% availability: faults are rare
Outlier detection
So far: typical
clustering

Terminology…
anomaly
surprise
rare eventnovelty
outlierexception
aberration
peculiarity
discordant observations
1. Rare: low relative frequency of occurrence2. Anomalous: „deviates so much from the other
observations as to arouse suspicions that it was generated by a different mechanism” (Hawkins, 1980)
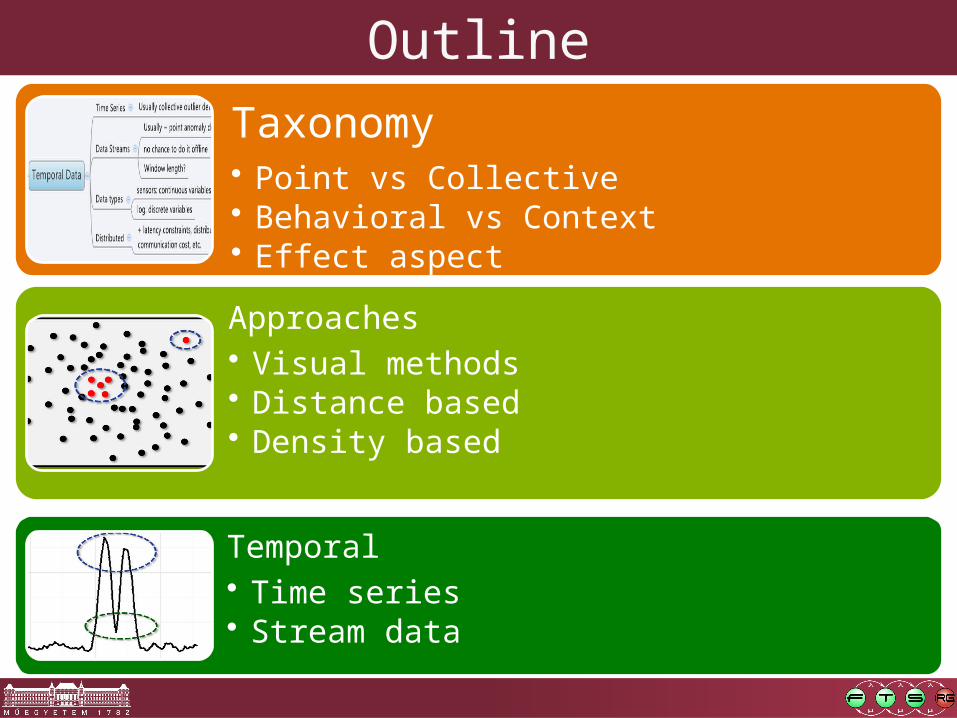
OutlineTaxonomy• Point vs Collective• Behavioral vs Context• Effect aspect
Approaches• Visual methods• Distance based• Density based
Temporal• Time series• Stream data

TAXONOMY
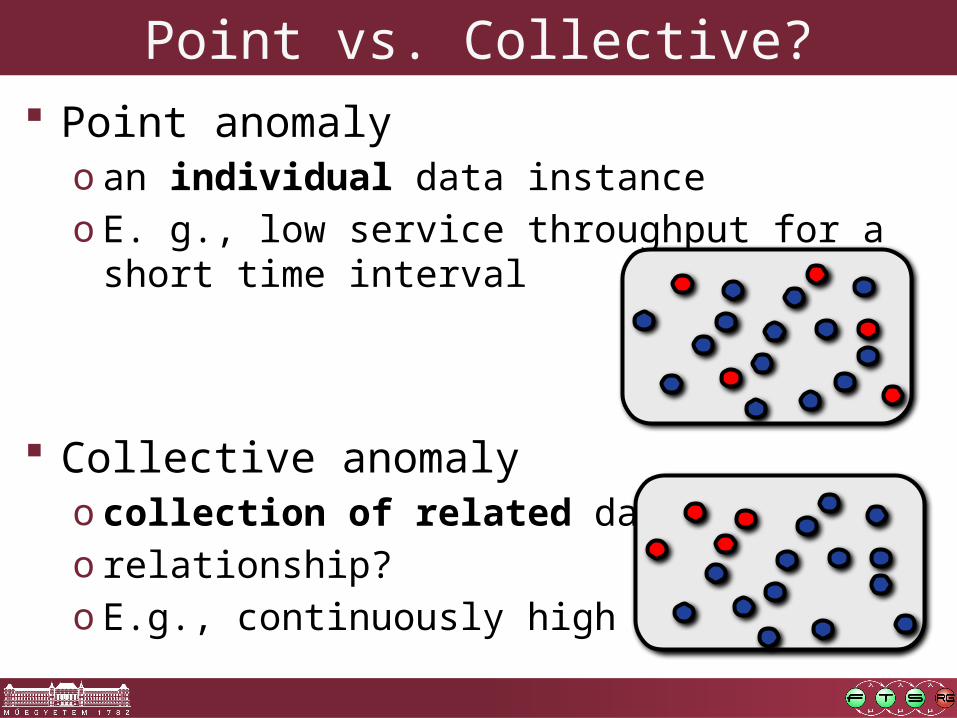
Point anomalyo an individual data instanceo E. g., low service throughput for a short time interval
Collective anomalyo collection of related data instanceso relationship?o E.g., continuously high CPU usage
Point vs. Collective?

Point vs. Collective? Point anomaly
o an individual data instance
Collective anomalyo collection of related data instanceso relation?
Every point in the cluster is a point
anomaly

Point vs. Collective? Point anomaly
o an individual data instance
Collective anomalyo collection of related data instanceso relation?
One single value of -5.7 is typical;
20 right after each other is
rather interesting

Point vs. Collective?
Point anomaly
Collective anomaly

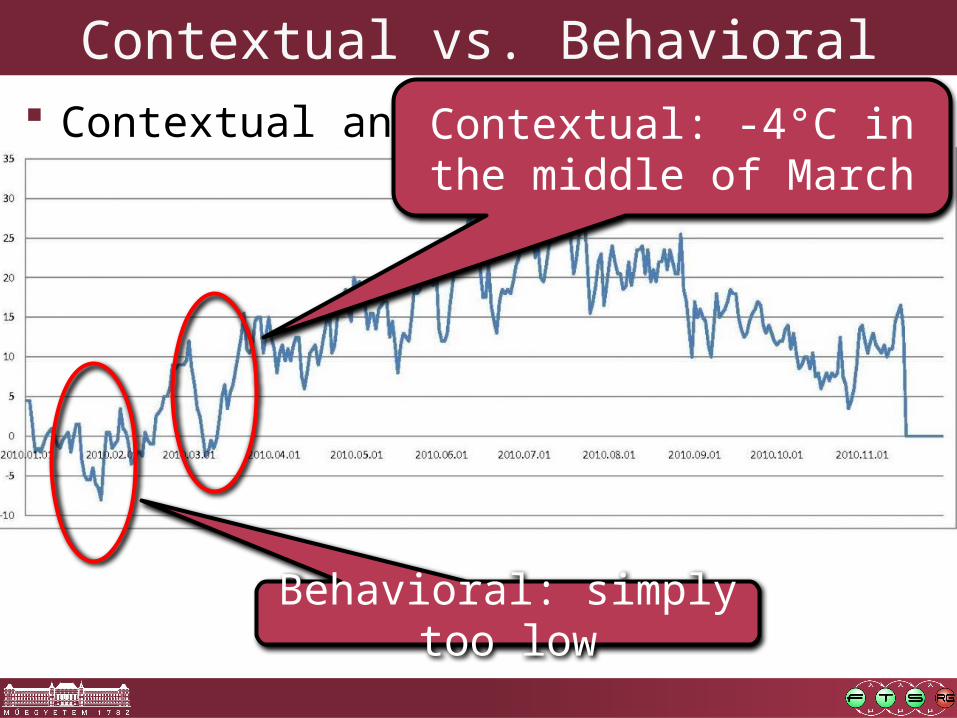
Contextual vs. Behavioral Contextual anomaly
o an instance is anomalous in a specific contextbut not otherwise
o Only wrt. contextual variables• time, location, benchmark configuration, etc.
o E.g., the continiously high CPU usage is acceptable only during workdays
Behavioral anomalyo an instance is anomalous without any context
informationo E.g., continiously high CPU usage is never acceptable
Contextual vs. Behavioral Contextual anomaly
o a data instance is anomalous in a specific contexto but not otherwise
Behavioral anomalyo a data instance is anomalous independently from the
context?
Contextual: -4°C in the middle of March
Behavioral: simply too low

Contextual vs. BehavioralWithout the time axis, a cpu_idle of value 600
cannot be considered as suspicious

Time Series Outliers Monitoring
o Usually one single multivariate record with timestampo Observations from sensors: numeric• , …
o Observations from log files: categoric• Start, Stop, Start, Snapshot, Snapshot, …
Benchmarking over timeo Time aspect matters, e.g. by Network usage

Basic typesAdditive
Transient change
Level Shift
Innovational
Subsequent observations are unaffected
Permanent effect
The effect diminishes exponentially, later the series returns to normal
Initial impact + increasing effect as time proceeds

GENERAL APPROACHES

Multi-dimensional data Distance based
o Deviation from the rest of the dataset
Density basedo Deviation from the
neighborhood

Timeseries Distance based
o Deviation from the rest of the dataset
Density basedo Deviation from the
neighborhood

Ranking aspects of methods Complexity
o Resource requirements Incremental maintainability
o Support for online analysis Required domain-specific knowledge
o Amount of paremeters Sensitivity
o Sensitivity of the method on paremeters Semi-supervised approach
o Support for an initial „typical” or „faulty” subset

OUTLIER DETECTION IN EDA

1D Aggregation suppresses outliers
Unimodal distributions:
boxplot/rugplot

1D Aggregation suppresses outliers
Real outliers can be masked on a
boxplot

D At this point
o One-dimensional outlierso CPU, memory, disk I/O, network bandwidth..
Generalization to D o (Cartesian) product of dimensionso Density function-based approach

D: dimension by dimension

D: density function method Generalization of 1D density

D: density function method Generalization of 1D density
Support of multiple operational modes,
e.g. READs and WRITEs in a data base
Everything else can be marked as „outlier” or
„transition”
2d density plot, mosaic plot, heatmap, etc.
often overaggregation without concrete points

Multi-dimensional plots
Good for detecting 1D outliers in one go

Multi-dimensional plots: parallel c.
Aggregation suppresses
outliers

Multi-dimensional plots: biplots Biplot
o Data points and variables
PCA-basedo Goal: maximum of variabilityo Indicator variablesoModified point-point distance
Net Transmitted
CPUMemory
Power Usage
Net Received

DISTANCE BASED APPROACHES

Convex hull
0
2 31 54 6 7 8
7 68 45 3 2 1
Min.: 2 31 44 3 2 1
Convex hull method: Tukey, 1974
Extreme points Median: only at the end

Convex hull Convex hull method: Tukey, 1974

Convex hull Convex hull method: Tukey, 1974

DB Distance Based Outlier: number of neighbors is low Parameters
o sugarú hypersphereo Expected ratio of neighbors:

MCD Minimum Covariance Determinant Idea
o „Normal domain”: the most compact subset What does compact mean?

MCD Minimum Covariance Determinant Idea
o „Normal domain”: the most compact subset What does compact mean?
0.0014 0.00041
0.00011
Exhaustive search?
choose(n = 1000, k = 900)[1] 6.385051e+139

FAST-MCD Only estimation
Initial subset could be defined
Iterative
Objective function for new pointso closest o based on Mahalanobis distance
X

Distance function By real data: different ranges
o E.g., memory in bytes/MB/GBo Comparison of CPU and memory values?
Normalization into [0, 1]
Other distance functions

Mahalanobis distance
o – kovarianciamátrixo – súlypont
lies closer based on Euclidian distance, lies closer based on Mahalanobis distance

BACON Blocked Adaptive Computationally Efficient Outlier
Nominators
Initial set in semi-supervised mode
New set: based on a threshold

DENSITY BASED APPROACHES

DBIt is irrelevant that we are in
the middle, if we do not have neighbors
Distance-based approach
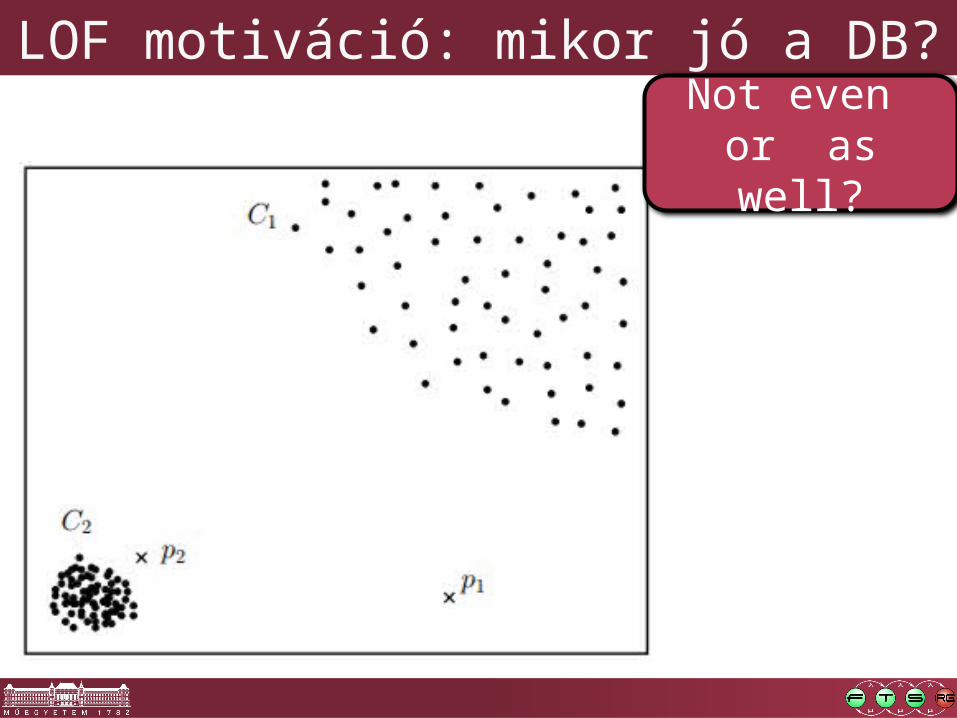
LOF motiváció: mikor jó a DB?Not even or as
well?
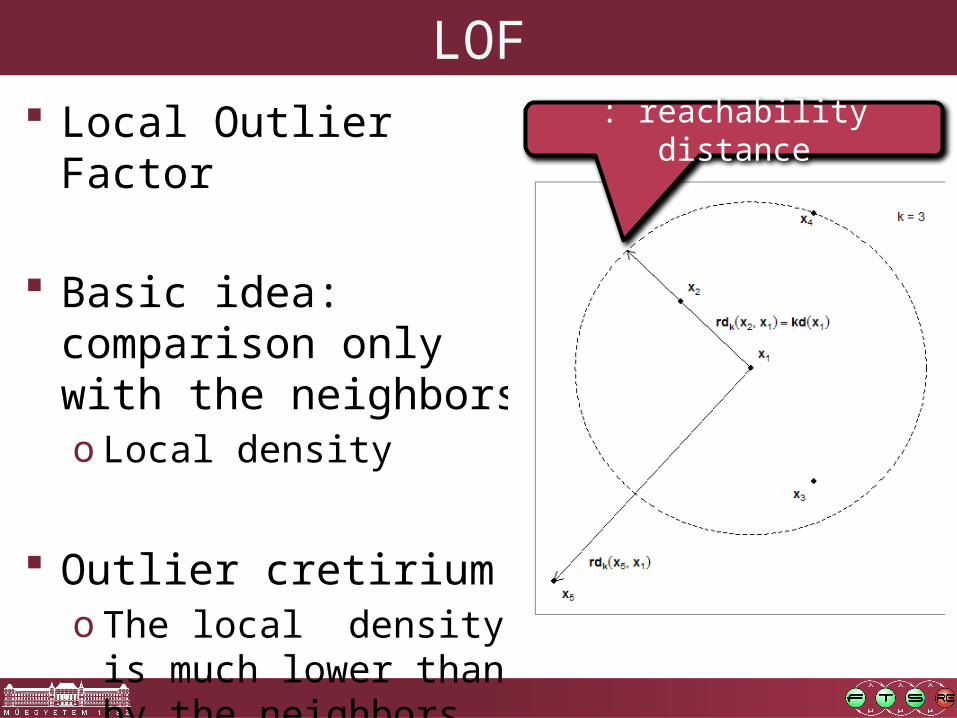
LOF Local Outlier Factor
Basic idea: comparison only with the neighborso Local density
Outlier cretiriumo The local density is much
lower than by the neighbors
: reachability distance

LOF
If my neighbors are
lonely too, then
everything is all right
LOF: DMwR::lofactor
Local outlier factor

TIME SERIES

Time Series Outliers Time as context attribute is relevant
Outlier to find can beo A single deviant pointo A whole subsequent• Group of points without relationships are irrelevant• No need for collective outliers
Usually in 1Do direct generalization to more dimensions

Outliers among sequences E.g., „Something is going on in the data center
(~VMs). Which VM is the faulty one?”
Assumptionso Set of time series of the same lengtho Goal: find the most anomalous one
Outliers among sequences Ideas
o project the subsequence into one valueo store only the similarity matrix
From that point: any clustering method works
Typical distance metricso Numerical: simple Euclidian distanceo Discrete: length of the longest common subsequence
Distance functions of time series Euclidian
o Offset on axis x?
Dynamic time warpingo Comparison based on outliers
Length of common subsequence

Dynamic time warping The points are considered not based on their
positionoMotivation: voice recognition

Dynamic time warping
1. Distance -es mátrixban rögzítjük a sorok egymástól való távolságát
2. Kell: útvonal a és között3. Cél: minimális költség4. Szabályok:
1. Minden lépésben előre haladunk (nem távolodhatunk, tehát esetén )
2. Az út folytonos, mindig csak szomszédos cellákra léphetünk

Dynamic time warping
Sakoe-Chiba band
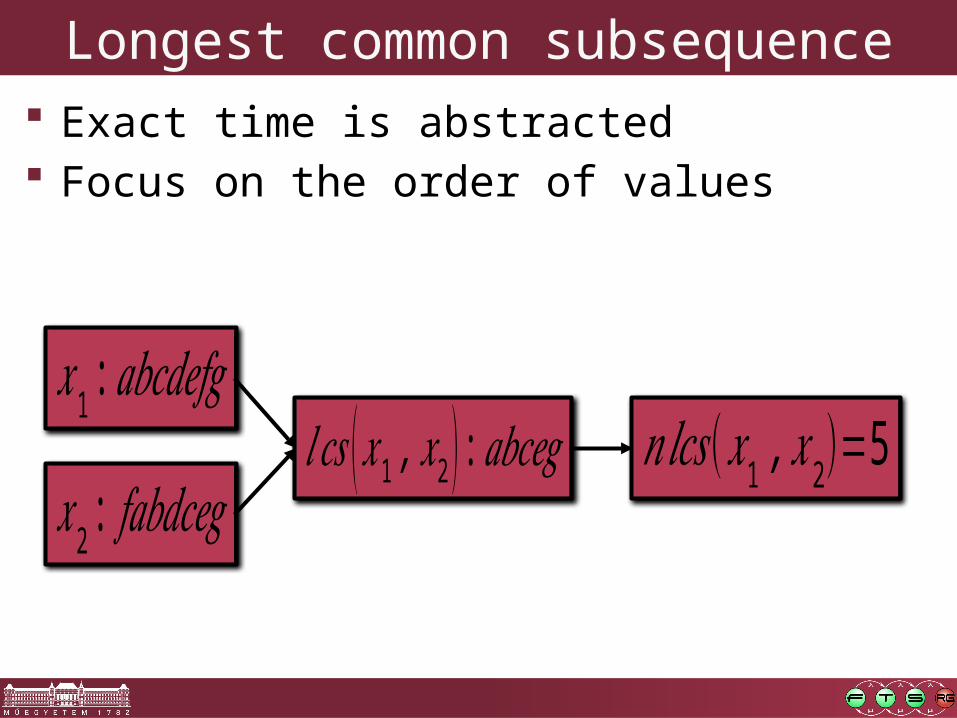
Longest common subsequence Exact time is abstracted Focus on the order of values
𝑥1 :𝑎𝑏𝑐𝑑𝑒𝑓𝑔
𝑥2: 𝑓𝑎𝑏𝑑𝑐𝑒𝑔𝑛𝑙𝑐𝑠 (𝑥1 ,𝑥2)=5𝑙𝑐𝑠 (𝑥1 ,𝑥2 ) :𝑎𝑏𝑐𝑒𝑔

Longest common subsequence Exact time is abstracted Focus on the order of values Generalization to numerical values
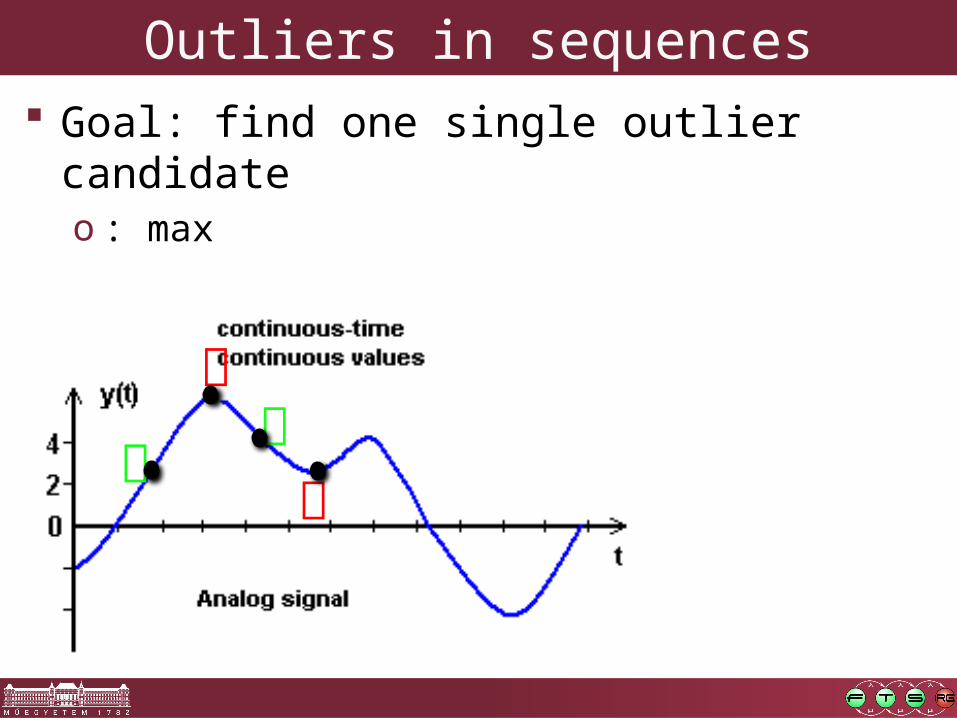
Outliers in sequences Goal: find one single outlier candidate
o : max
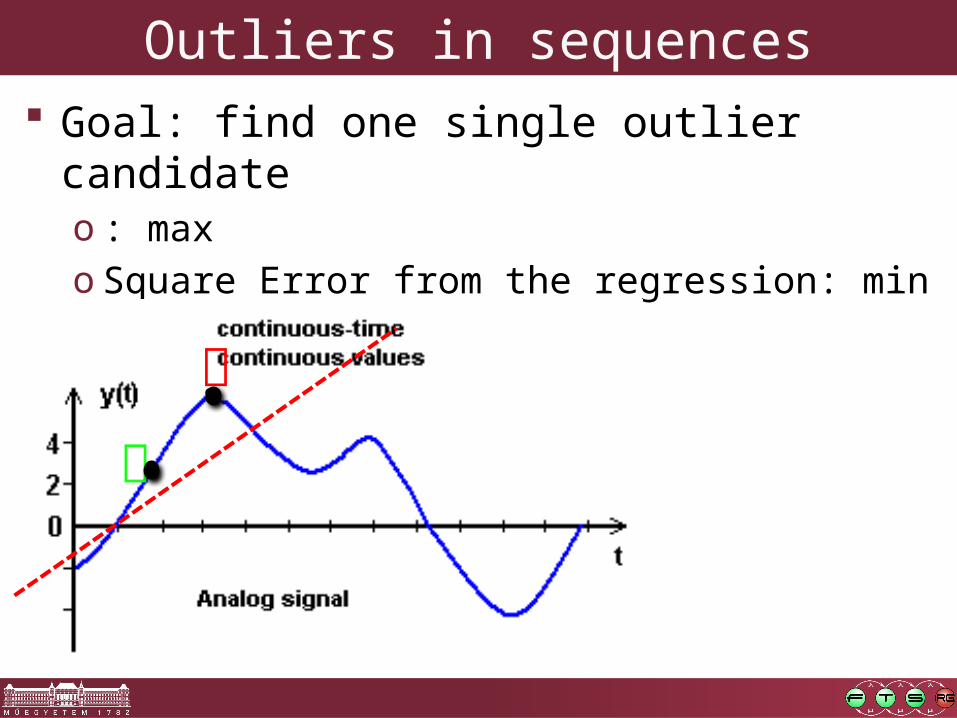
Outliers in sequences Goal: find one single outlier candidate
o : maxo Square Error from the regression: min

Outliers in sequences Goal: find one single outlier candidate
o : maxo Square Error from the regression: minoWith removal of the point, the minimum description
length decreases the mostOriginal data set: 5 different values
With removal of this point: 4
values are enough

STREAM PROCESSING

Stream processing
1. Many sources2. With unknown
sampling frequency
Resource requirements
Once per stream: „Local maximum?”
About stream at all times: „Report each new
maximum”

Typically sliding window approches Autocorrelation methods
oWhere do we differ from the predicted value?oWhere does the autocorrelation model change?
Storm application on the lab

Summary Hybrid methods can be extremely successful
o Visual + automated combinations: precision, speed
Usually from business outliers to platform metricso Triggered sliding window
Once we have an outliero boundarieso real time analysis