bubble rap: social-based forwarding in delay tolerant networksey204/pubs/2011_tmc_manuscri… ·...
TRANSCRIPT
BUBBLE Rap: Social-based Forwardingin Delay Tolerant Networks
Pan Hui, Jon Crowcroft, and Eiko Yoneki
Deutsche Telekom Laboratories, University of Cambridge Computer Laboratory
[email protected], [email protected], [email protected]
November 2010
1
BUBBLE Rap: Social-based Forwardingin Delay Tolerant Networks
Pan Hui, Jon Crowcroft, and Eiko Yoneki
Abstract
The increasing penetration of smart devices with networking capability form novel networks. Suchnetworks, also referred as Pocket Switched Networks (PSNs), are intermittently connected and representa paradigm shift of forwarding data in an ad-hoc manner. The social structure and interaction of users ofsuch devices dictate the performance of routing protocols in PSNs. To that end, social information is anessential metric for designing forwarding algorithms for such types of networks. Previous methods relied onbuilding and updating routing tables to cope with dynamic network conditions. On the downside it has beenshown that such approaches end up being cost ineffective due to the partial capture of the transient networkbehavior. A more promising approach would be to capture the intrinsic characteristics of such networks andutilize them in the design of routing algorithms.
In this paper, we exploit two social and structural metrics, namely centrality and community, usingreal human mobility traces. The contributions of this paper are two-fold. First we design and evaluateBUBBLE, a novel social-based forwarding algorithm, that utilizes the aforementioned metrics to enhancedelivery performance. Second we empirically show that BUBBLE can substantially improve forwardingperformance compared to a number of previously proposed algorithms including the benchmarking history-based PROPHET algorithm, and social-based forwarding SimBet algorithm.
Index Terms
Social Networks, Forwarding Algorithms, Delay Tolerant Networks, Pocket Switched Networks, Central-ity, Community Detection.
✦
1 INTRODUCTION
W E envision a future in which a multitude of devices carried by people are dynamically networked. We aimto build Pocket Switched Networks (PSN) [1], a type of Delay Tolerant Networks (DTN) [2] for such
environments. A PSN utilizes contact opportunities to allow humans to communicate without network infrastruc-ture.We propose an efficient data forwarding mechanism over time evolving graphs of the PSN [3], that copeswith dynamical, repeated disconnection and re-wiring. With such scenarios, end-to-end delivery through traditionalrouting algorithms is rarely applicable.
Many MANET and some DTN routing algorithms [4] [5] provide forwarding by building and updating routingtables whenever mobility occurs. We believe this approach is not appropriate for a PSN, since mobility is oftenunpredictable, and topology structure is highly dynamic. Rather than exchange much control traffic to createunreliable routing structures, which may only capture the “noise” of the network, we prefer to search for somecharacteristics of the network which are less volatile thanmobility. A PSN is formed by people. Hence, socialmetrics are intrinsic properties to guide data forwarding in such kinds of human networks. Furthermore, if we candetect these social mobility patterns online in a decentralised way, we can apply these algorithms in practice.
In this paper, we focus on two key social metrics: community and centrality. Co-operation binds, but also divideshuman society into communities. For an ecological community, the idea of correlated interaction means that an
• P. Hui is with Deutsche Telekom Laboratories, Ernst-Reuter-Platz 7, 10587, Berlin, Germany
• J. Crowcroft and E. Yoneki are with Computer Laboratory, University of Cambridge, William Gates Building, 15 JJ Thomson Avenue,Cambridge, CB3 0FD, UK
2
organism of a given type is more likely to interact with another organism of the same type than with a randomlychosen member of the population [6]. This correlated interaction concept also applies to human, so we can exploitthis kind of community information to select forwarding paths. Within a community, some people are more popular,and interact with more people than others (i.e., have highcentrality); we call them hubs. In this paper, we willexploit community and centrality for data forwarding in PSNs.
Methodologically, community detection [7] [8] can help us to uncover and understand local community structurein both off-line mobile trace analysis and online applications, and is therefore helpful in designing good strategiesfor information dissemination. Freeman [9] defined several centrality metrics to measure the importance of a nodein a network. Betweenness centrality measures the number oftimes a node falls on the shortest path between twoother nodes. This concept is also valid in a DTN. In a PSN, it can represent the importance of a node as a potentialtraffic relay for other nodes in the system. The main contributions of this paper are to answer these questions:
1) How does the variation in node popularity help us to forward in a PSN?2) Are communities of nodes detectable in PSN traces?3) How well does social based forwarding work, and how does itcompare to other forwarding schemes in a
real (emulated) environment?4) Can we devise a fully decentralised way for such schemes tooperate?To preview our answers to the above questions, we evaluate the impact of community and centrality on forwarding,
and proposeBUBBLE, a hybrid algorithm, that selects high centrality nodes andcommunity members of destinationas relays. We demonstrate a significant improvement in forwarding efficiency over a number of previously proposedstate-of-the-arts algorithms includingPROPHETalgorithm [5], which uses patterns of movement, rather thanthelonger term social relationships on which ourBUBBLE scheme rests, and the social-based forwardingSimBetalgorithm [10]. In a PSN, there may be noa priori information. By definition, we are also in a decentralised worldwithout access to infrastructure. Therefore distributed detection and dissemination of node popularity and nodecommunities, and the use of these for forwarding decisions are crucial. We verify that this is not only possible, butworks well in terms of message delivery performance and efficiency compared to prior schemes.
The rest of this paper is structured as follows. We introduce the experimental data sets in Section 2, describethe contact graphs and inferring human communities in Section 3. In Section 4, we examine the heterogeneity incentrality. We show evaluation methodology in Section 5 and results including discussions from Section 6 to 9followed by the related works in Section 10. Finally, we conclude the paper with a brief summary of contributionsin Section 11.
2 EXPERIMENTAL DATASETSIn this paper, we use four experimental datasets gathered bythe Haggle Project1 over two years, referred to asInfocom05, HongKong, Cambridge, Infocom06; one dataset from the MIT Reality Mining Project [11], referredto as Reality. Previously, the characteristics of these datasets such as inter-contact and contact distribution havebeen explored in several studies [12] [13] [14], to which we refer the reader for further background information.These five datasets cover a rich diversity of environments, ranging from busy metropolitan city (HongKong) toquiet university town (Cambridge), with an experimental period from several days (Infocom06) to almost one year(Reality).
• In Infocom05, the devices were distributed to approximately fifty students attending the Infocom studentworkshop. Participants belong to different social communities (depending on their country of origin, researchtopic, etc.).
• In Hong-Kong, the people carrying the wireless devices were chosen independently in a Hong-Kong bar, toavoid any particular social relationship between them. These people have been invited to come back to thesame bar after a week. They are unlikely to see each other during the experiment.
• In Cambridge, the iMotes were distributed mainly to two groups of students from University of CambridgeComputer Laboratory, specifically undergraduate year1 and year2 students, and also some PhD and Mastersstudents. This dataset covers 11 days.
• In Infocom06, the scenario was very similar toInfocom05 except that the scale is larger, with 80 participants.Participants were selected so that 34 out of 80 form 4 subgroups by academic affiliations.
1. http://www.haggleproject.org
3
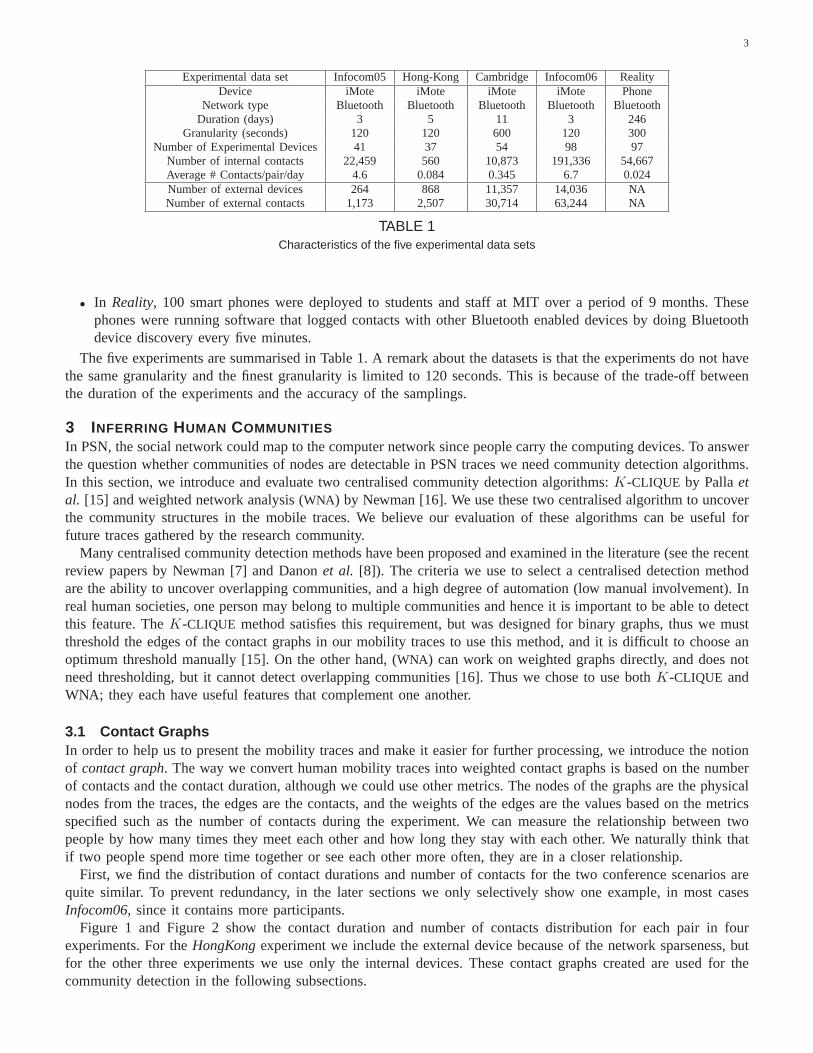
Experimental data set Infocom05 Hong-Kong Cambridge Infocom06 RealityDevice iMote iMote iMote iMote Phone
Network type Bluetooth Bluetooth Bluetooth Bluetooth BluetoothDuration (days) 3 5 11 3 246
Granularity (seconds) 120 120 600 120 300Number of Experimental Devices 41 37 54 98 97
Number of internal contacts 22,459 560 10,873 191,336 54,667Average # Contacts/pair/day 4.6 0.084 0.345 6.7 0.024Number of external devices 264 868 11,357 14,036 NANumber of external contacts 1,173 2,507 30,714 63,244 NA
TABLE 1Characteristics of the five experimental data sets
• In Reality, 100 smart phones were deployed to students and staff at MIT over a period of 9 months. Thesephones were running software that logged contacts with other Bluetooth enabled devices by doing Bluetoothdevice discovery every five minutes.
The five experiments are summarised in Table 1. A remark about the datasets is that the experiments do not havethe same granularity and the finest granularity is limited to 120 seconds. This is because of the trade-off betweenthe duration of the experiments and the accuracy of the samplings.
3 INFERRING HUMAN COMMUNITIESIn PSN, the social network could map to the computer network since people carry the computing devices. To answerthe question whether communities of nodes are detectable inPSN traces we need community detection algorithms.In this section, we introduce and evaluate two centralised community detection algorithms:K-CLIQUE by Pallaetal. [15] and weighted network analysis (WNA) by Newman [16]. We use these two centralised algorithm to uncoverthe community structures in the mobile traces. We believe our evaluation of these algorithms can be useful forfuture traces gathered by the research community.
Many centralised community detection methods have been proposed and examined in the literature (see the recentreview papers by Newman [7] and Danonet al. [8]). The criteria we use to select a centralised detection methodare the ability to uncover overlapping communities, and a high degree of automation (low manual involvement). Inreal human societies, one person may belong to multiple communities and hence it is important to be able to detectthis feature. TheK-CLIQUE method satisfies this requirement, but was designed for binary graphs, thus we mustthreshold the edges of the contact graphs in our mobility traces to use this method, and it is difficult to choose anoptimum threshold manually [15]. On the other hand, (WNA) can work on weighted graphs directly, and does notneed thresholding, but it cannot detect overlapping communities [16]. Thus we chose to use bothK-CLIQUE andWNA; they each have useful features that complement one another.
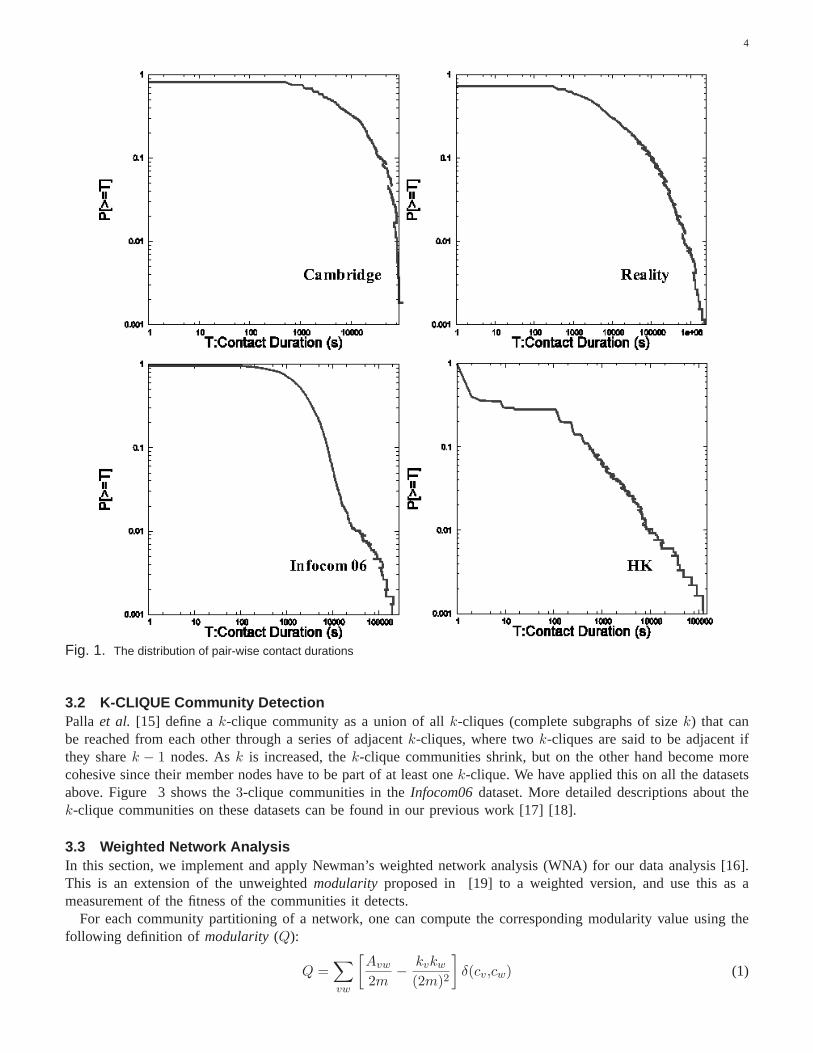
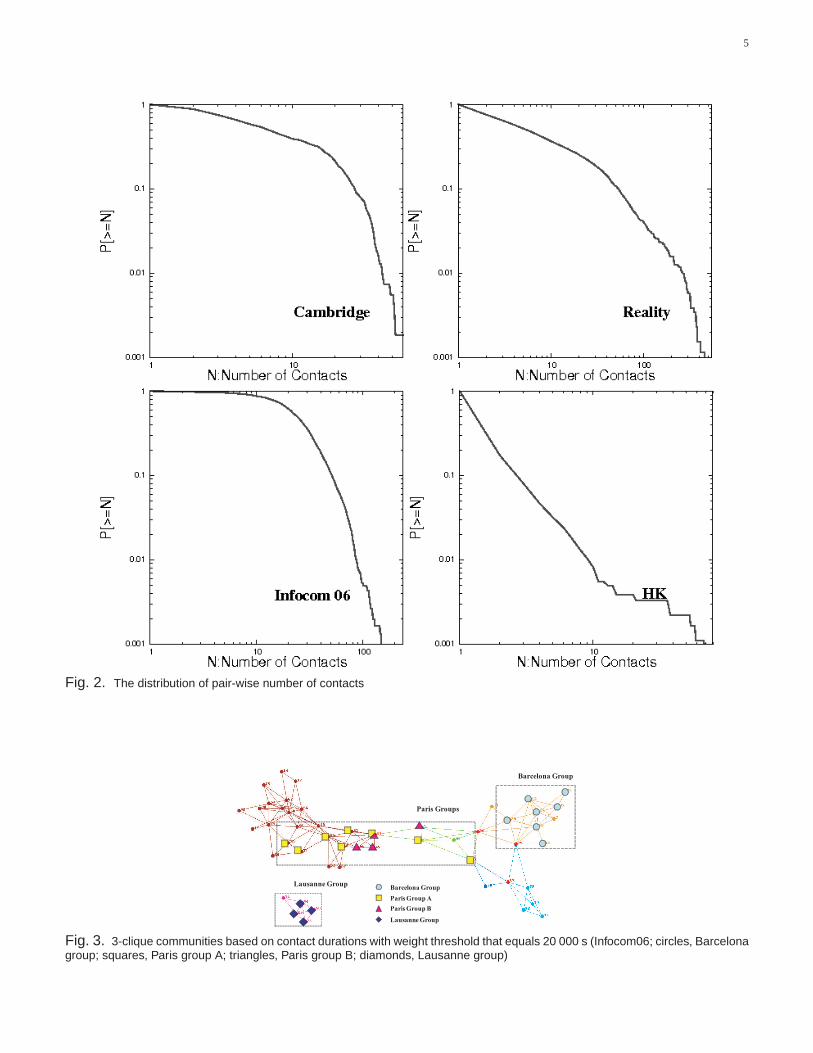
3.1 Contact GraphsIn order to help us to present the mobility traces and make it easier for further processing, we introduce the notionof contact graph. The way we convert human mobility traces into weighted contact graphs is based on the numberof contacts and the contact duration, although we could use other metrics. The nodes of the graphs are the physicalnodes from the traces, the edges are the contacts, and the weights of the edges are the values based on the metricsspecified such as the number of contacts during the experiment. We can measure the relationship between twopeople by how many times they meet each other and how long theystay with each other. We naturally think thatif two people spend more time together or see each other more often, they are in a closer relationship.
First, we find the distribution of contact durations and numberof contacts for the two conference scenarios arequite similar. To prevent redundancy, in the later sectionswe only selectively show one example, in most casesInfocom06, since it contains more participants.
Figure 1 and Figure 2 show the contact duration and number of contacts distribution for each pair in fourexperiments. For theHongKong experiment we include the external device because of the network sparseness, butfor the other three experiments we use only the internal devices. These contact graphs created are used for thecommunity detection in the following subsections.
4
Fig. 1. The distribution of pair-wise contact durations
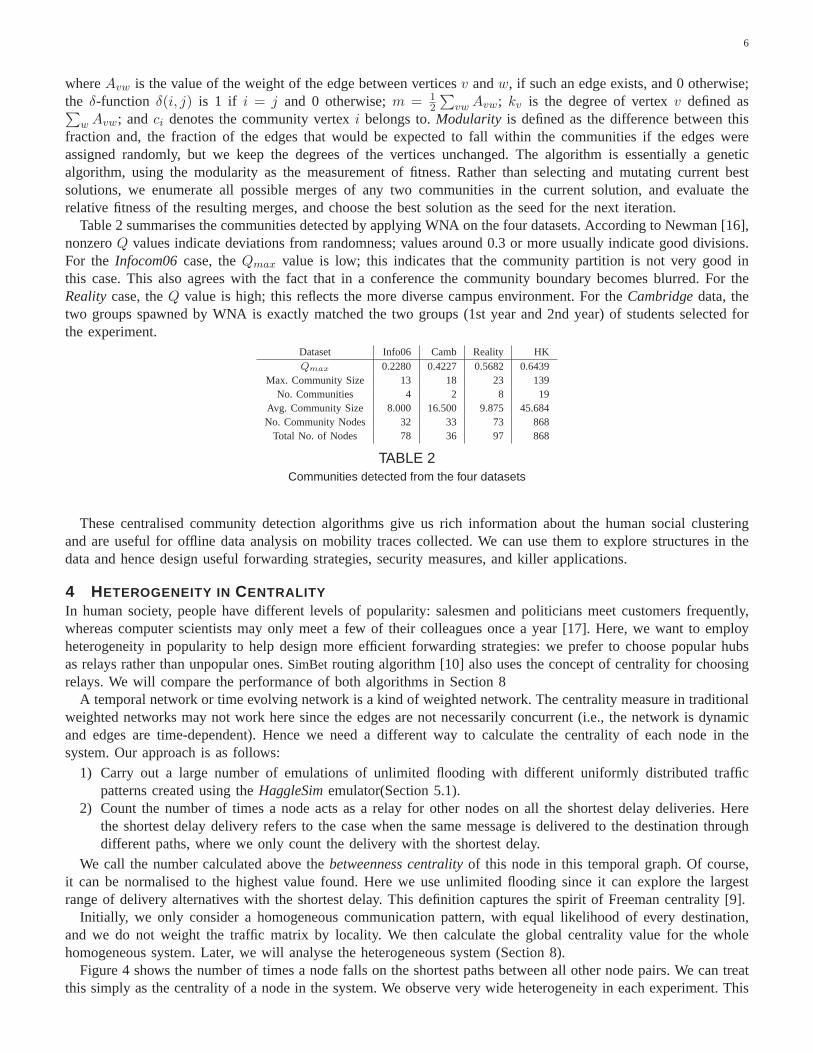
3.2 K-CLIQUE Community DetectionPalla et al. [15] define ak-clique community as a union of allk-cliques (complete subgraphs of sizek) that canbe reached from each other through a series of adjacentk-cliques, where twok-cliques are said to be adjacent ifthey sharek − 1 nodes. Ask is increased, thek-clique communities shrink, but on the other hand become morecohesive since their member nodes have to be part of at least onek-clique. We have applied this on all the datasetsabove. Figure 3 shows the3-clique communities in theInfocom06 dataset. More detailed descriptions about thek-clique communities on these datasets can be found in our previous work [17] [18].
3.3 Weighted Network AnalysisIn this section, we implement and apply Newman’s weighted network analysis (WNA) for our data analysis [16].This is an extension of the unweightedmodularity proposed in [19] to a weighted version, and use this as ameasurement of the fitness of the communities it detects.
For each community partitioning of a network, one can compute the corresponding modularity value using thefollowing definition of modularity (Q):
Q =∑
vw
[
Avw
2m−
kvkw
(2m)2
]
δ(cv,cw) (1)
5
Fig. 2. The distribution of pair-wise number of contacts
Barcelona Group
Paris Group A
Paris Group B
Lausanne Group
Paris Groups
Barcelona Group
Lausanne Group
Fig. 3. 3-clique communities based on contact durations with weight threshold that equals 20 000 s (Infocom06; circles, Barcelonagroup; squares, Paris group A; triangles, Paris group B; diamonds, Lausanne group)
6
whereAvw is the value of the weight of the edge between verticesv andw, if such an edge exists, and 0 otherwise;the δ-function δ(i, j) is 1 if i = j and 0 otherwise;m = 1
2
∑
vw Avw; kv is the degree of vertexv defined as∑
w Avw; and ci denotes the community vertexi belongs to.Modularity is defined as the difference between thisfraction and, the fraction of the edges that would be expected to fall within the communities if the edges wereassigned randomly, but we keep the degrees of the vertices unchanged. The algorithm is essentially a geneticalgorithm, using the modularity as the measurement of fitness. Rather than selecting and mutating current bestsolutions, we enumerate all possible merges of any two communities in the current solution, and evaluate therelative fitness of the resulting merges, and choose the best solution as the seed for the next iteration.
Table 2 summarises the communities detected by applying WNAon the four datasets. According to Newman [16],nonzeroQ values indicate deviations from randomness; values around0.3 or more usually indicate good divisions.For the Infocom06 case, theQmax value is low; this indicates that the community partition isnot very good inthis case. This also agrees with the fact that in a conference the community boundary becomes blurred. For theReality case, theQ value is high; this reflects the more diverse campus environment. For theCambridge data, thetwo groups spawned by WNA is exactly matched the two groups (1st year and 2nd year) of students selected forthe experiment.
Dataset Info06 Camb Reality HKQmax 0.2280 0.4227 0.5682 0.6439
Max. Community Size 13 18 23 139No. Communities 4 2 8 19
Avg. Community Size 8.000 16.500 9.875 45.684No. Community Nodes 32 33 73 868
Total No. of Nodes 78 36 97 868
TABLE 2Communities detected from the four datasets
These centralised community detection algorithms give us rich information about the human social clusteringand are useful for offline data analysis on mobility traces collected. We can use them to explore structures in thedata and hence design useful forwarding strategies, security measures, and killer applications.
4 HETEROGENEITY IN CENTRALITYIn human society, people have different levels of popularity: salesmen and politicians meet customers frequently,whereas computer scientists may only meet a few of their colleagues once a year [17]. Here, we want to employheterogeneity in popularity to help design more efficient forwarding strategies: we prefer to choose popular hubsas relays rather than unpopular ones.SimBet routing algorithm [10] also uses the concept of centrality for choosingrelays. We will compare the performance of both algorithms in Section 8
A temporal network or time evolving network is a kind of weighted network. The centrality measure in traditionalweighted networks may not work here since the edges are not necessarily concurrent (i.e., the network is dynamicand edges are time-dependent). Hence we need a different wayto calculate the centrality of each node in thesystem. Our approach is as follows:
1) Carry out a large number of emulations of unlimited floodingwith different uniformly distributed trafficpatterns created using theHaggleSim emulator(Section 5.1).
2) Count the number of times a node acts as a relay for other nodes on all the shortest delay deliveries. Herethe shortest delay delivery refers to the case when the same message is delivered to the destination throughdifferent paths, where we only count the delivery with the shortest delay.
We call the number calculated above thebetweenness centrality of this node in this temporal graph. Of course,it can be normalised to the highest value found. Here we use unlimited flooding since it can explore the largestrange of delivery alternatives with the shortest delay. Thisdefinition captures the spirit of Freeman centrality [9].
Initially, we only consider a homogeneous communication pattern, with equal likelihood of every destination,and we do not weight the traffic matrix by locality. We then calculate the global centrality value for the wholehomogeneous system. Later, we will analyse the heterogeneous system (Section 8).
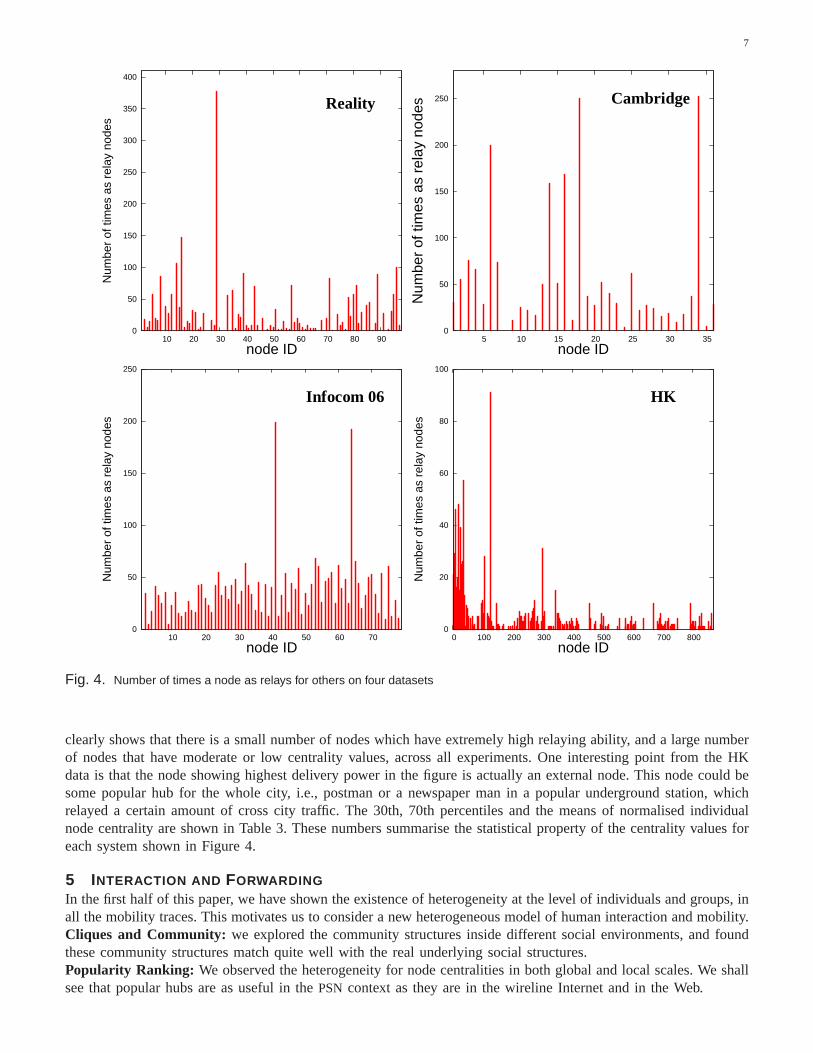
Figure 4 shows the number of times a node falls on the shortest paths between all other node pairs. We can treatthis simply as the centrality of a node in the system. We observe very wide heterogeneity in each experiment. This
7
0
50
100
150
200
250
10 20 30 40 50 60 70
Num
ber
of ti
mes
as
rela
y no
des
node ID
0
50
100
150
200
250
300
350
400
10 20 30 40 50 60 70 80 90
Num
ber
of ti
mes
as
rela
y no
des
node ID 0
50
100
150
200
250
5 10 15 20 25 30 35
Num
ber
of ti
mes
as
rela
y no
des
node ID
0
20
40
60
80
100
0 100 200 300 400 500 600 700 800
Num
ber
of ti
mes
as
rela
y no
des
node ID
Reality Cambridge
Infocom 06 HK
Fig. 4. Number of times a node as relays for others on four datasets
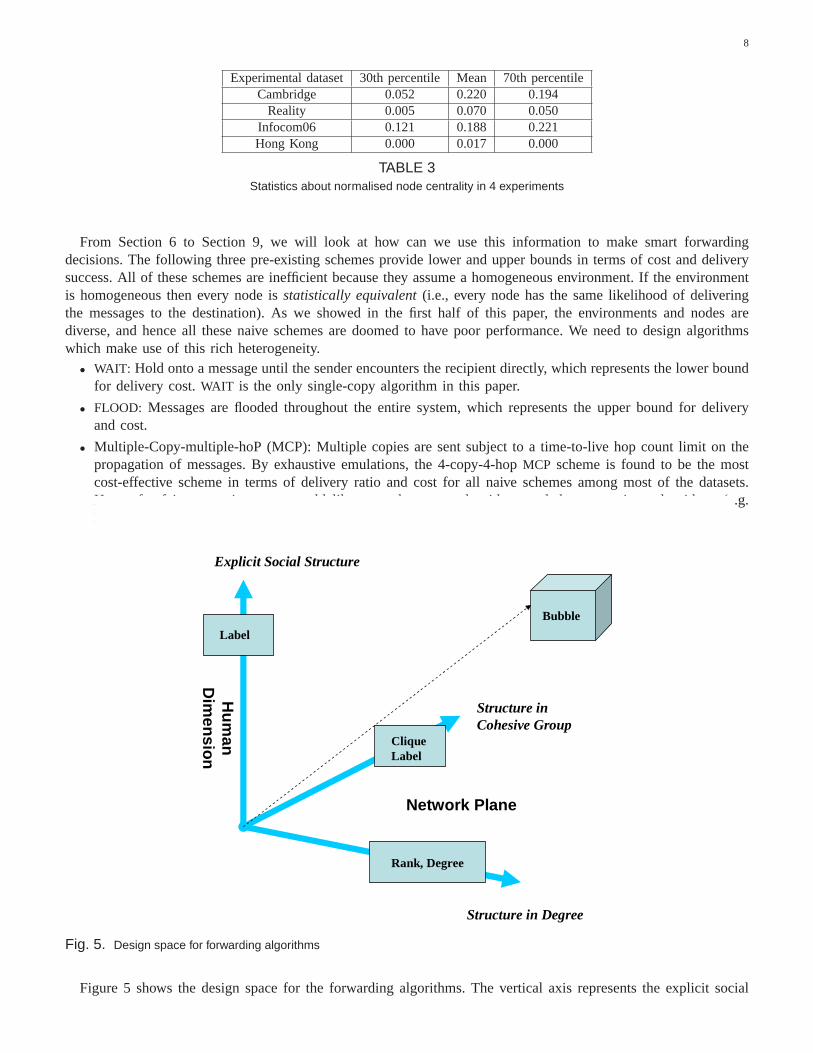
clearly shows that there is a small number of nodes which haveextremely high relaying ability, and a large numberof nodes that have moderate or low centrality values, acrossall experiments. One interesting point from the HKdata is that the node showing highest delivery power in the figure is actually an external node. This node could besome popular hub for the whole city, i.e., postman or a newspaper man in a popular underground station, whichrelayed a certain amount of cross city traffic. The 30th, 70th percentiles and the means of normalised individualnode centrality are shown in Table 3. These numbers summarisethe statistical property of the centrality values foreach system shown in Figure 4.
5 INTERACTION AND FORWARDINGIn the first half of this paper, we have shown the existence of heterogeneity at the level of individuals and groups, inall the mobility traces. This motivates us to consider a new heterogeneous model of human interaction and mobility.Cliques and Community: we explored the community structures inside different social environments, and foundthese community structures match quite well with the real underlying social structures.Popularity Ranking: We observed the heterogeneity for node centralities in bothglobal and local scales. We shallsee that popular hubs are as useful in thePSN context as they are in the wireline Internet and in the Web.
8
Experimental dataset 30th percentile Mean 70th percentileCambridge 0.052 0.220 0.194
Reality 0.005 0.070 0.050Infocom06 0.121 0.188 0.221Hong Kong 0.000 0.017 0.000
TABLE 3Statistics about normalised node centrality in 4 experiments
From Section 6 to Section 9, we will look at how can we use this information to make smart forwardingdecisions. The following three pre-existing schemes provide lower and upper bounds in terms of cost and deliverysuccess. All of these schemes are inefficient because they assume a homogeneous environment. If the environmentis homogeneous then every node isstatistically equivalent (i.e., every node has the same likelihood of deliveringthe messages to the destination). As we showed in the first halfof this paper, the environments and nodes arediverse, and hence all these naive schemes are doomed to havepoor performance. We need to design algorithmswhich make use of this rich heterogeneity.
• WAIT: Hold onto a message until the sender encounters the recipient directly, which represents the lower boundfor delivery cost.WAIT is the only single-copy algorithm in this paper.
• FLOOD: Messages are flooded throughout the entire system, which represents the upper bound for deliveryand cost.
• Multiple-Copy-multiple-hoP (MCP): Multiple copies are sent subject to a time-to-live hop count limit on thepropagation of messages. By exhaustive emulations, the 4-copy-4-hopMCP scheme is found to be the mostcost-effective scheme in terms of delivery ratio and cost for all naive schemes among most of the datasets.Hence for fair comparison, we would like to evaluate our algorithms and the comparison algorithms (e.g.PROPHET and SimBet) against the 4-copy-4-hopMCP scheme in most of the cases.
Explicit Social Structure
Structure in Degree
Structure in Cohesive Group
Label
Rank, Degree
Clique Label
Bubble
Network Plane
Hu
man
D
imen
sion
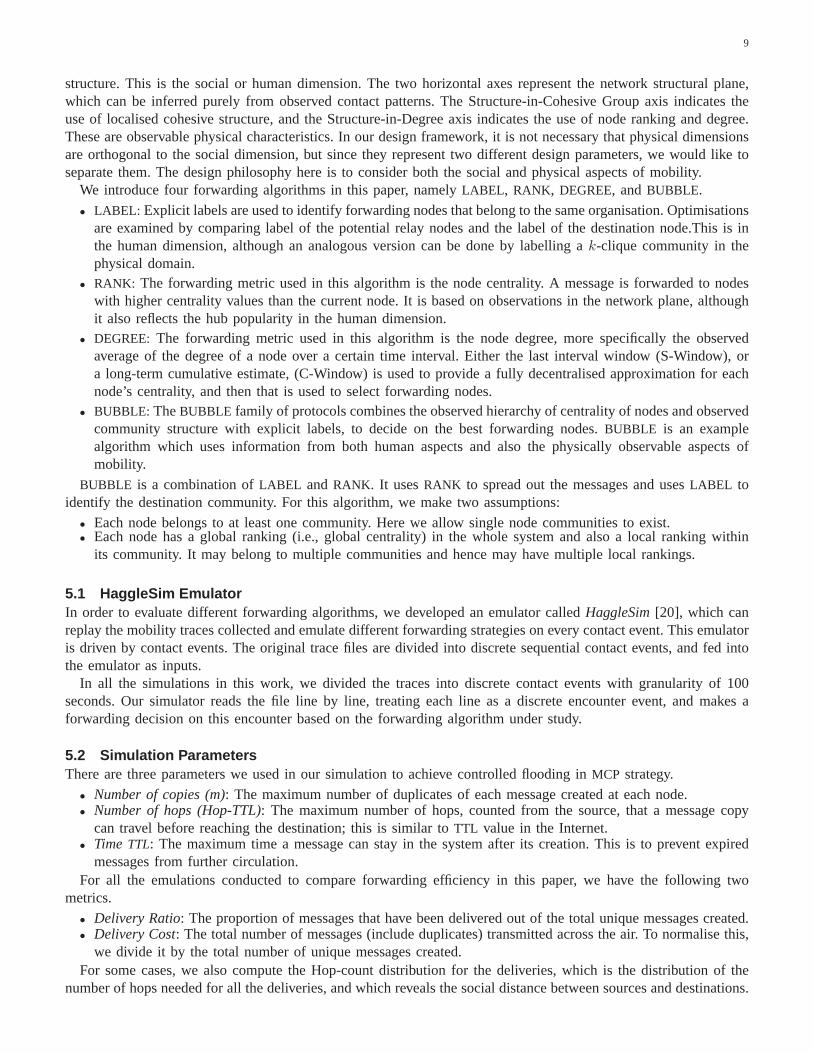
Fig. 5. Design space for forwarding algorithms
Figure 5 shows the design space for the forwarding algorithms. The vertical axis represents the explicit social
9
structure. This is the social or human dimension. The two horizontal axes represent the network structural plane,which can be inferred purely from observed contact patterns. The Structure-in-Cohesive Group axis indicates theuse of localised cohesive structure, and the Structure-in-Degree axis indicates the use of node ranking and degree.These are observable physical characteristics. In our design framework, it is not necessary that physical dimensionsare orthogonal to the social dimension, but since they represent two different design parameters, we would like toseparate them. The design philosophy here is to consider boththe social and physical aspects of mobility.
We introduce four forwarding algorithms in this paper, namely LABEL , RANK, DEGREE, andBUBBLE.
• LABEL: Explicit labels are used to identify forwarding nodes that belong to the same organisation. Optimisationsare examined by comparing label of the potential relay nodesand the label of the destination node.This is inthe human dimension, although an analogous version can be done by labelling ak-clique community in thephysical domain.
• RANK: The forwarding metric used in this algorithm is the node centrality. A message is forwarded to nodeswith higher centrality values than the current node. It is based on observations in the network plane, althoughit also reflects the hub popularity in the human dimension.
• DEGREE: The forwarding metric used in this algorithm is the node degree, more specifically the observedaverage of the degree of a node over a certain time interval. Either the last interval window (S-Window), ora long-term cumulative estimate, (C-Window) is used to provide a fully decentralised approximation for eachnode’s centrality, and then that is used to select forwarding nodes.
• BUBBLE: TheBUBBLE family of protocols combines the observed hierarchy of centrality of nodes and observedcommunity structure with explicit labels, to decide on the best forwarding nodes.BUBBLE is an examplealgorithm which uses information from both human aspects and also the physically observable aspects ofmobility.
BUBBLE is a combination ofLABEL andRANK. It usesRANK to spread out the messages and usesLABEL toidentify the destination community. For this algorithm, wemake two assumptions:
• Each node belongs to at least one community. Here we allow single node communities to exist.• Each node has a global ranking (i.e., global centrality) in the whole system and also a local ranking within
its community. It may belong to multiple communities and hence may have multiple local rankings.
5.1 HaggleSim EmulatorIn order to evaluate different forwarding algorithms, we developed an emulator calledHaggleSim [20], which canreplay the mobility traces collected and emulate differentforwarding strategies on every contact event. This emulatoris driven by contact events. The original trace files are divided into discrete sequential contact events, and fed intothe emulator as inputs.
In all the simulations in this work, we divided the traces into discrete contact events with granularity of 100seconds. Our simulator reads the file line by line, treating each line as a discrete encounter event, and makes aforwarding decision on this encounter based on the forwarding algorithm under study.
5.2 Simulation ParametersThere are three parameters we used in our simulation to achieve controlled flooding inMCP strategy.
• Number of copies (m): The maximum number of duplicates of each message created at each node.• Number of hops (Hop-TTL): The maximum number of hops, counted from the source, that a message copy
can travel before reaching the destination; this is similarto TTL value in the Internet.• Time TTL: The maximum time a message can stay in the system after its creation. This is to prevent expired
messages from further circulation.For all the emulations conducted to compare forwarding efficiency in this paper, we have the following two
metrics.
• Delivery Ratio: The proportion of messages that have been delivered out of the total unique messages created.• Delivery Cost: The total number of messages (include duplicates) transmitted across the air. To normalise this,
we divide it by the total number of unique messages created.For some cases, we also compute the Hop-count distribution for the deliveries, which is the distribution of the
number of hops needed for all the deliveries, and which reveals the social distance between sources and destinations.
10
In the following sections, we will introduce several forwarding algorithms and evaluate their performances withthe above metrics. For each emulation,1,000 unique messages are created, with the source and destination randomlychosen or chosen based on specific grouping, which will be specified in each evaluation case. The creating timeof the messages is uniformly distributed within the simulation duration. Since the experimental durations for thedatasets we used for simulation are in the order of days or even weeks, so we ignore the transient period andaverage the results thoughout the simulation periods.
6 GREEDY RANKING ALGORITHMThe contribution of this section is to introduceRANK algorithm in detail and evaluate its performance using differentdatasets.
RANK is similar to the greedy strategy introduced by Adamicet al. [21]. A PSN is not a static network like theInternet: we do not know when a local maximum is reached sincethe next encounter is unexpected. We cannotemploy precisely the same strategy as they proposed, of traversing up the hierarchy until reaching the maximum,and then down a step. InRANK, we assume each node knows only its own ranking and the rankings of those itencounters, but does not know the ranking of other nodes it does not encounter, and does not know which nodehas the highest rank in the system.RANK is very simple: we keep pushing traffic on all paths to nodes which havea higher ranking than the current node, until either the destination is reached, or the messages expire.
If a system is small enough, the global ranking of each node isactually the local ranking. If we consider only theSystems Research group (around 40 people), a subset of the Cambridge Computer Laboratory (235 people), thisis the ranking of each node inside the group. If we consider the whole Computer Laboratory, we are consideringa larger system of many groups, but they all use the same building. A homogeneous ranking can still work. Butwhen we consider the whole city of Cambridge, a homogeneous ranking system would exclude many small scalestructures. In this section, we show that in relatively small and homogeneous systems, a simple greedy rankingalgorithm can achieve good performance.
0
0.1
0.2
0.3
0.4
0.5
0.6
3 weeks1 w4 d2 d1 day6 h3 h1 hour10 min2 min
Del
iver
y su
cces
s ra
tio
Time TTL
MCPRANKWAIT
0
2
4
6
8
10
12
14
16
18
3 weeks1 w4 d2 d1 day6 h3 h1 hour10 min2 min
Tot
al C
ost
Time TTL
MCPRANKWAIT
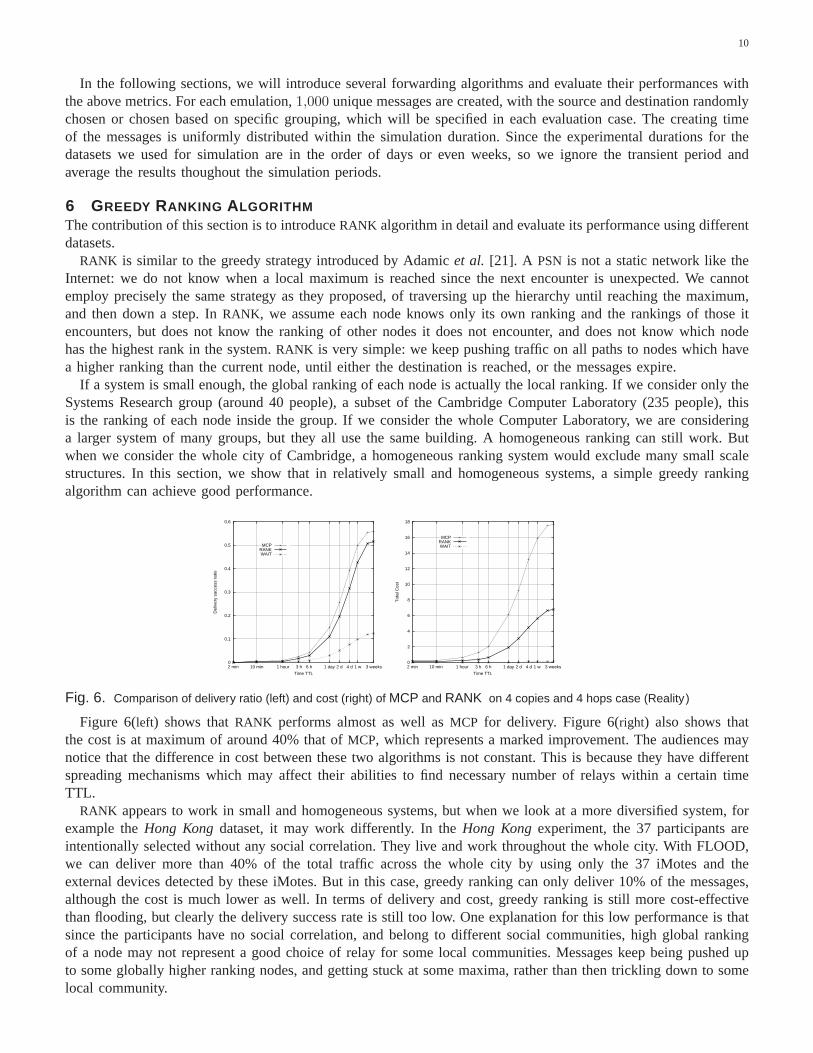
Fig. 6. Comparison of delivery ratio (left) and cost (right) of MCP and RANK on 4 copies and 4 hops case (Reality )
Figure 6(left) shows thatRANK performs almost as well asMCP for delivery. Figure 6(right) also shows thatthe cost is at maximum of around 40% that ofMCP, which represents a marked improvement. The audiences maynotice that the difference in cost between these two algorithms is not constant. This is because they have differentspreading mechanisms which may affect their abilities to findnecessary number of relays within a certain timeTTL.
RANK appears to work in small and homogeneous systems, but when welook at a more diversified system, forexample theHong Kong dataset, it may work differently. In theHong Kong experiment, the 37 participants areintentionally selected without any social correlation. They live and work throughout the whole city. With FLOOD,we can deliver more than 40% of the total traffic across the whole city by using only the 37 iMotes and theexternal devices detected by these iMotes. But in this case,greedy ranking can only deliver 10% of the messages,although the cost is much lower as well. In terms of delivery and cost, greedy ranking is still more cost-effectivethan flooding, but clearly the delivery success rate is still too low. One explanation for this low performance is thatsince the participants have no social correlation, and belong to different social communities, high global rankingof a node may not represent a good choice of relay for some local communities. Messages keep being pushed upto some globally higher ranking nodes, and getting stuck at some maxima, rather than then trickling down to somelocal community.
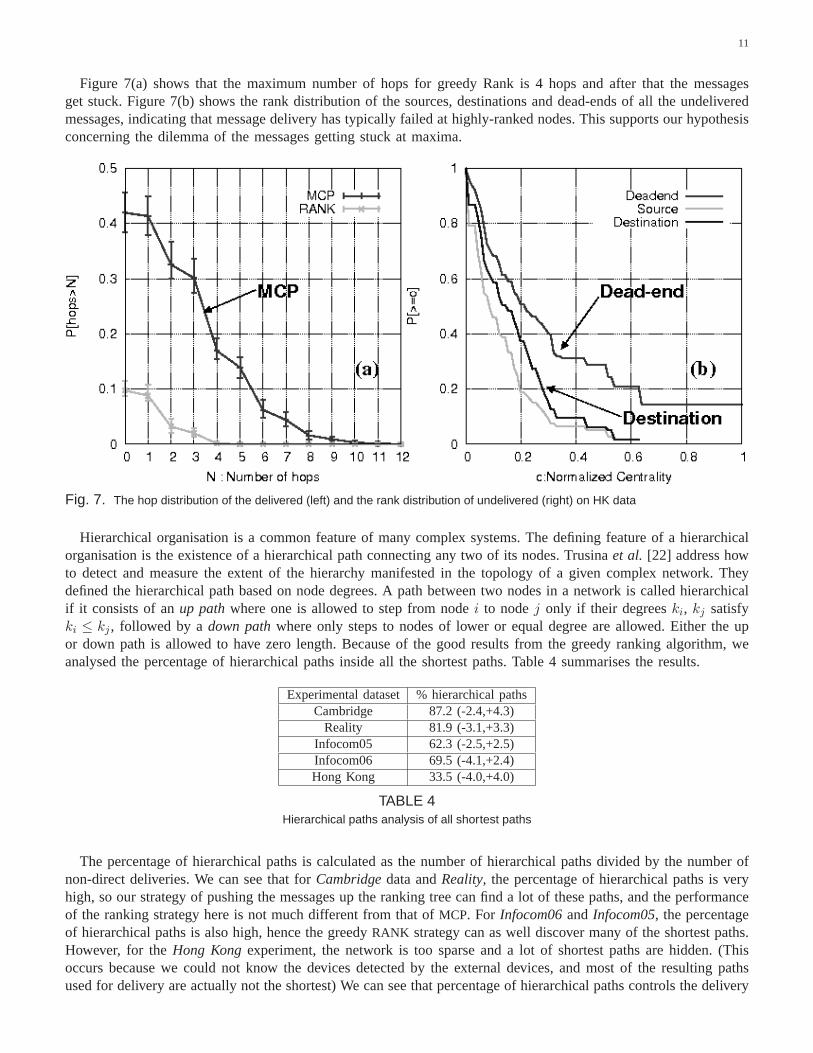
11
Figure 7(a) shows that the maximum number of hops for greedy Rank is 4 hops and after that the messagesget stuck. Figure 7(b) shows the rank distribution of the sources, destinations and dead-ends of all the undeliveredmessages, indicating that message delivery has typically failed at highly-ranked nodes. This supports our hypothesisconcerning the dilemma of the messages getting stuck at maxima.
Fig. 7. The hop distribution of the delivered (left) and the rank distribution of undelivered (right) on HK data
Hierarchical organisation is a common feature of many complex systems. The defining feature of a hierarchicalorganisation is the existence of a hierarchical path connecting any two of its nodes. Trusinaet al. [22] address howto detect and measure the extent of the hierarchy manifestedin the topology of a given complex network. Theydefined the hierarchical path based on node degrees. A path between two nodes in a network is called hierarchicalif it consists of anup path where one is allowed to step from nodei to nodej only if their degreeski, kj satisfyki ≤ kj , followed by adown path where only steps to nodes of lower or equal degree are allowed. Either the upor down path is allowed to have zero length. Because of the good results from the greedy ranking algorithm, weanalysed the percentage of hierarchical paths inside all the shortest paths. Table 4 summarises the results.
Experimental dataset % hierarchical pathsCambridge 87.2 (-2.4,+4.3)
Reality 81.9 (-3.1,+3.3)Infocom05 62.3 (-2.5,+2.5)Infocom06 69.5 (-4.1,+2.4)Hong Kong 33.5 (-4.0,+4.0)
TABLE 4Hierarchical paths analysis of all shortest paths
The percentage of hierarchical paths is calculated as the number of hierarchical paths divided by the number ofnon-direct deliveries. We can see that forCambridge data andReality, the percentage of hierarchical paths is veryhigh, so our strategy of pushing the messages up the ranking tree can find a lot of these paths, and the performanceof the ranking strategy here is not much different from that of MCP. For Infocom06 andInfocom05, the percentageof hierarchical paths is also high, hence the greedyRANK strategy can as well discover many of the shortest paths.However, for theHong Kong experiment, the network is too sparse and a lot of shortest paths are hidden. (Thisoccurs because we could not know the devices detected by the external devices, and most of the resulting pathsused for delivery are actually not the shortest) We can see that percentage of hierarchical paths controls the delivery
12
success achieved by the greedyRANK algorithm. We conclude from this that a high percentage of the shortestpaths are actually hierarchical paths.
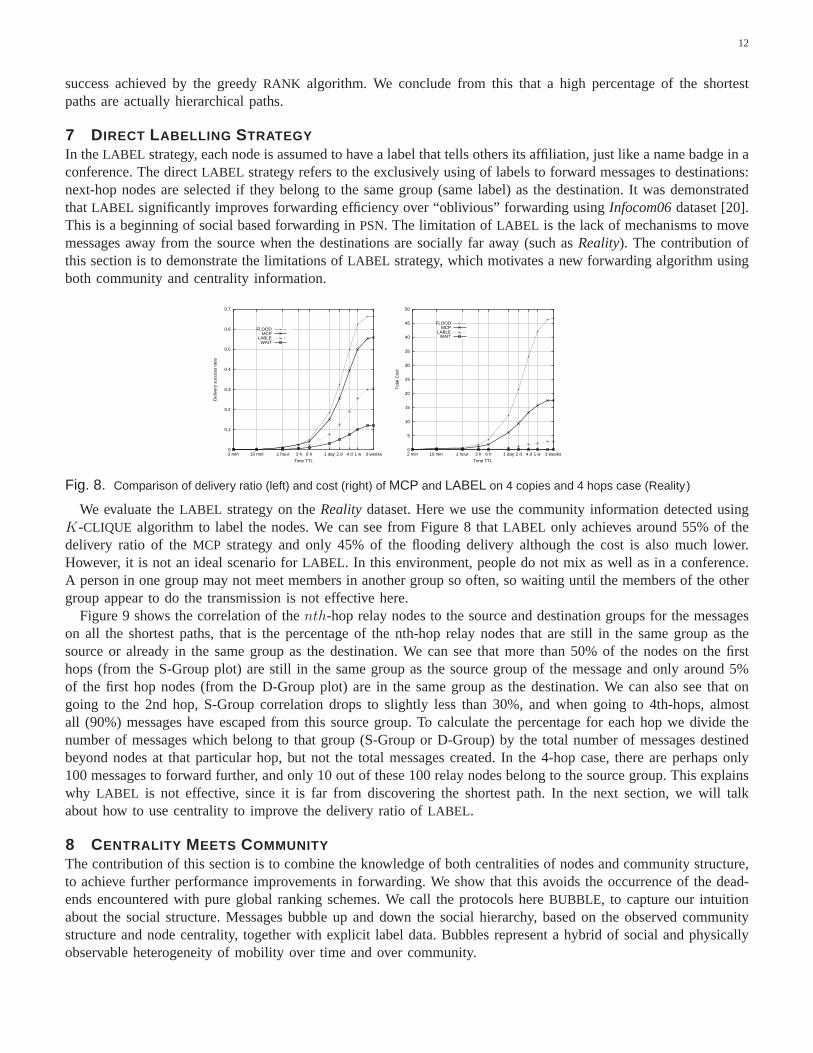
7 DIRECT LABELLING STRATEGYIn theLABEL strategy, each node is assumed to have a label that tells others its affiliation, just like a name badge in aconference. The directLABEL strategy refers to the exclusively using of labels to forward messages to destinations:next-hop nodes are selected if they belong to the same group (same label) as the destination. It was demonstratedthatLABEL significantly improves forwarding efficiency over “oblivious” forwarding usingInfocom06 dataset [20].This is a beginning of social based forwarding inPSN. The limitation ofLABEL is the lack of mechanisms to movemessages away from the source when the destinations are socially far away (such asReality). The contribution ofthis section is to demonstrate the limitations ofLABEL strategy, which motivates a new forwarding algorithm usingboth community and centrality information.
0
0.1
0.2
0.3
0.4
0.5
0.6
0.7
3 weeks1 w4 d2 d1 day6 h3 h1 hour10 min2 min
Del
iver
y su
cces
s ra
tio
Time TTL
FLOODMCP
LABLEWAIT
0
5
10
15
20
25
30
35
40
45
50
3 weeks1 w4 d2 d1 day6 h3 h1 hour10 min2 min
Tot
al C
ost
Time TTL
FLOODMCP
LABLEWAIT
Fig. 8. Comparison of delivery ratio (left) and cost (right) of MCP and LABEL on 4 copies and 4 hops case (Reality )
We evaluate theLABEL strategy on theReality dataset. Here we use the community information detected usingK-CLIQUE algorithm to label the nodes. We can see from Figure 8 thatLABEL only achieves around 55% of thedelivery ratio of theMCP strategy and only 45% of the flooding delivery although the cost is also much lower.However, it is not an ideal scenario forLABEL . In this environment, people do not mix as well as in a conference.A person in one group may not meet members in another group so often, so waiting until the members of the othergroup appear to do the transmission is not effective here.
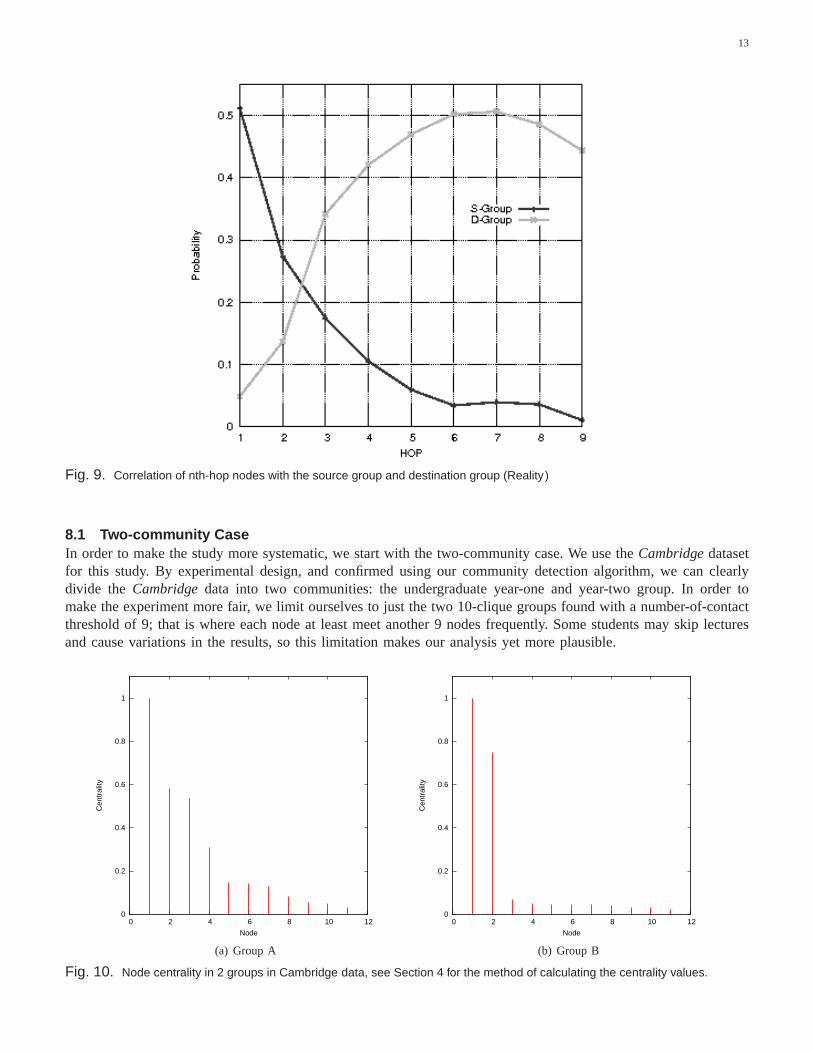
Figure 9 shows the correlation of thenth-hop relay nodes to the source and destination groups for themessageson all the shortest paths, that is the percentage of the nth-hop relay nodes that are still in the same group as thesource or already in the same group as the destination. We cansee that more than 50% of the nodes on the firsthops (from the S-Group plot) are still in the same group as the source group of the message and only around 5%of the first hop nodes (from the D-Group plot) are in the same group as the destination. We can also see that ongoing to the 2nd hop, S-Group correlation drops to slightly less than 30%, and when going to 4th-hops, almostall (90%) messages have escaped from this source group. To calculate the percentage for each hop we divide thenumber of messages which belong to that group (S-Group or D-Group) by the total number of messages destinedbeyond nodes at that particular hop, but not the total messages created. In the 4-hop case, there are perhaps only100 messages to forward further, and only 10 out of these 100 relay nodes belong to the source group. This explainswhy LABEL is not effective, since it is far from discovering the shortest path. In the next section, we will talkabout how to use centrality to improve the delivery ratio ofLABEL .
8 CENTRALITY MEETS COMMUNITYThe contribution of this section is to combine the knowledge of both centralities of nodes and community structure,to achieve further performance improvements in forwarding. We show that this avoids the occurrence of the dead-ends encountered with pure global ranking schemes. We call the protocols hereBUBBLE, to capture our intuitionabout the social structure. Messages bubble up and down the social hierarchy, based on the observed communitystructure and node centrality, together with explicit label data. Bubbles represent a hybrid of social and physicallyobservable heterogeneity of mobility over time and over community.
13
Fig. 9. Correlation of nth-hop nodes with the source group and destination group (Reality )
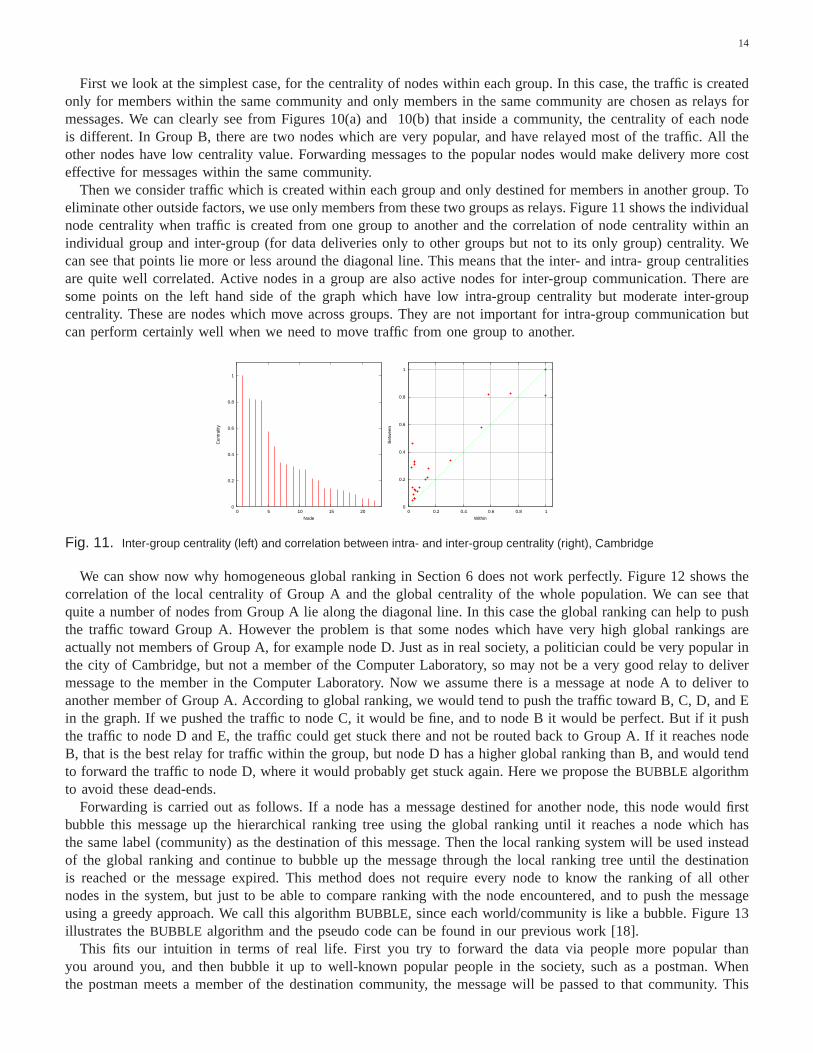
8.1 Two-community CaseIn order to make the study more systematic, we start with the two-community case. We use theCambridge datasetfor this study. By experimental design, and confirmed using our community detection algorithm, we can clearlydivide the Cambridge data into two communities: the undergraduate year-one and year-two group. In order tomake the experiment more fair, we limit ourselves to just thetwo 10-clique groups found with a number-of-contactthreshold of 9; that is where each node at least meet another 9nodes frequently. Some students may skip lecturesand cause variations in the results, so this limitation makes our analysis yet more plausible.
0
0.2
0.4
0.6
0.8
1
0 2 4 6 8 10 12
Cen
tral
ity
Node
(a) Group A
0
0.2
0.4
0.6
0.8
1
0 2 4 6 8 10 12
Cen
tral
ity
Node
(b) Group B
Fig. 10. Node centrality in 2 groups in Cambridge data, see Section 4 for the method of calculating the centrality values.
14
First we look at the simplest case, for the centrality of nodeswithin each group. In this case, the traffic is createdonly for members within the same community and only members in the same community are chosen as relays formessages. We can clearly see from Figures 10(a) and 10(b) thatinside a community, the centrality of each nodeis different. In Group B, there are two nodes which are very popular, and have relayed most of the traffic. All theother nodes have low centrality value. Forwarding messagesto the popular nodes would make delivery more costeffective for messages within the same community.
Then we consider traffic which is created within each group and only destined for members in another group. Toeliminate other outside factors, we use only members from these two groups as relays. Figure 11 shows the individualnode centrality when traffic is created from one group to another and the correlation of node centrality within anindividual group and inter-group (for data deliveries onlyto other groups but not to its only group) centrality. Wecan see that points lie more or less around the diagonal line.This means that the inter- and intra- group centralitiesare quite well correlated. Active nodes in a group are also active nodes for inter-group communication. There aresome points on the left hand side of the graph which have low intra-group centrality but moderate inter-groupcentrality. These are nodes which move across groups. They arenot important for intra-group communication butcan perform certainly well when we need to move traffic from onegroup to another.
0
0.2
0.4
0.6
0.8
1
0 5 10 15 20
Cen
tral
ity
Node
0
0.2
0.4
0.6
0.8
1
0 0.2 0.4 0.6 0.8 1
Bet
wee
n
Within
Fig. 11. Inter-group centrality (left) and correlation between intra- and inter-group centrality (right), Cambridge
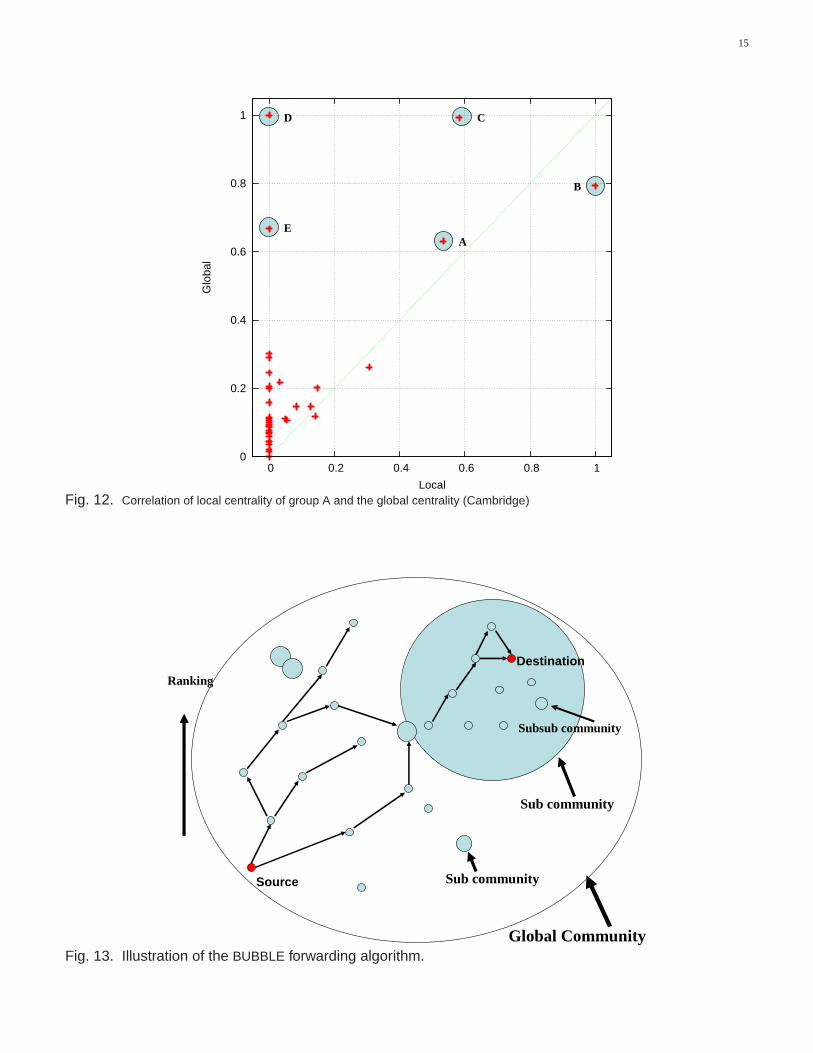
We can show now why homogeneous global ranking in Section 6 does not work perfectly. Figure 12 shows thecorrelation of the local centrality of Group A and the globalcentrality of the whole population. We can see thatquite a number of nodes from Group A lie along the diagonal line. In this case the global ranking can help to pushthe traffic toward Group A. However the problem is that some nodes which have very high global rankings areactually not members of Group A, for example node D. Just as inreal society, a politician could be very popular inthe city of Cambridge, but not a member of the Computer Laboratory, so may not be a very good relay to delivermessage to the member in the Computer Laboratory. Now we assume there is a message at node A to deliver toanother member of Group A. According to global ranking, we would tend to push the traffic toward B, C, D, and Ein the graph. If we pushed the traffic to node C, it would be fine, and to node B it would be perfect. But if it pushthe traffic to node D and E, the traffic could get stuck there and notbe routed back to Group A. If it reaches nodeB, that is the best relay for traffic within the group, but node Dhas a higher global ranking than B, and would tendto forward the traffic to node D, where it would probably get stuck again. Here we propose theBUBBLE algorithmto avoid these dead-ends.
Forwarding is carried out as follows. If a node has a message destined for another node, this node would firstbubble this message up the hierarchical ranking tree using the global ranking until it reaches a node which hasthe same label (community) as the destination of this message. Then the local ranking system will be used insteadof the global ranking and continue to bubble up the message through the local ranking tree until the destinationis reached or the message expired. This method does not require every node to know the ranking of all othernodes in the system, but just to be able to compare ranking with the node encountered, and to push the messageusing a greedy approach. We call this algorithmBUBBLE, since each world/community is like a bubble. Figure 13illustrates theBUBBLE algorithm and the pseudo code can be found in our previous work [18].
This fits our intuition in terms of real life. First you try to forward the data via people more popular thanyou around you, and then bubble it up to well-known popular people in the society, such as a postman. Whenthe postman meets a member of the destination community, themessage will be passed to that community. This
15
0
0.2
0.4
0.6
0.8
1
0 0.2 0.4 0.6 0.8 1
Glo
bal
Local
A
CD
E
B
Fig. 12. Correlation of local centrality of group A and the global centrality (Cambridge)
Ranking
Source
Destination
Global Community
Sub community
Sub community
Subsub community
Fig. 13. Illustration of the BUBBLE forwarding algorithm.
16
community member will try to identify the more popular members within the community and bubble the messageup again within the local hierarchy until the message reaching a very popular member, or the destination itself, orthe message expires.
A modified version of this strategy is that whenever a message is delivered to the community, the original carriercan delete this message from its buffer to prevent it from further dissemination. This assumes that the communitymember would be able to deliver this message. We call this protocol with deletion, strategyBUBBLE-B, and theoriginal algorithm introduced aboveBUBBLE-A.
0
0.1
0.2
0.3
0.4
0.5
0.6
0.7
0.8
0.9
3 weeks1 w4 d2 d1 day6 h3 h1 hour10 min2 min
Del
iver
y su
cces
s ra
tio
Time TTL
MCPBUBBLE-ABUBBLE-B
RANKLABEL
0
5
10
15
20
25
3 weeks1 w4 d2 d1 day6 h3 h1 hour10 min2 min
Tot
al C
ost
Time TTL
MCPBUBBLE-ABUBBLE-B
RANKLABEL
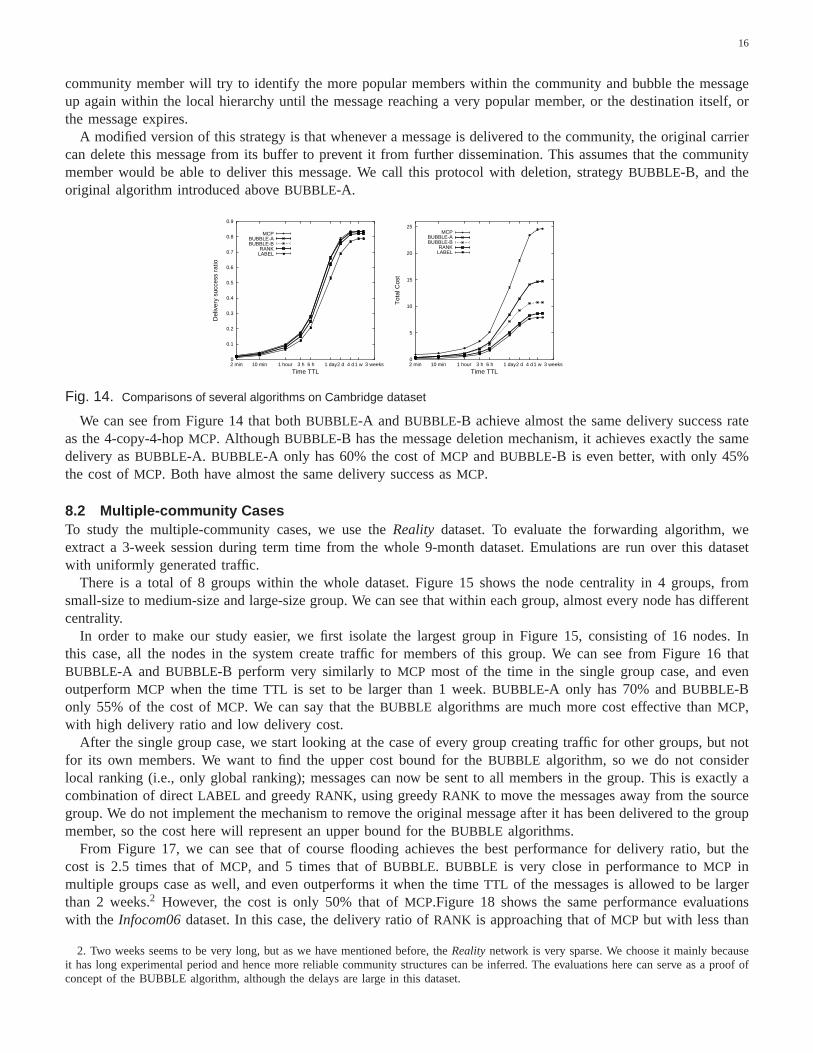
Fig. 14. Comparisons of several algorithms on Cambridge dataset
We can see from Figure 14 that bothBUBBLE-A and BUBBLE-B achieve almost the same delivery success rateas the 4-copy-4-hopMCP. AlthoughBUBBLE-B has the message deletion mechanism, it achieves exactly the samedelivery asBUBBLE-A. BUBBLE-A only has 60% the cost ofMCP andBUBBLE-B is even better, with only 45%the cost ofMCP. Both have almost the same delivery success asMCP.
8.2 Multiple-community CasesTo study the multiple-community cases, we use theReality dataset. To evaluate the forwarding algorithm, weextract a 3-week session during term time from the whole 9-month dataset. Emulations are run over this datasetwith uniformly generated traffic.
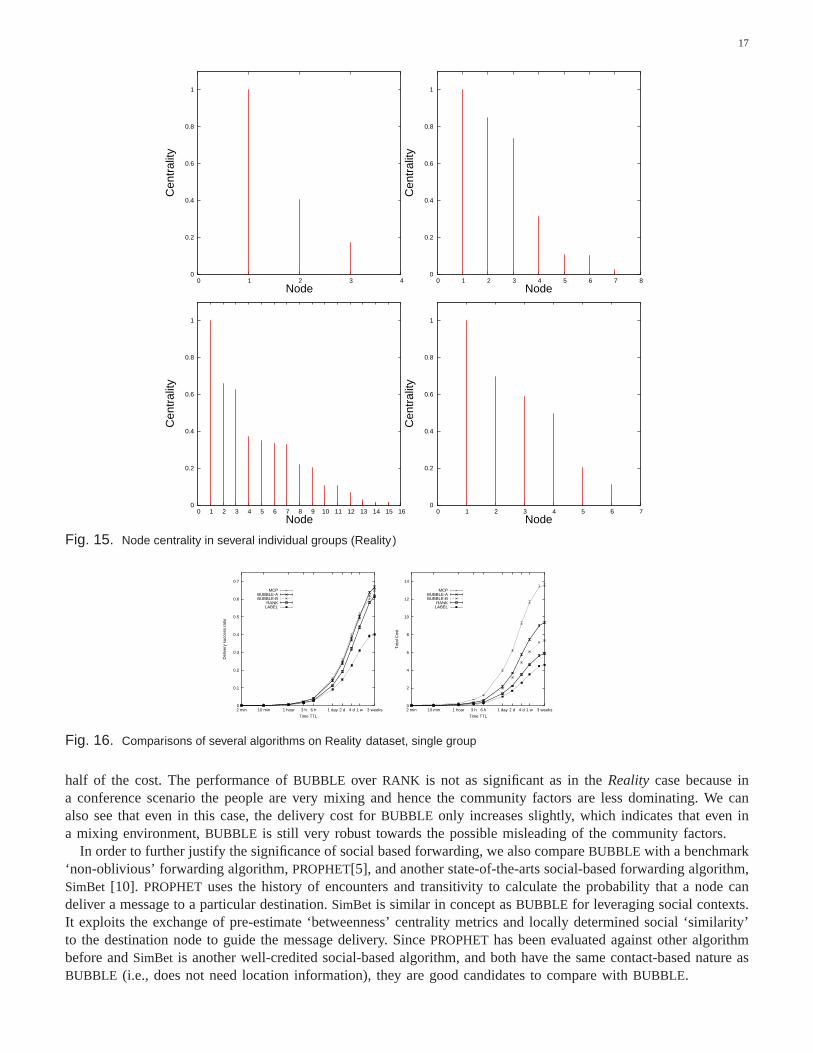
There is a total of 8 groups within the whole dataset. Figure 15 shows the node centrality in 4 groups, fromsmall-size to medium-size and large-size group. We can see that within each group, almost every node has differentcentrality.
In order to make our study easier, we first isolate the largest group in Figure 15, consisting of 16 nodes. Inthis case, all the nodes in the system create traffic for members of this group. We can see from Figure 16 thatBUBBLE-A and BUBBLE-B perform very similarly toMCP most of the time in the single group case, and evenoutperformMCP when the timeTTL is set to be larger than 1 week.BUBBLE-A only has 70% andBUBBLE-Bonly 55% of the cost ofMCP. We can say that theBUBBLE algorithms are much more cost effective thanMCP,with high delivery ratio and low delivery cost.
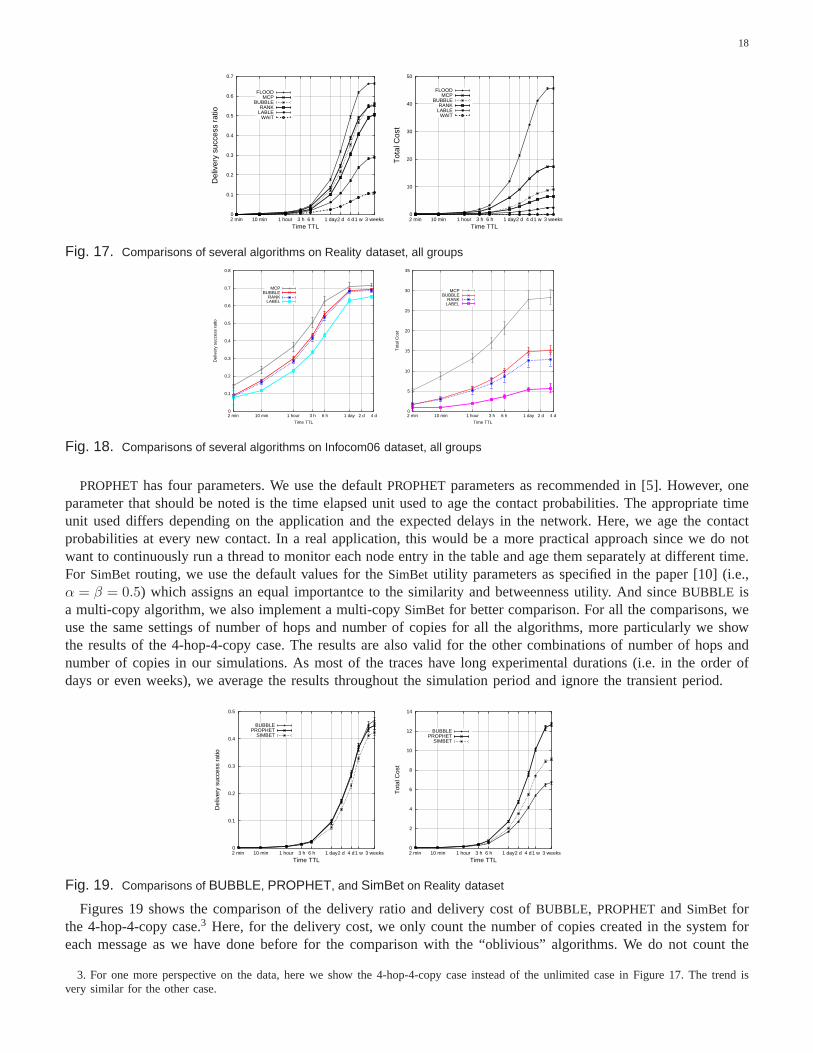
After the single group case, we start looking at the case of every group creating traffic for other groups, but notfor its own members. We want to find the upper cost bound for theBUBBLE algorithm, so we do not considerlocal ranking (i.e., only global ranking); messages can nowbe sent to all members in the group. This is exactly acombination of directLABEL and greedyRANK, using greedyRANK to move the messages away from the sourcegroup. We do not implement the mechanism to remove the original message after it has been delivered to the groupmember, so the cost here will represent an upper bound for theBUBBLE algorithms.
From Figure 17, we can see that of course flooding achieves the best performance for delivery ratio, but thecost is 2.5 times that ofMCP, and 5 times that ofBUBBLE. BUBBLE is very close in performance toMCP inmultiple groups case as well, and even outperforms it when the timeTTL of the messages is allowed to be largerthan 2 weeks.2 However, the cost is only 50% that ofMCP.Figure 18 shows the same performance evaluationswith the Infocom06 dataset. In this case, the delivery ratio ofRANK is approaching that ofMCP but with less than
2. Two weeks seems to be very long, but as we have mentioned before,the Reality network is very sparse. We choose it mainly becauseit has long experimental period and hence more reliable community structures can be inferred. The evaluations here can serve as a proof ofconcept of the BUBBLE algorithm, although the delays are large in this dataset.
17
0
0.2
0.4
0.6
0.8
1
0 1 2 3 4
Cen
tral
ity
Node 0
0.2
0.4
0.6
0.8
1
0 1 2 3 4 5 6 7 8
Cen
tral
ity
Node
0
0.2
0.4
0.6
0.8
1
0 1 2 3 4 5 6 7 8 9 10 11 12 13 14 15 16
Cen
tral
ity
Node 0
0.2
0.4
0.6
0.8
1
0 1 2 3 4 5 6 7
Cen
tral
ity
Node
Fig. 15. Node centrality in several individual groups (Reality )
0
0.1
0.2
0.3
0.4
0.5
0.6
0.7
3 weeks1 w4 d2 d1 day6 h3 h1 hour10 min2 min
Del
iver
y su
cces
s ra
tio
Time TTL
MCPBUBBLE-ABUBBLE-B
RANKLABEL
0
2
4
6
8
10
12
14
3 weeks1 w4 d2 d1 day6 h3 h1 hour10 min2 min
Tot
al C
ost
Time TTL
MCPBUBBLE-ABUBBLE-B
RANKLABEL
Fig. 16. Comparisons of several algorithms on Reality dataset, single group
half of the cost. The performance ofBUBBLE over RANK is not as significant as in theReality case because ina conference scenario the people are very mixing and hence the community factors are less dominating. We canalso see that even in this case, the delivery cost forBUBBLE only increases slightly, which indicates that even ina mixing environment,BUBBLE is still very robust towards the possible misleading of the community factors.
In order to further justify the significance of social based forwarding, we also compareBUBBLE with a benchmark‘non-oblivious’ forwarding algorithm,PROPHET[5], and another state-of-the-arts social-based forwarding algorithm,SimBet [10]. PROPHETuses the history of encounters and transitivity to calculate the probability that a node candeliver a message to a particular destination.SimBet is similar in concept asBUBBLE for leveraging social contexts.It exploits the exchange of pre-estimate ‘betweenness’ centrality metrics and locally determined social ‘similarity’to the destination node to guide the message delivery. SincePROPHEThas been evaluated against other algorithmbefore andSimBet is another well-credited social-based algorithm, and bothhave the same contact-based nature asBUBBLE (i.e., does not need location information), they are good candidates to compare withBUBBLE.
18
0
0.1
0.2
0.3
0.4
0.5
0.6
0.7
3 weeks1 w4 d2 d1 day6 h3 h1 hour10 min2 minD
eliv
ery
succ
ess
ratio
Time TTL
FLOODMCP
BUBBLERANK
LABLEWAIT
0
10
20
30
40
50
3 weeks1 w4 d2 d1 day6 h3 h1 hour10 min2 min
Tot
al C
ost
Time TTL
FLOODMCP
BUBBLERANK
LABLEWAIT
Fig. 17. Comparisons of several algorithms on Reality dataset, all groups
0
0.1
0.2
0.3
0.4
0.5
0.6
0.7
0.8
4 d2 d1 day6 h3 h1 hour10 min2 min
Del
iver
y su
cces
s ra
tio
Time TTL
MCPBUBBLE
RANKLABEL
0
5
10
15
20
25
30
35
4 d2 d1 day6 h3 h1 hour10 min2 min
Tot
al C
ost
Time TTL
MCPBUBBLE
RANKLABEL
Fig. 18. Comparisons of several algorithms on Infocom06 dataset, all groups
PROPHEThas four parameters. We use the defaultPROPHETparameters as recommended in [5]. However, oneparameter that should be noted is the time elapsed unit used to age the contact probabilities. The appropriate timeunit used differs depending on the application and the expected delays in the network. Here, we age the contactprobabilities at every new contact. In a real application, this would be a more practical approach since we do notwant to continuously run a thread to monitor each node entry in the table and age them separately at different time.For SimBet routing, we use the default values for theSimBet utility parameters as specified in the paper [10] (i.e.,α = β = 0.5) which assigns an equal importantce to the similarity and betweenness utility. And sinceBUBBLE isa multi-copy algorithm, we also implement a multi-copySimBet for better comparison. For all the comparisons, weuse the same settings of number of hops and number of copies for all the algorithms, more particularly we showthe results of the 4-hop-4-copy case. The results are also valid for the other combinations of number of hops andnumber of copies in our simulations. As most of the traces have long experimental durations (i.e. in the order ofdays or even weeks), we average the results throughout the simulation period and ignore the transient period.
0
0.1
0.2
0.3
0.4
0.5
3 weeks1 w4 d2 d1 day6 h3 h1 hour10 min2 min
Del
iver
y su
cces
s ra
tio
Time TTL
BUBBLEPROPHET
SIMBET
0
2
4
6
8
10
12
14
3 weeks1 w4 d2 d1 day6 h3 h1 hour10 min2 min
Tot
al C
ost
Time TTL
BUBBLEPROPHET
SIMBET
Fig. 19. Comparisons of BUBBLE, PROPHET, and SimBet on Reality dataset
Figures 19 shows the comparison of the delivery ratio and delivery cost ofBUBBLE, PROPHETand SimBet forthe 4-hop-4-copy case.3 Here, for the delivery cost, we only count the number of copies created in the system foreach message as we have done before for the comparison with the “oblivious” algorithms. We do not count the
3. For one more perspective on the data, here we show the 4-hop-4-copy case instead of the unlimited case in Figure 17. The trend isvery similar for the other case.
19
control traffic created byPROPHETfor exchanging routing table during each encounter, which can be huge if thesystem is large (PROPHETuses flat addressing for each node and its routing table contains entry for each knownnode). We also do not count the message exchange inSimBet for updating the similarity and betweenness values.We can see that most of the time,BUBBLE achieves a similar delivery ratio toPROPHETand around10% betterthanSimBet, but with only half of the cost ofPROPHETand70% of the cost ofSimBet. Considering thatBUBBLEdoes not need to keep and update an routing table for each nodepairs, the performance achievement is significant.
PROPHETrelies on encountering history and transient delivery predictability to choose relays. This can efficientlyidentify the routing paths to the destinations, but the dynamic environment may result in many nodes having a lotof slightly fluctuation of probabilities. This results in moreredundant nodes being chosen as relays, which can bereflected from the delivery cost. Instead,BUBBLE use social information and hence filter out these noises due tothe temporal fluctuations of the network.SimBetcan successfully leverage social context, but it fails for identifyingthe sequence of using betweenness and similarity.BUBBLE explicitly identify centrality and community, and firstuse centrality metric to spread out the messages and then usecommunity metric to focus the messages to thedestinations. This approach effectively guarantee a high delivery ratio and a low delivery cost.
A remark here is that the centrality values used for theBUBBLE simulations in this section are calculatedin a centralised way, whilePROPHETand SimBet use mainly online estimation, but we will show that this canbe effectively approximated in a low-cost distributed manner in the next section. Overall, we evaluatedBUBBLEagainstWAIT , FLOOD, the optimisedMCP, LABEL , RANK, the benchmarkPROPHET, and SimBet. This providesus a reasonable variety of samples to illustrate the performance ofBUBBLE.
9 MAKING CENTRALITY PRACTICALFor practical applications, we want to look further into howBUBBLE can be implemented in a distributed way. Toachieve this, each device should be able to detect its own community and calculate its centrality values. In [23],we have proposed three algorithms, namedSIMPLE, K-CLIQUE and MODULARITY , for distributed communitydetection, and we have proved that detection accuracy can beup to 85% of the centralisedK-CLIQUE algorithm.The next step is to ask how can each node know its own centralityin a decentralised way, and how well pastcentrality can predict the future.
The final contribution of this paper is to provide answers to these two questions.
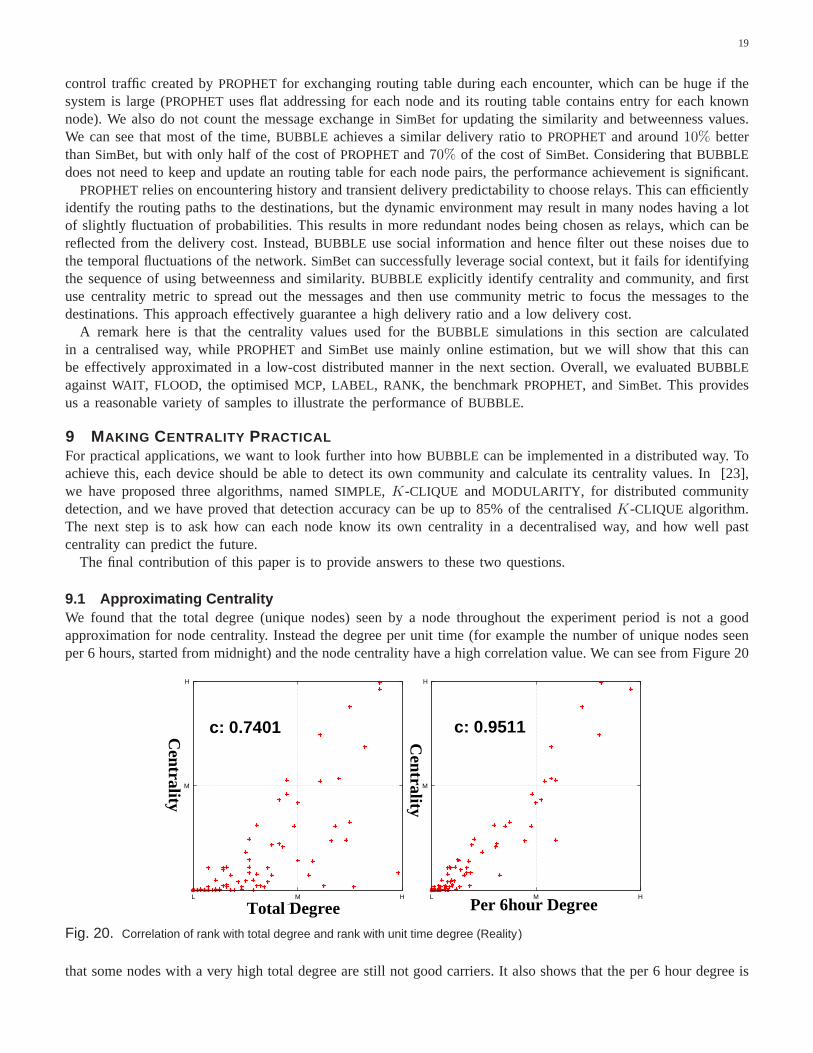
9.1 Approximating CentralityWe found that the total degree (unique nodes) seen by a node throughout the experiment period is not a goodapproximation for node centrality. Instead the degree per unit time (for example the number of unique nodes seenper 6 hours, started from midnight) and the node centrality have a high correlation value. We can see from Figure 20
H
M
HML
Ran
k
Degree
H
M
HML
Ran
k
DegreeTotal Degree Per 6hour Degree
Centrality
Centrality
c: 0.7401 c: 0.9511
Fig. 20. Correlation of rank with total degree and rank with unit time degree (Reality )
that some nodes with a very high total degree are still not good carriers. It also shows that the per 6 hour degree is
20
quite well correlated to the centrality value, with correlation coefficient as high as 0.9511. That means how manypeople you know does not matter too much, but how frequently you interact with these people does matter.
In order to verify that the average unit-time degree is as good as or close toRANK, we run another sets ofemulations using greedy average unit-time degree (or we simply call it DEGREE) instead of the pre-calculatedcentrality. We find thatRANK andDEGREEperform almost the same with the delivery and cost lines overlappingeach other. They not only have similar delivery but also similar cost.
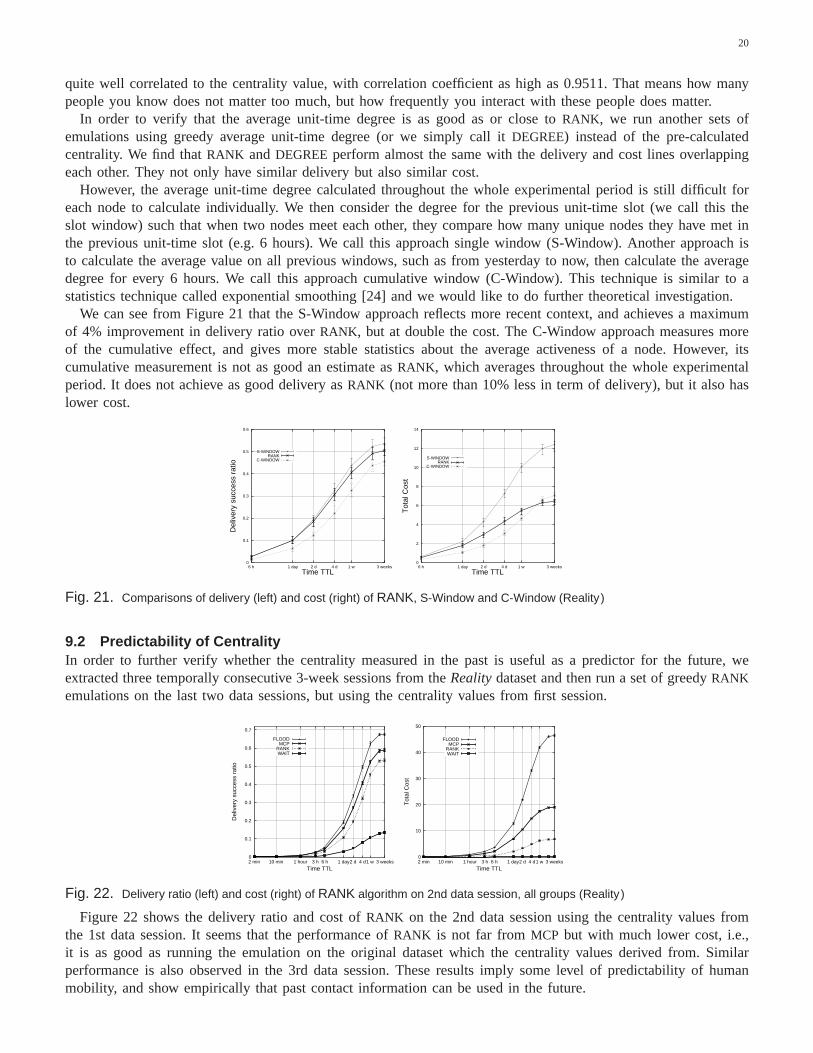
However, the average unit-time degree calculated throughout the whole experimental period is still difficult foreach node to calculate individually. We then consider the degree for the previous unit-time slot (we call this theslot window) such that when two nodes meet each other, they compare how many unique nodes they have met inthe previous unit-time slot (e.g. 6 hours). We call this approach single window (S-Window). Another approach isto calculate the average value on all previous windows, suchas from yesterday to now, then calculate the averagedegree for every 6 hours. We call this approach cumulative window (C-Window). This technique is similar to astatistics technique called exponential smoothing [24] and we would like to do further theoretical investigation.
We can see from Figure 21 that the S-Window approach reflects morerecent context, and achieves a maximumof 4% improvement in delivery ratio overRANK, but at double the cost. The C-Window approach measures moreof the cumulative effect, and gives more stable statistics about the average activeness of a node. However, itscumulative measurement is not as good an estimate asRANK, which averages throughout the whole experimentalperiod. It does not achieve as good delivery asRANK (not more than 10% less in term of delivery), but it also haslower cost.
0
0.1
0.2
0.3
0.4
0.5
0.6
3 weeks1 w4 d2 d1 day6 h
Del
iver
y su
cces
s ra
tio
Time TTL
S-WINDOWRANK
C-WINDOW
0
2
4
6
8
10
12
14
3 weeks1 w4 d2 d1 day6 h
Tot
al C
ost
Time TTL
S-WINDOWRANK
C-WINDOW
Fig. 21. Comparisons of delivery (left) and cost (right) of RANK, S-Window and C-Window (Reality )
9.2 Predictability of CentralityIn order to further verify whether the centrality measured in the past is useful as a predictor for the future, weextracted three temporally consecutive 3-week sessions from theReality dataset and then run a set of greedyRANKemulations on the last two data sessions, but using the centrality values from first session.
0
0.1
0.2
0.3
0.4
0.5
0.6
0.7
3 weeks1 w4 d2 d1 day6 h3 h1 hour10 min2 min
Del
iver
y su
cces
s ra
tio
Time TTL
FLOODMCP
RANKWAIT
0
10
20
30
40
50
3 weeks1 w4 d2 d1 day6 h3 h1 hour10 min2 min
Tot
al C
ost
Time TTL
FLOODMCP
RANKWAIT
Fig. 22. Delivery ratio (left) and cost (right) of RANK algorithm on 2nd data session, all groups (Reality )
Figure 22 shows the delivery ratio and cost ofRANK on the 2nd data session using the centrality values fromthe 1st data session. It seems that the performance ofRANK is not far fromMCP but with much lower cost, i.e.,it is as good as running the emulation on the original datasetwhich the centrality values derived from. Similarperformance is also observed in the 3rd data session. These results imply some level of predictability of humanmobility, and show empirically that past contact information can be used in the future.
21
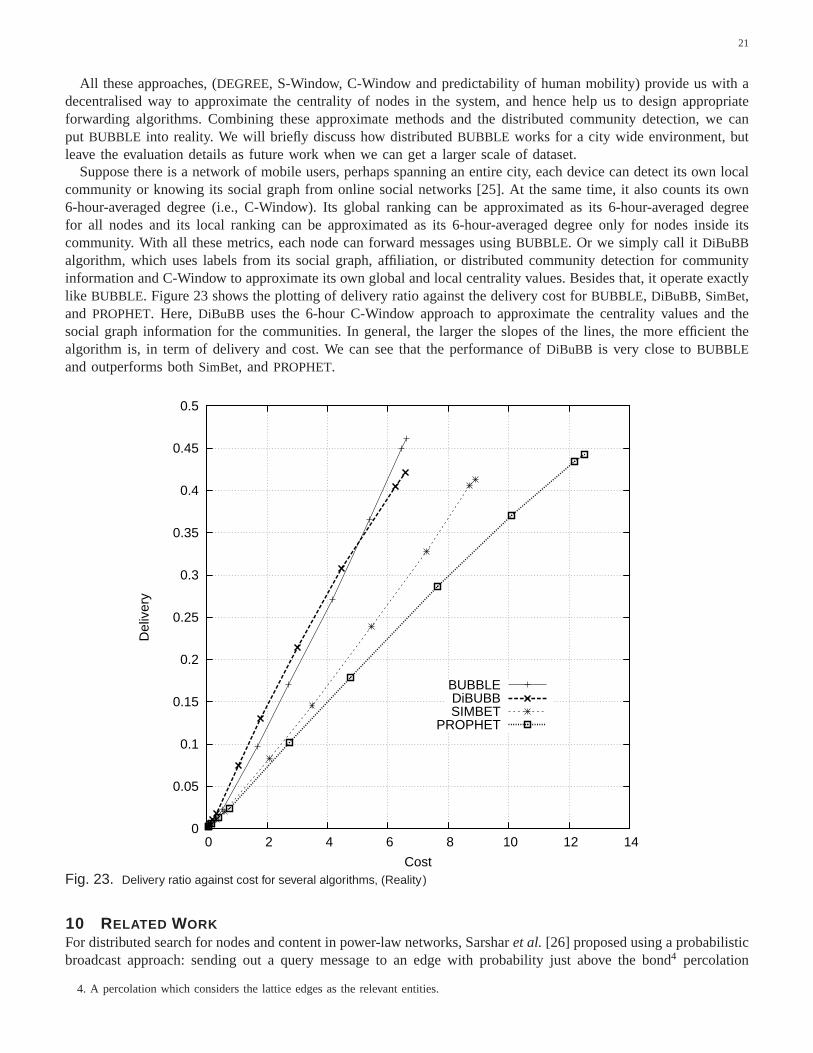
All these approaches, (DEGREE, S-Window, C-Window and predictability of human mobility) provide us with adecentralised way to approximate the centrality of nodes inthe system, and hence help us to design appropriateforwarding algorithms. Combining these approximate methods and the distributed community detection, we canput BUBBLE into reality. We will briefly discuss how distributedBUBBLE works for a city wide environment, butleave the evaluation details as future work when we can get a larger scale of dataset.
Suppose there is a network of mobile users, perhaps spanning an entire city, each device can detect its own localcommunity or knowing its social graph from online social networks [25]. At the same time, it also counts its own6-hour-averaged degree (i.e., C-Window). Its global ranking can be approximated as its 6-hour-averaged degreefor all nodes and its local ranking can be approximated as its6-hour-averaged degree only for nodes inside itscommunity. With all these metrics, each node can forward messages usingBUBBLE. Or we simply call itDiBuBBalgorithm, which uses labels from its social graph, affiliation, or distributed community detection for communityinformation and C-Window to approximate its own global and local centrality values. Besides that, it operate exactlylike BUBBLE. Figure 23 shows the plotting of delivery ratio against the delivery cost forBUBBLE, DiBuBB, SimBet,and PROPHET. Here, DiBuBB uses the 6-hour C-Window approach to approximate the centrality values and thesocial graph information for the communities. In general, the larger the slopes of the lines, the more efficient thealgorithm is, in term of delivery and cost. We can see that theperformance ofDiBuBB is very close toBUBBLEand outperforms bothSimBet, andPROPHET.
0
0.05
0.1
0.15
0.2
0.25
0.3
0.35
0.4
0.45
0.5
0 2 4 6 8 10 12 14
Del
iver
y
Cost
BUBBLEDiBUBBSIMBET
PROPHET
Fig. 23. Delivery ratio against cost for several algorithms, (Reality )
10 RELATED WORKFor distributed search for nodes and content in power-law networks, Sarsharet al. [26] proposed using a probabilisticbroadcast approach: sending out a query message to an edge with probability just above the bond4 percolation
4. A percolation which considers the lattice edges as the relevant entities.
22
threshold of the network. They show that if each node caches its directory via a short random walk, then the totalnumber of accessible contents exhibits a first-order phase transition, ensuring very high hit rates just above thepercolation threshold.
For routing and forwarding inDTNs and mobile ad hoc networks, there is much existing literature. Vahdatet al.proposed epidemic routing, which is similar to the “oblivious” flooding scheme we evaluated in this paper [27].Spray and Wait is another “oblivious” flooding scheme but with aself-limited number of copies [28]. Grossglauseret al. proposed the two-hop relay schemes to improve the capacity of dense ad hoc networks [29]. Many approachescalculate the probability of delivery to the destination node, where the metrics are derived from the history of nodecontacts, spatial information and so forth. The pattern-based Mobyspace Routing by Leguayet al. [30], location-based routing by Lebrunet al. [31], context-based forwarding by Musolesiet al. [32] andPROPHETRouting [5]fall into this category.PROPHETuses past encounters to predict the probability of future encounters. The transitivenature of encounters is exploited, where indirectly encountering the destination node is evaluated. Message Ferryby Zhaoet al. [33] takes a different approach by controlling the movementof each node.
Recent attempts to uncover a hidden stable network structure in DTNs such as social networks have beenemerged. For example, SimBet Routing [10] uses ego-centric centrality and its social similarity. Messages areforwarded towards the node with higher centrality to increase the possibility of finding the potential carrier tothe final destination.LABEL forwarding [20] uses affiliation information to help forwarding in PSNs based onthe simple intuition that people belonging to the same community are likely to meet frequently, and thus actas suitable forwarders for messages destined for members ofthe same community. We have comparedBUBBLEwith LABEL and SimBet in this paper, and demostrate that by the exploitation of both community and centralityinformation,BUBBLE provide further improvement in forwarding efficiency. The mobility-assisted Island Hoppingforwarding [34] uses network partitions that arise due to the distribution of nodes in space. Their clustering approachis based on the significant locations for the nodes and not for clustering nodes themselves. Clustering nodes is acomplex task to understand the network structure for aid of forwarding.
Finally, we emphasise that we take an experimental rather than theoretical approach, which contrasts with otherwork described above.
11 CONCLUSIONWe have shown that it is possible to uncover important characteristic properties of social network from a diverseset of real world human contact traces. We have demonstratedthat community and centrality social metrics canbe effectively used in forwarding decisions. OurBUBBLE algorithm is designed for a delay tolerant networkenvironment, built out of human-carried devices, and we have shown that it has similar delivery ratio to, but muchlower resource utilisation than flooding, control flooding,PROPHET, andSimBet.
BUBBLE is designed to work better with a hierarchical community structure. The limitation imposed by thesize of the datasets (each experiment is not large enough forus to extract hierarchical structure) does not allowus to optimally evaluate it. The current evaluation on a flat community structure did still provide us satisfactoryperformance improvement. We will further verify our results when more mobility traces are available. Syntheticmobility models can also be useful for further evaluating the algorithm, but currently there is no benchmark models.Another aspect we want to look using our mobility traces is tocompare them with the available mobility modelsand find out the one which can represent most of real mobility scenarios. We believe that this approach representsan early step in combining rich multi-level information of social structures and interactions to drive novel andeffective means for disseminating data in DTNs. A great deal of future research can follow.
ACKNOWLEDGMENTS
This research is funded in part by the SOCIALNETS project, 217141. We would like also to acknowledge comments fromSteven Hand, Brad Karp, Frank Kelly, Richard Mortier, Pietro Lio, Andrew Moore, Nishanth Sastry, Derek Murray, Sid Chau,Andrea Passarella, Hamed Haddadi, and Georgios Smaragdakis, and SimBet source codes from Thrasyvoulos Spyropoulos.
REFERENCES
[1] P. Hui, A. Chaintreau, J. Scott, R. Gass, J. Crowcroft, and C. Diot,“Pocket switched networks and human mobility in conferenceenvironments,” inProc. WDTN, 2005.
[2] K. Fall, “A delay-tolerant network architecture for challenged internets,” in Proc. SIGCOMM, 2003.
23
[3] D. Kempe, J. Kleinberg, and A. Kumar, “Connectivity and inference problems for temporal networks,”J. Comput. Syst. Sci., vol. 64,no. 4, pp. 820–842, 2002.
[4] E. P. C. Jones, L. Li, and P. A. S. Ward, “Practical routing in delay-tolerant networks,” inProc. WDTN, 2005.[5] A.Lindgren, A.Doria, and O.Schelen, “Probabilistic routing in intermittently connected networks,” inProc. SAPIR, 2004.[6] S. Okasha, “Altruism, group selection and correlated interaction,”British Journal for the Philosophy of Science, vol. 56, no. 4, pp.
703–725, December 2005.[7] M. E. J. Newman, “Detecting community structure in networks,”Eur. Phys. J. B, vol. 38, pp. 321–330, 2004.[8] L. Danon, J. Duch, A. Diaz-Guilera, and A. Arenas, “Comparingcommunity structure identification,”J. Stat. Mech., p. P09008, Oct
2005.[9] L. C. Freeman, “A set of measuring centrality based on betweenness,” Sociometry, vol. 40, pp. 35–41, 1977.[10] E. Daly and M. Haahr, “Social network analysis for routing in disconnected delay-tolerant manets,” inProceedings of ACM MobiHoc,
2007.[11] N. Eagle and A. Pentland, “Reality mining: sensing complex social systems,”Personal and Ubiquitous Computing, vol. V10, no. 4,
pp. 255–268, May 2006.[12] A. Chaintreau, P. Hui, J. Crowcroft, C. Diot, R. Gass, and J. Scott, “Impact of human mobility on the design of opportunistic forwarding
algorithms,” inProc. INFOCOM, April 2006.[13] T. Karagiannis, J.-Y. Le Boudec, and M. Vojnovic, “Power law and exponential decay of inter contact times between mobiledevices,”
in ACM MobiCom ’07, 2007.[14] J. Leguay, A. Lindgren, J. Scott, T. Friedman, and J. Crowcroft, “Opportunistic content distribution in an urban setting,” inACM
CHANTS, 2006, pp. 205–212.[15] G. Palla, I. Derenyi, I. Farkas, and T. Vicsek, “Uncovering the overlapping community structure of complex networks in nature and
society,” Nature, vol. 435, no. 7043, pp. 814–818, 2005. [Online]. Available: http://dx.doi.org/10.1038/nature03607[16] M. E. J. Newman, “Analysis of weighted networks,”Physical Review E, vol. 70, p. 056131, 2004.[17] P. Hui and J. Crowcroft, “Human mobility models and opportunistic communications system design,”Philosophical Transactions of
the Royal Society A: Mathematical, Physical and Engineering Sciences, vol. 366, no. 1872, pp. 2005–2016, June 2008.[18] P. Hui, J. Crowcroft, and E. Yoneki, “Bubble rap: Social-basedforwarding in delay tolerant networks,” inMobiHoc ’08: Proceedings
of the 9th ACM international symposium on Mobile ad hoc networking & computing, May 2008.[19] M. E. J. Newman and M. Girvan, “Finding and evaluating community structure in networks,”Physical Review E, vol. 69, February
2004. [Online]. Available: http://arxiv.org/abs/cond-mat/0308217[20] P. Hui and J. Crowcroft, “How small labels create big improvements,” in Proc. IEEE ICMAN, March 2007.[21] L. A. Adamic, B. A. Huberman, R. M. Lukose, and A. R. Puniyani, “Search in power law networks,”Physical Review E, vol. 64, pp.
46 135–46 143, October 2001.[22] A. Trusina, S. Maslov, P. Minnhagen, and K. Sneppen, “Hierarchy measures in complex networks,”Physical Review Letters, vol. 92,
p. 178702, 2004. [Online]. Available: doi:10.1103/PhysRevLett.92.178702[23] P. Hui, E. Yoneki, S.-Y. Chan, and J. Crowcroft, “Distributed community detection in delay tolerant networks,” inSigcomm Workshop
MobiArch ’07, August 2007.[24] P. Winters, “Forecasting sales by exponentially weighted moving averages,”Management Science, vol. 6, pp. 324–342, 1960.[25] P. Hui and N. Sastry, “Real world routing using virtual world information,” inCSE ’09: Proceedings of the 2009 International Conference
on Computational Science and Engineering. Washington, DC, USA: IEEE Computer Society, 2009, pp. 1103–1108.[26] N. Sarsharet al., “Scalable percolation search in power law networks,” June 2004. [Online]. Available: http://arxiv.org/abs/cond-mat/
0406152[27] A. Vahdat and D. Becker, “Epidemic routing for partially connected ad hoc networks,” Duke University, Tech. Rep. CS-200006, April
2000.[28] T. Spyropoulos, K. Psounis, and C. Raghavendra, “Spray and wait: An efficient routing scheme for intermittently connected mobile
networks,” inProc. WDTN, 2005.[29] M. Grossglauser and D. Tse, “Mobility increases the capacity of ad-hoc wireless networks,”IEEE/ACM Trans. on Networking, vol. 10,
pp. 477–486, 2002.[30] J. Leguay, T. Friedman, and V. Conan, “Evaluating mobility patternspace routing for DTNs,” inProc. INFOCOM, 2006.[31] J. Lebrun, C.-N. Chuah, D. Ghosal, and M. Zhang, “Knowledge-based opportunistic forwarding in vehicular wireless ad hoc networks,”
IEEE VTC, vol. 4, pp. 2289–2293, 2005.[32] M. Musolesi, S. Hailes,et al., “Adaptive routing for intermittently connected mobile ad hoc networks,” inProc. WOWMOM, 2005.[33] W. Zhao, M. Ammar, and E. Zegura, “A message ferrying approach for data delivery in sparse mobile ad hoc networks,” inProceedings
of the MobiCom 2004, 2004.[34] M. P. N. Sarafijanovic-Djukic and M. Grossglauser, “Island hopping: Efficient mobility-assisted forwarding in partitioned networks,”
in IEEE SECON, 2006.