bubble-based emms mixture model applied to turbulent...
TRANSCRIPT

This is a repository copy of Bubble-based EMMS mixture model applied to turbulent fluidization Powder Technology.
White Rose Research Online URL for this paper:http://eprints.whiterose.ac.uk/86351/
Version: Accepted Version
Article:
Ullah, A., Hong, K., Wang, W. et al. (2 more authors) (2015) Bubble-based EMMS mixture model applied to turbulent fluidization Powder Technology. Powder Technology, 281. pp. 129-137. ISSN 1873-328X
https://doi.org/10.1016/j.powtec.2015.03.016
[email protected]://eprints.whiterose.ac.uk/
Reuse
Unless indicated otherwise, fulltext items are protected by copyright with all rights reserved. The copyright exception in section 29 of the Copyright, Designs and Patents Act 1988 allows the making of a single copy solely for the purpose of non-commercial research or private study within the limits of fair dealing. The publisher or other rights-holder may allow further reproduction and re-use of this version - refer to the White Rose Research Online record for this item. Where records identify the publisher as the copyright holder, users can verify any specific terms of use on the publisher’s website.
Takedown
If you consider content in White Rose Research Online to be in breach of UK law, please notify us by emailing [email protected] including the URL of the record and the reason for the withdrawal request.
1
Bubble-based EMMS mixture model applied to turbulent fluidization
Atta Ullaha,*, Kun Hong b, Wei Wangc, Stephen Chiltond, William Nimmoe aDepartment of Chemical Engineering, Pakistan Institute of Engineering and Applied Sciences,
45650, Pakistan bCollege of Life Science and Chemical Engineering, Huaiyin Institute of Technology, Huaian,
223003, China
cInstitute of Process Engineering, Chinese Academy of Sciences, Beijing, 100190, China dEnergy Research Institute, University of Leeds, Leeds LS2 9JT, UK eDept of Mechanical Engineering, The University of Sheffield, Sheffield, S10 2TN * Corresponding author. Tel.: +92 (51) 1111 74327; E-mail address: [email protected]
Abstract
Turbulent fluidization is now widely recognized as a distinct flow regime and is commonly
utilized in industrial fluidized-bed reactors. However, relatively fewer attempts have been made to
rigorously model these systems in comparison to bubbling and circulating fluidized beds. In this
work, we have rewritten the original bubble based EMMS model in form of a mixture to apply it to
turbulent fluidization. At microscale this mixture is composed of gas and particles whereas voids
and gas-particle suspension make up this mixture at mesoscale level. Subsequently, all the system
properties are then calculated in terms of mixture rather than individual phases. With the
minimization of the objective function for the bubbling mixture, the set of equations is then solved
numerically. The objective function, used to close the system of equations, is composed of the
energy consumption rates required to suspend gas-particle suspension and the energy consumed
due to interaction between suspension and voids. The model is then applied to simulate gas-solid
turbulent fluidized beds. Simulation results are encouraging as the model is able to predict the
dense bottom and dilute top zones along the height of the bed. Comparison of results with
experimental data and homogeneous drag model has been made for validation purposes.
Keywords: Turbulent fluidization; Mesoscale; Bubble; EMMS; Mixture; CFD; Modeling
1. Introduction Gas-solid flows display heterogeneity over a wide range of spatial and temporal scales
covering regimes from bubbling to pneumatic transport. Matheson et. al. [1] were the first ones to
show photographs of turbulent fluidization, which were significantly different from bubbling
fluidization [2]. However, turbulent fluidization has only been widely recognized as a distinct flow
regime for the past couple of decades, occurring between the bubbling and the high velocity
fluidization regimes [3]. Extensive details about the identification and characterization of the
turbulent fluidization regime can be found in published literature such as the work by Martin
Rhodes [4] and John Grace [5].
Turbulent fluidization is widely used due to its vigorous gas–solids mixing, favorable
bed-to-surface heat transfer, high solids hold-ups (typically 25–35% by volume), and limited axial
mixing of gas [2]. It is considered to be a transition from the bubbling to the transport regime
which occurs due to a change in the mechanism of bubble formation and breakage. Moving from
bubbling to turbulent fluidization, the hydrodynamics of the bed change from a regime of bubble
2
formation and coalescence dominant mechanism to a regime with breaking and gradual
disappearance of the large bubbles [6]. In turbulent beds, a sigmoidal profile for the solids hold-up
is generally observed. Therefore, turbulent fluidized bed is characterized by two different
coexisting regions: a lower region where solids are the continuous phase and gas the dispersed
phase and an upper region, where gas is the continuous phase and solids are dispersed [7].
Two major approaches have been followed in attempts to apply CFD modeling to gas-solid
fluidized beds: Eulerian two-fluid models and Euler/Lagrangian models [8]. Euler/Lagrangian
method is generally limited due to the number of solid particles it can handle. Therefore, the
Eulerian modeling has become a preferred choice for simulation of large macroscopic systems. In
this approach, the gas and solid phases are assumed to be fully interpenetrating continua [9]. This
methodology has been adopted widely by several investigators to model turbulent fluidized beds
[10-14]. This approach requires either fine-grid resolution of the flows or modification of
simulation parameters to incorporate sub-grid structures [15-19]. Although there has been some
progress towards accurate resolution of the sub-grid scale structures but to date no unified
approach exists. In fact, some studies have reported that the Eulerian two-fluid models with the
homogeneous drag model fails to capturing typical features of gas-solid flows even with high
resolutions [14, 20]. Under such circumstances, the Eulerian two-fluid model may not be able to
correctly reflect the effects of these sub-grid structures. Thus it may be difficult to reproduce the
multi-scale nature of such heterogeneous flows unless their effects are considered in the
constitutive closure laws governing these flows.
To consider the effects of these mesoscale structures, a practical approach is to modify the
homogeneous correlation based drag coefficients and stresses etc. with structure-based entities in
addition to the resolved parts of two-fluid simulations. In this context, in recent years there has
been significant improvement. Some authors [21-23] have used empirical correlations or
equivalent cluster diameters to modify the homogeneous drag force. Others have considered
heterogeneity by modifying the drag coefficient through the cluster-based EMMS
(energy-minimization multi-scale) approach [24-26]. Recently there has been attempt to model the
bubbling bed heterogeneity by following the EMMS principle [27]. This bubble-based EMMS
model has also been applied to simulate riser flow [28]. Although progress has been made, but a
unified model is still far from available.
While many efforts have been dedicated to model and simulate bubbling and transport type
systems such as risers of CFBs, turbulent fluidization has received relatively less attention in
terms of modeling and simulation. An attempt by using the four zoned drag model approach to
simulate turbulent fluidized bed has been made recently [11, 29]. Adopting a similar multi-zoned
drag model, Gao et al. [13] simulated their turbulent fluidized bed in fair agreement with their
experimental data. In another recent attempt, Hong et al. [30] extended the work of bubble based
EMMS model of Shi et al. [27] by coupling the structure-dependent multi-fluid model (SFM) to
model heterogeneous gas-solid flows including turbulent fluidization. These attempts reflect the
interest of modellers in correct prediction of hydrodynamics of turbulent fluidized beds where the
outlet solids flux is negligible.
The theme of current work is the fact that the drag force and stresses in uniform gas-solid
systems are significantly different from the real systems due to the existence of heterogeneous
structures. These structures can be in the form of bubbles and/or clusters, depending upon the
operating conditions. In this current work on turbulent fluidized bed modeling, we have followed
3
this structure dependent drag model approach by considering the system to be in the form of a
mixture at both micro and mesoscale level. This model may be considered as an alternate
representation of earlier work of Shi et al. [27] from our group. Details of the model formulations
are presented in the next section. Then some discussion about the model results is made. Finally
the modified drag from mixture formulation is used to simulate turbulent fluidized bed and the
results are validated against available experimental data.
2. Mathematical formulation of bubble-based EMMS mixture model In the terminology of structure dependent multi-fluid model of Hong et al. [18], the system
can be decomposed into four components i.e. dilute-phase gas, dilute-phase solid, dense-phase gas
and dense-phase solid. Here we consider two mixtures existing simultaneously i.e. “gas & particles” at microscale known as the “dense phase” and “dense phase & void phase” at mesoscale where the void phase is assumed to be free of particles.
Following the same approach as previously for the development of EMMS models, a
complete set of balance equations can be written at micro, meso and macro scales. For simplicity,
we have summarized all the relevant definitions and parameters in appendix Table A.1. In the
development of this model, only the vertical scalar components have been used. As a first
approximation, inertial and interphase exchange terms were neglected and the bubbles/voids are
considered to be completely free of solid particles. After obtaining the final form of drag force
correlations, all the inertial effects were lumped into a single acceleration term. Furthermore, there
is no net solids flux out of the column. Effectively, there are two dominant forces at play i.e. drag
due to gas in particles inside dense phase and drag due to existence of mesoscale bubbles in the
dense emulsion phase. Following set of equations can be written for such a system.
o Gas mass balance: mass flow rate of the gas phase across any cross-section of the bed is
equal to the sum of the gas flow rate through dense and dilute phases individually.
g gc gfU = fU + 1-f U (1)
o Mean bed voidage: the mean voidage of the bed can be obtained from the dense and
dilute phases as
g gc gfi = fi + 1-f i (2)
Where the voidage of dilute phase, igf, has been assumed 1 in current formulation.
o Force balance for solid particle in the dense phase: Using equations for individual
phases presented in Wang and Li [25] and following the approach for mixture modelling
[31], we have the drag force for dense phase as
0
22.7 2
, ,3
(1 ) ( )( )
2 4 (1 )6
gc f p mc mi mc c d c gc slip c
p
f d f a gm F C U
d f
(3)
o Force balance for mesoscale bubbles in unit control volume: the drag force of the
emulsion-like dense phase exerted on bubbles is equal to the effective buoyancy of
bubbles in unit control volume.
0
24.7 2
, ,3
1(1 )( )( )
2 46
mc bi i d i slip i mi f mb
b
dfm F C f U f a g
d
(4)
4
Where db is the characteristic diameter of the bubble/void calculated from a suitable closure.
o Pressure drop balance between the dense and void phases: the gas flowing in the
bubbles/voids will have to support the dense-phase particles. The resultant pressure drop
equality yields
i i c cmF =(1-f)m F (5)
Thus
i mc mic c
m F -f(と -と )gm F = =
(1-f) (1-f)i (6)
It is now easy to lump all the inertial terms into a single variable and add to the steady
system. Thus with respective accelerations, we have
i i mc mi mimF= f(と -と )(a -g) (7)
mc mi mcc c
f(と -と )(a -g)m F =
(1-f) (8)
Furthermore, due to equal pressure drop relation, inertial terms can be simplified as
mc mi ma =a =a (9)
The last expression signifies a fact that under the current model setup, both the micro and
mesoscales move with same acceleration.
o Bubble diameter: We have followed the correlation of Horio and Nonaka’s [32] for the
prediction of bubble characteristics of fluidized bed. Hence, the bubble diameter can be
calculated with the expressions stated below.
20.52 4 /
4
M M bm t t
b
d D Dd
(10)
Where 0.42-2
0.2
( )2.56x10 2.59= ,
4g gc tt
M bmgc
U U DDd
U g g
o Stability criterion:
st mix TN N , min (11)
Where Nst,mix can be reformulated as,
1g
1 1mc mi
st mix fc b fbg s
fN fU f U
f
,
( )( ) ( )
(12)
Where we follow the definition of fb from Shi et al. [27], which is given as
5
1
(1 )bgc
ff
f f
and
p f fT
p
(と -と )U gN
と
With the given operating conditions (Ug) and the mean bed voidage (ig), above stated set of
equations along with the stability criterion can be solved to obtain seven structural
parameters (db, f, igc, Ugf, Ugc, Usc, am). The solution scheme is essentially the same as in
Wang and Li [25]. Once the system of equations has been solved for any voidage satisfying
the stability criterion, the drag coefficient is then calculated as
2 2g g mc mi
d mi g mslip slip
i i f(と -と )く= F = +(1-f)(と -と ) (a -g)U U 1-f
(13)
For comparison, the standard drag coefficient for homogeneous dispersions i.e. Wen-Yu is
calculated as in Wang and Li [25]. Then heterogeneity index, Hd, is calculated as
dWY
H
(14)
Where くWY is Wen and Yu [33] correlation with
2 70
3
4.u ug s
WY d g g s gp
Cd
(15)
3. CFD simulation of turbulent fluidized bed with the EMMS drag Two dimensional CFD simulation of the turbulent fluidized bed (TFB) of Venderbosch [6]
has already been carried out by using a similar model with Eulerian multiphase flow modeling
approach available in ANSYS Fluent®. The results of that study are presented in our recent article
in proceedings of CFB-11 [34]. Current study is to extend previous approach, test and validate the
model developed here. In what follows, we have used Group-B particles (Geldart’s classification) to test the grid independence and find the appropriate boundary conditions for the solid phase. The
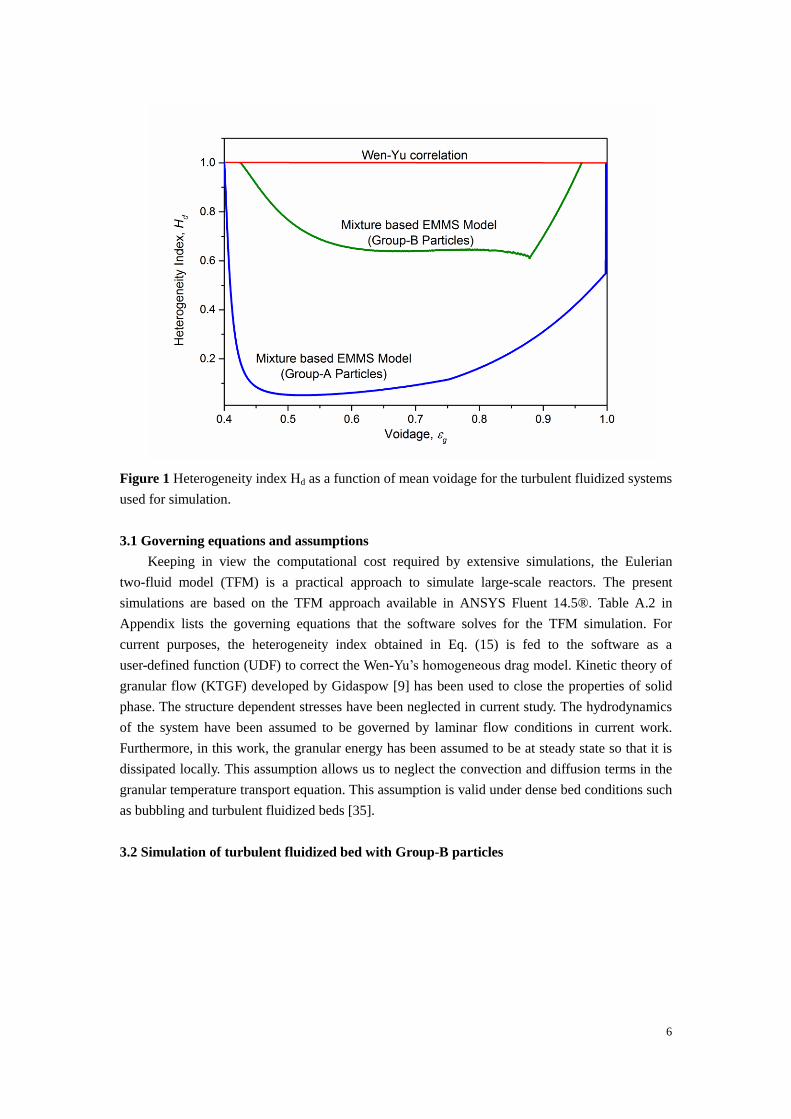
findings are then used to model a turbulent fluidized bed of Group-A particles. The heterogeneity
indexes obtained from the solution of above mentioned EMMS model are shown in Fig. 1 and
have been used in the current study. It is to be pointed out here that the particles with lower
Archimedes number require major drag correction as compared to those with higher Archimedes
number. This trend can also be observed in the work of Hong et al. [18] where three different
types of particle systems were simulated. Although the EMMS model used there was based on
cluster description of heterogeneous structures. This variation of drag correction based on particle
characteristics can be a potential area of research.
6
Figure 1 Heterogeneity index Hd as a function of mean voidage for the turbulent fluidized systems
used for simulation.
3.1 Governing equations and assumptions
Keeping in view the computational cost required by extensive simulations, the Eulerian
two-fluid model (TFM) is a practical approach to simulate large-scale reactors. The present
simulations are based on the TFM approach available in ANSYS Fluent 14.5®. Table A.2 in
Appendix lists the governing equations that the software solves for the TFM simulation. For
current purposes, the heterogeneity index obtained in Eq. (15) is fed to the software as a
user-defined function (UDF) to correct the Wen-Yu’s homogeneous drag model. Kinetic theory of
granular flow (KTGF) developed by Gidaspow [9] has been used to close the properties of solid
phase. The structure dependent stresses have been neglected in current study. The hydrodynamics
of the system have been assumed to be governed by laminar flow conditions in current work.
Furthermore, in this work, the granular energy has been assumed to be at steady state so that it is
dissipated locally. This assumption allows us to neglect the convection and diffusion terms in the
granular temperature transport equation. This assumption is valid under dense bed conditions such
as bubbling and turbulent fluidized beds [35].
3.2 Simulation of turbulent fluidized bed with Group-B particles
7
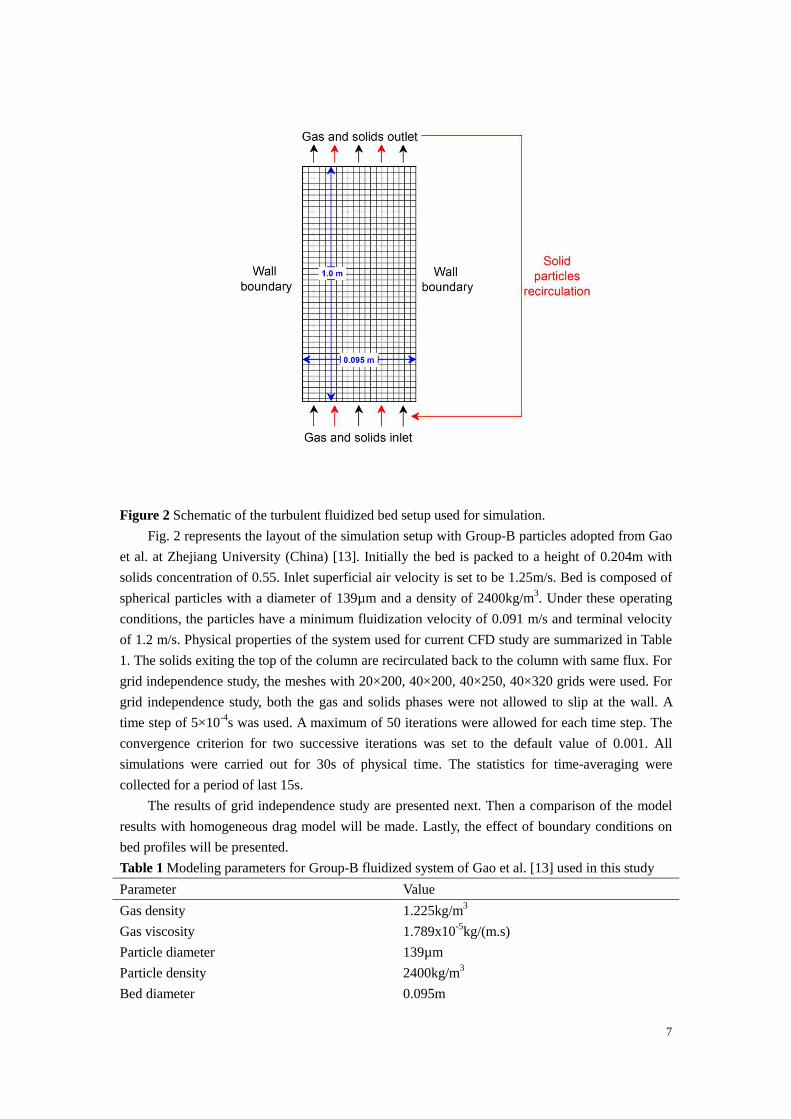
Figure 2 Schematic of the turbulent fluidized bed setup used for simulation.
Fig. 2 represents the layout of the simulation setup with Group-B particles adopted from Gao
et al. at Zhejiang University (China) [13]. Initially the bed is packed to a height of 0.204m with
solids concentration of 0.55. Inlet superficial air velocity is set to be 1.25m/s. Bed is composed of
spherical particles with a diameter of 139µm and a density of 2400kg/m3. Under these operating
conditions, the particles have a minimum fluidization velocity of 0.091 m/s and terminal velocity
of 1.2 m/s. Physical properties of the system used for current CFD study are summarized in Table
1. The solids exiting the top of the column are recirculated back to the column with same flux. For
grid independence study, the meshes with 20×200, 40×200, 40×250, 40×320 grids were used. For
grid independence study, both the gas and solids phases were not allowed to slip at the wall. A
time step of 5×10⁻⁴s was used. A maximum of 50 iterations were allowed for each time step. The
convergence criterion for two successive iterations was set to the default value of 0.001. All
simulations were carried out for 30s of physical time. The statistics for time-averaging were
collected for a period of last 15s.
The results of grid independence study are presented next. Then a comparison of the model
results with homogeneous drag model will be made. Lastly, the effect of boundary conditions on
bed profiles will be presented.
Table 1 Modeling parameters for Group-B fluidized system of Gao et al. [13] used in this study
Parameter Value
Gas density 1.225kg/m3
Gas viscosity 1.789x10⁻⁵kg/(m.s)
Particle diameter 139µm
Particle density 2400kg/m3
Bed diameter 0.095m
8
Bed height 1 m
Initial bed height 0.204m
Inlet gas velocity 1.25m/s
Inlet boundary condition Velocity inlet
Outlet boundary condition Atmospheric pressure
Wall boundary condition for gas phase No slip
Wall boundary condition for solid phase No slip and partial slip
Maximum packing limit 0.63
Restitution coefficient 0.9
Time step 0.0005s
Convergence criterion 0.001
3.2.1 Grid independence
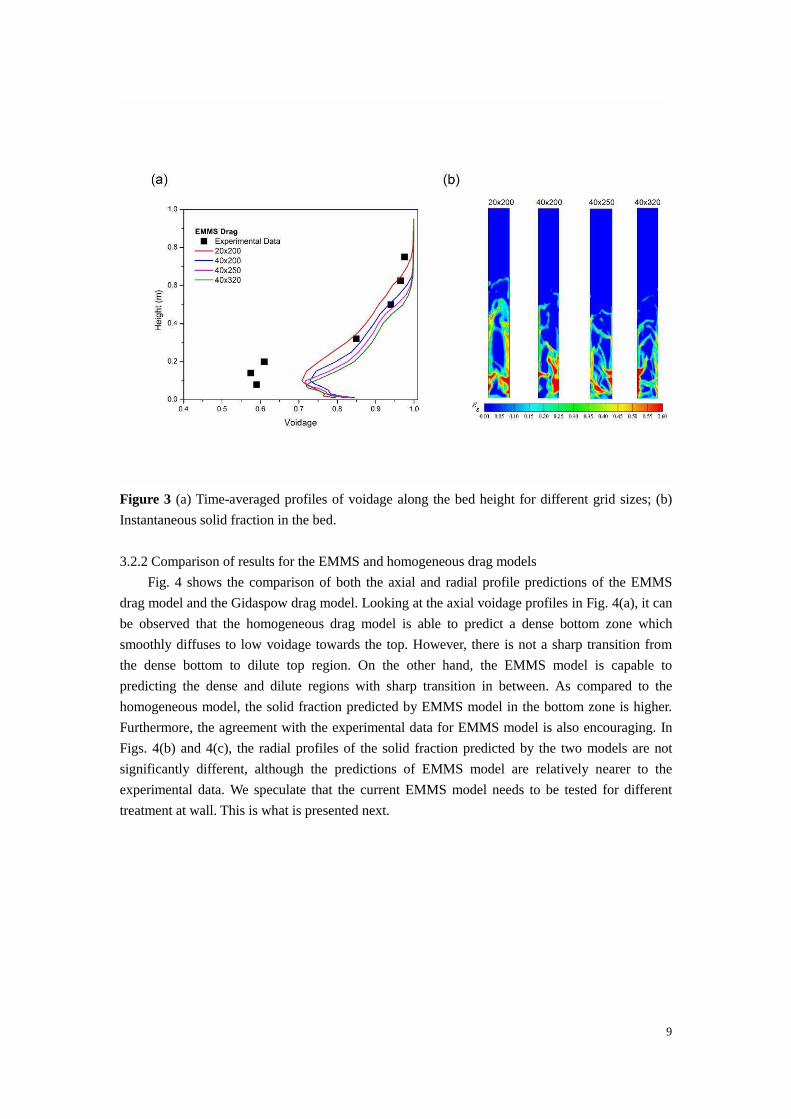
Fig. 3(a) shows the axial voidage profiles for the four grids used in the current grid
independence study. All the grids are able to predict the dense bottom and dilute top region, which
shows that the current drag model is capable of predicting correct qualitative trend. A close looks
shows that the difference between the two fine grids i.e. 40×250 and 40×320 is not significant.
Therefore, for further simulation purposes the grid resolution of 40×250 was chosen which
corresponds to 17 particle-diameters laterally and about 28 particle-diameters axially. These
results are encouraging as it is generally accepted that for grid-independence of gas-solid flows
grid size should be around 10-particle-diameters [36]. Such a fine mesh for large reactors will
require much larger computational power. Fig. 3(b) shows instantaneous snapshots of solids
concentration in the bed. It can be observed that with the grid refinement, the overall height of the
bottom dense region decreases and it becomes denser.
9
Figure 3 (a) Time-averaged profiles of voidage along the bed height for different grid sizes; (b)
Instantaneous solid fraction in the bed.
3.2.2 Comparison of results for the EMMS and homogeneous drag models
Fig. 4 shows the comparison of both the axial and radial profile predictions of the EMMS
drag model and the Gidaspow drag model. Looking at the axial voidage profiles in Fig. 4(a), it can
be observed that the homogeneous drag model is able to predict a dense bottom zone which
smoothly diffuses to low voidage towards the top. However, there is not a sharp transition from
the dense bottom to dilute top region. On the other hand, the EMMS model is capable to
predicting the dense and dilute regions with sharp transition in between. As compared to the
homogeneous model, the solid fraction predicted by EMMS model in the bottom zone is higher.
Furthermore, the agreement with the experimental data for EMMS model is also encouraging. In
Figs. 4(b) and 4(c), the radial profiles of the solid fraction predicted by the two models are not
significantly different, although the predictions of EMMS model are relatively nearer to the
experimental data. We speculate that the current EMMS model needs to be tested for different
treatment at wall. This is what is presented next.

10
Figure 4 Comparison of results for EMMS drag model with Gidaspow drag model: (a)
Time-averaged axial voidage profile; (b) Time-averaged radial solid fraction profiles at a height of
0.198m; (c) Time-averaged radial solid fraction profiles at a height of 0.138m.
3.2.3 Effect of wall boundary condition
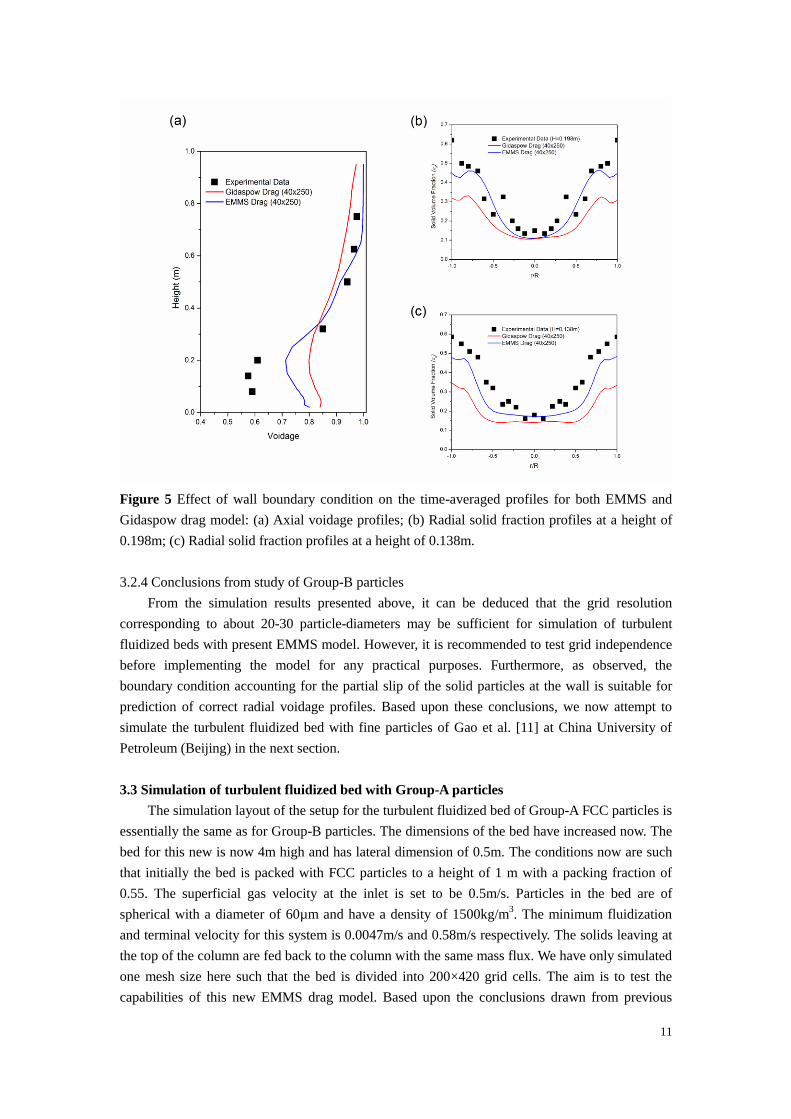
In this section, we present a comparison of the axial and radial profiles of the bed
voidage/solid fraction. The modified boundary condition was set for partial slip of solid particles
at the wall. To achieve this, a specularity coefficient of 0.0001 was specified as recommended in
published literature [37]. It can be seen from the results presented in Fig. 5 that this partial slip
boundary condition allows for better prediction of the height of bottom dense phase. It is to be
expected as with partial slip more solids are allowed to move up the column. Furthermore, the
predictions of the EMMS model’s radial profiles for both the heights of 0.138m and 0.198m are in
very good agreement with the experimental data. The Gidaspow drag model, however, is not able
to accurately predict the dilute core-annulus type behavior
11
Figure 5 Effect of wall boundary condition on the time-averaged profiles for both EMMS and
Gidaspow drag model: (a) Axial voidage profiles; (b) Radial solid fraction profiles at a height of
0.198m; (c) Radial solid fraction profiles at a height of 0.138m.
3.2.4 Conclusions from study of Group-B particles
From the simulation results presented above, it can be deduced that the grid resolution
corresponding to about 20-30 particle-diameters may be sufficient for simulation of turbulent
fluidized beds with present EMMS model. However, it is recommended to test grid independence
before implementing the model for any practical purposes. Furthermore, as observed, the
boundary condition accounting for the partial slip of the solid particles at the wall is suitable for
prediction of correct radial voidage profiles. Based upon these conclusions, we now attempt to
simulate the turbulent fluidized bed with fine particles of Gao et al. [11] at China University of
Petroleum (Beijing) in the next section.
3.3 Simulation of turbulent fluidized bed with Group-A particles
The simulation layout of the setup for the turbulent fluidized bed of Group-A FCC particles is
essentially the same as for Group-B particles. The dimensions of the bed have increased now. The
bed for this new is now 4m high and has lateral dimension of 0.5m. The conditions now are such
that initially the bed is packed with FCC particles to a height of 1 m with a packing fraction of
0.55. The superficial gas velocity at the inlet is set to be 0.5m/s. Particles in the bed are of
spherical with a diameter of 60µm and have a density of 1500kg/m3. The minimum fluidization
and terminal velocity for this system is 0.0047m/s and 0.58m/s respectively. The solids leaving at
the top of the column are fed back to the column with the same mass flux. We have only simulated
one mesh size here such that the bed is divided into 200×420 grid cells. The aim is to test the
capabilities of this new EMMS drag model. Based upon the conclusions drawn from previous

12
section, the gas was not allowed to slip at wall while partial slip with specularity coefficient of
0.0001 was implemented for solid particles. Transient simulation was carried out with a time step
of 5×10⁻⁴s. A maximum of 50 iterations were allowed for each time step. The convergence
criterion for two successive iterations was set to the default value of 0.001. All simulations were
carried out for 30s of physical time. The statistical time-averaging data was collected for a period
of the last 10s. Summary of simulation parameters is given in Table 2.
Table 2 Modeling parameters for Group-A fluidized system of Gao et al. [11] used for study
Parameter Value
Gas density 1.225kg/m3
Gas viscosity 1.789x10⁻⁵kg/(m.s)
Particle diameter 60µm
Particle density 2400kg/m3
Bed diameter 0.5m
Bed height 4m
Initial bed height 1m
Inlet gas velocity 0.5m/s
Inlet boundary condition Velocity inlet
Outlet boundary condition Atmospheric pressure
Wall boundary condition for gas phase No slip
Wall boundary condition for solid phase Partial slip (specularity coefficient = 0.0001)
Maximum packing limit 0.63
Restitution coefficient 0.9
Time step 0.0005s
Convergence criterion 0.001
13
Figure 6 Simulation results of turbulent fluidized bed with Group-A particles using EMMS drag
model: (a) Snapshot of instantaneous solid fraction in the bed; (b) Axial voidage profile; (c) Time
averaged snapshot of solid fraction in the bed.
The results of Fig. 6 indicate that qualitatively correct bed density profile made up of dense
bubbling type bed at the bottom and dilute region at the top, can be reproduced using the present
EMMS drag model in conjunction with TFM. However, some fine tuning is needed for accurate
prediction of experimental data. Solids entrainment may contribute to such discrepancy though
further analysis needs to be carried out in future work. For example, the effect of restitution
coefficient was not analyzed in this work. Furthermore, the approximation of algebraic granular
temperature model was used in present work. This approximation may not be valid in the top
dilute region. It may be beneficial to study the results the using full partial differential equation for
granular temperature. Furthermore, the effect of boundary conditions also needs to be assessed for
this system with lower Archimedes number. However, these studies are beyond the scope of
present work.
4. Conclusion
Following the approach of multiscale modeling, the work presented in this manuscript reports
the development of a bubble-based EMMS mixture model. The solution of the model shows that
the model can capture the drop in drag coefficient due to the presence of mesoscale bubbles. The
application of the model to turbulent fluidization has shown good agreement between the
simulated and experimental data. By using the current drag model under the umbrella of TFM
framework, it is possible to capture the sigmoidal voidage profile of turbulent fluidized beds.
Using the conclusions from current work, it is possible to extend the current mixture model for
application to riser type flows where solid carryover becomes an operating parameter.
Furthermore, to carry out accurate modeling of dense beds the effects of mesoscale structures on
particle stresses also needs to be accounted for. Hence further work needs to be carried out in
future.
Nomenclature
Ar Archimedes number, dimensionless
a inertial term, m/s2
Cd effective drag coefficient for a particle or a bubble
Cd0 standard drag coefficient for a particle or a bubble
db bubble diameter, m
dp particle diameter, m
Dt column diameter, m
es particle-particle restitution coefficient
ew particle-wall restitution coefficient
f volume fraction of dense phase
F drag force, N
g gravitational acceleration, m/s2
g0 radial distribution function
H column height, m
14
Hd heterogeneity index
Nst mass-specific energy consumption for suspending and transporting particles, W/kg
NT total mass-specific energy, W/kg
p pressure, Pa
Re Reynolds number
u actual or real velocity, m/s
U superficial velocity, m/s
Umf superficial gas velocity at minimum fluidization, m/s
Uslip superficial slip velocity, m/s
ut terminal velocity of a single particle, m/s
Greek letters
く drag coefficient, kg/(m3s)
けs collisional energy dissipation, J/(m3s)
〉t time step, s
ig voidage
igc voidage of dense phase
igf voidage of dilute phase
imf incipient/minimum fluidization voidage
isc solids concentration in the dense phase
isf solids concentration in the dilute phase
imax maximum voidage for particle aggregation
is,max maximum close packing solids concentration
es granular temperature, m2/s2
ǿ unit tensor
I2D second invariant of the deviatoric stress tensor
せs diffusion coefficient for granular energy, Pa s
そ bulk viscosity, Pa s
た viscosity, Pa s
と density, kg/m3
IJ stress tensor, Pa
l specularity coefficient
ぱ angle of internal friction ()
Subscripts
b bubble
c dense phase
f dilute phase
g gas phase
gc gas in dense-phase
gf gas in dilute-phase
i meso-scale interphase
15
mf minimum fluidization
p particle
s solid phase
sc dense-phase solid
sf dilute-phase solid
Acknowledgment This work is an extension of our previous work on mixture model using the EMMS approach.
Some work was completed during the Ph.D. studies of the first author at Institute of Process
Engineering (IPE), Chinese Academy of Sciences (CAS). First author acknowledges the financial
support he received from British Council under the Researcher Links Program to carry out this
study at Energy Technology & Innovation Initiative (ETII), University of Leeds. Financial support
by the National Natural Science Foundation of China under Grant no. 21406081 is also gratefully
acknowledged.
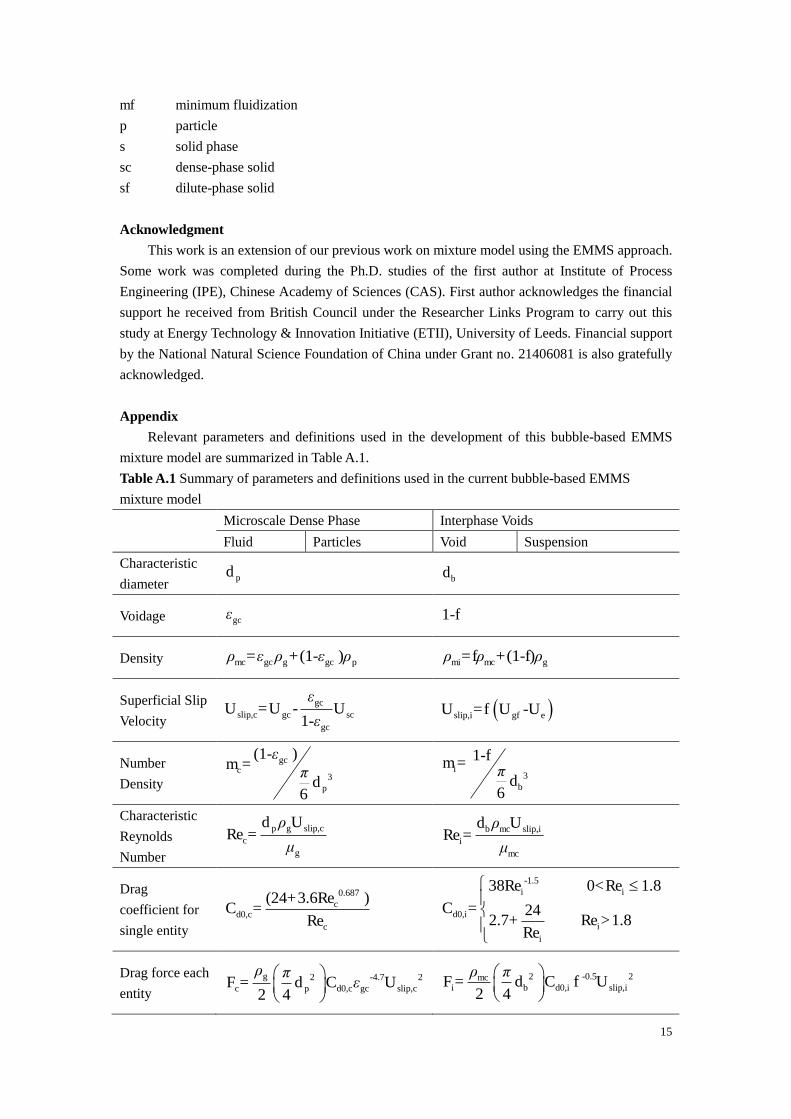
Appendix
Relevant parameters and definitions used in the development of this bubble-based EMMS
mixture model are summarized in Table A.1.
Table A.1 Summary of parameters and definitions used in the current bubble-based EMMS
mixture model
Microscale Dense Phase Interphase Voids
Fluid Particles Void Suspension
Characteristic
diameter pd bd
Voidage gci 1-f
Density mc gc g gc pと =i と +(1-i )と mi mc gと =fと +(1-f)と
Superficial Slip
Velocity
gcslip,c gc sc
gc
iU =U - U
1-i slip,i gf eU =f U -U
Number
Density
gcc
3p
(1-i )m = ヾ
d6
i3
b
1-fm= ヾd
6
Characteristic
Reynolds
Number
p g slip,cc
g
d と URe =
た b mc slip,i
imc
d と URe =
た
Drag
coefficient for
single entity
0.687c
d0,cc
(24+3.6Re )C =
Re
-1.5i i
d0,ii
i
38Re 0<Re 1.8
C = 242.7+ Re >1.8
Re
Drag force each
entity g 2 -4.7 2
c p d0,c gc slip,c
と ヾF = d C i U
2 4
2 -0.5 2mc
i b d0,i slip,i
と ヾF = d C f U
2 4
16
Drag force in
unit volume c cm F i im F
Objective
Function ,
( )1
(1 ) (1 )mc mi
st mix fc b fbg p
fN fU f U g
f
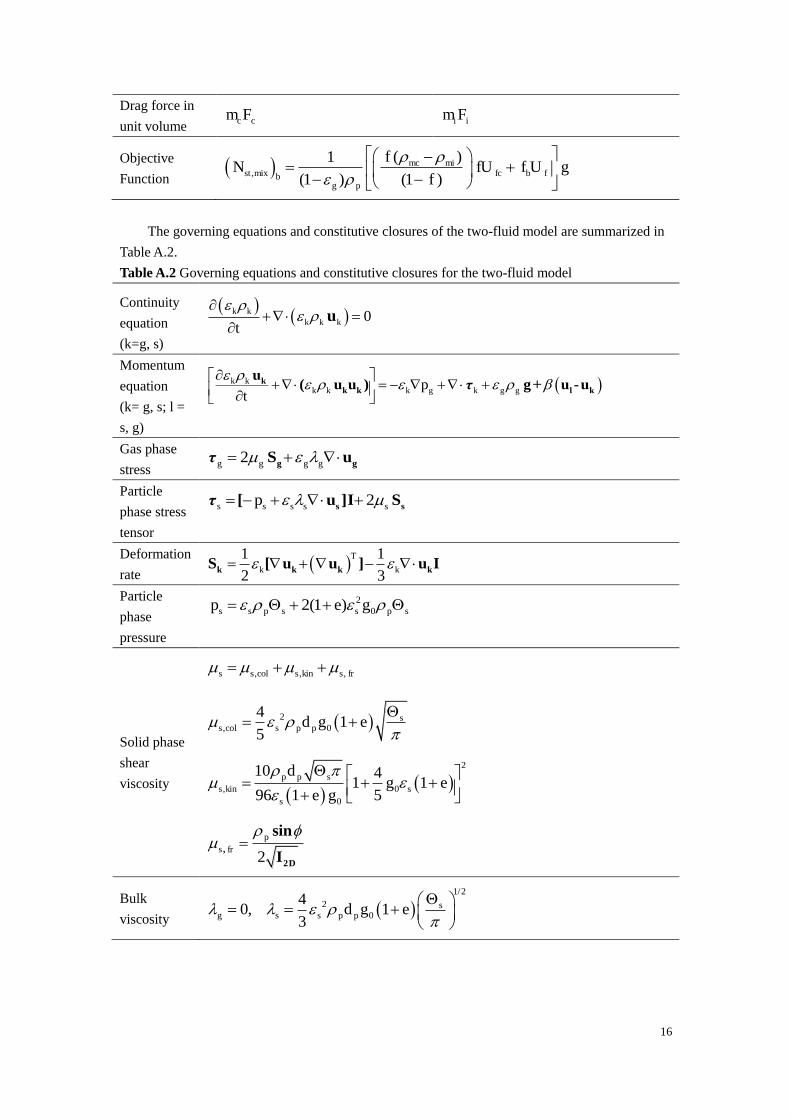
The governing equations and constitutive closures of the two-fluid model are summarized in
Table A.2.
Table A.2 Governing equations and constitutive closures for the two-fluid model
Continuity
equation
(k=g, s)
0k kk k kt
u
Momentum
equation
(k= g, s; l =
s, g)
k kk k k g k g gp
t
k
k k l k
u( u u ) g u -uk +
Gas phase
stress 2g g g g g gS uk
Particle
phase stress
tensor
2s s s s sp s s[ u ]I Sk
Deformation
rate 1 1
2 3
T
k k k k k kS [ u u ] u I
Particle
phase
pressure
202(1 )s s p s s p sp e g
Solid phase
shear
viscosity
, , ,s s col s kin s fr
2, 0
41
5s
s col s p pd g e
2
, 00
10 41 1
96 1 5p p s
s kin ss
dg e
e g
2p
s fr
,
2D
sin
I
Bulk
viscosity
1/22
0
40, 1
3s
g s s p pd g e

17
Radial
distribution
function
113
0,max
1 s
sg
Granular
temperature
equation
33
2 s p s s p s s st
s su : u qk
Collisional
energy
dissipation
2 2 3/20
121s s p s
p
e gd
Flux of
fluctuating
energy
s s q
Conductivit
y of
fluctuating
energy
2
0
0
62 1 1
51
ks
cs
e g
e g
75
384k
p p sd
202 (1 )c s
s p pd g e
Drag
coefficient
for
Gidaspow
drag model
2 70
2
2
130 8
4
110 8 150 1 75
.g s
g s
( ). u - u
( ) u - u( ). .
g gg WY g D g
p
g gg gg Ergun
g p p
Cd
d d
0 687
0
0
p
24 3 61000
1000 0 44
Re
.p
p Dp
p D
g g p g s
g
. ReRe C
Re
Re C .
d u -u
Drag
coefficient
for EMMS
drag model
2 7WY 0
13
4g g
D g D g dp
H C Hd
.
g s
( )u -u
Hd for Group-A particles
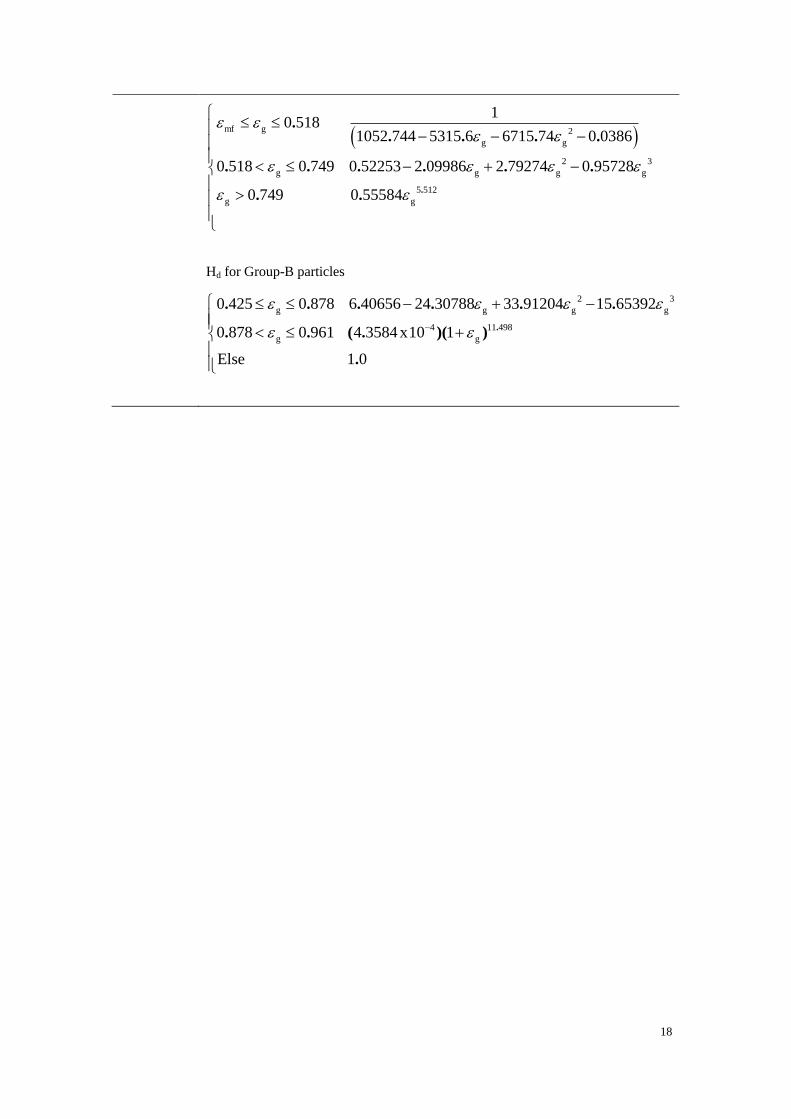
18
2
2 3
5 512
1
1052 744 5315 6 6715 74
0 52253 2 09986 2 79274 0 95728
0 5180 0386
0 518 0 749
0 74 0 5559 84 .
. . .
. . .
..
. .
.
.
.
g
mf g
g
g g
g
g g g
Hd for Group-B particles
2 3
4 11 498
6 40656 24 30788 33 91204 15 65392
4
0 425 0 878
0 878 0 96 3584x101
1 0
1 .
. . . .
( . )( )
. .
. .
.
g g g
g
g
g
Else
19
List of Tables
Table 1 Modeling parameters for Group-B fluidized system of Gao et al. [13] used in this study
Table 2 Modeling parameters for Group-A fluidized system of Gao et al. [11] used for study
Table A.1 Summary of parameters and definitions used in the current bubble-based EMMS
mixture model
Table A.2 Governing equations and constitutive closures for the two-fluid model
20
List of Figures
Figure 1 Heterogeneity index Hd as a function of mean voidage for the turbulent fluidized systems
used for simulation.
Figure 2 Schematic of the turbulent fluidized bed setup used for simulation.
Figure 3 (a) Time-averaged profiles of voidage along the bed height for different grid sizes; (b)
Instantaneous solid fraction in the bed.
Figure 4 Comparison of results for EMMS drag model with Gidaspow drag model: (a)
Time-averaged axial voidage profile; (b) Time-averaged radial solid fraction profiles at a height of
0.198m; (c) Time-averaged radial solid fraction profiles at a height of 0.138m.
Figure 5 Effect of wall boundary condition on the time-averaged profiles for both EMMS and
Gidaspow drag model: (a) Axial voidage profiles; (b) Radial solid fraction profiles at a height of
0.198m; (c) Radial solid fraction profiles at a height of 0.138m.
Figure 6 Simulation results of turbulent fluidized bed with Group-A particles using EMMS drag
model: (a) Snapshot of instantaneous solid fraction in the bed; (b) Axial voidage profile; (c) Time
averaged snapshot of solid fraction in the bed.
21
References
[1] G.L. Matheson, W.A. Herbst, P.H. Holt, Characteristics of Fluid-Solid Systems, Industrial &
Engineering Chemistry, 41 (1949) 1098-1104.
[2] H.T. Bi, N. Ellis, I.A. Abba, J.R. Grace, A state-of-the-art review of gas–solid turbulent fluidization,
Chemical Engineering Science, 55 (2000) 4789-4825.
[3] J. Li, M. Kwauk, Particle-fluid two-phase flow: the energy-minimization multi-scale method,
Metallurgy Industry Press, Beijing1994.
[4] M. Rhodes, What is turbulent fluidization?, Powder Technology, 88 (1996) 3-14.
[5] J.R. Grace, Reflections on turbulent fluidization and dense suspension upflow, Powder Technology,
113 (2000) 242-248.
[6] R.H. Venderbosch, The role of clusters in gas-solids reactors. An experimental study., Department
of Chemical Engineering, University of Twente, Enschede, Netherlands, 1998, pp. 208.
[7] F. Berruti, T.S. Pugsley, L. Godfroy, J. Chaouki, G.S. Patience, Hydrodynamics of circulating
fluidized bed risers: A review, The Canadian Journal of Chemical Engineering, 73 (1995) 579-602.
[8] A. Gungor, N. Eskin, Hydrodynamic modeling of a circulating fluidized bed, Powder Technology,
172 (2007) 1-13.
[9] D. Gidaspow, Multiphase Flow and Fluidization: Continuum and Kinetic Theory Descriptions, 1st
ed., Academic Press, San Diego1994.
[10] V. Jiradilok, D. Gidaspow, S. Damronglerd, W.J. Koves, R. Mostofi, Kinetic theory based CFD
simulation of turbulent fluidization of FCC particles in a riser, Chemical Engineering Science, 61 (2006)
5544-5559.
[11] J. Gao, X. Lan, Y. Fan, J. Chang, G. Wang, C. Lu, C. Xu, CFD modeling and validation of the
turbulent fluidized bed of FCC particles, AIChE Journal, 55 (2009) 1680-1694.
[12] J. Chang, G. Wang, X. Lan, J. Gao, K. Zhang, Computational Investigation of a Turbulent
Fluidized-bed FCC Regenerator, Industrial & Engineering Chemistry Research, 52 (2013) 4000-4010.
[13] X. Gao, C. Wu, Y.-w. Cheng, L.-j. Wang, X. Li, Experimental and numerical investigation of solid
behavior in a gas–solid turbulent fluidized bed, Powder Technology, 228 (2012) 1-13.
[14] B. Lu, W. Wang, J. Li, Searching for a mesh-independent sub-grid model for CFD simulation of
gas-solid riser flows, Chemical Engineering Science, 64 (2009) 3437-3447.
[15] S. Sundaresan, Modeling the hydrodynamics of multiphase flow reactors: Current status and
challenges, AIChE Journal, 46 (2000) 1102-1105.
[16] K. Agrawal, P.N. Loezos, M. Syamlal, S. Sundaresan, The role of meso-scale structures in rapid
gas-solid flows, Journal of Fluid Mechanics, 445 (2001) 151-185.
[17] Y. Igci, A.T. Andrews, S. Sundaresan, S. Pannala, T. O'Brien, Filtered two-fluid models for
fluidized gas-particle suspensions, AIChE Journal, 54 (2008) 1431-1448.
[18] K. Hong, W. Wang, Q. Zhou, J. Wang, J. Li, An EMMS-based multi-fluid model (EFM) for
heterogeneous gas–solid riser flows: Part I. Formulation of structure-dependent conservation equations,
Chemical Engineering Science, 75 (2012) 376-389.
[19] S. Benyahia, S. Sundaresan, Do we need sub-grid scale corrections for both continuum and
discrete gas-particle flow models?, Powder Technology, 220 (2012) 2-6.
[20] M. Syamlal, S. Pannala, Multiphase Continuum Formulation for Gas-Solids Reacting Flows, in: S.
Pannala, M. Syamlal, T.J. O'Brien (Eds.) Computational Gas-Solids Flows and Reacting Systems:
Theory, Methods and Practice, IGI Global2010, pp. 2-61.
[21] D.Z. Zhang, W.B. VanderHeyden, The effects of mesoscale structures on the macroscopic

22
momentum equations for two-phase flows, International Journal of Multiphase Flow, 28 (2002)
805-822.
[22] L. Huilin, S. Qiaoqun, H. Yurong, S. Yongli, J. Ding, L. Xiang, Numerical study of particle cluster
flow in risers with cluster-based approach, Chemical Engineering Science, 60 (2005) 6757-6767.
[23] G.J. Heynderickx, A.K. Das, J. De Wilde, G.B. Marin, Effect of Clustering on Gas−Solid Drag in Dilute Two-Phase Flow, Industrial & Engineering Chemistry Research, 43 (2004) 4635-4646.
[24] N. Yang, W. Wang, W. Ge, J. Li, CFD simulation of concurrent-up gas-solid flow in circulating
fluidized beds with structure-dependent drag coefficient, Chemical Engineering Journal, 96 (2003)
71-80.
[25] W. Wang, J. Li, Simulation of gas - solid two-phase flow by a multi-scale CFD approach -
Extension of the EMMS model to the sub-grid level, Chemical Engineering Science, 62 (2007) 208 -
231.
[26] J. Wang, W. Ge, J. Li, Eulerian simulation of heterogeneous gas–solid flows in CFB risers:
EMMS-based sub-grid scale model with a revised cluster description, Chemical Engineering Science,
63 (2008) 1553-1571.
[27] Z. Shi, W. Wang, J. Li, A bubble-based EMMS model for gas–solid bubbling fluidization,
Chemical Engineering Science, 66 (2011) 5541-5555.
[28] K. Hong, Z. Shi, A. Ullah, W. Wang, Extending the bubble-based EMMS model to CFB riser
simulations, Powder Technology, 266 (2014) 424-432.
[29] P. Li, X. Lan, C. Xu, G. Wang, C. Lu, J. Gao, Drag models for simulating gas–solid flow in the
turbulent fluidization of FCC particles, Particuology, 7 (2009) 269-277.
[30] K. Hong, Z. Shi, W. Wang, J. Li, A structure-dependent multi-fluid model (SFM) for
heterogeneous gas–solid flow, Chemical Engineering Science, 99 (2013) 191-202.
[31] M. Manninen, V. Taivassalo, S. Kallio, On the mixture model for multiphase flow, 1996.
[32] M. Horio, A. Nonaka, A generalized bubble diameter correlation for gas-solid fluidized beds,
AIChE Journal, 33 (1987) 1865-1872.
[33] C. Wen, Y. Yu, Mechanics of fluidization, Chem. Eng. Prog. Symp. Ser., 1966, pp. 100-111.
[34] A. Ullah, W. Wang, J. Li, An EMMS based mixture model for turbulent fluidization, 11th
International Conference on Fluidized Bed TechnologyBeijing, China, 2014, pp. 267-272.
[35] B.G.M. van Wachem, J.C. Schouten, C.M. van den Bleek, R. Krishna, J.L. Sinclair, Comparative
analysis of CFD models of dense gas–solid systems, AIChE Journal, 47 (2001) 1035-1051.
[36] F. Song, W. Wang, K. Hong, J. Li, Unification of EMMS and TFM: structure-dependent analysis
of mass, momentum and energy conservation, Chemical Engineering Science, 120 (2014) 112-116.
[37] S. Benyahia, Analysis of model parameters affecting the pressure profile in a circulating fluidized
bed, AIChE Journal, 58 (2012) 427-439.