bu1004 week 3 expected values and decision trees
Post on 21-Dec-2015
224 views
TRANSCRIPT

BU1004
Week 3 expected values and decision trees

Expected values
• Raffle tickets 50 are sold at a price of £1 each Two prizes; one of £10 and one of £5
• One ticket is selected at random as the first prize
• If a person buys one ticket how much do they expect to win?

Expected values xp(x)
• 50 tickets were sold at £1 each
• 1 ticket will win £10 and 1 ticket will win £5
• Total winnings = £15 (50 people)
• Expected value = xp(x) where x is a value and p(x) is the probability

Solution
P(winning £10) = 1 = 0.02
50
P(winning £5) = 1 = 0.02
50
Expected win ( xp(x) )
= ( £10 × 0.02) + ( £5 × 0.02)
= £0.20 + £0.10 = £0.30 = 30p

Expected values
• Solution ‘average’ of 30 p each
• Thus the ‘expected’ gain per ticket = £0.30
• Expected value = xp(x) • where x is a value and p(x) its probability
Defined as (probability x the value of the outcome), often used to suggest the best alternative in situations involving risk

Decision Trees
• One decision leads may lead to a series of decisions.
• A decision tree is used to describe these events and to evaluate alternative courses of action
• Often used as a planning device in areas of uncertainty, i.e. we can only estimate the probabilities of alternative outcomes we do not know the results for certain

Symbols
• Only two for decision trees:
• A BOX where a DECISION has to be made
• A CIRCLE where EXPECTED VALUES are CALCULATED
• The 2 symbols alternate as we move from left to right across the diagram

Example - to open a dress shop on London
• ? - options are to open a small shop, a medium-sized shop or a no shop at all. The market for dresses can be good, average or poor; probabilities 0.2 for a good market, 0.5 for an average market and 0.3 for a poor market
• Revenues for the medium sized and small shop are given in the tables

Small 135,000 85,000 20,000
Medium 200,000 85,000 40,000
None 0 0 0
Table of Revenues
Note - the cost of a small shop is £60,000 pa and the medium-sized shop is £100,000 pa.

good
average
poor
good
average
poor
Decision tree
Large shop
Medium shop
No shop

Revenue Probability Expected
Good 135 0.2 27
Average 85 0.5
Poor
Total
20 0.3
Expected Revenues for the SMALL shop

Expected revenue for the LARGE shop
Revenue Probability Expected
Good 200 0.2
Average 135 0.5
Poor
Total
80 0.3

Net revenues
• Small sized shop– Expected revenue £75.5, cost £60 – Net revenue = £15.5 thousand
• Medium sized shop: – Expected revenue £119.5, cost £100– Net revenue = £19.5 thousand
• Advice open a medium sized shop

General Procedure:• Structure the problem as a tree with
alternative courses of action• Identify any probabilities involved• Identify rewards: sales, incomes, possible
savings etc • Calculate expected values of reward and
alternative courses of action• Identify costs of alternative courses• Identify 'net benefit' and make decision
– [net benefit = reward - costs]

Worked example:A new product has been developed, the design is valued at £1000
Launch and market costs are £1500 and market research costs a further £500.
The product may be very successful, moderately successful or a failure with estimated revenues of £10000, £4000 and -£6000 respectively. These revenues exclude launch and market research costs. Given that outcomes are the subject of chance, the following probabilities have been estimated:
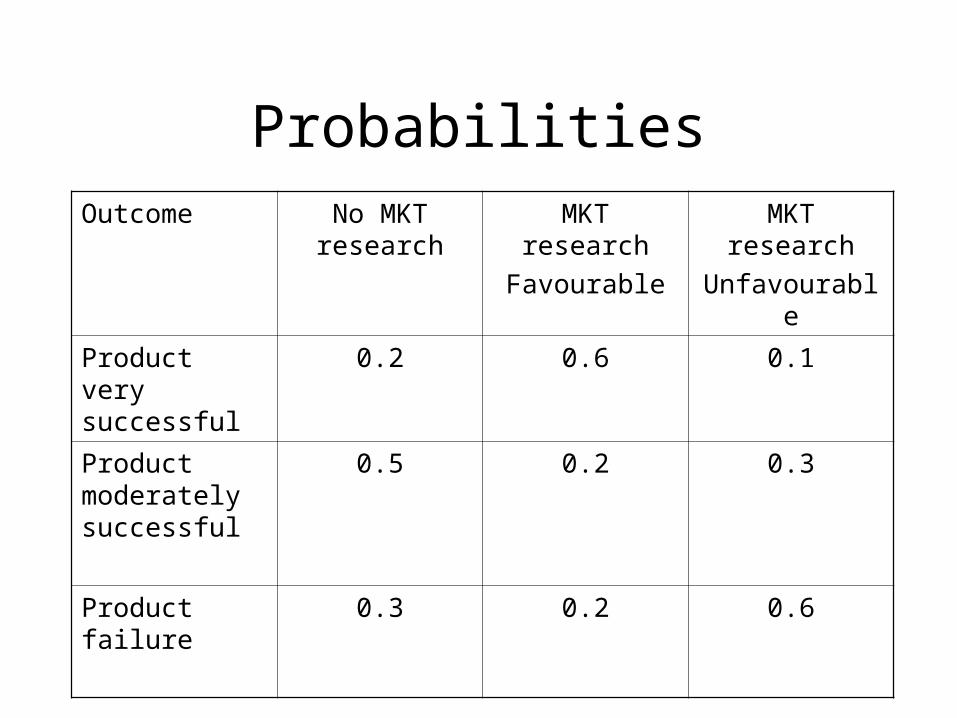
ProbabilitiesOutcome No MKT
researchMKT research
Favourable
MKT research
Unfavourable
Product very successful
0.2 0.6 0.1
Product moderately successful
0.5 0.2 0.3
Product failure 0.3 0.2 0.6
Process
• Experience with previous products of this kind suggests a 40% chance of a favourable market research report.
• Use a decision tree to decide whether the owner of the product design should sell the design; launch the product without or without conducting market research first.

Staged approach
• This problem more complicated - two stages of decisions to consider
• Stage 1 decision - whether to conduct market research, sell the design or to do nothing– If we decide to conduct market research first:
• Stage 2 decision - whether to launch the product or sell the design after the results of the research are known

If favourable market research
Outcome Probability Revenue Expected revenue = probability revenue
Very successful
0.6 10K 6.0K
Moderately successful
0.2 4K 0.8K
failure 0.2 -6K -1.2K5.6K

Additionally
• The cost of the launch is 1.5K - this option has a 'net revenue' of 4.1K
• If the market research is favourable the 'sell design' option will generate revenue of 1K and a net revenue of 1K
• As the value of 4.1K is the larger it is value that is carried forward in the calculations
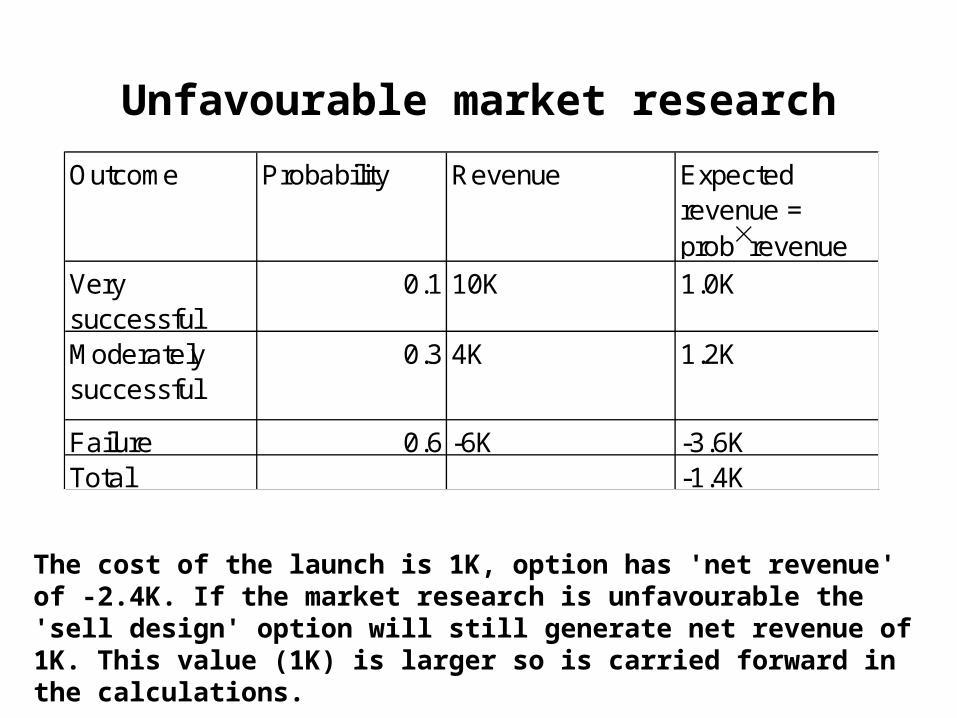
Unfavourable market research
Outcome Probability Revenue Expected revenue = probrevenue
Very successful
0.1 10K 1.0K
Moderately successful
0.3 4K 1.2K
Failure 0.6 -6K -3.6KTotal -1.4K
The cost of the launch is 1K, option has 'net revenue' of -2.4K. If the market research is unfavourable the 'sell design' option will still generate net revenue of 1K. This value (1K) is larger so is carried forward in the calculations.

Market research first
Outcome Probability Revenue Expected revenue = probrevenue
favourable 0.4 4.1K 1.64Kunfavourable 0.6 1K 0.6K
Total 2.24K
The cost of the market research is 0.5K, so this pathway has 'net revenue' of 1.74K.

Launch product without market research
Outcome Probability Revenue Expected revenue = probrevenue
Very successful
0.2 10K 2.0K
Moderately successful
0.5 4K 2.0K
failure 0.3 -6K -1.8KTotal 2.2K
Incurs a cost of 1.5 K, so 'net revenue' is 0.7K
Sell the design, generates net revenue of 1K

Summary Option Expected net
revenueNotes
If the market research is favourable, launch the product.If the market research is unfavourable, sell the design
Launch the product
0.7K
Sell the design 1.0K
Conduct market research first
1.74K

