btec results 2015 - pearson qualifications | edexcel, … 2015 btec firsts: cohort overview 6 •...
TRANSCRIPT


Results 2015
BTEC Results | 2015 2
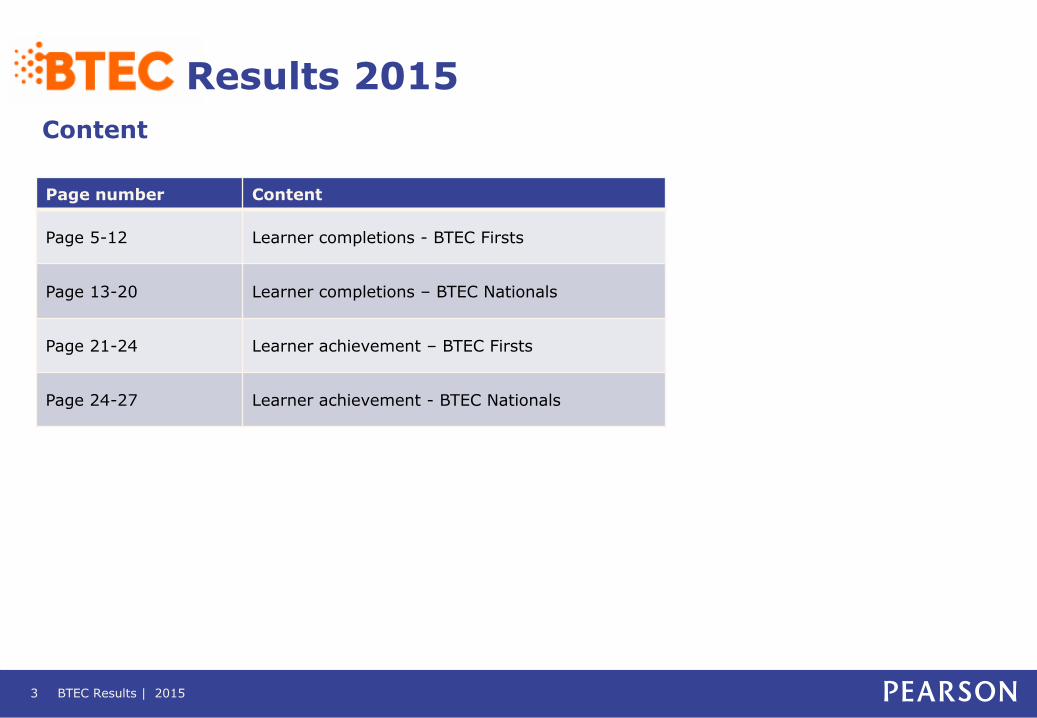
Content
Results 2015
Page number Content
Page 5-12 Learner completions - BTEC Firsts
Page 13-20 Learner completions – BTEC Nationals
Page 21-24 Learner achievement – BTEC Firsts
Page 24-27 Learner achievement - BTEC Nationals
BTEC Results | 2015 3

Results 2015
About these results The results published this year represent achievement for learners in UK schools and further education
establishments (FE) for the 2014/15 full academic year (from September 2014 to August 2015). They represent learners at a cohort level, i.e. those that were expected to complete in 2014/15.
This provides a comprehensive picture of the results for BTEC Firsts and Nationals over the year. Performance
tables report on completion rates, so the inclusion of this data aligns these results closely with national reporting. Learners’ results may be reported as ‘not completed’ for a number of reasons: if they are still studying for their
qualification, if a fallback Certificate of Unit Achievement was requested, or if they have withdrawn from the course.
In the last few years BTEC First qualifications, at Level 2, have undergone a significant change of structure and the new qualifications sit on the National Qualifications Framework (NQF) rather than the Qualifications and Credit Framework (QCF). The NQF BTEC First qualifications include an additional Level 1 Pass grade which was not available in the QCF versions.
The BTEC National qualifications, at Level 3, currently include only one subject area, CPLD, on the NQF. The data in this presentation combines results from the NQF and QCF qualifications at each level. View further details on the definition of the data.
BTEC Results | 2015 4
Learner completions - BTEC Firsts
BTEC Results | 2015 5

Results 2015 BTEC Firsts: cohort overview
6
• Completed: learners who completed by the end of the specified course duration and were awarded a qualification grade. • Not completed: learners who withdrew, claimed fallback, or were yet to complete at the end of the specified course duration.
Cohort: 671,774 572,827
BTEC Results | 2015 6
579,691
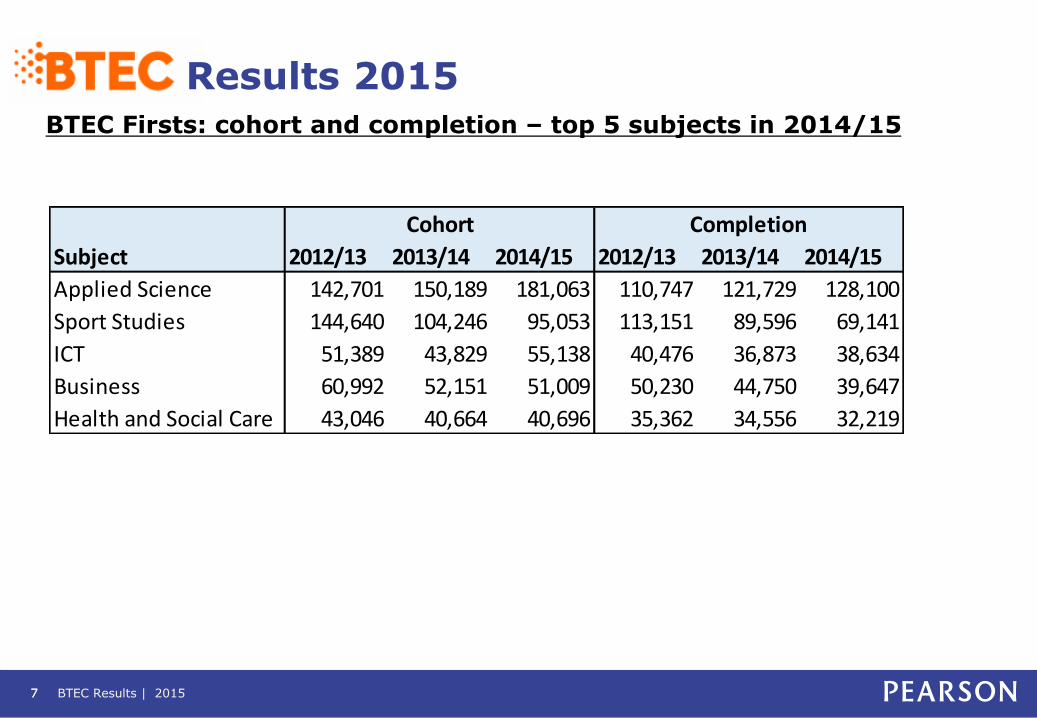
Results 2015 BTEC Firsts: cohort and completion – top 5 subjects in 2014/15
7 BTEC Results | 2015 7
2012/13 2013/14 2014/15 2012/13 2013/14 2014/15
Applied Science 142,701 150,189 181,063 110,747 121,729 128,100
Sport Studies 144,640 104,246 95,053 113,151 89,596 69,141
ICT 51,389 43,829 55,138 40,476 36,873 38,634
Business 60,992 52,151 51,009 50,230 44,750 39,647
Health and Social Care 43,046 40,664 40,696 35,362 34,556 32,219
Cohort Completion
Subject

Results 2015 BTEC Firsts: completion in STEM subjects
8 BTEC Results | 2015 8

BTEC Results | 2015 9
Results 2015
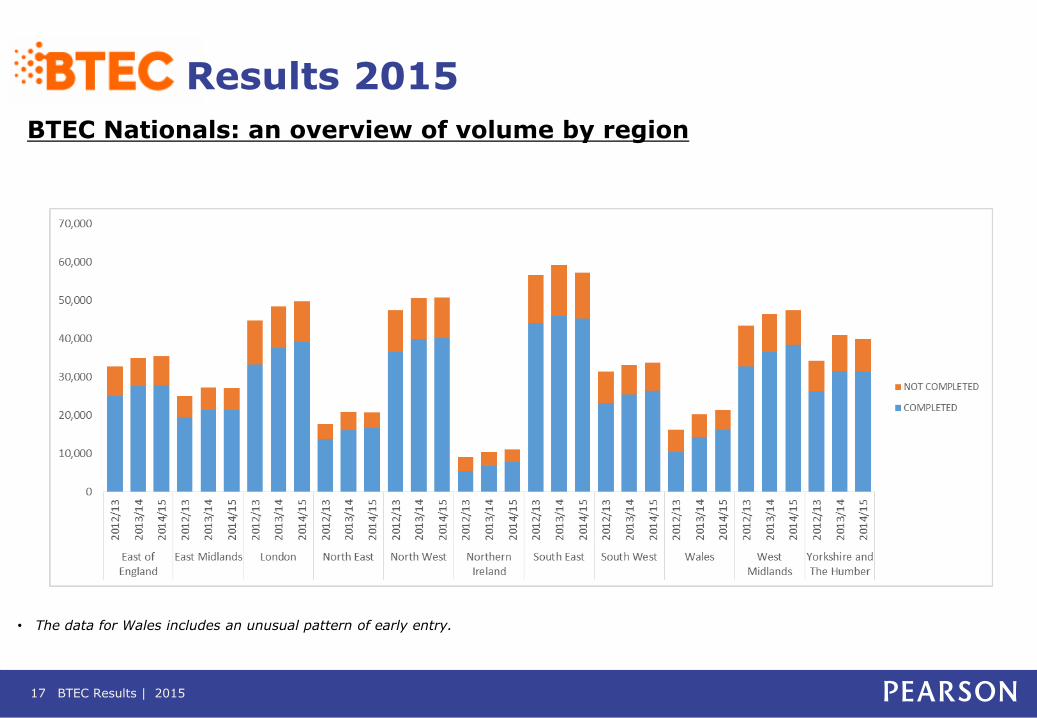
BTEC Firsts: an overview of volume by region
• The data for Wales includes an unusual pattern of early entry.

BTEC Results | 2015 10
Results 2015
BTEC Firsts: 2014-15 top 5 subjects by volume and gender

BTEC Results | 2015 11
Results 2015
BTEC Firsts: top 5 subjects for female learners by completion volume

BTEC Results | 2015 12
Results 2015
BTEC Firsts: top 5 subjects for male learners by completion volume

Learner completions - BTEC Nationals
BTEC Results | 2015 13

BTEC Results | 2015 14
Results 2015
BTEC Nationals: cohort overview
Cohort: 359,993 393,942 395,983
• Completed: learners who completed by the end of the specified course duration and were awarded a qualification grade. • Not completed: learners who withdrew, claimed fallback, or were yet to complete at the end of the specified course duration.

BTEC Results | 2015 15
Results 2015
BTEC Nationals: cohort and completion – top 5 subjects in 2014/15
Subject 2012/13 2013/14 2014/15 2012/13 2013/14 2014/15
Sport Studies 48,757 53,582 54,940 37,472 42,179 43,300
Business 40,911 45,940 48,346 30,573 35,526 38,202
Health and Social Care 36,672 42,339 44,514 27,760 32,906 35,406
ICT 38,591 43,284 43,679 28,847 33,508 34,901
Applied Science 21,721 27,468 29,951 15,497 20,121 23,043
Cohort Completion

BTEC Results | 2015 16
Results 2015
BTEC Nationals: completions in STEM subjects
• In 2014/15, completion in STEM subjects saw an overall increase.
BTEC Results | 2015 17
Results 2015
BTEC Nationals: an overview of volume by region
• The data for Wales includes an unusual pattern of early entry.
BTEC Results | 2015 18
Results 2015
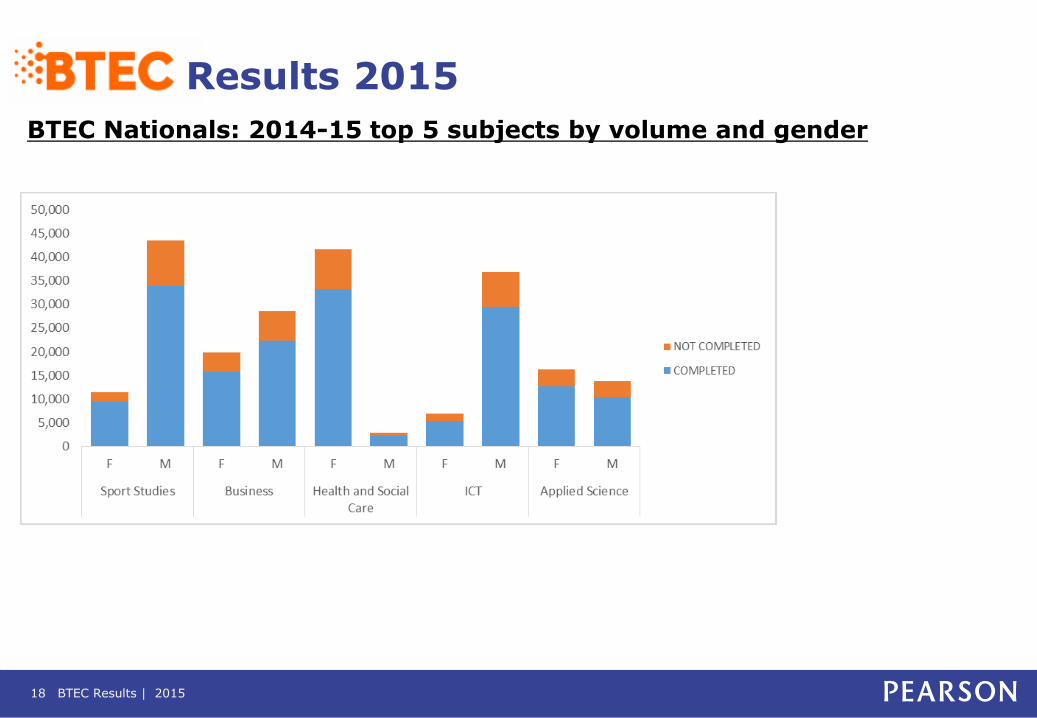
BTEC Nationals: 2014-15 top 5 subjects by volume and gender

BTEC Results | 2015 19
Results 2015
BTEC Nationals: top 5 subjects for female learners by completion volume
BTEC Results | 2015 20
Results 2015
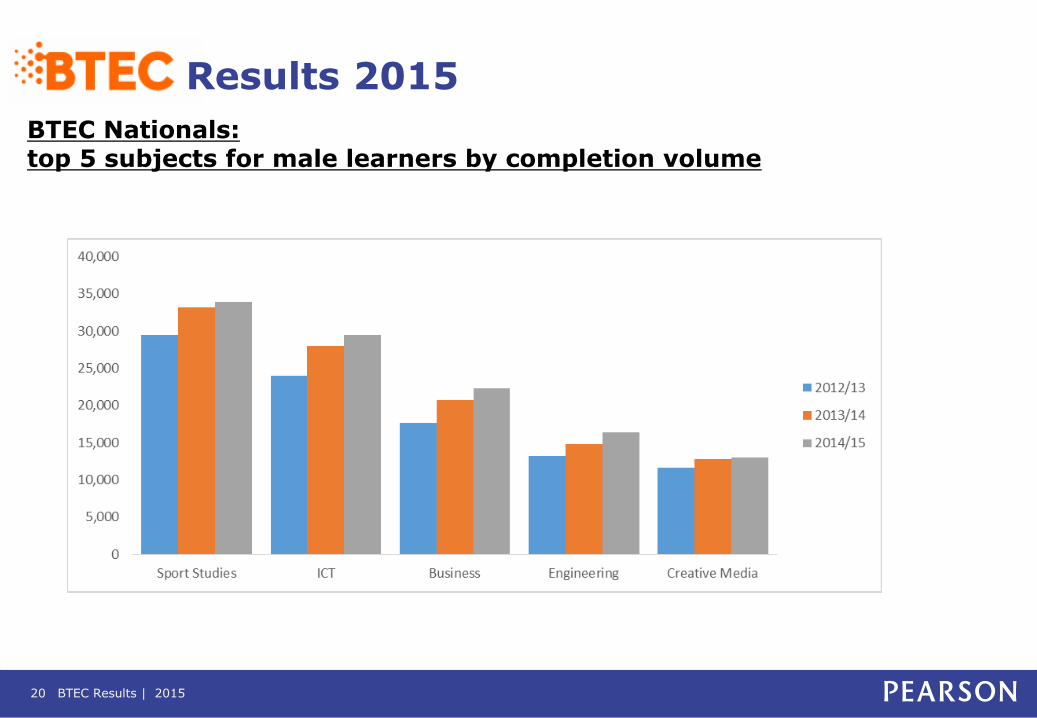
BTEC Nationals: top 5 subjects for male learners by completion volume
Learner achievement - BTEC Firsts
BTEC Results | 2015 21

BTEC Results | 2015 22
Results 2015 BTEC Firsts achievement: grade distribution overview
• L1P: these are only available on Level 2 NQF qualifications. These passes are deemed equivalent to Level 1. • Not completed: learners who withdrew, claimed fallback, or were yet to complete at the end of the specified course duration.
Cohort D* D M P L1P U NOT COMPLETED
2012/13 671,650 13.5% 5.4% 18.9% 41.1% 0.0% 0.1% 21.0%
2013/14 567,159 13.1% 5.6% 19.3% 42.7% 2.0% 0.4% 16.9%
2014/15 537,522 4.9% 3.9% 15.0% 37.2% 10.8% 1.6% 26.6%
Cohort D*D* D*D DD DM MM MP PP L1P U NOT COMPLETED
2012/13 124 0.0% 0.0% 0.0% 3.2% 2.4% 2.4% 23.4% 12.1% 0.0% 56.5%
2013/14 5,668 0.7% 0.4% 0.6% 4.1% 4.6% 7.6% 13.7% 14.8% 1.0% 52.5%
2014/15 42,169 1.3% 1.2% 1.7% 5.5% 8.5% 10.7% 19.7% 15.3% 1.0% 35.1%
For these qualifications: Certificate (QCF), Extended Certificate (QCF), Diploma (QCF), Award (NQF)
For these qualifications: Certificate (NQF), Extended Certificate (NQF), Diploma (NQF)
BTEC Results | 2015 23
Results 2015
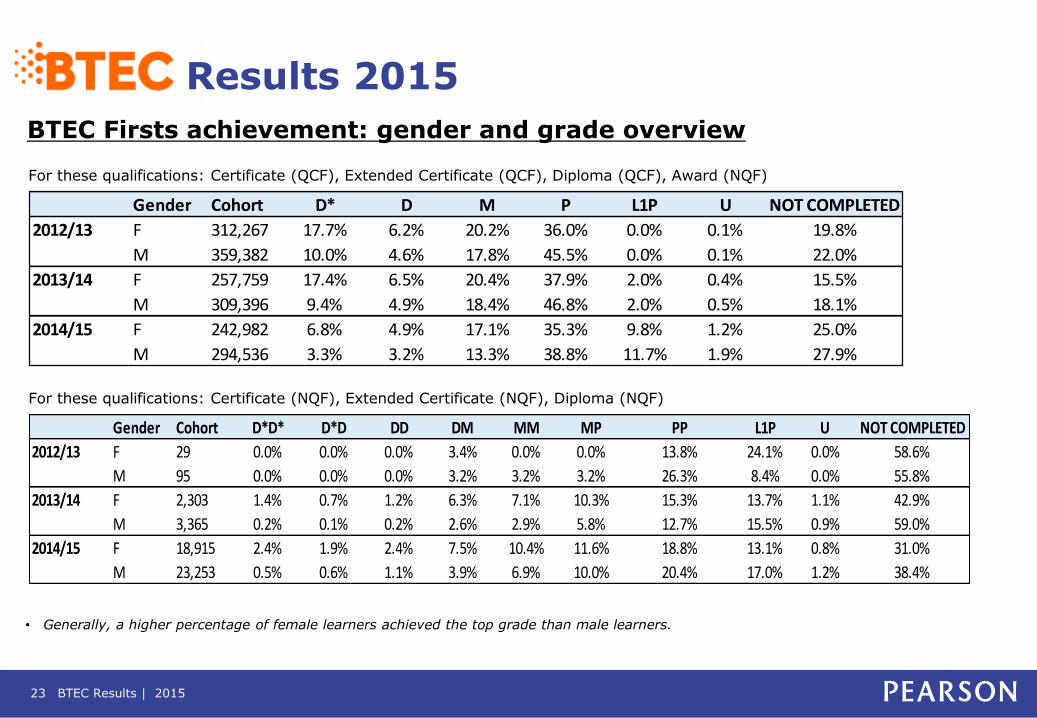
BTEC Firsts achievement: gender and grade overview
• Generally, a higher percentage of female learners achieved the top grade than male learners.
Gender Cohort D* D M P L1P U NOT COMPLETED
2012/13 F 312,267 17.7% 6.2% 20.2% 36.0% 0.0% 0.1% 19.8%
M 359,382 10.0% 4.6% 17.8% 45.5% 0.0% 0.1% 22.0%
2013/14 F 257,759 17.4% 6.5% 20.4% 37.9% 2.0% 0.4% 15.5%
M 309,396 9.4% 4.9% 18.4% 46.8% 2.0% 0.5% 18.1%
2014/15 F 242,982 6.8% 4.9% 17.1% 35.3% 9.8% 1.2% 25.0%
M 294,536 3.3% 3.2% 13.3% 38.8% 11.7% 1.9% 27.9%
Gender Cohort D*D* D*D DD DM MM MP PP L1P U NOT COMPLETED
2012/13 F 29 0.0% 0.0% 0.0% 3.4% 0.0% 0.0% 13.8% 24.1% 0.0% 58.6%
M 95 0.0% 0.0% 0.0% 3.2% 3.2% 3.2% 26.3% 8.4% 0.0% 55.8%
2013/14 F 2,303 1.4% 0.7% 1.2% 6.3% 7.1% 10.3% 15.3% 13.7% 1.1% 42.9%
M 3,365 0.2% 0.1% 0.2% 2.6% 2.9% 5.8% 12.7% 15.5% 0.9% 59.0%
2014/15 F 18,915 2.4% 1.9% 2.4% 7.5% 10.4% 11.6% 18.8% 13.1% 0.8% 31.0%
M 23,253 0.5% 0.6% 1.1% 3.9% 6.9% 10.0% 20.4% 17.0% 1.2% 38.4%
For these qualifications: Certificate (QCF), Extended Certificate (QCF), Diploma (QCF), Award (NQF)
For these qualifications: Certificate (NQF), Extended Certificate (NQF), Diploma (NQF)

Learner achievement - BTEC Nationals
BTEC Results | 2015 24
BTEC Results | 2015 25
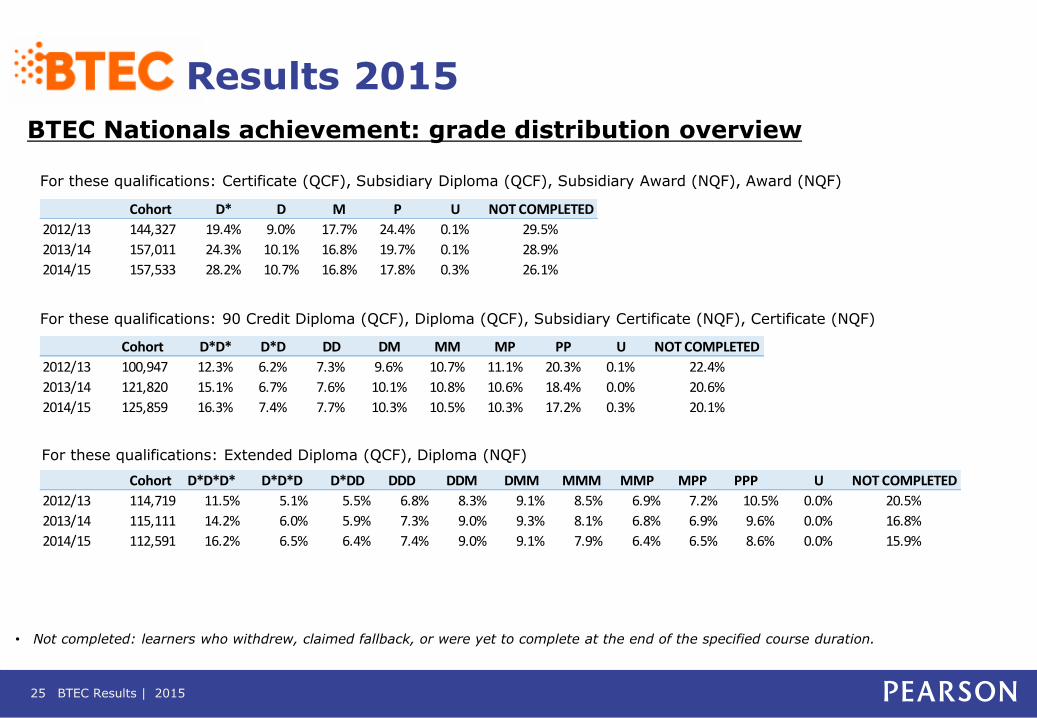
Results 2015
BTEC Nationals achievement: grade distribution overview
Cohort D* D M P U NOT COMPLETED
2012/13 144,327 19.4% 9.0% 17.7% 24.4% 0.1% 29.5%
2013/14 157,011 24.3% 10.1% 16.8% 19.7% 0.1% 28.9%
2014/15 157,533 28.2% 10.7% 16.8% 17.8% 0.3% 26.1%
Cohort D*D* D*D DD DM MM MP PP U NOT COMPLETED
2012/13 100,947 12.3% 6.2% 7.3% 9.6% 10.7% 11.1% 20.3% 0.1% 22.4%
2013/14 121,820 15.1% 6.7% 7.6% 10.1% 10.8% 10.6% 18.4% 0.0% 20.6%
2014/15 125,859 16.3% 7.4% 7.7% 10.3% 10.5% 10.3% 17.2% 0.3% 20.1%
Cohort D*D*D* D*D*D D*DD DDD DDM DMM MMM MMP MPP PPP U NOT COMPLETED
2012/13 114,719 11.5% 5.1% 5.5% 6.8% 8.3% 9.1% 8.5% 6.9% 7.2% 10.5% 0.0% 20.5%
2013/14 115,111 14.2% 6.0% 5.9% 7.3% 9.0% 9.3% 8.1% 6.8% 6.9% 9.6% 0.0% 16.8%
2014/15 112,591 16.2% 6.5% 6.4% 7.4% 9.0% 9.1% 7.9% 6.4% 6.5% 8.6% 0.0% 15.9%
• Not completed: learners who withdrew, claimed fallback, or were yet to complete at the end of the specified course duration.
For these qualifications: Certificate (QCF), Subsidiary Diploma (QCF), Subsidiary Award (NQF), Award (NQF)
For these qualifications: 90 Credit Diploma (QCF), Diploma (QCF), Subsidiary Certificate (NQF), Certificate (NQF)
For these qualifications: Extended Diploma (QCF), Diploma (NQF)

BTEC Results | 2015 26
Results 2015 BTEC Nationals achievement: gender and grade overview in 2014-15
Gender Cohort D* D M P U NOT COMPLETED
2012/13 F 65,839 23.6% 9.8% 17.6% 20.8% 0.2% 28.1%
M 78,485 15.9% 8.3% 17.7% 27.4% 0.0% 30.6%
2013/14 F 71,419 29.5% 10.4% 15.9% 16.1% 0.3% 27.8%
M 85,588 20.0% 9.8% 17.6% 22.7% 0.0% 29.9%
2014/15 F 72,522 33.4% 11.0% 15.6% 14.4% 0.5% 25.1%
M 85,010 23.8% 10.5% 17.9% 20.8% 0.1% 27.0%
• In each year, a higher percentage of female learners achieved the top grade than male learners.
For these qualifications: Certificate (QCF), Subsidiary Diploma (QCF), Subsidiary Award (NQF), Award (NQF)

BTEC Results | 2015 27
Results 2015 BTEC Nationals achievement: gender and grade overview in 2014-15
Gender Cohort D*D*D* D*D*D D*DD DDD DDM DMM MMM MMP MPP PPP U NOT COMPLETED
2012/13 F 51,456 14.7% 6.6% 6.6% 7.6% 8.8% 9.2% 7.9% 6.0% 5.7% 7.5% 0.0% 19.4%
M 63,256 8.8% 4.0% 4.6% 6.2% 8.0% 9.1% 8.9% 7.6% 8.4% 13.0% 0.0% 21.5%
2013/14 F 52,058 18.3% 7.5% 6.9% 7.9% 9.5% 9.0% 7.3% 5.8% 5.3% 6.7% 0.1% 15.7%
M 63,052 10.8% 4.8% 5.1% 6.7% 8.5% 9.5% 8.8% 7.6% 8.3% 12.0% 0.0% 17.7%
2014/15 F 50,375 20.7% 7.9% 7.4% 7.8% 9.2% 8.6% 7.0% 5.3% 4.9% 5.7% 0.1% 15.3%
M 62,209 12.6% 5.4% 5.6% 7.0% 8.8% 9.4% 8.5% 7.3% 7.8% 10.9% 0.0% 16.4%
• In each year, a higher percentage of female learners achieved the top grade than male learners.
For these qualifications: 90 Credit Diploma (QCF), Diploma (QCF), Subsidiary Certificate (NQF), Certificate (NQF)
For these qualifications: Extended Diploma (QCF), Diploma (NQF)