bte publication summary - regional economics · bte publication summary date search results print...
TRANSCRIPT

BTE Publicat ion Summary
Date
Search
Results
Subject
Series
A to Z
Exit
GO BACK
Transport of Hydrocarbons in the Oil and Gas Industries
Information PaperThis Paper is an exploratory attempt to examine the distribution of raw and refined petroleum products by all transport modes over the period 1971-72 to 1986-87. The modal shares of the hydrocarbon movements task have been estimated together with the average growth rate of movements by each mode for that same period. Some origin-destination analysis has been undertaken with analyses of coastal shipping and pipeline movements being the most recent. Annually aggregated tonnages moved by the separate transport modes are the primary focus of this study. This study examines petroleum product movements up to 1986-87 and growth rates have been derived for each of the modal tasks up to this date. No forecasting of future movements shares, which would use these growth rates, is attempted.

Information Paper 31
Transport of Hydrocarbons in the Oil and Gas Industries

@ Comnonwealth of Australia 1989
ISBN 0 644 09416 8 ISSN 0158-104X
This work is copyright. Apart from any use as permitted under the Copyright Act 1968, no part may be reproduced by any process without written permission from the Director Publishing and Marketing AGPS. Inquiries should be directed to the Manager, AGPS Press, Australian Government Publishing Service, G.P.O. Box 84, Canberra, A.C.T. 2601.
Printed in Australla by Union Oflset CO Pty Ltd. Canberra

ABSTRACT
Raw and refined petroleum products are vital to the functi'oning of the Australian economy. This study examines the distribution of these raw and refined products in Australia i n the period 1971-72 tom 1986-87.
Road, rai 1 , coastal vessel and both reffned and crude pipe1 ine tasks are examined as well as their respective modal shares. These shares were distributed across pipelines with a 42.7 per cent share, road transport with a 39.6 per cent share, coastal shipping with a 14.6 per cent share, and rail with a 3.1 per cent share of the total task.
Road transport is dominated by articulated tankers mainly operating within capital cities. Forty per cent of the coastal s'hipping task involves the transport of crude oil and refined products. In Australia there are 13 000 kilometres of pipelines. Ten thousand kilometres of this pipeline network transports the fifteen billion cubic metres of natural gas consumed by Australian users:. Transport of petroleum by rail, although small, has continued to grow as a proportion of the total petroleum transport task.
The transport of petroleum products is also modified by a series of distribution arrangements which reduce the need for long distance flows. These arrangements include refinery exchange, borrow and loan practices and the transport freight subsidy scheme.
i i i

FOREWORD
This Information Paper was originally prepared for and presented at the Australian Institute of Petroleum's Conference, 'From Reservoir to Retailer', held in Adelaide in September 1988. The original Paper has now been expanded with additional information provided through industry discussions.
A comprehensive outline of the national hydrocarbon movements task is presented and current modal transport shares for this industry, whose logistic operations support both the Australian passenger and freight transport tasks of the Australian economy, are examined.
The analysis, research and preparation to this Paper was undertaken by Mr Kim Hassal 1. The assistance of many industry sources and the Australian Institute of Petroleum is gratefully acknowledged.
M. J. TAYLOR Research Manager
Bureau of Transport and Comnunications Economics Canberra March 1989
V

ACKNOWLEDGEMENTS
Grateful appreciation is extended to all the following contact organisations who supplied information vital to the compilation of this Information Paper.
ACT Motor Registry (Department of Territories)
Amp01 Ltd.
Ansett (WA), A Division of Ansett Transport Industries (Operations) Pty. Ltd.
Australian Bureau of Statistics
Australian Institute of Petroleum Limited (Melbourne)
Australian National Railways (Alice Springs)
B.H.P. Petroleum Ltd
BP Australia Limited
(Northern Territory
Bureau of Mineral Resources, Geology and
Caltex Oil (Australia) Pty. Limited
Department of Defence
Geophysics
Fuels and Lubricants Branch (Maribyrnong)
Department of Mines and Energy South Australia
Department of Primary Industries and Energy Petroleum Legislation Branch
Department of Transport and Comnunications Land Transport Division Shipping Information Branch
vi i

Department of Transport, South Australia
Department of Transport, Western Australia
Esso Australia Ltd
Inland Refiners Pty Ltd
Mobil Oil Australia Ltd
Moonie Oil Pty Ltd
Prices Surveillance Authority (Melbourne)
Queensland Department of Transport
Queensland Rai 1
Railway Industry Council
R. A. Pearson and Associates
The Pipe1 ine Authority
The Shell Company of Australia Limited
Transport Workers' Union (Melbourne)
v i i i

CONTENTS
ABSTRACT Page i i i
FOREWORD V
ACKNOWLEDGEMENTS vi i
CHAPTER 1 SUMMARY AND OVERVIEW 1
CHAPTER 2 TRANSPORT BY ROAD Vehicle fleet composition Current road regulations and possible future directions
CHAPTER 3
CHAPTER 4
CHAPTER 5
CHAPTER 6
CHAPTER 7
APPENDIX I
7 8
9
TRANSPORT BY COASTAL SHIPPING 15 Regulatory effects 18 Cabotage: a long-term coastal regulation 18 The import and export task 19
TRANSPORT BY PIPELINE 21 Refined product pipelines 21 Raw product pipel ines 21 Natural gas pipel ines 22 Refined product pipeline development 29
TRANSPORT BY RAIL The rail task
31 31
OTHER DISTRIBUTION ARRANGEMENTS 35 Refinery exchange 35 Borrow and loan practices 36 Petroleum products freight subsidy scheme 36
FUTURE DEVELOPMENTS OF HYDROCARBON TRANSPORT 39
THE DEREGULATED OIL MARKET 41
ix

APPENDIX I1 SELECTED SHIPPING MOVEMENTS, 1986-87
APPENDIX I11 RAIL ORIGIN AND DESTINATION MOVEMENTS, 1975-76 AND 1979-80
APPENDIX I V BACKGROUND STATISTICS
BIBLIOGRAPHY
ABBREVIATIONS
Page 43
53
57
65
69
X

TABLES
1.1
1.2
1.3
1.4
2.1
2.2
2.3
2.4
2.5
2.6
3.1
4.1
4.2
4.3
Current domestic raw and refined petroleum products: modal transport shares, 1986-87
Generalised modal connections flow
Sunary of petroleum movements by mode
Regional nature of petroleum movements
Movements of hydrocarbons by road: tonnes carried, 1985
The growth in Austra
Division of road hau
Resources devoted to 1985
1 ian petroleum road haulage
lage by vehicle type, 1985
road hydrocarbon movements,
The growth in Australian interregional articulated truck movements
State restrictions operating on larger tanker vehicles, July 1988
Growth of petroleum bulk liquids: movements by domestic coastal shipping to 1986-87
Indigenous crude oil movements from production site, 1985 to 1988
The Australian feedstocks pipeline task to 1987'
Lengths of major non refined prodact pipelines by State, 1987
Page
1
5
6
6
10
12
12
13
13
14
20
25
26
26
xi

Page 27 4.4
4.5
Selected major natural gas pipelines
Reticulated pipelines i n urban centres by State, 1985-86 28
28 4.6
5.1
The Australian natural gas pipeline task to 1987
National rail haulage of petroleum related products by carrier, 1986-87 32
5.2 National rail haulage of bulk liquid products to 1986-87 32
11.1 Import of major hydrocarbons by selected ports, 1986-87 44
11.2 Export of major hydrocarbons by selected ports, 1986-87 45
46 11.3
11.4
Australian-flagged petroleum vessels, 1988
Destination and origin of hydrocarbons by port: discharged interstate, 1986-87 47
11.5 Destination and origin of hydrocarbons by port: discharged intrastate, 1986-87 52
54
55
58
58
59
60
111.1
111.2
IV. 1
IV.2
IV.3
IV.4
IV.5
Selected rail bulk liquid corridors, 1975-76
Selected rail bulk liquid corridors, 1979-80
Background statistics: products
Background statistics: vehicles, population
Service station statistics, 1985-86
Australian refinery capacity, 1 July 1987
Production of selected refined products, 1984-85 and 1986-87 61
61 IV.6
IV.7
Imports and exports of refined products, 1986-87
Total final energy demand by major fuel type and consuming sector: Australia, 1985-86 62
63 IV.8 Petroleum demand by sector to 1999-2000
xi i

FIGURES
1.1 The hydrocarbons transport task
3. l Major coastal discharges of feedstocks
3.2 Major coastal discharges of refined petroleum products
4.1 Crude oil movements from field by transport mode, 1987-88
4.2 Natural gas pipelines in Australia
6.1 Operational borrow and loan terminals
Page 4
16
17
23
24
37
x i i i

CHAPTER 1 SUMMARY AND OVERVIEW
Raw and refined petroleum products are vital to the functioning of the Australian economy. In 1985-86, half of the total final energy demand i n the Australian economy was met by refined petroleum products. Natural gas satisfied a further 16 per cent of that demand. Revenue from government excises has provided about 11 per cent of Comnonwealth receipts since 1983-84. Petroleum products used by the transport industry is the principal fuel supporting the transport of coal, iron ore and grain both nationally and internationally. By the year 1990, some 250 000 international and domestic jet movements to capital cities alone are forecast to carry both international and domestic passengers and tourists. As hydrocarbon fuels support all, sectors and industries of the national economy, the distribution systems for these fuels can be considered as major national energy arteries.
This Paper is an exploratory attempt to examine the distribution of raw and refined petroleum products by all transport modes over the period 1971-72 to 1986-87. The modal shares of the hydrocarbon movements task have been estimated together with the average growth rate of movements by each mode for that same period. Some origin- destination analysis has been undertaken with analyses of coastal shipping and pipeline movements being the most recent. All movements mentioned in this Paper refer to tonnages and not to vehicle movements. The frequencies of vehicle movement services have not been examined. Annually aggregated tonnages moved by the separate transport modes are the primary focus of this study.
This study examines petroleum product movements up to 1986-87 and growth rates have been derived for each of the modal tasks up to this date. No forecasting of future movements shares, which would use these growth rates, is attempted. This is because important data are not available on:
. the effects of the 1988 oil industry deregulation policies and their impact on the coastal shipping task (see Appendi'x I); and
1
BTCE Information Paper 31
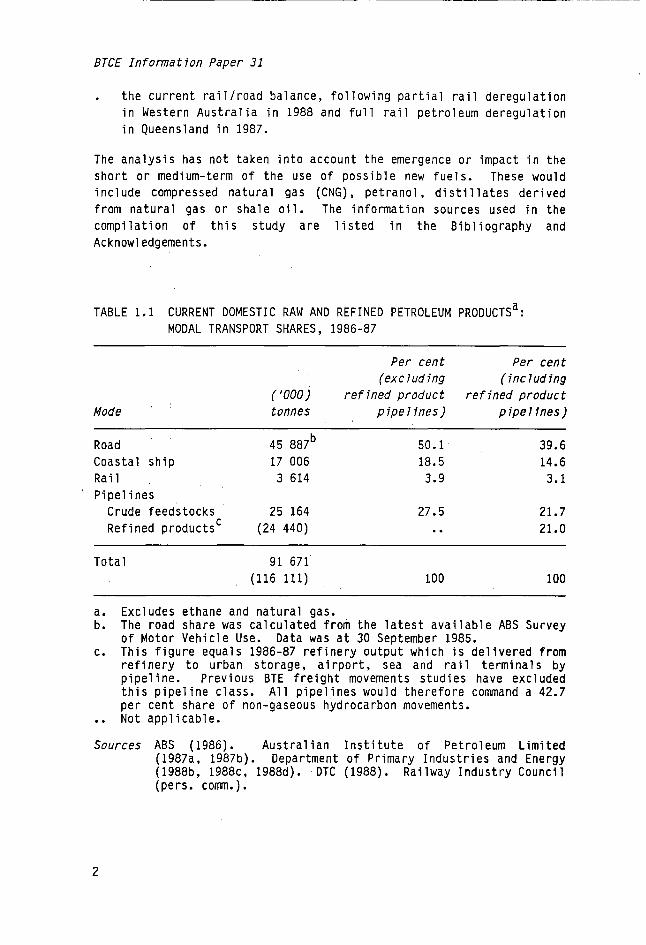
. the current rail/road balance, following partial rail deregulation i n Western Australia in 1988 and full rail petroleum deregulation in Queensland in 1987.
The analysis has not taken into account the emergence or impact in the short or medium-term of the use of possible new fuels. These would include compressed natural gas (CNG), petranol, distillates derived from natural gas or shale oil. The information sources used in the compilation of this study are listed i n the Bibliography and Acknowledgements.
TABLE 1.1 CURRENT DOMESTIC RAW AND R E F I N E D PETROLEUM PRODUCTS~: MODAL TRANSPORT SHARES, 1986-87
Per cent Per cent (exc l ud ing (including
('000) refined product refined product Mode tonnes pipe l ines) pipe 7 ines)
Road 45 887b Coastal ship 17 006 Rai 1 3 614 Pi pel i nes
Crude feedstocks 25 164 Refined'productsC (24 440)
50.1 18.5 3.9
27.5 ..
39.6 14.6 3.1
21.7 21.0
To ta 1 91 671 (116 111) 100 100
a. Excludes ethane and natural gas. b. The road share was calculated from the latest available ABS Survey
of Motor Vehicle Use. Data was at 30 September 1985. c. This figure equals 1986-87 refinery output which is delivered from
refinery to urban storage, airport, sea and rail terminals by pipeline. Previous BTE freight movements studies have excluded this pipeline class. All pipelines would therefore command a 42.7 per cent share of non-gaseous hydrocarbon movements.
.. Not applicable.
Sources ABS (1986). Australian Institute of Petroleum Limited (1987a, 1987b). Department of Primary Industries and Energy (1988b, 1988c, 1988d). DTC (1988). Railway Industry Council (pers. corn.).
2

Chapter 1
Table 1.1 demonstrates the primacy of road and the combined crude and refined product pipeline effort in transporting petroleum products in Australia. These modes account for 39.6 per cent and 42.7 per cent respectively of the hydrocarbon transport task. If, however, the refined product pipeline task is considered more as an 'intermediate' distribution mode, essentially being a 'refinery extension' whose operations cease where terminal distribution begins, then road movements dominate the national task with a 50 per cent, share of all petroleum-based hydrocarbon movements. Though generally true, it is not appropriate to treat all refined product pipelines as refinery extensions'. There are significant exceptions, for example, the Sydney to Newcastle product line.
Natural gas movements are considered separately and are; not included in Table 1.1. This is because this comnodity is served by its own dedicated pipeline infrastructure and this infrastructure does not compete with other transport modes for its delivery.
Coastal shipping i s the third largest mode for hydrocarbons transport with an 18.5 per cent share of the total task. This i's nearly five times greater than the 3.9 per cent.share held by rail systems.
Figure 1.1 presents a simplified overview of the complete hydrocarbons transport task in Australia and Table 1.2 depicts the modal interconnections i n this system.
These interconnections represent the use of various single modes and modal combinations to move hydrocarbons from a current location to the next node i n the movements flow. Table 1.2 outlines the most comnon combinations of modes used in the national hydrocarbon movements progression. 'Terminal ' in this table refers to all types of terminal and not just to major distribution terminals. 'Consumer' is used synonymously with retail site or outlet. The terminal (node 4) to consumer (node 6) connection can be direct i n some instances, the most notable being tankers operating from terminals directly to service station.
3

BTCE Infonnat ion Paper 31
U +
L
C E c
0
c, 0 Q
L
“p
c,
v)
L 0 Q
X
al h
U
a,
L 3
0
v
Y
v)
c,
ed U L 0 a
v)
c
c,
e .c Q)
l-
.r L
LLQ
4

Chapter 1
TABLE 1.2 GENERALISED MODAL CONNECTIONS FLOW
Des t ina t ion
Current 2 3 4 5 6 location Storage Refinery Tenninal Depot Consumer Export
1 Field
2 Storage 3 Refinery 4 Terminal
5 Depot
6 Overseas
Pipe Pipe Road Sea/pipe Road/pipe Pipe/ rai 1 Pipe/ road .. Pipe .. .. .. ..
.. ..
Sea/pipe ..
.. ..
.. .. Pipe Pipe .. Road
Rai 1 Sea/Pipe
.. ..
Sea/pipe Sea/pipe
Pipe/sea Sea
Pipe/sea
Pipe/sea
Pipe/ai r Pipe/sea
Pipe/air
..
.. .. Not applicable.
Notes 1. Mode l/mode 2 indicates mode 1 is employed in conjunction with and followed by mode 2.
2. Parentheses indicate hypothetical connections.
Source BTCE interpretation.
5

BTCE Informat ion Paper 31
TABLE 1.3 SUMMARY OF PETROLEUM MOVEMENTS BY MODE
Mode ('000 tonnes)
Coas ta l sh ip Natura l ga S
Total bulk (mi l l ion Year Road Crude l iqu id Pipe l inea Rail cu.m)
1971-72 31 577 na 16 717 15 898 2 022 na 1975-76 35 240 na 18 168 20 520 2 601 na 1979-80 na na na na 2 794 na 1981-82 na 9 398 na na na 11 550b 1985-86 45 887 11 400 17 600 na na 14 714b 1986-87 na 12 610 17 006 25 164' 3 614 15 032'
Growth rate (per cent) 2.9 5.9 0.0 3.0 3.9 5.4
a. Crude oil , LPG and condensate. b. Calendar year applies, that is, 1982 and 1986 respectively. c. 1987 figure. na Not available.
Sources ABS (1986). Australian Institute of Petroleum Limited (1987a, 1987b). BTE (1976, 1978, 1979, 1983). Department of Primary Industries and Energy (1988b, 1988c, 1988d). Railway Industry Council (pers. corn.). Travers Morgan (1986).
TABLE 1.4 REGIONAL NATURE OF PETROLEUM MOVEMENTS
Mode Reg iona l service State service
Road Rai 1 Sea Pi pel i ne
Intraregional Intrastate (intracapital) Interregional Intrastate Interregional Interstate/overseas Interregional Inter/intrastate
Source BTCE interpretation.
6

CHAPTER 2 TRANSPORT BY ROAD
Road transport carries nearly 40 per cent of all non-gaseous hydrocarbons transported in Austra1ia.l This figure includes products transported not only by rigid and articulated tankers but also by panel vans and utilities. As such, it includes some element of transport from retailers by particular consumers, as well as from producer to retailers.
For the purpose of the present study, no attempt has 'been made to produce a detailed origin-destination analysis of road transport movements although such a detailed analysis has been attempted for the transport of non-gaseous hydrocarbons by other modes (see Appendixes I1 and 111). Instead, transport by road has been approached by defining vehicle movements as either intra or interregilonal.2 This approach has been adopted because 68 per cent of all road movements are in fact intraregiona13 involving product movemen'ts within a particular Statistical Division or region. Indeed, some 56 per cent of intraregional movements occur within State capital cities.
This same pattern is reflected in service station retail' sales (Table IV.5) which show that u p to 70 per cent of product sales are within capital cities. These figures, in turn, reflect the amounts of refined product which must be moved to these retail sales outlets i n order to satisfy urban demand.4 In fact, product sold through service
1. This figure may in fact increase when the 1988 ABS Survey of Motor Vehicle Use is released. The latest survey's preliminary finding will be released in April 1989.
Census of Population and Housing, 30 June 1971. This'remains consistent with regions used in BTE 1976 and 1978.
3. The ABS categories of 'within capital city of state of registration' and 'outside capital city and within 100 km of base' were adopted as proxy intraregional estimators.
4. For estimation of aggregated intraregional movements it is assumed that all interregional deliveries by road, rail and sea will then be moved intraregionally by road. Urban movements can then be estimated from these interregional movements to non capital city areas by all of these non-road modes.
2. Region refers to the statistical subdivisions as used i n the
7

BTCE Infonnat ion Paper 31
station outlets in capital cities accounted for 61.2 per cent of all service station retail sales.
The essence of road hydrocarbon movements is encapsulated in Table 2.1. Three salient facts that emerge from the data of this table are that:
. Total road movments in 1985 were higher, by a factor of 1.8, than total refinery production i n 1985-86 (Table IV.4). Thus, temporarily disregarding distribution by rail or coastal shipping, the road task alone moved almost twice the total national refinery equivalent output for that period. The implication of these figures is that considerable double handling occurs in road transport activities.
. The size of the intraregional task, which is approximated by the combined 'intracapital and Iwi thin 100 km of base, non capital I
data categories (see footnote 3), is 68 per cent of all road movements.
. Total interstate road movements accounted for only 3.5 per cent of total road movements, reflecting the very strong intrastate nature of the road task.
Table 2.2 shows how this road haulage task has changed. In the period 1971-72 to 1985 tonnages hauled increased at a steady 2.9 per cent per annum.
VEHICLE FLEET COMPOSITION
As can be seen in Table 2.3 and Table 2.4, the composition of the vehicle fleet used to haul petroleum products in no way reflects the magnitude of the task borne by different classes of vehicle.
The ratio of util ities to articulated trucks is approximately inversely proportional to the ratio of the respective tonnages of petroleum products carried. The figure for utilities and panel vans is a utility and panel van resource figure. That is, if 100 panel vans a1 1 spend 1 per cent of their time carting petroleum products this is equivalent to 1 panel van being dedicated to fuel product cartage. Table 2.4 does imply that there are 64 566 panel vans and util i ty equivalent resource units used for petroleum movements. As shown in Table 2.3, articulated trucks have the greatest share of the road haulage task.
Table 2.5 outlines the growth rate i n the tonnages carried by inter- regionally bound articulated trucks over the analysis period. This was a high 14.6 per cent per annum.
8

Chapter 2
The resources devoted to the manning of petroleum tankers have been estimated by the Transport Workers' Union to be 3000 employee drivers. Some 1500 of these are directly employed by the petroleum companies with an equivalent number being employed by company agents and contractors.
CURRENT ROAD REGULATIONS AND POSSIBLE FUTURE DIRECTIONS
Rail deregulation i n Queensland in 1987 and partial deregulation in Western Australia in 1988 heralded a changing climate for future road petroleum transport. Non economic constraints on road transport still exist in the form of State government regulation of the types of truck used in petroleum haulage. Table 2.6 outlines the current restrictions i n each State regarding the use of either B-Doubles or road trains.
The National Association of Australian State Road Author,ities (1985) Review of Road Vehicle Limits recomnended an increase i n road vehicle mass limits to 42.5 tonnes. The 77th Australian Transport Advisory Council (ATAC) meeting, in September 1988, endorsed the raising of vehicle weight limits to this 42.5 tonne level. ATAC also proposed that State legislation be in place by 1 January 1989 and that this legislation be enacted by 1 July 1989. Further to this, ATAC proposed that the current system of State permits for heavier vehicles be phased out thus securing a uniformity across State vehicle regulations.
Also of great importance to any argument supporting the economic gains and efficiencies associated with higher vehicle Inass li'mits is the acceptance of the greater road damage that results from allowing higher mass limits. Road damage is strongly related to the pressure exerted through axle loadings. Therefore, raising allowable mass limits will increase road damage directly. However, an important question which must be now addressed, as 42.5 tonne 1 imi ts are established, is whether consideration should be given to the introduction of those currently non-standard vehicle types whose axle configurations will cause less road damage than standard six axle articulated trucks hauling 42.5 tonnes. The B-Double i s a good example of such a medium combination vehicle (MCV). B-D,oubles being considered will be a two trailer and prime mover combination up to 23 metres i n length supported by eight axles. The potential for such a vehicle type has been supported by the recomnendations of the Royal Comnission into Grain Storage, Handling and Transport (19188), as well as being acknowledged by the 1988 Victorian Road Freight Transport Industry Council Task Force findings on B-Doubles. This Task Force was convened by the Victorian Minister of Transport. State support
9

F 0 TABLE 2.1 MOVEMENTS OF HYDROCARBONS BY ROAD: TONNES CARRIED, 1985
( '000 tonnes)
Region
Outside Outside Between capital capital capital
Within capital city city city city of State (100 km >l00 km and rest
Vehicle type of registration of base of base of State Intercap
Other Other interstate interstate
(100 km >l00 km ita l of base of base Total
Petroleum and petroleum products
Uti 1 i ty and panel van 164 1 132 112 21 2 143 4 1 559 Rigid truck 4 439 7 052 902 316 8 65 21 12 803 Articulated truck 9 168 3 080 5 299 5 123 80 69 1 068 23 887
Total 13 771 11 245 6 313 5 460 90 277 1 093 38 249

TABLE 2.1 (Cont.) MOVEMENTS OF HYDROCARBONS BY ROAD: TONNES CARRIED, 1985 ( '000 tonnes)
Region
Outs ide Outs ide Between capital capital capital Other Other
Within capital city city city interstate interstate city of State <l00 km >l00 km and rest <l00 km >l00 km
Vehicle type of registration of base of base of State Intercapital of base of base Total
Other fuel productsa
Uti 1 i ty and panel van 72 129 115 1 - - - 317 Rigid truck 750 1 664 105 2 17 - 1 - 2 737 Articulated truck 2 831 699 699 252 33 - 70 4 584
Total 3 653 2 492 919 470 33 1 70 7 638
Total 17 424 13 737 7 232 5 930 123 278 1 163 45 887
a. LPG and other liquified gases. - Nil.
Note Due to rounding figures may not add to totals.
Source ABS (1986).

BTCE Informat ion Paper 31
for the future introduction of B-Double operations differs widely. Views range across questions of allowability, the continuance of associated permit systems, the relegation of vehicle operations to specific routes, and safety considerations. Safety issues were addressed by the Inter-State Commission (ISC 1988) which raised no undue safety concerns in relation to B-Double operations.
Industry reaction to future allowable load increases of up to 4 tonnes per vehicle has been unquestionably favourable, with potential efficiency gains far outweighing possible vehicle registration increases.
TABLE 2.2 THE GROWTH IN AUSTRALIAN PETROLEUM ROAD HAULAGE
Year (‘000 tonnes)
1971-72 1975-76 1985
31 576 35 240 45 887
Total period growth rate (per cent) 2. 86a
a. Compounded over 53 financial quarters, this is, 13.25 years.
Sources ABS (1986). BTE (1976, 1978).
TABLE 2.3 DIVISION OF ROAD HAULAGE BY VEHICLE TYPE, 1985 (per cent)
Vehicle type Total fleet Tonnage movements
Uti 1 ities and panel vans
Rigid trucks
Articulated trucks
65.0
31.3
3.7
4.1
33.9
62.0
Sources ABS (1986). BTCE estimates.
12

Chapter 2
TABLE 2.4 RESOURCES DEVOTED TO ROAD HYDROCARBON MOVEMENTS, 1985
Number of vehicles
Petrolem Veh ic le type products Other fue Is Total
Uti 1 i ties and panel vans 64 566 9 641 74 207
Rigid trucks 2 axles 3 axles >3 axles
27 209 1 815 1 153
4 643 483 293 35 596
Articulated trucks <5 axles 619 84 5 axles 642 120 6 axles 2 106 269 >6 axles 37 1 17 4 228
Total 38 481 15 550 114 031
Source ABS (1986).
TABLE 2.5 THE GROWTH IN AUSTRALIAN INTERREGIONAL ARTICULATED TRUCK MOVEMENTS
Year ('000) tonnes
1971-72 2,087 1975-76 3'680 1985 12 8693
Total period growth rate (per cent) 14. 6a
a. Compounded over 53 financial quarters, that is, 13.25 years.
Sources ABS (1986). BTE (1976, 1978).
13

BTCE Informat ion Paper 31
TABLE 2.6 STATE RESTRICTIONS OPERATING ON LARGER TANKER VEHICLES, J U L Y 1988
State Vehicle type State restrictions
New South Wales
Victoria
Queensland
South Australia
Western Australia
Tasmania
Northern Territory
B-Doubles Tripl esa
B-Doubl es Triples
B-Doubles Tripl es
B-Doubl es
Triples
B-Doubles Tripl es
B-Doubles Tripl es
B-Doubles Tripl es
Constrained to specific routes Restricted to permitted routes (outback NSW). Permits required
Vehicles of 41 tonnes require permits Not allowed
Permits required for specific routes Permitted i n Western Queensland
Permits required. Restricted to specific Adelaide and rural routes Restricted routes north from Port Augusta. Permits required
Restrictions to major ci tites Permits required
Not a1 1 owed Not a1 1 owed
Operations allowed except in Darwin No permits required. These conditions applicable for both vehicle types
a. Road trains.
Sources DTC (pers. corn.). ISC (1987).
14

CHAPTER 3 TRANSPORT BY COASTAL SHIPPING
In 1986-87, domestic coastal shipping carried approximately 17 million tonnes of crude and refined petroleum products around Australia. Coastal shipping carried the third largest share of hydrocarbons and is responsible for hauling tonnages nearly five times greater than those handled by rai 1 (Table 1.1). Refined and crude petroleum movements were responsible for 39 per cent of the entire coastal shipping task. The task is undertaken by seventeen vessels which include two LPG carriers, seven crude tankers, six product tankers and two crude/product tankers (see Table 11.3).
These vessels are not, however, restricted to the coastal domain. Recently, the B.P. Achiever successfully negotiated the Gulf of Hormuz, escorted by a British war'ship, and returned from what may herald a future more active role for Australian vessels in the import and export trade.
Unlike other modes, the growth rate of hydrocarbon tonnages moved by coastal shipping has remained close to zero over the fifteen-year period from 1971-72 to 1986-87. There have been, hlowever, both positive and negative deviations from the 1986-87 figure. Despite this fact, there has been a nearly 6 per cent per annum increase in the haulage of crude oil by coastal vessels over the period 1980-81 to 1986-87 (Table 3.1). The overall zero growth in the coastal shipping task therefore implies that refined petroleum product movements have declined at 6 per cent per annum over this period. Given that total refinery production and aggregate product consumption has not changed at this same rate over the past six years, it can be 'assumed that coastal shipping has, i n fact, lost its share of the refined product haulage at the rate of 6 per cent per annum, to either other modes of transport or to imports. Coastal discharges of feedstocks and refined products are shown i n Figures 3.1 and 3.2 respectively.
15

Tas Po'rQHobart
Source DTC (1988) pers. corn.
Figure 3.1 Major coastal discharges of feedstock (l000 tonnes)

Chapter 3
L 0
LL
n i
W
z 0
17

BTCE Information Paper 31
REGULATORY EFFECTS
With the Federal Government's oil industry deregulation on l January 1988 came the end of the Crude Oil Allocation Scheme and, therefore, the Bass Strait Coastal Freight Adjustment rebate. Refiners were no longer required to use Bass Strait crude or any other indigenous crude feedstocks. The market was freed for refineries to 'shop-around' for better crude oil deals.
As transport from Bass Strait is no longer subsidised, some refineries, in future, may choose crude imports over indigenous crude hauled by coastal ship. The possible effects on coastal shipping of this oil industry deregulation may be that:
. both imports and exports will increase;
. Australian-flagged vessels will start to compete in the import export trades;
. coastal movements of crude oil will lessen; and
. coastal movements of refined product may lessen unless Austra vessels become competitive with foreign import vessels.
and
1 ian
Therefore, despite the Ships Capital Grants Act 1987 (Cwlth) and the associated ship replacement investment incentives, coastal vessels, handling indigenous crude and refined products, will be required to be increasingly competitive with foreign vessels handling the potentially growing crude and refined import tasks. The most recent data on coastal shipping flows for the movements of hydrocarbons around Australia are contained in Appendix 11. However, the impact of regulatory changes on coastal shipping and import patterns may not be reflected in data sources until 1989.
CABOTAGE: A LONG-TERM COASTAL REGULATION
Foreign vessels are prohibited from operating in the Australian coastal trade unless they obtain a single voyage permit (SVP).
An SVP may only be issued when:
. no licensed ship is available to perform the service;
. the service carried out by a licensed ship or ships is inadequate to meet the needs of a port or ports; and
. the Minister of Transport and Comnunications is satisfised that it is desirable, in the public interest, that an unlicensed ship be allowed to engage in that trade.
18

Chapter 3
In 1986-87, 26 shipments (61 000 tonnes) were licensed ,under the SVP system. The dominant cargoes were phosphate rock and caustic soda. No petroleum products were carried under these conditions. Since deregulation of the oil industry, however, an application has been made to the Department of Transport and Conunications (DTC) for a petroleum SVP.
The practice of cabotage is not peculiar to Australia and affects industries other than the oil industry. It is mentioned here because it forms an important part of the regulatory framework affecting coastal petroleum movements which are a significant part of the total coastal task.
THE IMPORT AND EXPORT TASK
Since 1985-86, Australia's three major sources of petroleum product imports have been Saudi Arabia and Kuwait (supplying crude oil and feedstocks) and Singapore (which was the largest refined product exporter to Australia).
Australia's two largest export destinations are Japan and the USA, with both absorbing large crude oil consignments. The third largest export market was the supply of fuel oil and avtur to1 foreign-owned ships and aircraft outward bound from Australia.
In 1986-87, shipping was responsible for carrying 5 856, 000 tonnes of petroleum exports and 10 121 000 tonnes of imports. Domestic coastal loadings of hydrocarbons1 amounted to 17 006 000 tonn,es which only just exceeded these combined import and export tonnages. This essentially equated the coastal shipping and import and export tasks as being of similar magnitude.
1. Comnodity categories 3300-3410 were included in coastal totals.
19

h) 0 TABLE 3.1 GROWTH OF PETROLEUM BULK LIQUIDS: MOVEMENTS BY DOMESTIC COASTAL SHIPPING TO 1986-87
('U00 tonnes)
Year Growth rate
Product 1971-72 1975-76 1980-81 1981-82 1982-83 1983-84 1984-85 f985-86 1986-87 (per cent)
Crude oil and feedstocks na na 8 960 8 398 8 345 10 401 10 513 11 400 12 610 5.9 ' Total bulk
2 P 2
liquid (assumed to 1 oadi ngs 16 717 18 168 na na na na na 17 600 17 006 be zero)
na Not available.
Sources BTCE (1976, 1978). DTC (1988). Travers Morgan (1986).

CHAPTER 4 TRANSPORT BY PIPELINE
Three types of pipeline are considered in this study: . refined product pipelines usually connecting refineries to
distribution terminals;
. raw product pipelines which include crude and other liquid pi pel i nes ; and
. natural gas pipelines comprising major delivery 'pipelines and reticulated mains pipelines.
REFINED PRODUCT PIPELINES
This class of pipeline is generally not considered in modal movements analyses as calculations usually begin with movements emanating from terminal operations sites. Considering just two examples, namely the North Geelong to Newport and the Sydney to Newcastle refined product lines, it seems logical, that such modes of delivery should be incorporated into an analysis of petroleum products transport. An upper bound on movements of such refined petroleum produlcts can be set at the level of refinery output. This was done i n intr!oductory Table 1.1.
In 1986-87, such refined product pipe1 ines serving either rai 1 , airport, sea, intra or interurban storage terminals woumld, therefore, have accounted for some 21 per cent of the petroleum transport task. This is despite the fact that upon delivery to the termi'nal site these products would be loaded onto another transport modle. If these assumptions are valid, then the task handled by refined product pipelines is totally dependent upon refinery production levels and, over the period 1977 to 1986, declined by less than 1 per cent per annum.
RAW PRODUCT PIPELINES
To estimate the movements of raw petroleum products by pipe.line, production fields which depend on pipelines for the removal of raw
21

BTCE Information Paper 31
products from field sites have been identified. These fields included Gippsland, Moomba, Jackson, Moonie, Mereenie and Blina/Sundown.
Crude oil shipments by road from Eromanga also augmented tonnages at Jackson and Moonie. Transfers of crude from pipelines to road occurred 29 kilometres from the Blina/Sundown fields, destined for Broome, whilst transfers from pipelin,e to rail occurred at Alice Springs, destined for Adelaide. Other pipeline origin-destinations are outlined i n Table 4.1.
Even though, over the 15.5 years that crude oil movements have been examined i n this analysis pipeline tonnages of raw liquids increased by 3 per cent per annum, it should'be noted that tonnages carried by this mode are totally dependent on field production (see Table 4.2). This means that the total raw product tonnage carried by pipelines is very sensitive to Gippsland production levels. (The transport movements from all field sites are shown in Figure 4.1). Currently, Gippsland produces around 75 per cent of Aus.tralia's total crude, condensate and naturally occurring liquefied petroleum gas (LPG). With production expected to drop considerably in this basin by the mid-l990s, raw product pipeline tonnages can also be expected to fall. This however, will however, be compensated for by increased imports which will still require pumping from ports to refineries.
NATURAL GAS PIPELINES
The infrastructure involved with natural gas deliveries accounts for over 10 000 kilometres of inter and intraregional connections and almost 50 000 kilometres of urban reticulated pipelines (see Tables 4.3 and 4.5). The major Australian networks, and proposed extension to those networks are shown in Figure 4.2. The three largest Australian natural gas production fields are Moomba, Gippsland and the North-West Shelf respectively (see Table 4.4). Exports of liquefied natural gas (LNG) will occur in 1989, operating from the North-West Shelf to Japan. It is expected that there wi 1 1 be three Australian LNG tankers forming part of that operational fleet, effectively introducing a new transport mode into the hydrocarbons transport task.
22

Chapter 4
h
.G
L 0
=la
X
L a
.r rd
nw
m
m
i-
d
23

North Ranki n
Gippsland Basin
Note The proposed pipeline from Dampier to Palm Valley is considered to be a longer term possibility only. The other proposed pipelines are considered to be short to medium term projects.
Sources DPIE (1988a) (adapted). Mount Isa Mines, pers corn.
Figure 4.2 Natural gas pipelines i n Australia
+ 5 'h
A Gas production S 0 Potential production nl
rt
D Y.
Pipeline, existing or under construction 2
Possible pipeline
..e..- Options under evaluation
2 2 5 "_

TABLE 4.1 INDIGENOUS CRUDE OILa MOVEMENTS FROM PRODUCTIOEl SITE, 1985 TO 1988
Year ( '000 tonnes)
Distance Field/site Destination Mode (h) 1985 1986 1987 1988
Gippsland Barrow Island Moomba Jab1 ru Eromanga' Eromanga Jackson Moonie Dongara Blina/Sundown Northern Highway Broome Mereenie Alice Springs Adelaide
~~ ~
Westernport Coastalloverseas Port Bonython Overseas Jackson Moonie Mooni e Brisbane Kwi nana Northern Highway Broome Fremantle Alice Springs Adelaide Port Stanvac
Pipel ine Sea tanker Pi pel i ne Sea tanker Road Road Pipel ine Pipel i ne Road Pipeline Road Sea tanker Pipeline Rai 1 Road
330 various
659 various
180 1 000 780 306 409 29 34
2 226 270
1 555 44
21 911.0 938.4 988.8 0.0 na na
894.0 972.0 5.9 34.5 31.5 34.5 104.7
na na
17 792.0 893.8
1 181.0 253.7
na na na na 7.5 50.1 50.1 na
158.5 na na
18 565.0 815.0
1 040.0 962.5
na na
1 184.5 1 246.2
6.3 27.7 27.7 na
119.0 na na
na na na
1 540b na 217d na na na na na na
93.0 93.0 93.0
a. Excludes condensate and naturally occurring 1.PG. b. Based on expected sustained rate of production of 35 500 b/d. This was only achieved in May 1988. Flows
c. 217 000 tonnes from Erornanga is presented as a total only and not broken down into the individual links to
d. Based on current daily movements to Jackson and Moonie of 4700 b/d. .na Not available.
Sources BTCE (1987). Department of Primary Industries and Energy (pers. corn.).
were 29 000 b/d pri~or- to May.
Jackson and Moonie.
N VI
m rt 5

BTCE Informat ion Paper 31
TABLE 4.2 THE AUSTRALIAN FEEDSTOCKS PIPELINE TASK TO 1987 ( '000 tonnes)
Year Growth rate
Feedstock 1971 -72 1975-76 1984-85 1987 (per cent)
Crude oil , LPG and condensate 15 898 20 520 23 062 25 164 3.0a
a. Estimated over 15.5 years.
Sources BTE (1976, 1978). Department of Primary Industries and Energy (1988b, 1988c, 1988d).
TABLE 4.3 LENGTHS OF MAJOR NON REFINED PRODUCT PIPELINES BY STATE, 1987
(kilometres)
Onshore Offshore
Crude Natura l Crude Natura l State oil Othera gas oil Other gas rota l
~~~
NT 270.0 - 1 802.8 - - - 2 072.8 WA 39.3 1.0 2 335.8 10.0 - 134.0 2 520.1 SA 64.2 760.3b 1 217.4 - - - 2 041.9 Vi c 87.2 768.1' 1 986.7 198.5 122.7 108.7 3 271.9 Qld 1 106.0 28.0 589.0 - - - 1 723.0 NSW - - 2 036.0 - - - 2 036.0
Total 1 566.7 1 557.4 9 967.7d 208.5 122.7 242.7 13 665.7 -
a. Includes oil and gas, liquids and other gases and stabilised
b. Includes Moomba to Stony Point carrying liquids. c. Includes Longford to Long Island Point carrying stabilised crude. d. 7234 km are considered as major natural gas pipelines (Department
- Nil.
Sources Bureau of Mineral Resources, Geology and Geophysics (1987). Department of Primary Industries and Energy (1988a).
crude.
of Primary Industries and Energy 1988a).
26

Chapter 4
TABLE 4.4 SELECTED MAJOR NATURAL GAS PIPELINES
Basin product ion,
1987 Length (mill ion
Basin Origin site Destination (km) , cubic metres)
Amadeus Palm Val ley Darwin A1 ice Springs
Bowen Wallumbilla Brisbane Ki ncora Wall umbi 1 la Silver Springs Wallumbilla
Carnarvona North Rankin A Withnell Bay Wi thnell Bay Wagerup
Perth Dongara Pinjarra (incl udes Woodada)
Cooper Moomba Adelaide Wi 1 ton (Sydney)
Ottway Paaratte A1 lansford
Gippsland Snapper Shore to Longford Mar1 in Shore to Longford Barracouta Shore to Longford Longford Dandenong Westernport Dandenong Dandenong West Me1 bourne
1 512 145 246.9
397 53 102 583.6
134 1 482 3 306.2
445 334.1
781 1 300 5 332.5
34 11.6
37/54b 53155 241 32
174 39
361441 82 5 178.8
a. Includes the North-West Shelf. b. Length lllength 2 indicates two pipelines of differing lengths are
available for this origin-destination. ,
Sources Bureau of Mineral Resources, Geology and Geophysics (1987). Department of Primary Industries and Energy (1988b, 1988c, 1988d).
27

BTCE Information Paper 31
TABLE 4.5 RETICULATED PIPELINES IN URBAN CENTRES BY STATE, 1985-86
(‘000 kilometres)
State Ma ins
New South Wales Victoria Queensland Western Australia South Australia Tasmania Australian Capital Territory
13.900 20.834 2.943 6.119 5.549 0.186 0.537
Source Australian Gas Association (1987).
TABLE 4.6 THE AUSTRALIAN NATURAL GAS PIPELINE TASK TO 1987 (mi l l ion cubic metres)
Year Growth rate
1982 1983 1984 1985 1986 1987 (per cent)
11 550 11 915 12 602 13 470 14 714 15 032 5.4
Source Department of Primary Industries and Energy (1988b, 1 9 8 8 ~ ~ 1988d).
The natural gas task, as presented in Table 4.6, has expanded over the past five years at a rate of 5.4 per cent per annum. Up to 1987, the pipeline transport of natural gas has shown the fastest rate of growth in terms of volume of all modes of hydrocarbons transport examined in this study. Factors which will affect the future volume of this task are the growth in urban and industry demand offset by the depletion of natural gas reserves. At sustained current production levels, natural gas reserves will last for another 60 years and will satisfy a 16.7 per cent share of national energy demand at the turn of the century (Department of Primary Industries and Energy 1988a).
In this analysis, natural gas has been measured i n million cubic metres whereas all other hydrocarbons have been measured i n tonnes. To approximately compare these two transport tasks, 1986 natural gas
28

Chapter 4
production of 14 700 mill ion cubic metres was equivalent to crude oi 1 output of 250 000 barrels per day. In the same year, total Australian refinery output was equivalent to 547 200 barrels per day. By implication, natural gas pipeline movements were equivalent to 45 per cent of refinery output. This volume had previously been assumed to be handled by refined product pipelines, and these pipelines accounted for 21 per cent of Australia's non-gaseous hydrocarbon movements.
REFINED PRODUCT PIPELINE DEVELOPMENT
The Victorian Transport Study into the transport of petroleum products (Ministry of Transport Victoria 1980) considered the es'tablishment of refined product pipelines to service major country areas in its review of a1 ternative transport possibil i ties. The comni ttee suggested that the establishment costs of pipeline infrastructure would be offset by the long-term savings in operational resources required 'by either road or rail operations. This is to say nothing of advantages measured by the removal of the social disbenefits associated with very large suburban terminal operations. As well as this, savings i n reduced road and rail accidents, (not mentioning the disruption caused by industrial disputation), can be achieved.
It should be noted, however, that Victoria's major count:ry centres lie somewhat closer to major refineries than is the case for major rural centres in other States. Such geographic considerations~ may well make pipeline developments less economically viable in other States even though the Sydney to Newcastle product line now exists. TNT have proposed a pipeline between Brisbane and Southport but this, as yet, has not been built.
29

CHAPTER 5 TRANSPORT BY RAIL
In this analysis transport by rail refers to those petroleum movements performed by government rail systems. Comnodities carried by non- government rail systems, excluding, iron ore, sugar and,coal accounted for less than 1 per cent of the tonnage hauled by these services. As the petroleum component of these 'other' comnodities would be but a fraction of 1 per cent, any shipments of refined petroleum product by non-government railways have been excluded from this study.
The data cover the period 1971-72 to 1986-87. However, one major problem affects the data on rail freight movements from older 1979 and 1983 BTE sources. In those sources, petroleum is amalgamated with other bulk liquids carried by rail; molasses, acid and water. Petroleum products comprise the vast majority of this bulk liquids group and the data have, therefore, been used as a proxy for petroleum product movements. A rough correction factor has been applied to the total haulage figure by subtracting the Mackay and the Townsville intraregional bulk liquid figures which have been assumed to be for intraregional molasses movements.
THE RAIL TASK
The current pattern of movements, and those for the previous fifteen years, are presented i n Tables 5.1 and 5.2 respectively. Major rail corridors for bulk liquids, (the proxy for refined product movements), are presented i n Appendix I 1 1 for the years 1975-76 and 1979-80 respectively.
Railways carry the smallest share of the Australian hydrocarbons transport task, being responsible for only 3.9 per cent of the national task i n 1986-87. The growth rate of rail petroleum movements for the period 1971-72 to 1986-87 was also 3.9 per cent per annum. This was the highest achieved growth rate of all delivery or distribution modes transporting non-gaseous products; Discussions with industry revealed that rai 1 could still be the preferred mode of transport in some Victorian transport corridors, even under a
31

BTCE Informat ion Paper 31
TABLE 5.1 NATIONAL RAIL HAULAGE OF PETROLEUM RELATED PRODUCTS BY CARRIER, 1986-87
Service '000 tonnes
Australian National Westrai 1 State Rai 1 Authority Queensland Rai 1 V/Line
621. 3a 450.0
1 200.0 915.4b 427.0
Total 3 613.7
a. The Tasmanian estimate was based on percentage share of product delivered by sea.
b. Queensland Rail estimate based on median estimate of bulk liquids to other minerals ratio i n 1975-76 and 1979-80 applied for 'general merchandise' freight share 1986-87.
Sources BTCE estimates. Railway Industry Council (pers. corn.).
TABLE 5.2 NATIONAL RAIL HAULAGE OF BULK LIQUID PRODUCTS TO 1986-87
Year '000 tonnes
2 022 2 601 2 794 3 614
Growth rate over 15 years (per cent) 3.9
a. Molasses correction applied for Mackay and Townsville. The size of correction factor varied from 9 to 3 per cent.
b. Figures include estimates for Queensland Rail and Australian National operations in Tasman i a.
Sources BTE (1979, 1983). Railway Industry Council (pers. corn.).
3 2

Chapter 5
hypothetical scenario of deregulationl, whilst for Queensland it was observed that recent State deregulation has made littl& impact on road distribution systems except, perhaps, in the Townsville to Mount Isa corridor.
However, forecasting with this 3.9 per cent growth rate should be tempered by the fact that the full effects of rail deregulation in Queensland, the partial rail deregulation in Western Austalia (March 1988) and the likely increased use of B-Doubles on many road corridors i n line with the Review of R3ad Vehicle Limits recomendations (National Association of Australian State Road Authorities 1985), have not been considered i n this analysis. This does not detract from the fact that rail has seemingly maintained its place as a viable long- haul competitive mode as shown by it having the highest rate of growth for non-gaseous hydrocarbon products of all transport modes (see Table 5.2). As an indication of its competitiveness, rail recently won supply contracts against coastal shipping for Perth to Bunbury and Perth to Geraldton traffic.
1. Currently intrastate petroleum product movements, further than 80 kilometres, are regulated to travel by rai 1 transport.
33

CHAPTER 6 OTHER DISTRIBUTION ARRANGEMENTS
REFINERY EXCHANGE
An important dimension in the Australian refined products transport task emanates from the existence of refinery exchange agreements operating between the petroleum companies. In essence, these agreements allow a company to draw upon the refined product of another company i n one Australian State to help service the borrower's market i n that State. In return, in another State, a reciprocal arrangement exists between these two companies with the roles of borrower and host reversed. That is, the company being the initial provider of product i n one State becomes the borrower of an equivalent amount of product in other States.
Refinery exchange was pioneered in Australia i n 1955. Agreements, as they currently exist, began operating in 1965.
The impact of not having refinery exchange agreements would be considerable for a petroleum company's operations in a' State where it did not own a refinery or large storage facilities. 'For example, a company based in an eastern State would incur large tra!nsport costs in supplying a market in the west. Without refinery exchalnge agreements, any company would build up a natural monopoly i n the St,ate housing its own refinery or terminals owing to an associated transport logistics advantage.
In brief, the refinery exchange scheme promotes access to a free trading environment for all participant companies withlin a particular State, regardless of which company controls the refinery. It is possible though for companies to enter the market without having operating control of a refinery. Such companies have developed, for example, Amoco, Total and Golden Fleece (H. C. Sleigh), but these have been subsumed through take overs involving the larger companies. These companies did, however, hold processing agreements with Caltex refiners.
35

BTCE Information Paper 31
Transaction settlements for transport costs incurred in the operation of the refinery exchange scheme, that is, for sea transport, are resolved between companies biannually. (Refinery exchange terminals are shown in Figure 6.1). Similarly, the operational responsibilities of the companies supplying these transport services are also renegotiated at these times.
BORROW AND LOAN PRACTICES
An operational adjunct to refinery exchange agreements are Borrow and Loan arrangements. These arrangements provide for the multi-user sharing of refined product terminal storage infrastructure. Thus companies with either ownership in, or a negotiated right, can draw product from a participating terminal. The associated supply fees for drawing-off terminal stocks are currently near to 10 dollars per tonne (0.8 cents per litre). This price may vary depending upon the rural or urban location of a terminal, as well as the economies of scale offered through terminal size. As companies are, in effect, charged for their utilisation of a terminal, the frequency of road tanker services and the terminal draw-off fee may weigh as important considerations in a company's assessment of the the long-term benefits of establishing its own terminal infrastructure at specific locations. Borrow and Loan terminal transactions are settled between companies on a monthly basis.
PETROLEUM PRODUCTS FREIGHT SUBSIDY SCHEME
A further scheme which affects the pattern of hydrocarbon transport in Australia is the 'Petroleum Products Freight Subsidy Scheme'. This ,scheme operates between retailers and customs authorities. The transport cost of a litre of product to a particular location is first determined. This transport cost is defined as the freight 'differential' to that location and is calculated by the Prices Survei 1 lance Authority. Currently, the transport differential is calculated on the basis of the running cost of a standard tanker to supply a particular location. This ,involves the calculation of a fixed and variable cost component.
Destinations are defined as depot towns, link towns or special locations, and allowances are made in the calculation of the transport differential for each case. In the case of a link town (which would be a sate1 1 i te of a major storage faci 1 ity at some larger town), the differential , i s calculated with consideration given to a transport cost of delivery to the associated depot town, a 'standing' vehicle capital cost and a running cost per kilometre to the link town in question. Allowances are made for vehicle depreciation in the
36

%Thursday Island
W U
DARWIN? wei pa
oCai rns Broome l
l l 3-Jownsvi 1 1 e
oCai rns Broome l
l l 3-Jownsvi 1 1 e I l l l I
Cape Lambert
)" Carnarvono
l r-" l l
I I I I l I
""I"
~\ eMackay
LPort Alma dGladstone
Bundaberg l
I I BRISBANE 1- - - - " "-/",-f -
I I I I TTrial Bay
PERTH ewcas t 1 e
Bunbur Portland
King Is.& Bell Bay
Source Caltex Oil (Australia) Pty. Ltd. 1988.
Figure 6.1 Operational borrow and loan terminals

BTCE Informat ion Paper 31
calculation of a capital standing cost but leasing costs are not included. The determination of the differential is then made by taking the average of the lowest three transport operator costs to that location.
At present, there are about 4000 locations for which there are associated price differentials calculated. Prior to 1984-85, there were approximately 10 000 approved locations which included delivery up to farm gate in some instances. The differential at that time was calculated across an average of the service costs of the lowest four operators supplying services to that location.
The transport freight differential is used i n conjunction with a government declared threshold rate, which can be considered as the user pays margin, to calculate the level of obtainable rebate. Where the transport differential is lower than this declared threshold then transport costs must be absorbed by the distributor. Where the differential is greater than the declared threshold then a subsidy equal to this difference is available. Currently, the declared government threshold is 10.9 cents per litre. Subsidies available for locations whose differentials are above this level bring returns of between 10 to 15 million dollars per annum to distributors. In 1984, the declared government threshold of 1.2 cents per litre afforded distributors between 250 to 300 million dollars in rebates. Raising this threshold to 10.9 cents per litre has forced distributors to absorb full transport costs to many more locations thus reducing rebates by a factor of twenty on previous levels.
Australia's highest differential of 35 cents per litre is to Lord Howe Island. Transport to this location would result i n an available rebate of 24.1 cents per litre.
38

CHAPTER 7 FUTURE DEVELOPMENTS OF HYDROCARBON TRANSPORT
In Chapters 1 to 5 the size of the petroleum transport task and the modal shares associated with this task have been outlined for the period 1971-72 to 1986-87. Some important data, to be contained in the following forthcoming publications, are not yet available. These include 'Port Authority Cargo Movements, 1987-88' (DTC forthcoming) and 'Survey of Motor Vehicle Use, Australia 1988' (ABS forthcoming). The first of these publications will show some of the initial impact of the 1 January 1988 Oil Deregulation policies, and the second will demonstrate the increase of petroleum product and other fuel movements since the last SMVU (1985). The 1988 SMVU will also capture the diversion from rail to road produced by the full or partial rail deregulation in Queensland and Western Australia i n 1987 and 1988 respectively.
The adoption of the Australian Transport Advisory 'Council (ATAC) recommendations of September 1988 may we1 1 see road vehicle mass limits raised uniformly to a level of 42.5 tonnes in all States. It might also be expected that further utilisation of medium combination vehicles (B-Doubles) will follow on from the adoption of these increased uniform weight limits. A1 though there are obvious efficiencies to be gained from the use of such vehicles, each State must decide the associated licensing and permit provisions for the operation of such vehicles. The introduction of medium combination vehicles may well impact on the future rail share of the petroleum movements task. This, i n turn, will put pressure on the railways to further improve their operating efficiency.
Pressures for improved efficiency i n coastal shipping operations will follow the abolition on 1 January 1988 of the Bass Strait Crude A1 location Scheme. Refiners may now become more cost conscious towards using Bass Strait crude, hauled by coastal vessels, i n comparison to importing increased volumes of feedstocks from Asia or the Middle East. The sensitivity of transport costs will be an important consideration in this future choice, especially for Kwinana and Brisbane refiners.
39

BTCE Informat ion Paper 31
The use of pipelines to deliver refined products is increasing. Altona to Tullamarine, Sydney to Newcastle and Geelong to Newport are current examples of direct delivery. A Brisbane to Southport pipeline has also been proposed. In connecting centres of high demand this mode will offer long-term cost savings even though the initial infrastructure costs are high. Proposals for large increases in the natural gas pipelines system might also soon be realised. A pipeline from Moomba to Gladstone via the Denison Trough, and a pipeline to Mount Isa tapping into the Alice Springs to Darwin link are strong future possibilities.
The adoption of new fuels, for example compressed natural gas (CNG), before the year 2000 may well affect the current task shares of both sea and land transport modes. Widespread adoption of a new fuel like CNG, especially in the capital cities, could radically alter the existing balance in the modal shares. Over 100 000 vehicles have adopted this new fuel i n New Zealand and already in Australia several company fleets have converted to CNG. However, it is not envisaged that the adoption of CNG will have an immediate impact into existing modal transport shares in the short-term. Forecasts suggest that there will be over 96 000 trucks and buses operating on CNG in Australia by the year 2003 (Australian Gas Association 1988).
40

APPENDIX I THE DEREGULATED OIL MARKET
On 1 January 1988, the Comnonwealth Goverfiment abolished the Crude Oil Allocation Scheme and effectively lifted the restrictiolns on refiners to process indigenous crude oil. The Crude Oil A1 location Scheme was introduced in 1965 and had been modified in subsequent years. After 1 January 1985 the partial allocation scheme allocated crude oil from small ventures (those producing up to 50 000 barrels per day) and the first 350 000 barrels per day of Bass Strait production to refiners and marketers i n proportion to their respective market share of sa of certain refined products.
The abolition .of the Crude Oil Allocation Scheme has also brought an end the Bass Strait Coastal Freight Adjustment Scheme wh
1 es
to i ch
partially reimbursed the cost of transporting Bass Strait crude to the refinery. In brief, the effects of the deregulated market should:
. allow refiners to compete against the current levels of product being imported:
. allow producers and refiners to play the current Australian crude oil price advantage; and
. increase both exports and imports.
With respect to Australian shipping: . Australian-flagged vessels will have to compete i n both the import
and export trade; and . some coastal movements of Bass Strait crude to refineries will be
replaced by imports, enabling certain of the Australian-flagged tankers to enter into international trading. (This does not include the three Australian-flagged LNG tankers proposed to serve the North-West Shelf export operations beginning i n 1989.)
Not only will the deregulated oil market bring about such international shipping involvement but the continuing depletion of Gippsland crude will also lessen the demand for coastal activity from Westernport. This too will release resources for an expanded international shipping task.
41

APPENDIX I1 SELECTED SHIPPING MOVEMENTS, 1986-87
The following tables present a selection of major coastal, import and export shipping movements as well as the resources involved in the Australian shipping task.
43

P P TABLE 11.1 IMPORT OF MAJOR HYDROCARBONS BY SELECTED PORTS, 1986-87
( ‘000 tonnes) m
Port of landing
Botany Port Port Bay Fremantle Geelong Melbourne Newcastle Stanvac Jackson Hydrocarbon Y.
Q a Crude oil Other feedstocks Motor spirit Aviation turbine fuel Aviation gasoline Kerosene and other oils Distillate Residual oi 1 S Lubricating oi 1 S Fuel oils Other residual petroleum products Naptha solvent Bitumen Liquefied petroleum gas Heavy distillate Petroleum oi 1 S Petroleum products unspecified
796 630 29 105 17
267 - 77 -
117 - 330 -
480 80 -
917
144 30
10 3 -
81 25 1
- 71 602
3 216
- 182 - 16 -
- -
395
243 55 - 41 -
2 81 - 7 -
- 66 -
450 258
- 231
- 41
163 304
- Nil. Source DTC (1988).

TABLE 11.2 EXPORT OF MAJOR HYDROCARBONS BY SELECTED PORTS, 1986-87 ('000 tonnes)
fort of loading
Hydrocarbon fort Botany fort
Bony thon Bay Brisbane Fremantle Geelong Stanvac Westernport
Crude oil Other feedstocks Motor spirit - 9 - 31 89 7 - Aviation turbine fuel - - - 83 - - - Aviation gasoline - - - 7 - - - Kerosene and other oils - - - 4 156 - - Di sti 1 late - 10 - 4 296 - - Residual oi 1 s - - - 62 - 53 - Lubricating oi 1 S - 12 - 16 2 140 - Fuel oils - - - 68 30 215 - Other residual petroleum products - - - - - - - Naptha solvent - - - - - - - Bitumen - - - Liquefied petrol eum gas 35 1 16 - - - - 1 032 Heavy distillate - - - 14 - - - Petroleum oils - - - - - - - Petroleum products B unspecified - - 226 - 4 - - 2
- N i l .
- - - -
5
2 cn Source DTC (1988). cr +
X P

BTCE Infonnat ion Paper 31
TABLE 11.3 AUSTRALIAN-FLAGGED PETROLEUM VESSELS, 1988
Mann ing Ship name Tanker type DWT level Owner/operator
Australia Star Island Gas Wi 1 tshi re B.P. Enterprise John Hunter Esso Gippsland W.M. Leonard Mobi 1 Austral is Conus Australian Spirit Arthur Phi 1 1 ip Era
Canopus Ampol Sarel Nivosa B.P. Achiever Mobi 1 F1 inders
Crude/product LPG Product Product Product Product Product Product Product
Crude/product Crude Crude
Crude Crude Crude Crude Crude
94 569 6 033 12 280 19 792 24 245 24 380 25 500 27 070 31 950
32 605 65 103 94 290
94 350 101 900 124 754 129 700 149 235
27 26 33 41 40 37 39 39 36
29 39 31
31 37 34 34 34
H.C. Sleigh Services BHP Pty CO Ltd Associated Steamships Associated Steamships H.C. S1 eigh Services Associated Steamships Ampol Petroleum (Qld) Associated Steamships Associated Steamships
Associated Steamships H.C. Sleigh Services Howard Smith Industries Pty Ltd Ampol Petroleum (Qld) Ampol Petroleum (Qld) Associated Steamships Associated Steamships Associated Steamships
Source DTC (1988).
46

Appendix 11
TABLE 11.4 DESTINATION AND ORIGIN OF HYDROCARBONS BY PORT: DISCHARGED INTERSTATE, 1986-87
To ta l Port of Port of ( '000
Hydrocarbon des t ina t ion or ig in tonnes)
Freman tl e
Brisbane
Motor spirit Adelaide
Botany Bay
Launceston
Melbourne
Crude oil (and Botany Bay Westernport other Brisbane feedstocks) Port Bonython
Geel ong Barrow Island Port Stanvac Westernport
Barrow Island Port Jackson Westernport
Brisbane Port Bonython Barrow Island Dampier Westernport Port Stanvac Port Bonython Dampier Westernport
Botany Bay Me1 bourne Geel ong Brisbane Fremant 1 e Me1 bourne Brisbane
Westernport Fremant 1 e Newcast 1 e Botany Bay Brisbane Fort Stanvac Fremantle Burnie
Newcas tl e Me1 bourne Brisbane Gladstone
2 844 316 206 188 79 519 908 363 316 73 36
1 377 70 62 219
3 633
29 5
130 70 99 12 51
55 7
11 100 10 17 3 4 2 62 3
47

BTCE Information Paper 31
TABLE 11.4 (Cont.) DESTINATION AND ORIGIN OF HYDROCARBONS BY PORT: DISCHARGED INTERSTATE, 1986-87
Port of Port of Hydrocarbon des t ina t ion or ig in
Tota 7
tonnes) ( '000
Motor spirit Port Lincoln
Port Pirie Port Jackson
Trial Bay
Aviation turbine Adelaide fuel
Botany Bay
Port Jackson
Twofold Bay
Kerosene and Adelaide other oils Port Stanvac
Distillate Adelaide
Botany Bay
Darwin Melbourne
Newcastle Port Kembla Port Lincoln
Melbourne Geel ong Geel ong Geel ong Brisbane Brisbane
Me1 bourne Geel ong Me1 bourne Brisbane Port Stanvac Geel ong Port Stanvac Fremantle Brisbane
Fremantle Me1 bourne
Botany Bay Melbourne Geel ong Brisbane Fremantle Melbourne Brisbane Fremantle Botany Bay Port Stanvac Whyall a Burnie Melbourne Port Stanvac Me1 bourne Geel ong
10 31 3 35 11 33
1 2
11 7 18 16 5 4 1
1 1
26 5 19 11 4 5 4 14 17 68 29 10 3 2 24 44
48

Appendix I I
TABLE 11.4 (Cont.) DESTINATION AND ORIGIN OF HYDROCARBONS BY PORT: DISCHARGED INTERSTATE, 1986-87
Total Port of Port of ( ‘000
Hydrocarbon destination or ig in tonnes)
Distillate Port Pirie
Port Jackson Trial Bay Twofold Bay
Residual oi 1 S Fremantle Me1 bourne
Lubricating oils Darwin Launceston
Me1 bourne
Port Jackson
Adelaide
Fuel oils Fremantle Geel ong Launceston Mackay Newcastle
Port Kembla Port Latta
Adelaide
Me1 bourne Geel ong Geel ong Brisbane Brisbane
Melbourne Newcastle Whyall a Fremantle
Fremantle Westernport Fremantle Botany Bay Port Stanvac Fremantl e Geel ong Port Stanvac Fremantle Botany Bay Geel ong
Botany Bay Port Jackson Westernport Me1 bourne Me1 bourne Geel ong Brisbane Port Stanvac Me1 bourne Whyall a Me1 bourne Geel ong Brisbane Freman tl e
4 2 20 14 1
15 4 2 2
1 46 4 6 20 6 9 2 14 1 3
9 18 12 1 7 5 6
26 15 5 3 52 8 13
49

BTCE Information Paper 31
TABLE 11.4 (Cont.) DESTINATION AND ORIGIN OF HYDROCARBONS BY PORT: DISCHARGED INTERSTATE, 1986-87
Port of Port of Hydrocarbon des t ina t ion or ig in
Total
tonnes) ( ‘000
Residual Botany Bay petroleum Port Jackson products (3390)a
Other residual Botany Bay petroleum products (3399)a
Geel ong Port Kembla
Naptha solvent Port Jackson
Bitumen Adelaide Launceston Newcastle
Heavy distillate Adelaide Newcastle
Liquefied Botany Bay petroleum gas Gladstone
Launceston Norfolk Island Port Jackson
Unspecified Brisbane petroleum products (3300)a
Port Stanvac Port Stanvac
Westernport Port Stanvac Port Bonython Port Jackson Port Stanvac
Geel ong
Geel ong Port Kembla Whyall a
Botany Bay Me1 bourne Geel ong Brisbane
Westernport Brisbane Westernport Westernport Brisbane Port Bonython Westernport
Port Jackson Botany Bay Melbourne Geel ong Port Bonython Fremantle Northern Territory ports
9 5
9 18 9
14 5
9
22 9 28
28 21 2 8
292 2 5
12 1 1
10
1 89 46 126 81 17
102
50

Appendix II
TABLE 11.4 (Cont.) DESTINATION AND ORIGIN OF HYDROCARBONS BY PORT: DISCHARGED INTERSTATE, 1986-87
Total
Hydrocarbon dest ina t ion origin tonnes) Port of Port of ( '000
Unspeci f i ed Cairns Me1 bourne petroleum Devonport Geel ong products (3300)a Westernport
Townsville Geel ong Gladstone Port Jackson
Botany Bay Melbourne Geel ong Port Jackson Melbourne
Port Jackson Me1 bourne Geel ong Westernport Port Bonython
8 150 13
116 20 10 5 38 12 10 37 49 109 11
a. ABS comnodity classification number.
Source DTC (1988).
51

BTCE Informat ion Paper 31
TABLE 11.5 DESTINATION AND ORIGIN OF HYDROCARBONS BY PORT: DISCHARGED INTRASTATE, 1986-87
Port of. Port of Hydrocarbon des t ina t ion origin
Total
tonnes) ( ‘000
Crude oil Fremantle
Kerosene
Distillate
Port Stanvac
Motor spirit Bunbury King Island Newcas t 1 e Trial Bay Twofold Bay
Twofold Bay
Exmouth Gulf Flinders Island Port Kembla Trial Bay Twofold Bay Yampi Sound
Residual oi 1 S Fremantle ( 3 3 3 q a
Port Jackson
Fuel oils Mackay
Newcas t 1 e
Liquefied Gladstone petroleum gas Townsville
Heavy distillate Newcastle
Barrow Island Broome Dampier Yampi Sound Port Bonython
Fremantle Launceston Botany Bay Botany Bay Botany Bay
Botany Bay
Fremantle Launceston Botany Bay Botany Bay Botany Bay Fremantle
Bunbury Dampier Esperance Botany Bay
G1 adstone Brisbane Botany Bay
Brisbane Brisbane
Botany Bay
294 28 83 19
618
113 2 1
97 39
2
8 5
13 59 28 8
38 20 2 38
11 13 2
1 1
5
a. ABS comodity classification number.
Source DTC (1988).
52

APPENDIX I11 RAIL ORIGIN AND DESTINATION MOVEMENTS, 1975-76 AND 1979-80
Following are a selection of major interregional origin-destination corridors for rail movements of petroleum and other bulk liquid products. The sample chosen represents approximately two-thirds of bulk liquid movements i n the years for which origin-destination data are available.
53

BTCE Information Paper 31
TABLE 111.1 SELECTED RAIL BULK LIQUID CORRIDORS, 1975-76
Or ig in Regional destination Major towns '000 tonnes
Sydney
Newcastle
Me1 bourne
Brisbane
Fi tzroy
Mackay
Northern Qld
Perth
Perth
Eastern Goldfields
North West Tasmania
Central Macquarie Central Tablelands Lachlan Southern Tablelands ACT/Queanbeyan
Northern Slopes
Northern Victoria A1 bury/Wodonga
Widebay/Burnett Darl ing Downs
Fi tzroy
Mackay
North West
Central Agricultural
Eastern Goldfields
Eastern Goldfields
North West Tasmania
Dubbo Bathurst Parkes Gou 1 burn Canberra
Tamworth
Bendigo A1 bury
Bundaberg Toowoomba
Rockhampton
Mackay
Mount Isa
Northam
Kalgoorlie
Esperance
Burnie
89 71 77 51 155
69
87 88
54 202
94
13ga
62
126
95
79
98
Total sample Total bulk liquid movements for 75-76
Corridor sample (per cent)
1 824 2 864
63.7 ~~~
a. Molasses movements.
Source BTE (1979).
54

Appendix 111
TABLE 111.2 SELECTED RAIL BULK LIQUID CORRIDORS 1979-80
Origin Regional destination Major towns '000 tonnes
Syd n ey
Newcas t 1 e
W011 ongong
Adelaide
Me1 bourne
Brisbane
Qld Northern
Fi tzroy
Mackay
Northern Qld
Perth
Perth South Eastern
Hobart North Western
Central Macquarie Central Tablelands Lach 1 an Southern Tablelands ACT/Queanbeyan
Northern Slopes North Central Plains
Newcas t 1 e
Far West
Loddon/Campaspe North Mal lee Wodonga
Widebay/Burnett Darling Downs South West
Qld Northerna
Fi tzroy
Mac kay a North Western
Midlands
South Eastern South Eastern North Western
North Western
Dubbo Bathurst Parkes Goul burn Canberra
Tamwo rt h Moree Newcastle
Broken Hi 1 1
Korong Vale Mi 1 dura Wodonga
Bundaberg Toowoomba Char1 evi 1 1 e
Townsville
Rockhampton
Mackay
Mount Isa Northam
Kalgoorl ie Esperance Oevonport
Burnie
131 78 82 59 29
89 40
56
50
41 60 76
41 269 51
23
105
65
90
125
77
97
41
49
Total sample 1 824 Total bulk liquid movements for 79-80 2 882
Corridor sample (per cent) 63.3
a. Molasses movements.
Source BTE (1983).
55

APPENDIX I V BACKGROUND STATISTICS
57

BTCE Information Paper 31
TABLE IV.l BACKGROUND STATISTICS: PRODUCTS
Major product Year consumed Growth rate ( '000 tonnes) 1971 -72 1977 1986 (per cent)
Petrol Avtur
7 912 10 412 11 724 1 032 1 546 1 984
Automotive diesel fuel 3 193 5 131 7 192 Fuel oils 6 486 6 062 2 250
2.75 4.60
5.76 -7.00
Source Australian Institute of Petroleum Limited (1981, 1987a, 1987b).
TABLE IV.2 BACKGROUND STATISTICS: VEHICLES, POPULATION
Total motor Year (at 30 September) veh ic l es Growth rate ( l000) 1976 1979 1982 1985 1987a (per cent)
Total 6 556.9 7.285.3 8 132.6 8 865.2 9 373.7 3.30
Australian Year population Growth rate ( ' 000) 1971-72 1975-76 1986-87 (per cent)
Total 13 176.9 13 920.3 16 132.8 1.35
a. At 30 June 1987.
Source ABS (1978, 1981, 1983, 1984,.1986).
58

Appendix I V
TABLE IV.3 SERVICE STATION STATISTICS, 1985-86
Reta i l State Cap ita l/ Number of Tumo ver sa lesb capita I State pair establ ishnentsa ($ ‘000) ($ ‘000) share
Sydney New South Wales
Me1 bourne Victoria
Brisbane Queensland
Adelaide South Australia
Perth Western Australia
Hobart Tasman i a
Northern Territory
Australian Capital Territory
Australia
1 487 1 525 574 1 424 692 3 114 2 659 991 2 496 673
1 254 1 267 549 1 193 960 2 164 1 824 405 1 703 402
572 532 116 490 500 1 518 1 178 485 1 095 033
472 419 540 393 059 797 596 857 560 999
527 504 531 470 900 926 746 350 691 735
109 82 312 78 262 355 201 657 188 814
68 88 537 80 675
80 108 040 98 341
9 022 7 404 325 6 915 6?1
0.57
0.70
0.45
0.70
0.68
0.41
na
na
..
a. As at 30 June 1986. b. Excludes sales of petrol on cornission. na Not available. .. Not applicable.
Source ABS (pers. corn.).
59

BTCE Infomat ion Paper 31
TABLE IV.4 AUSTRALIAN REFINERY CAPACITY, 1 J U L Y 1987
('000 tonnes per year)
Capa c i ty
Lubricating Refinery oil refinery
Kurnell (NSW) 4 900 A1 tona (Vic) 5 040 Geelong (Vic) 5 000 Clyde (NSW) 3 100 Kwinana (WA) 5 543 Adelaide (SA) .. Port Stanvac (SA) 3 340 Lytton (Qld) 3 000 Bulwer Island (Qld) 2 217 Eromanga (Qld) 69
196 ..
145 ..
120 245 .. .. .. ..
Total 32 209 706
.. Not applicable.
Source Australian Institute of Petroleum Limited (1987b).
60

Appendix I V
TABLE IV.5 PRODUCTION OF SELECTED REFINED PRODUCTSy
( '000 tonnes) 1984-85 AND 1986-87
Product ~~
1984 -85 1986-87
Liquefied petroleum gas 525.2 Automotive gasoline 11 377.0 Aviation gasoline 113.8 Avtur 2 063.0 Lighting kerosine 86.4 Power kerosine 9.5 Heating oil 107.7 Automotive distillate 6 742.2 Industrial diesel fuel 359.8 Fuel oil 2 680.5 Lubricating oil 536.9 Bi tumen 529.4
387.0 11 200.0
141.3 2 176.0
56.9 6.7
179.8 6 888.9 205.0
2 135.4 516.5 533.8
To tal 25 148.8 24 440.3
Source Department of Primary Industries and Energy (1988b, 1988c, 1988d).
TABLE 1'4.6 IMPORTS AND EXPORTS OF REFINED PRODUCTS, 1986-87
('000 tonnes)
Product Imports Exports
Liquefied petroleum gas Automotive gasoline Aviation gasoline Avtur Automotive diesel oil Industrial and marine diesel fuel Fuel oils Lubricating oi 1 S Bitumen Other
19.5 934.7 4.7
173.5 853.8
10.4 1 156.4
39.1 13.1 255.3
1 407.0 183.7 46.9 736.7 373.4
106.0 1 277.7 204.4 0.92 159.1
Source Department of Primary Industries and Energy (1988).
61

m IQ TABLE IV.7 TOTAL FINAL ENERGY DEMAND BY MAJOR FUEL TYPE AND CONSUMING SECTOR: AUSTRALIA, 1985-86
(petajoules) -
Coa l Wood and cod l Petrolem and products products Gas Electricity bagasse Solar Total Per cent
Agriculture Mining Iron and steel Non-ferrous metals Chemical Other industry Road transport Rai 1 transport Air transport Sea transport Conercial Residential Lubricants, bitumen, etc.
3.9 60.6 50.7 17.7 54.6
- 3.2 6.1 0.9
47.2 27.3 1.9 42.5 39.4 53.3 718.5 27.2 92.9 52.1 10.6 18.1 47.0
- 54.9 20.4 67.9 48.2 113.3
0.4
28.2 74.0
6.5 22.8 14.5 69.9 10.3 55.7
- 4.0 0.3 0.3 74.2 124.1
- 0.7 - 68.4 2.5
53.7 108.9 97.6 231.0 364.7 364.7 718.5 31.2 93.6 119.8 119.8 288.0 47.0
~
2.3 4.7 4.2 9.9 15.7 15.7 30.9 1.3 4.0 5.2 5.2 12.4 2.0
~~ - Total final energy demand 197.7 1 178.3 407.3 382.6 156.9 2.5 2 325.3 100.0
- - Nil.
Note Total final energy demand is equal to total energy consumption less energy consumption and loss i n the production of the derived fuels by the conversion sector.
Source Department of Primary Industries and Energy (1988a).
Y. D 5
'b m 5
2
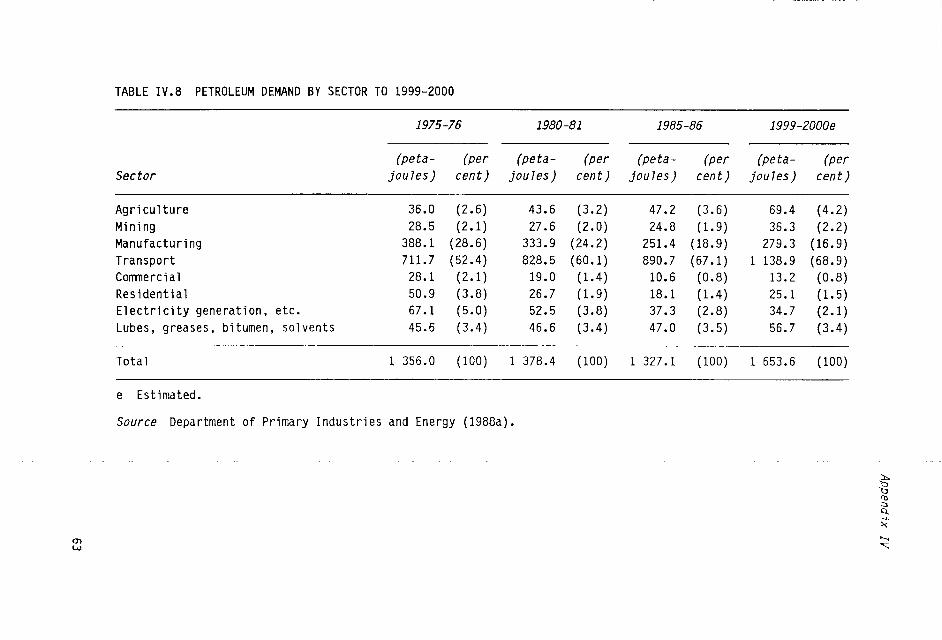
TABLE IV.8 PETROLEUM DEMAND BY SECTOR TO 1999-2000 ~~ ~ ~~~
1975 -76 1980-81 1985-86 1999-2000e
(peta- (per (peta- (per (peta- (per (peta- (per Sector joules) cent) joules) cent) joules) cent) joules) cent)
Agriculture 36.0 (2.6) 43.6 (3.2) 47.2 (3.6) 69.4 (4.2) Mining 28.5 (2.1) 27.6 (2.0) 24.8 (1.9) 36.3 (2.2) Manufacturing 388.1 (28.6) 333.9 (24.2) 251.4 (18.9) 279.3 (16.9) Transport 711.7 (52.4) 828.5 (60.1) 890.7 (67.1) 1 138.9 (68.9) Comnercial 28.1 (2.1) 19.0 (1.4) 10.6 (0.8) 13.2 (0.8) Residential 50.9 (3.8) 26.7 (1.9) 18.1 (1.4) 25.1 (1.5) Electricity generation, etc. 67.1 (5.0) 52.5 (3.8) 37.3 (2.8) 34.7 (2.1) Lubes, greases, bitumen, solvents 45.6 (3.4) 46.6 (3.4) 47.0 (3.5) 56.7 (3.4)
Total 1 356.0 (100) 1 378.4 (100) 1 327.1 (100) 1 653.6 (100)
e Estimated.
Source Department of Primary Industries and Energy (1988a).

BIBLIOGRAPHY
Abbreviations
AB S Australian Bureau of Statistics AGPS Australian Government Publishing Service BTCE Bureau of Transport and Comnunications Economics BTE Bureau of Transport Economics DTC Department of Transport and Comnunications I sc Inter-State Comnission
ABS (1978), Survey of Motor Vehicle Usage, Twelve Months Ended 30 September 1976, Cat. No. 9208.0, Canberra.
- (1981), Survey of Motor Vehicle Usage, Twelve Months Ended 30 September 1979, Cat. No. 9208.0, Canberra.
- (1983), Survey of Motor Vehicle Usage, Twelve Months Ended 30 September 1982, Cat. No. 9208.0, Canberra.
- (1984) Year Book, Australia No. 68, 1984, Cat. No. 13O81.0, AGPS, Canberra.
- (1986), Survey of Motor Vehicle Use, Australia, 1985, Cat. No. 9208.0, Canberra.
- (1987a), Nat iona l Energy Survey: Annua l Consunpt ion of Reticulated Energy by Households, Australia 1985-86, Cat. No. 8213.0, Canberra.
- (1987b), Road Freight Transport Activity of Private Enterprises by Industry Subdivision, Australia and States, 1983-84, Cat.1 No. 9107.0, Canberra.
- (forthcoming), Survey of Motor Vehicle Use, Australia, 1988. Australian Gas Association (1987), Gas Industry Statistics 1985-86, Canberra.
65

BTCE Information Paper 31
Australian Institute of Petroleum Limited (1980), Conversion Factors and Energy Values, Tech Data 5, July 1980, Melbourne.
- (1981) , Preparing for the 199Os, Trends and Question Marks in Australia's Petroleum Future, Seminar Papers, Canberra, November 1981, Me1 bourne.
- (1987a), Petroleum Gazette, Spring 1987, Melbourne. - (1987b), Petroleum Gazette, Oil and Australia, Winter 1987, Me1 bourne.
BTCE (1988a), Australian Non-Government Railways, Operating Statistics 1986-87, Canberra.
- (1988b), Railway Legislation and Rate Contracts in Canada and Australia, Information Paper 28, AGPS, Canberra.
- ( 1 9 8 8 ~ ) , Shore-based Shipping Costs: Transport and Hand1 ing of Bulk Cargo, Information Paper 26, AGPS, Canberra. BTE (1976) , Estimates of Australian Interregional Freight Movements, 1971-72, AGPS, Canberra.
- (1978), Estimates of Australian Inter Regional Freight Movements, 1975-76, AGPS, Canberra.
- (1979), Australian Rail Freight Movements, 1975-76, Information Bulletin, AGPS, Canberra.
- (1983), Australian Rail Freight Movements, 1979-80, Information Paper 8, AGPS, Canberra.
- (1985), Impact of Oil Deregulation on Shipping - Tankers Requirements Model, unpublished.
- (1987), Transport of Australia's Minerals, Information Paper 20, AGPS, Canberra.
Bureau of Mineral Resources (1987), Petroleum Exploration and Development Titles Key, September 1987, AGPS, Canberra.
- (1988) , Australian Mineral Industry Annual Review for 1986, AGPS, Canberra.
Bureau of Resource Economics (1987), Australian Research Outlook 1987-2000, Research Report 1, AGPS, Canberra.
66

B ib l iography
Department of Primary Industries and Energy (1987a), Australian Energy Resources, Reference Map, NMP 87/010, Department of Administrative Services, Canberra.
- (1987b), Crude Oil Free Market Set for January 1, 1988, Media Release 21, December 1987, Canberra.
- (1987c), Crude Oil Market Deregulation: Administrative Guidelines, Canberra.
- (1988a), Energy 2000, A National Energy Policy Paper, AGPS, Canberra.
- (1988b), Major Energy Statistics, Issue No 85, February 1988, Canberra.
- (1988c), Major Energy Statistics, Issue No 88, May 1988, Canberra. - (1988d), Major Energy Statistics, Issue No 89, June 1988, Canberra. Department of Resources and Energy (1987), Marketing Arrangements for Indigenous Crude Oil, a Discussion Paper, Canberra.
DTC (1987), Coastal Shipping, An Industry in Transition, Canberra.
- (1988), Port Authority Cargo Movments, 1986-1987, AGPS, Canberra. - (forthcoming) Port Authority Cargo Movements, 1987-1988. Esso Australia Ltd (1980), Oil and Gas, The Production Story, Champion Press Pty Ltd, Sydney.
Industries Assistance Comnission (1983) Petrolem Products, Dmand and Supply Trends in Australia, Report No 18, AGPS, Canberra.
- (1986), Certain PetroTeum Products - Taxat ion Measures, vol. 1, AGPS, Canberra.
- (1988), Coastal Shipping, Report 415, AGPS, Canberra. ISC (1987), A Review of Federal Registration for Interstate Vehicles, AGPS, Canberra.
- (1988), Harmonisation of Road Vehicle Regulations in Australia, AGPS, Canberra.
Ministry of Transport Victoria (1980), Victorian Transport Study, Transport of Petrolem Products, 1980, Me1 bourne.
67

BTCE Information Paper 31
National Association of Australian State Road Authorities (1985), Review of Road Vehicle Limits, Department of Main Roads, Sydney.
National Energy Advisory Committee (1984), Trade In Energy, Report No 21, AGPS, Canberra.
Queensland Railways (1987), 1987 Annual Report, Government Printer Queensland, Brisbane.
Royal Comission into Grain Storage, Handling and Transport (J. C. McColl, Royal Commissioner) (1988), Report, AGPS, Canberra.
Service Station Association of NSW (1988), Service Station, Official Journal of the Service Station Industry, Sydney.
Shell Australia Limited (1987), The Shell Report, Melbourne.
Travers Morgan Pty Ltd (1986) , Transport of Austral ia's Minerals, Sydney, (unpublished for BTE).
Western Australian Department of Transport (1987), A Review of Fuel Transport P01 icy in Western Austral id, Perth.
68

ABBREVIATIONS
ABS AGPS ATAC bld BTCE BTE CNG DTC dwt I sc LNG LPG MCV SMVU SVP TNT
Australian Bureau of Statistics Australian Government Publishing Service Australian Transport Advisory Council barrels per day Bureau of Transport and Comnunications Economics Bureau of Transport Economics compressed natural gas Department of Transport and Comnunications deadweight tonnes Inter-State Comnission liquefied natural gas liquefied petroleum gas medium combination vehicle Survey of Motor Vehicle Use single voyage permit Thomas Nationwide Transport Ltd
69