bt presentation template: simple, elegant & intuitive · safe harbor this document ... and...
TRANSCRIPT

1
Investor Presentation
All Information as of 12/31/17

22
Safe Harbor
This document contains forward-looking information and financial projections subject to risks,
uncertainties and other factors that could materially affect our actual results. Any forward-looking
statements or financial projections represent our views only as of today and should not be relied upon as
representing our views as of any subsequent date. We do not assume any obligation to update any
forward-looking statements or financial projections. Further, our financial projections do not consider the
impact of any pending or future changes to accounting pronouncements under US Generally Accepted
Accounting Principles. For additional discussion of factors that could impact our operational and financial
results, please refer to our Form 10-K for the fiscal year ended June 30, 2017 and subsequently filed
Form 10-Q’s and Form 8-K’s or amendments thereto.
Non-GAAP Financial Information
The financial projections in this document are presented on both a GAAP and a non-GAAP basis. Non-
GAAP projections include core operating income, adjusted EBITDA, adjusted EBITDA margin, core
operating margin, core earnings per share and constant currency growth. A historical reconciliation of our
non-GAAP results to the most directly comparable GAAP result is available in the Investors section of
Bottomline's website at www.bottomline.com/us/about/investors
33
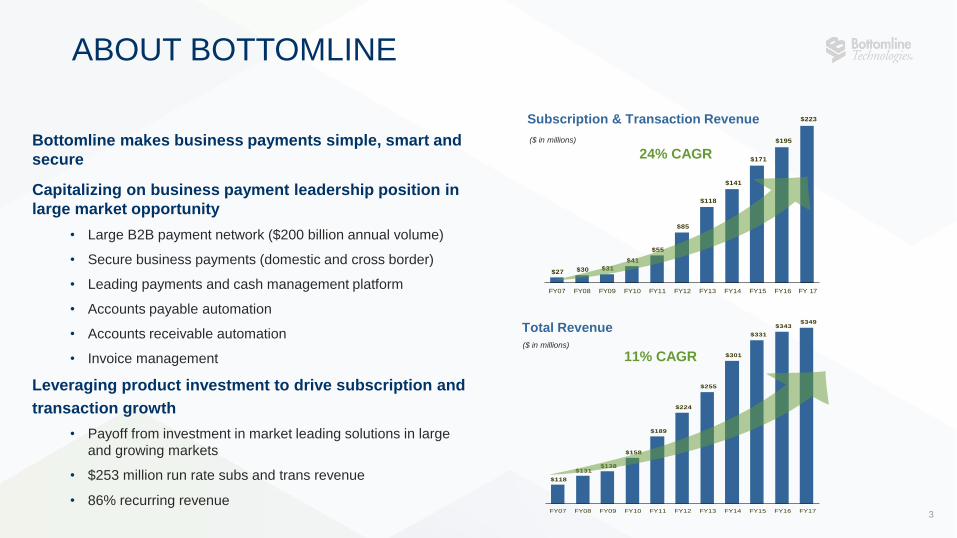
ABOUT BOTTOMLINE
$118
$131 $138
$158
$189
$224
$255
$301
$331
$343 $349
FY07 FY08 FY09 FY10 FY11 FY12 FY13 FY14 FY15 FY16 FY17
Bottomline makes business payments simple, smart and
secure
Capitalizing on business payment leadership position in
large market opportunity
• Large B2B payment network ($200 billion annual volume)
• Secure business payments (domestic and cross border)
• Leading payments and cash management platform
• Accounts payable automation
• Accounts receivable automation
• Invoice management
Leveraging product investment to drive subscription and
transaction growth
• Payoff from investment in market leading solutions in large
and growing markets
• $253 million run rate subs and trans revenue
• 86% recurring revenue
$27 $30 $31
$41
$55
$85
$118
$141
$171
$195
$223
FY07 FY08 FY09 FY10 FY11 FY12 FY13 FY14 FY15 FY16 FY 17
11% CAGR
Total Revenue
($ in millions)
24% CAGR
Subscription & Transaction Revenue
($ in millions)

44
BUSINESS PAYMENT COMPLEXITY
PAYER PAYMENT
RECIPIENT
Source: Aité Group

55
BUSINESS PAYMENT COMPLEXITY
5
PAYER PAYER’S BANK PAYMENT
RECIPIENT’S BANK
PAYMENT
RECIPIENT
CORRESPONDENT BANKS
CARD ISSUER BANK MERCHANT ACQUIRER’S BANK
CARD NETWORK
NATIONAL BANKNATIONAL BANK
PROPRIETARY
NETWORK
Paper draft, ACH
or wire transfer
Commercial card
SWIFT
message
Paper draft, ACH or wire
transfer
ACH or wire transfer
Paper draft, ACH or
wire transfer
Source: Aité Group
6
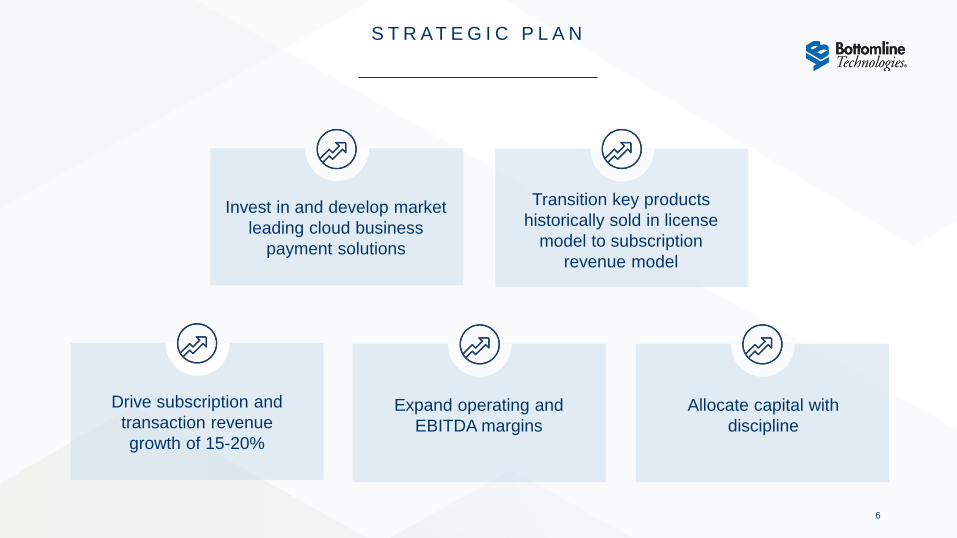
Transition key products
historically sold in license
model to subscription
revenue model
S T R AT E G I C P L A N
Invest in and develop market
leading cloud business
payment solutions
Drive subscription and
transaction revenue
growth of 15-20%
Expand operating and
EBITDA margins
Allocate capital with
discipline
6

7
Market Leading Products

88
PAYMODE-X
The Paper Problem
63% of organizations are still
making more than half of their
payments by paper check
77% of organizations subject
to payment fraud were victims of
check fraud
84% of organizations identify
high overall payment costs as a
driver for automationPayers transform AP
into a profit center
and manage
payments efficiently,
precisely and
securely
Vendors receive
electronic payment
benefits, rich
remittance and
process automation
Automated Electronic Payments
Paymode-X helps businesses easily
transition to electronic payments
(number of vendors, calendar year)
Paymode-X Network
365,000+ Vendors in network
$200B+ in payments processed
50,000
100,000
150,000
200,000
250,000
300,000
350,000
2008 2009 2010 2011 2012 2013 2014 2015 2016 2017

99
DIGITAL BANKINGInnovative commercial banking platforms empower banks
to win new customers and grow wallet share
Helping Banks Grow Organically
and Defend vs Digital Disruption
Banks Get
• Market-leading payments and cash
management capabilities
• Mobile-first design, with flexible,
modular customization
• Powerful customer engagement platform,
with integrated sales and marketing tools
Bank’s Commercial Customers Get
• Integrated, market-leading payments and
cash management solutions
• Tools to help manage their finances
• Easy-to-use and customizable
digital interface
• Works with SMB business and
accounting software
Leadership Position Market Leading Solution
• Well-positioned to help banks actively
seeking new technology to grow their
business banking franchises
• Top-tier bank client base
Best Overall Partner
Best User Experience
Best Small Business Capabilities
Most Open Architecture
Aite Survey of Cash
Management Vendors
1010
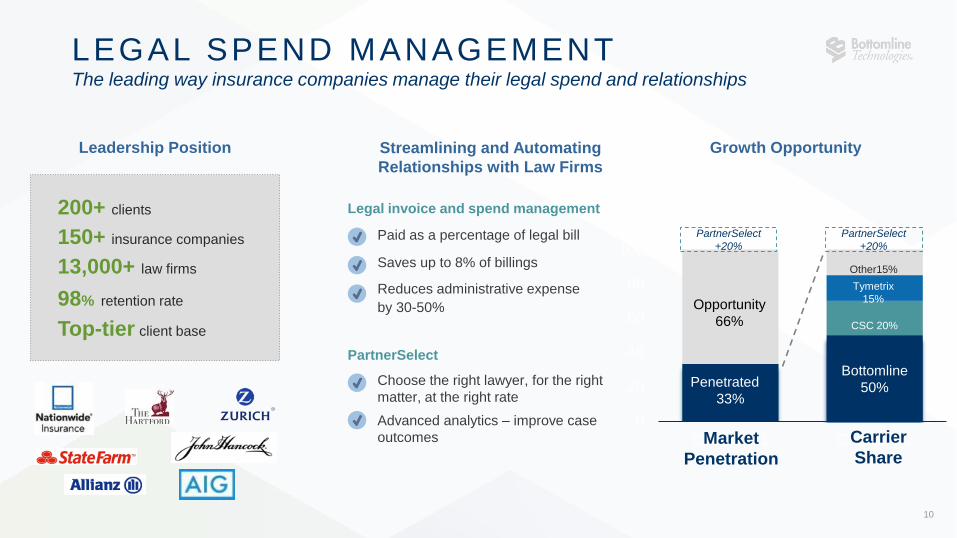
LEGAL SPEND MANAGEMENTThe leading way insurance companies manage their legal spend and relationships
200+ clients
150+ insurance companies
13,000+ law firms
98% retention rate
Top-tier client base
Leadership Position
0
20
40
60
80
100
120
Category 1 Category 2
Penetrated
33%
Opportunity
66%
Bottomline
50%
CSC 20%
Tymetrix
15%
Other15%
Market
Penetration
Carrier
Share
PartnerSelect
+20%
PartnerSelect
+20%
Growth OpportunityStreamlining and Automating
Relationships with Law Firms
Legal invoice and spend management
Paid as a percentage of legal bill
Saves up to 8% of billings
Reduces administrative expense
by 30-50%
PartnerSelect
Choose the right lawyer, for the right
matter, at the right rate
Advanced analytics – improve case
outcomes
11
Financial Highlights
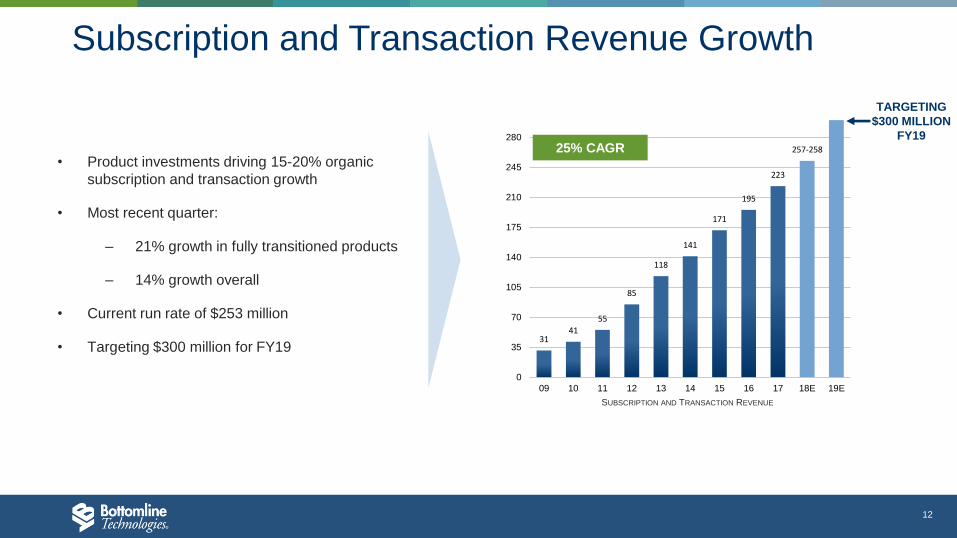
3141
55
85
118
141
171
195
223
257-258
0
35
70
105
140
175
210
245
280
09 10 11 12 13 14 15 16 17 18E 19E
Subscription and Transaction Revenue Growth
25% CAGR
12
• Product investments driving 15-20% organic
subscription and transaction growth
• Most recent quarter:
– 21% growth in fully transitioned products
– 14% growth overall
• Current run rate of $253 million
• Targeting $300 million for FY19
TARGETING
$300 MILLION
FY19
SUBSCRIPTION AND TRANSACTION REVENUE
13Note: Results above are based on Q2-18.
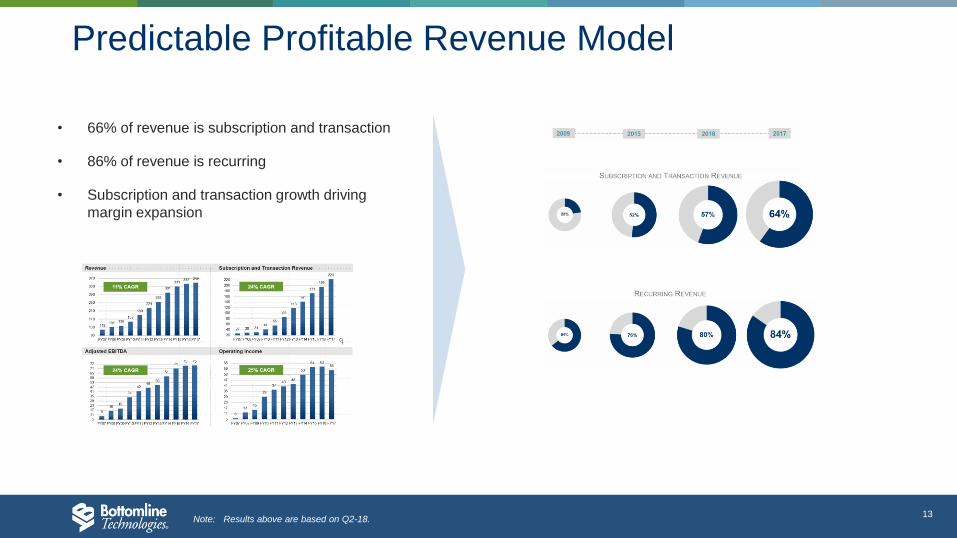
• 66% of revenue is subscription and transaction
• 86% of revenue is recurring
• Subscription and transaction growth driving
margin expansion
Predictable Profitable Revenue Model

9
1619
34
4246
50
61
7175 75
86-87
0
10
19
29
38
48
57
67
76
86
95
07 08 09 10 11 12 13 14 15 16 17 18E 19E
Margin Expansion
14
• New subscription and transaction revenues
driving margin expansion
– Banking subscription backlog of $14
million
– Optimizing existing customer base
through cross-sales and add on
opportunities
• EBITDA run rate of $90 million
– EBITDA Margin of 24%, up two
percentage points year over year
– Targeting $100 million EBITDA in FY19
TARGETING
$100 MILLION
FY19
EBITDA
22% CAGR

NASDAQ: EPAY
31
32
33
34
35
36
37
38
Capital Allocation
15
• Repurchased 1.7 million shares for $40
million in 2017
• Retired convertible debt (Dec 2017)
– Combination of $40 million of cash
and $150 million draw from credit
facility
– $150m draw, with 2/3 fixed, 1/3
floating structure
– No shareholder dilution
• Cash and investments on hand of $78 million
• Able to fund continued growth and
opportunistically repurchase shares
Stock price observed from November 1, 2017 to January 31, 2018
Jan.
2018
Nov.
2017
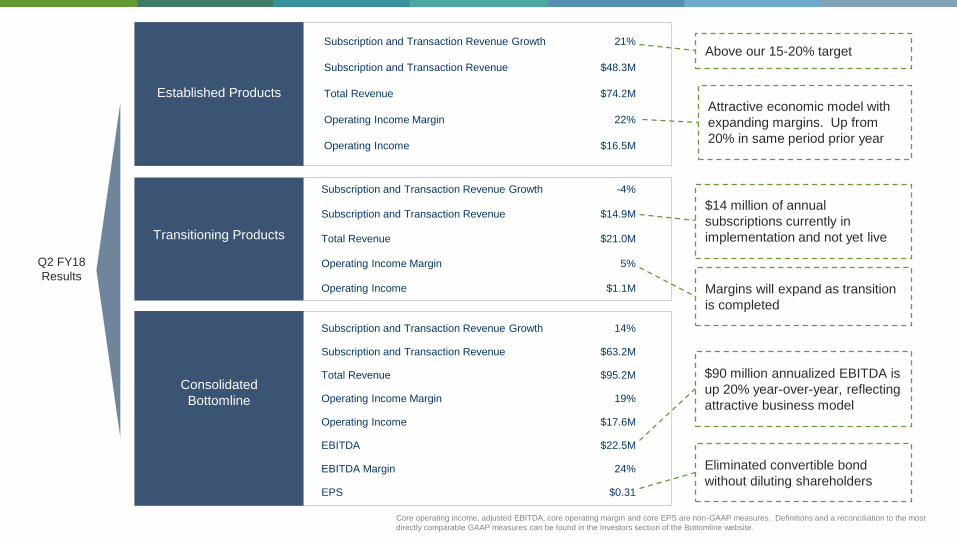
Consolidated
Bottomline
Transitioning Products
Established Products
Above our 15-20% target
Attractive economic model with
expanding margins. Up from
20% in same period prior year
$14 million of annual
subscriptions currently in
implementation and not yet live
Margins will expand as transition
is completed
Eliminated convertible bond
without diluting shareholders
Core operating income, adjusted EBITDA, core operating margin and core EPS are non-GAAP measures. Definitions and a reconciliation to the most
directly comparable GAAP measures can be found in the Investors section of the Bottomline website.
Q2 FY18
Results
$90 million annualized EBITDA is
up 20% year-over-year, reflecting
attractive business model
Subscription and Transaction Revenue Growth
Subscription and Transaction Revenue
Total Revenue
Operating Income Margin
Operating Income
-4%
$14.9M
$21.0M
5%
$1.1M
Subscription and Transaction Revenue Growth
Subscription and Transaction Revenue
Total Revenue
Operating Income Margin
Operating Income
EBITDA
EBITDA Margin
EPS
14%
$63.2M
$95.2M
19%
$17.6M
$22.5M
24%
$0.31
Subscription and Transaction Revenue Growth
Subscription and Transaction Revenue
Total Revenue
Operating Income Margin
Operating Income
21%
$48.3M
$74.2M
22%
$16.5M

118131 138
158
189
224
255
301
331343 349
384-385
90
130
170
210
250
290
330
370
07 08 09 10 11 12 13 14 15 16 17 18G
27 30 3141
55
85
118
141
171
195
223
257-258
20
50
80
110
140
170
200
230
07 08 09 10 11 12 13 14 15 16 17 18G
9
1619
34
4246
50
61
7175 75
86-87
5
15
25
35
45
55
65
75
85
07 08 09 10 11 12 13 14 15 16 17 18G
6
1315
29
3740
43
53
61 6258
66-67
5
13
20
28
35
43
50
58
65
07 08 09 10 11 12 13 14 15 16 17 18G
Revenue Subscription and Transaction Revenue
Adjusted EBITDA Operating Income
Bottomline Performance ($ millions)
11% CAGR 23% CAGR
22% CAGR 24% CAGR
17CAGR measured from FY07 to FY18 guidance