bt group plc q3 2017/18 results · • underlying revenue ex transit down 6% – declines in...
TRANSCRIPT

© British Telecommunications plc 2018
BT Group plcQ3 2017/18 results2 February 2018
1

© British Telecommunications plc 2018
Forward-looking statements caution
Certain statements in this results release are forward-looking and are made in reliance on the safe harbour provisions of the US Private Securities Litigation Reform Act of 1995.
These statements include, without limitation, those concerning: our outlook for 2017/18 including revenue, EBITDA, free cash flow and progressive dividends; Openreach’s
acceleration of its FTTP programme; and our investment in the roll out of 4G.
Although BT believes that the expectations reflected in these forward-looking statements are reasonable, it can give no assurance that these expectations will prove to have been
correct. Because these statements involve risks and uncertainties, actual results may differ materially from those expressed or implied by these forward-looking statements.
Factors that could cause differences between actual results and those implied by the forward-looking statements include, but are not limited to: material adverse changes in
economic conditions in the markets served by BT whether as a result of the uncertainties arising from the UK’s exit from the EU or otherwise; future regulatory and legal actions,
decisions, outcomes of appeal and conditions or requirements in BT’s operating areas, including the outcome of Ofcom’s strategic review of digital communications in the UK, and
the implementation of the DCR commitments, as well as competition from others; consultations and market reviews including the outcome of Ofcom’s reviews of the Wholesale
Local Access, Wholesale Broadband Access and Business Connectivity markets and forthcoming spectrum auctions; selection by BT and its customer facing units of the appropriate
trading and marketing models for its products and services; fluctuations in foreign currency exchange rates and interest rates; technological innovations, including the cost of
developing new products, networks and solutions and the need to increase expenditures for improving the quality of service; prolonged adverse weather conditions resulting in a
material increase in overtime, staff or other costs, or impact on customer service; developments in the convergence of technologies; external threats to cyber security, data or
resilience; political and geo-political risks; the anticipated benefits and advantages of new technologies, products and services not being realised, including the proposed investment
in our FTTP broadband network; the timing of entry and profitability of BT in certain markets; significant changes in market shares for BT and its principal products and services; the
underlying assumptions and estimates made in respect of major customer contracts proving unreliable; the anticipated benefits, synergies and cost savings of the EE integration not
being delivered; the improvements to the control environment proposed following the investigations into BT’s Italian business not being implemented successfully, effectively or
timeously across the Group; the outcome of the BTPS triennial valuation and discussions on the pensions review; and general financial market conditions affecting BT’s performance
and ability to raise finance. BT undertakes no obligation to update any forward-looking statements whether as a result of new information, future events or otherwise.
2

© British Telecommunications plc 2018
Gavin Patterson
3
Group Chief Executive

© British Telecommunications plc 2018
Q3 headlines – delivering against our strategy
4
Improving performance for all stakeholders
• Q3 results broadly in line with our expectations – reiterating full year guidance
• Improving customer experience
• Investing further in FTTP and launched ultrafast retail products
• TV deal agreed with Sky
• Ongoing engagement with Pension Trustee, scheme members and unions
• Cost transformation programmes on track

© British Telecommunications plc 2018
Q3 financial summary
5
Q3 2017/18 Q3 2016/17 Change
Revenue1
– underlying ex transit2
£5,979m £6,126m (2)%
(1.5)%
EBITDA1 £1,826m £1,870m (2)%
Capex £878m £852m 3%
Normalised free cash flow3 £702m £606m up £96m
1 before specific items2 before specific items, foreign exchange movements and disposals3 before specific items, pension deficit payments and the cash tax benefit of pension deficit payments
2017/18 financial outlook unchanged
© British Telecommunications plc 2018
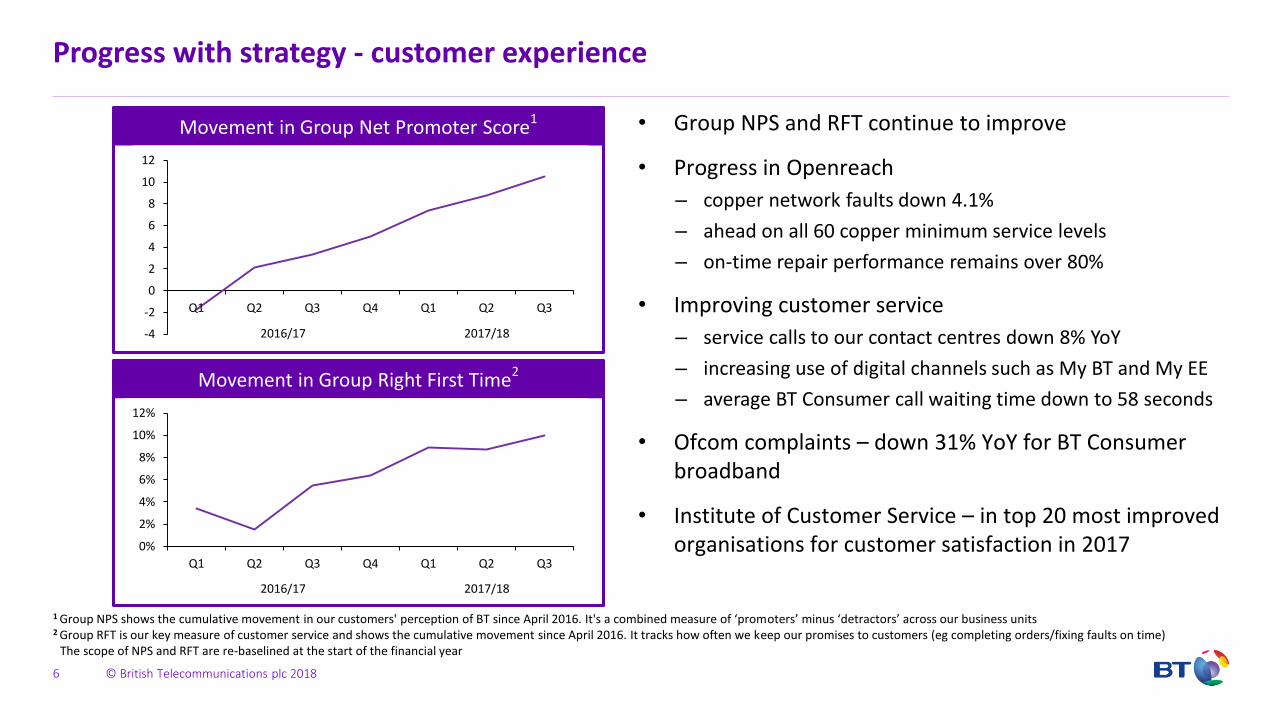
Progress with strategy - customer experience
6
Movement in Group Right First Time2
Movement in Group Net Promoter Score1
2016/17 2017/18
• Group NPS and RFT continue to improve
• Progress in Openreach
– copper network faults down 4.1%
– ahead on all 60 copper minimum service levels
– on-time repair performance remains over 80%
• Improving customer service
– service calls to our contact centres down 8% YoY
– increasing use of digital channels such as My BT and My EE
– average BT Consumer call waiting time down to 58 seconds
• Ofcom complaints – down 31% YoY for BT Consumer broadband
• Institute of Customer Service – in top 20 most improved organisations for customer satisfaction in 2017
1 Group NPS shows the cumulative movement in our customers' perception of BT since April 2016. It's a combined measure of ‘promoters’ minus ‘detractors’ across our business units2 Group RFT is our key measure of customer service and shows the cumulative movement since April 2016. It tracks how often we keep our promises to customers (eg completing orders/fixing faults on time)
The scope of NPS and RFT are re-baselined at the start of the financial year
-4
-2
0
2
4
6
8
10
12
Q1 Q2 Q3 Q4 Q1 Q2 Q3
0%
2%
4%
6%
8%
10%
12%
Q1 Q2 Q3 Q4 Q1 Q2 Q3
2016/17 2017/18

© British Telecommunications plc 2018
Regulation – constructive engagement
7
• Investments need to earn an acceptable return
• Need to reflect costs of increased service levels
• Offset by efficiency gains
• Court of Appeal challenge successful on 1800MHz licence fees
• Investing to maintain the best mobile experience
• Will work with Government to deliver USO – awaiting details on approach to delivery
• Welcome Government ‘Call for Evidence’ – opportunity to shape future of our industry
1 Wholesale Local Access 2 Business Connectivity Market Review 3 Optical Spectrum Access 4 Universal Service Obligation
BCMR2
WLA1
• Dark fibre alternative, OSA3 Filter Connect, launching in April
• Continue to believe dark fibre remedy not required
Spectrum
USO4 & future infrastructure

© British Telecommunications plc 2018
Customer Facing Units update
8

© British Telecommunications plc 2018
BT Consumer – Strong BT Sport viewing and premium TV content deal agreed
9
Q3 2017/18 Q3 2016/17 Change
Revenue £1,261m £1,262m -
EBITDA £250m £260m (4)%
Capex £66m £54m 22%
Season to date3 BT Sport viewing4 at an all-time high
• Revenue flat– increased ARPU
1offset by voice line losses
– 12-month rolling ARPU up 4.8%
– RGUs2
per customer up 3.1%
• EBITDA down 4%, reflecting investment in customer
experience and broadband speed upgrades
• Superfast growth, ultrafast product launches– 152Mbps and 314Mbps
– with minimum speed guarantees of 100Mbps
– 59% of broadband customers now on fibre
• TV agreement with Sky– launch in early 2019
• BT Sport – BT Sport viewing
4up 23% YoY
– All customers5 now pay for BT Sport1 Average Revenue Per User 2 Revenue Generating Units 3 average weekly viewing from start of football season 4 ex digital 5 excluding employees
2013/14 2014/15 2015/16 2016/17 2017/18

© British Telecommunications plc 2018
EE – EBITDA down 6%, driven by high customer investment costs
10
Q3 2017/18 Q3 2016/17 Change
Revenue £1,357m £1,311m 4%
EBITDA £259m £277m (6)%
Capex £122m £153m (20)%
Apple’s premium handset price evolution1
• Revenue up 4% – postpaid up 6%; prepaid down 15%
– Group postpaid mobile ARPU down 1.9%
– Group churn 1.2%
• Group mobile base 29.8m– 235,000 postpaid adds, group base now 17.5m
– 299,000 prepaid decline, group base now 6.0m
• EBITDA down 6%– reflecting investment in premium handsets and smart
watches
– expect strong recovery in Q4
• Investing to improve customer experience– 4G geographic coverage now 90% of UK landmass
– network coverage and performance recognised in latest
RootMetrics reports
1 Apple selling price of smallest capacity premium model at launch
£0
£250
£500
£750
£1,000
iPhone 6 Plus iPhone 6S Plus iPhone 7 Plus iPhone X
Sep 2014 Sep 2015 Sep 2016 Nov 2017

© British Telecommunications plc 2018
25%
27%
29%
31%
33%
35%
Q3 Q4 Q1 Q2 Q3 Q4 Q1 Q2 Q3
Cumulative mobile net adds (LHS) Mobile market share (RHS)
Business and Public Sector – steady progress
11
• Underlying revenue ex transit down 6%– declines in traditional voice and lower equipment sales,
partially offset by continued growth in mobile
– Progress on IP voice – base up 55% YoY
– SME down 3%, Corporate down 7%, Public Sector and
Major Business down 6%
• EBITDA down 8%– reflecting reduction in revenue and strong prior year
comparator
• Order intake down 22%– 12-month rolling up 12%
Q3 2017/18 Q3 2016/17 Change
Revenue– u/l ex transit
£1,125m £1,190m (5)%(6)%
EBITDA £362m £393m (8)%
Capex £69m £74m (7)%
Continued growth in BPS mobile and mobile market share1
2016/17 2017/182015/16
1 Source: BT, IDC

© British Telecommunications plc 2018
Global Services – managed declines in low margin business
12
Q3 2017/18 Q3 2016/17 Change
Revenue– u/l ex transit
£1,266m £1,398m (9)%(6)%
EBITDA £143m £40m 258%
Capex £64m £69m (7)%
Global Services’ revenue and EBITDA movements
• Underlying revenue ex transit down 6%– managed decline in low-margin business
• Restructuring continues– new digital products launched with key suppliers
– progress update at Q4 2017/18 results
• Order intake down 11% to £1.1bn– 12-month rolling down 25%
– reflecting ongoing challenging market conditions
• Strong growth in security services– increasingly important as customers move away from
dedicated MPLS1 to more hybrid networks
• EBITDA up £103m– reflecting one-off items and prior year Italy impact;
broadly in line excluding these items
1 Multi-Protocol Label Switching2 Global Wholesale Voice
Revenue EBITDA
2
£1,398m
£1,266m
Q32016/17
Prioryear Italy
impact
GWV &equipsales
Trading FX andOther
Q32017/18
£40m
£143m
Q32016/17
Prioryear Italy
impact
GWV &equipsales
Trading FX andOther
Q32017/18
2

© British Telecommunications plc 2018
Wholesale and Ventures – stronger Ventures revenue
13
Q3 2017/18 Q3 2016/17 Change
Revenue– u/l ex transit
£506m £528m (4)%(4)%
EBITDA £189m £211m (10)%
Capex £54m £53m 2%
Wholesale and Ventures order book
• Underlying revenue ex transit down 4%– Managed Solutions down 8%; Data and Broadband
down 8%; Voice down 3%
– Mobile revenue down 5% reflecting specific MVNO1
contractual commitments last year
– Ventures revenue up 9% - good growth in bulk messaging and Fleet Solutions
• EBITDA down 10%
– reflecting continued legacy decline and revenue mix
• Order intake £372m, down 61%
– 12-month rolling down 38%
– reflecting two large contracts in prior year
• 86 InLinkUK units live at end of Q3
– providing free calls, wi-fi and other services
– generating advertising revenue 2016/17 2017/18
-
200
400
600
800
1,000
Q1 Q2 Q3 Q4 Q1 Q2 Q3
£m
1 Mobile Virtual Network Operator

© British Telecommunications plc 2018
Openreach – continued strong fibre growth
14
Q3 2017/18 Q3 2016/17 Change
Revenue £1,286m £1,284m -
EBITDA £641m £676m (5)%
Capex £477m £409m 17%
Openreach fibre net adds2
• Revenue flat– continued strong growth in fibre broadband, up 23%
• EBITDA down 5%– increased business rates and higher pension charge
• Normalised free cash flow down 8%– increased opex and capex
• Fibre broadband now available to c.27.4m1 premises– record 600,000 fibre broadband net additions2
– 9.2m premises connected
• Ahead on all 60 copper minimum service levels
• 4.1% reduction year to date in copper network faults
• Targeting 3m premises with FTTP by the end of 2020– first eight cities announced
k
2017/182016/172015/162014/152013/142012/130
100
200
300
400
500
600
1 Using latest Ordnance Survey addressing product 2 Including BT Northern Ireland

© British Telecommunications plc 2018
Q3 summary – delivering against our strategy
15
Improving performance for all stakeholders
• Q3 results broadly in line with our expectations – reiterating full year guidance
• Improving customer experience
• Investing further in FTTP and launched ultrafast retail products
• TV deal agreed with Sky
• Ongoing engagement with Pension Trustee, scheme members and unions
• Cost transformation programmes on track

© British Telecommunications plc 2018
Q & A
16

© British Telecommunications plc 2018
BT Group plcQ3 2017/18 results2 February 2018
17

© British Telecommunications plc 2018
Appendix
18

© British Telecommunications plc 2018
Q3 2017/18 results - financial overview
19
Q3 2017/18 Q3 2016/17 Change
Revenue1
– underlying ex transit2
£5,979m £6,126m (2)%
(1.5)%
Operating costs3 £(4,153)m £(4,256)m (2)%
EBITDA1 £1,826m £1,870m (2)%
1 before specific items2 before specific items, foreign exchange movements and disposals3 before specific items and depreciation and amortisation

© British Telecommunications plc 2018
Q3 2017/18 results - financial overview
20
Q3 2017/18 Q3 2016/17 Change
Adjusted EBITDA1 £1,826m £1,870m (2)%
Depreciation and amortisation £(868)m £(895)m 3%
Net finance expense1 £(139)m £(149)m 7%
Share of post tax loss of associates and joint ventures £(1) - n/m
Tax1 £(176)m £(171)m (3)%
Profit after tax1 £642m £655m (2)%
Specific items £(141)m £(281)m 50%
Profit for the period £501m £374m 34%
1 before specific itemsn/m = not meaningful

© British Telecommunications plc 2018
Q3 2017/18 results - cash flow
21
Q3 2017/181 Q3 2016/171 Change
Adjusted EBITDA £1,826m £1,870m (2)%
Tax paid exc. cash tax benefit of pension deficit payments £(177)m £(175)m (1)%
Change in working capital £79m £(152)m n/m
Change in provisions £(40)m - n/m
Net finance paid £(143)m £(186)m 23%
Cash available for investment and distribution £1,545m £1,357m 14%
Capital expenditure £(843)m £(751)m (12)%
Normalised free cash flow2 £702m £606m 16%
Net debt £8,923m
1 before specific items2 before specific items, pension deficit payments and the cash tax benefit of pension deficit payments
n/m = not meaningful

© British Telecommunications plc 2018
2017/18 financial outlook unchanged
22
Underlying revenue1 ex transit Broadly flat
EBITDA2 £7.5bn - £7.6bn
Normalised free cash flow3 £2.7bn - £2.9bn
Dividend per share Progressive
1 excludes specific items, foreign exchange movements and disposals2 before specific items 3 before specific items, pension deficit payments and the cash tax benefit of pension deficit payments