b.science report 1.2
TRANSCRIPT

Project 1:
Lighting and Acoustic Performance
Evaluation and Design
Building Science 2
[ARC 3413]
Ch‟ng Xing Yue 0310425
Elaine Bong Poh Hui 0310432
Goh Chin Zhi 0314562
Lau Ee Tian 0309596
Wesley Hew Xin Han 0307585
Mr Sanjeh Raman Group
1.0 Introduction of Project
1.1 Aim and Objective 3
1.2 Introduction to Case Study 3
1.3 Plans and Elevations 4
2.0 Precedent Studies
2.1 Acoustic Precedent Study 5-7
2.1.1 Introduction
2.1.2 Plan Analysis
2.1.3 Zoning
2.1.4 Material
2.2 Lighting Precedent Study 8-11
2.2.1 Introduction
2.2.2 Lighting Analysis
2.2.3 Lights Specification
3.0 Research Methodology 12
3. Lighting Analysis
3.1.1 Equipment 13
3.1.2 Method 14
3.2 Acoustic Analysis
3.2.1 Equipment 15
3.2.2 Method 16
4.0 Case Study
4.1.1 Introduction to site 17-18
4.1.2 Materials and Properties 19-20
4.2.1 Building Orientation 21
4.2.2 Lighting Zoning 21-22
4.2.3 Existing Lighting 22-23
4.3 Existing Acoustic 24
4.3.1 Neighboring Sounds 25
4.3.2 External Noise Sources 26-27
4.3.3 Internal Noise Sources 28-29
4.3.4 Design Intention 30-31
5.0 Lighting Analysis
5.1 Lighting Data Record 32-34
5.1.1 Day Lighting 35
5.1.2 Day Light Factor Calculation 35-40
5.1.3 Lumen Method 41-52
5.1.4 Lux Contour Diagram 53
5.1.5 Lux Reading Analysis 54-58
6.0 Acoustic Analysis
6.1 Sound Meter Reading 59
6.2 Graph Analysis of Acoustic Data 60-61
6.3 Acoustic Calculation and Analysis 62-79
6.4 Acoustic Ray Diagram 80-82
7.0 Conclusion 83
7.1 Reference 84
Content

1.0 Introduction of Project
In order to achieve a better understanding of the function and properties of day-
lighting, lighting and acoustic within a space, a study was done on a case study of
our choice. We were to document the lighting and acoustical readings and make an
analysis regarding the design choices that were made to the building in order to
achieve optimal lighting and quality acoustic properties. Several other factors that
will be looked into such as human activity and circulation, climate, material
specification and etcetera which may affect the results will be taken into account.
1.1 Aim and Objective
Located at Jalan SS13/3A, Subang Jaya, this four-storeys multipurpose building
known as Lifepoint, Subang Jaya Assembly of God was constructed from the old
Faber Castell office and factory that is now changed into a church that is also
commonly used as a community center to hold various events and activities. SH Teh
Architect had redesigned the building alongside the existing structures on the 21th of
November 2009 and renovated once more on the 10th of October 2011.
1.2 Introduction to Case Study
Architect: Ar. Teh Soh Huang
Total floor area: 4559.2m2
Address: 14 Jalan SS13/3A 47500
Subang Jaya Selangor Darul Ehsan
Malaysia.
3

Ground Floor Plan
Front Elevation
Back Elevation
1.3 Plans and Elevation
4

2.1 Acoustic Precedent Study
Holy Cross Church, Dewitt, New York
To meet the growing needs of the church members, an expansion of space is
needed accommodate the number of users. As such the inner portion of the
church housing over 700 members will require a proper acoustic system.
The Holy Cross Church had resolved the acoustical issue through the use of a
wide-fan-plan nave on the lower floor level and the placement of choir and
gallery at the upper level.
2.1.1 Introduction
Figure 2.1.1a: Front View of Facade
Figure 2.1.1b: View of Aisles Figure 2.1.1c: View of Stage from Loft
5

2.1.3 Zoning
Hall
2.1.2 Plan Analysis
The wide-fan plan has hard surfaces along the sides whereas the rear have
been equipped with sound absorbing material to minimize the return of sound to
the front of the room with excessive delay. The large surface area at the back of
the hall serves the purpose of amplifying sounds produced on stage. But hard
surfaces are commonly preferred primarily for aesthetic purposes but also allows
for a balance between refraction and reflection.
The hall on the first floor has a symmetrical fan-shaped plan that lets the sound
travel uniformly as it is important for the speaker‟s voice to be heard evenly
through the hall. Seats are arranged at an angle aligned with the
sanctuary(stage) allowing the people seated on the same row to receive a
constant amplitude.
Figure 2.1.3a: Zoning of Plans
6

Material Absorption Coefficient
(500 Hz)
Acoustic Properties
Drywall 0.17 Reflects sound
Glass 0.18 Reflects sound
Timber chair 0.22 Reflects sound
Acoustic Panel 0.59 Absorbs sound
2.1.4 Material
Zone Description
Hall To provide a natural acoustic response ideal for speech, an electronic
acoustic enhancement system is installed to produce ideal reverberant
response.
Side walls are mainly hard surfaces with glass panels as decorative
element, and rear wall is replaced with acoustic panel to prevent
sounds from traveling to other spaces.
Office Space If noise levels in office spaces are too high then it is harder for staff
members to concentrate; if noise levels are particularly low then speech
privacy can become an issue. According to BS 8233, suggests that a
good indoor ambient noise level within cellular office spaces should be
in the range of 40 to 50 dB.
(http://www.customaudiodesigns.co.uk/office-acoustics.htm)
Thus it is important for the acoustic panel to be placed in between both
the office space and the hall
Mechanical Room Machineries in mechanical room produce sound and vibration that can
transfer through walls and floor. Insulation is applied to the wall and
isolation pad is constructed into the floor slab to reduce the vibration
and sound from traveling to the main hall.
Tabel 2.1.3b: Zone Details of Church
Figure 2.1.4a: Sectional Diagram of Church
Figure 2.1.4b: Table of Material of Church Hall 7
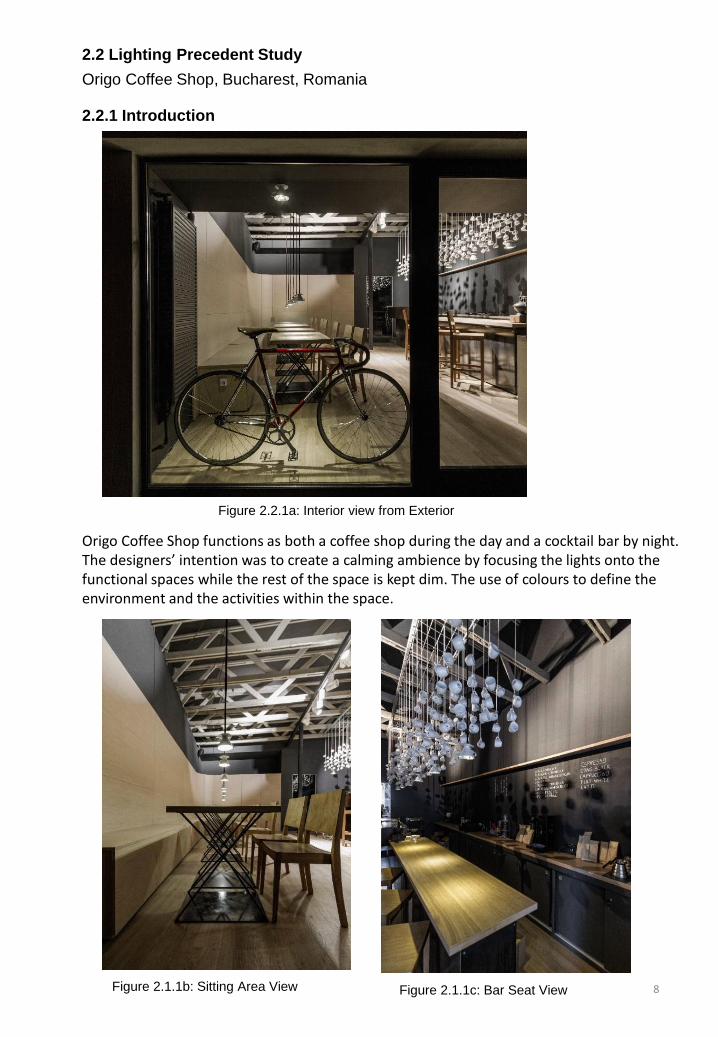
2.2 Lighting Precedent Study
Origo Coffee Shop, Bucharest, Romania
Origo Coffee Shop functions as both a coffee shop during the day and a cocktail bar by night. The designers’ intention was to create a calming ambience by focusing the lights onto the functional spaces while the rest of the space is kept dim. The use of colours to define the environment and the activities within the space.
2.2.1 Introduction
Figure 2.1.1b: Sitting Area View
Figure 2.2.1a: Interior view from Exterior
Figure 2.1.1c: Bar Seat View 8
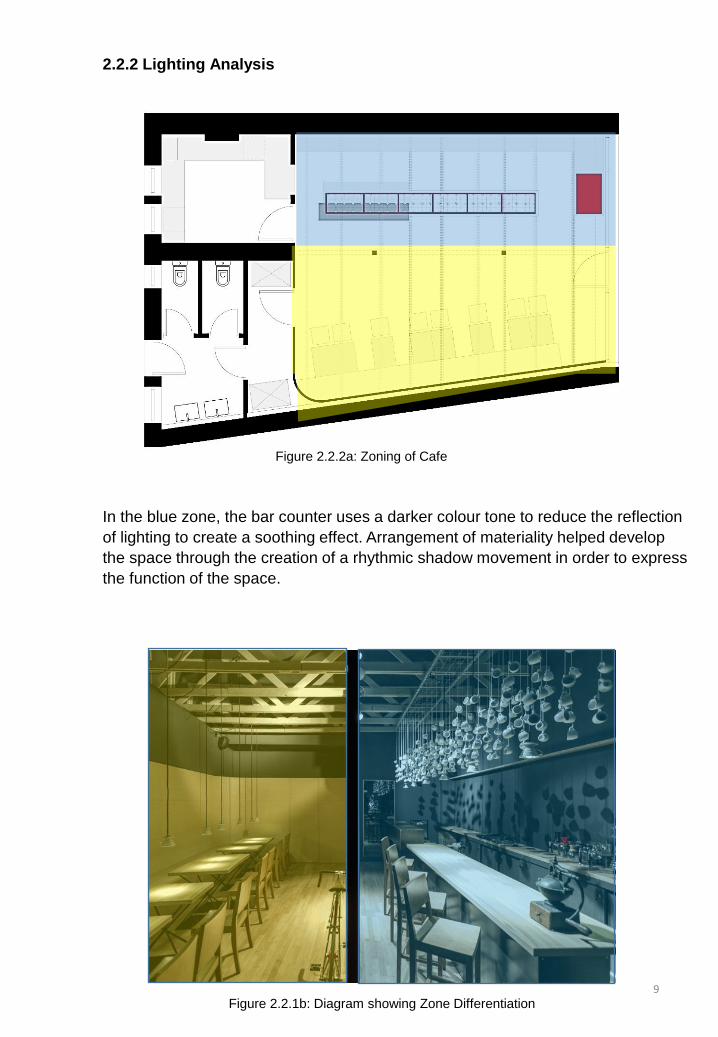
In the blue zone, the bar counter uses a darker colour tone to reduce the reflection
of lighting to create a soothing effect. Arrangement of materiality helped develop
the space through the creation of a rhythmic shadow movement in order to express
the function of the space.
2.2.2 Lighting Analysis
Figure 2.2.2a: Zoning of Cafe
Figure 2.2.1b: Diagram showing Zone Differentiation 9
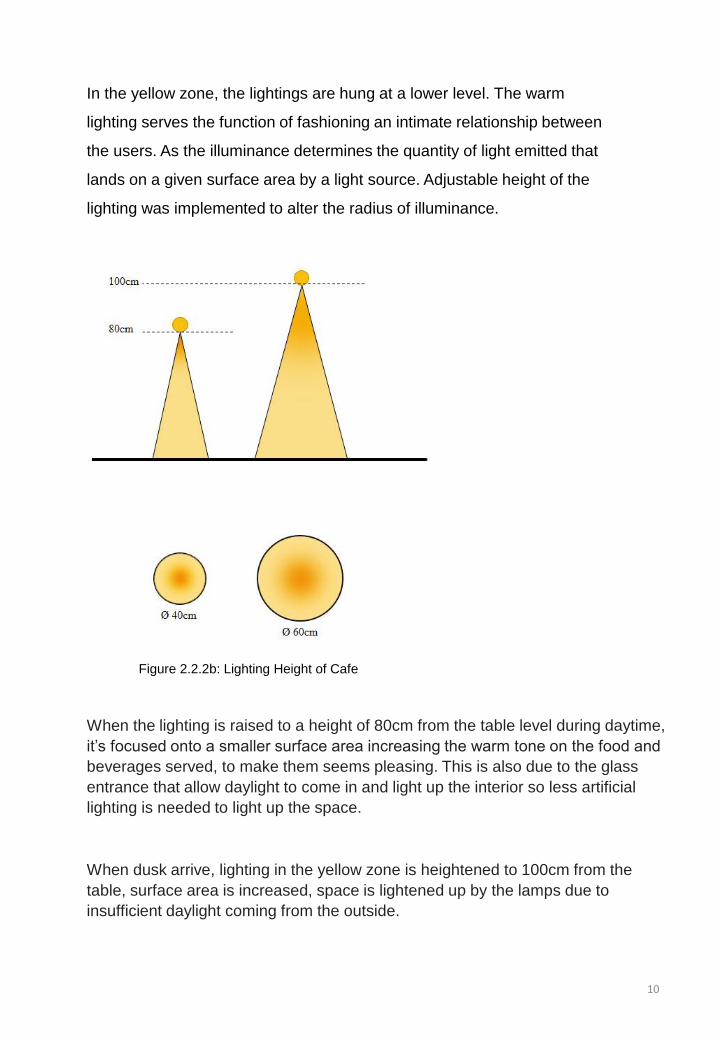
In the yellow zone, the lightings are hung at a lower level. The warm
lighting serves the function of fashioning an intimate relationship between
the users. As the illuminance determines the quantity of light emitted that
lands on a given surface area by a light source. Adjustable height of the
lighting was implemented to alter the radius of illuminance.
When the lighting is raised to a height of 80cm from the table level during daytime,
it‟s focused onto a smaller surface area increasing the warm tone on the food and
beverages served, to make them seems pleasing. This is also due to the glass
entrance that allow daylight to come in and light up the interior so less artificial
lighting is needed to light up the space.
When dusk arrive, lighting in the yellow zone is heightened to 100cm from the
table, surface area is increased, space is lightened up by the lamps due to
insufficient daylight coming from the outside.
Figure 2.2.2b: Lighting Height of Cafe
10
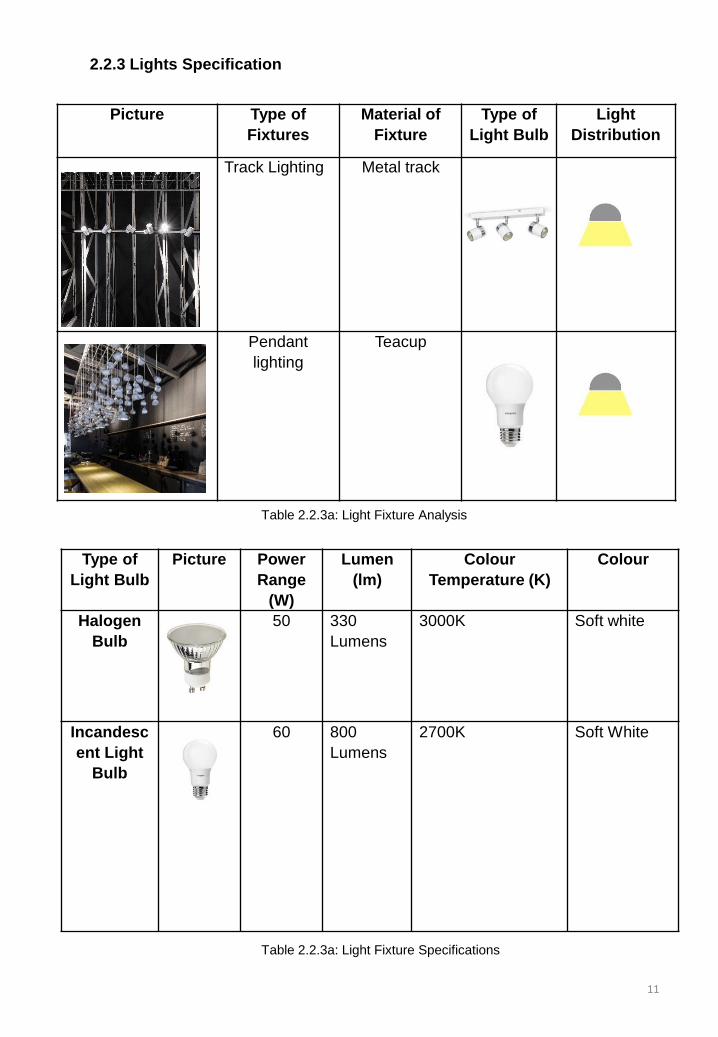
Picture Type of
Fixtures
Material of
Fixture
Type of
Light Bulb
Light
Distribution
Track Lighting Metal track
Pendant
lighting
Teacup
2.2.3 Lights Specification
Type of
Light Bulb
Picture Power
Range
(W)
Lumen
(lm)
Colour
Temperature (K)
Colour
Halogen
Bulb
50 330
Lumens
3000K Soft white
Incandesc
ent Light
Bulb
60 800
Lumens
2700K Soft White
Table 2.2.3a: Light Fixture Analysis
Table 2.2.3a: Light Fixture Specifications
11

3.0 Research Methodology
Preliminary study and identification of the types of
spaces are done to choose a suitable case study that
meets the requirements for the project
Emails, visitation and calls are made to different
chosen venues to obtain approval to conduct our study
on the site.
The production of plans and sections are done digitally
after hardcopies were given by the management of the
Church. Gridlines and spaces are determined to ensure
easy navigation during visit.
Before site visit, the timing and methods of taking
readings and delegation of tasks are determined to
prevent confusion among group members. Tools and
equipment and the reading of manual books are done
beforehand.
During site visit, observations on surrounding and how
people use the space are done. Identification of data
needed for analysis are carried out.
The data and reading collected are compiled and
tabulated into report.
Equipment used: Measuring tape, masking tape, paper holder, laser distance
measuring tool, graph paper, sound detector, lux meter, camera
12
3.1 Lighting Analysis
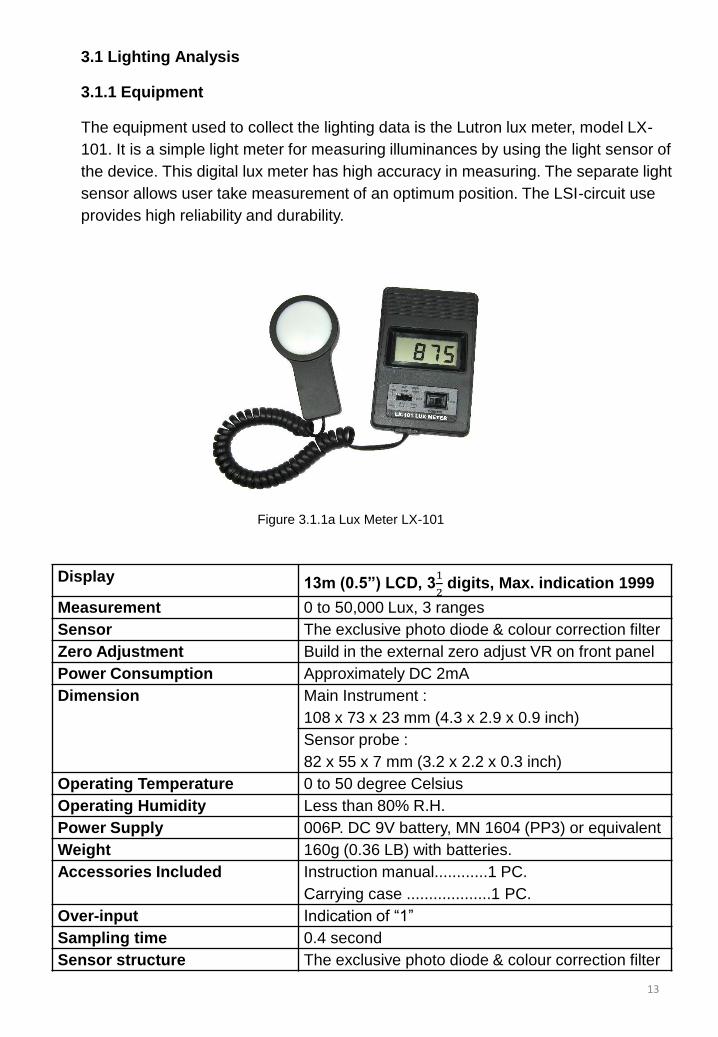
3.1.1 Equipment
The equipment used to collect the lighting data is the Lutron lux meter, model LX-
101. It is a simple light meter for measuring illuminances by using the light sensor of
the device. This digital lux meter has high accuracy in measuring. The separate light
sensor allows user take measurement of an optimum position. The LSI-circuit use
provides high reliability and durability.
Figure 3.1.1a Lux Meter LX-101
Display 13m (0.5”) LCD, 31
2 digits, Max. indication 1999
Measurement 0 to 50,000 Lux, 3 ranges
Sensor The exclusive photo diode & colour correction filter
Zero Adjustment Build in the external zero adjust VR on front panel
Power Consumption Approximately DC 2mA
Dimension Main Instrument :
108 x 73 x 23 mm (4.3 x 2.9 x 0.9 inch)
Sensor probe :
82 x 55 x 7 mm (3.2 x 2.2 x 0.3 inch)
Operating Temperature 0 to 50 degree Celsius
Operating Humidity Less than 80% R.H.
Power Supply 006P. DC 9V battery, MN 1604 (PP3) or equivalent
Weight 160g (0.36 LB) with batteries.
Accessories Included Instruction manual............1 PC.
Carrying case ...................1 PC.
Over-input Indication of “1”
Sampling time 0.4 second
Sensor structure The exclusive photo diode & colour correction filter
13
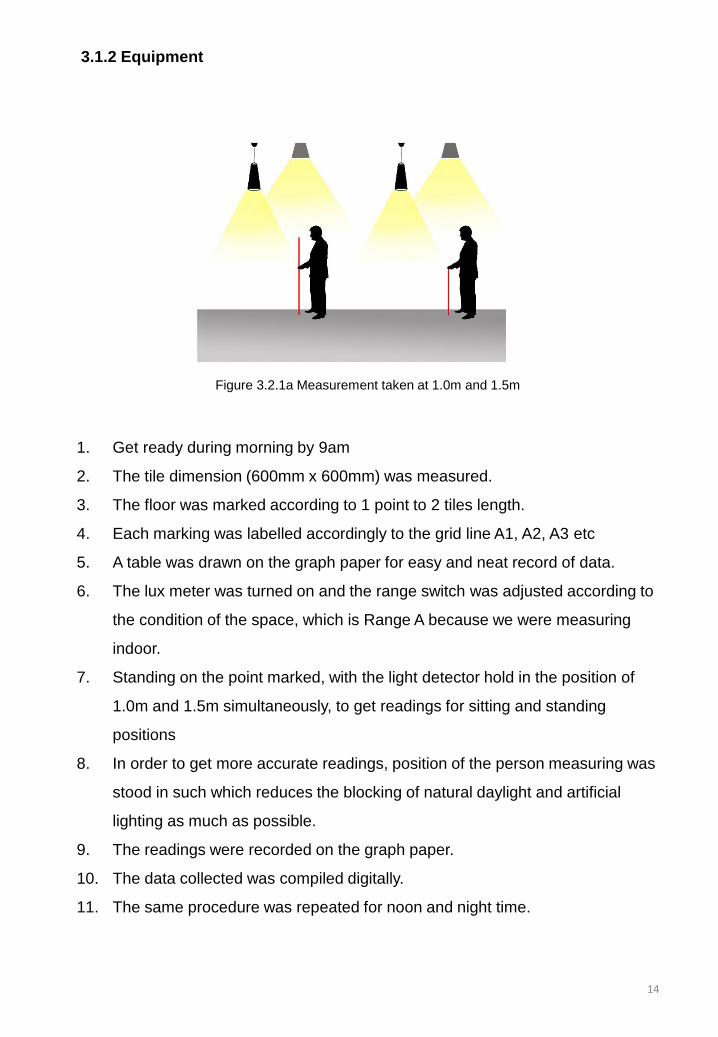
1. Get ready during morning by 9am
2. The tile dimension (600mm x 600mm) was measured.
3. The floor was marked according to 1 point to 2 tiles length.
4. Each marking was labelled accordingly to the grid line A1, A2, A3 etc
5. A table was drawn on the graph paper for easy and neat record of data.
6. The lux meter was turned on and the range switch was adjusted according to
the condition of the space, which is Range A because we were measuring
indoor.
7. Standing on the point marked, with the light detector hold in the position of
1.0m and 1.5m simultaneously, to get readings for sitting and standing
positions
8. In order to get more accurate readings, position of the person measuring was
stood in such which reduces the blocking of natural daylight and artificial
lighting as much as possible.
9. The readings were recorded on the graph paper.
10. The data collected was compiled digitally.
11. The same procedure was repeated for noon and night time.
3.1.2 Equipment
Figure 3.2.1a Measurement taken at 1.0m and 1.5m
14
3.2 Acoustic Approach
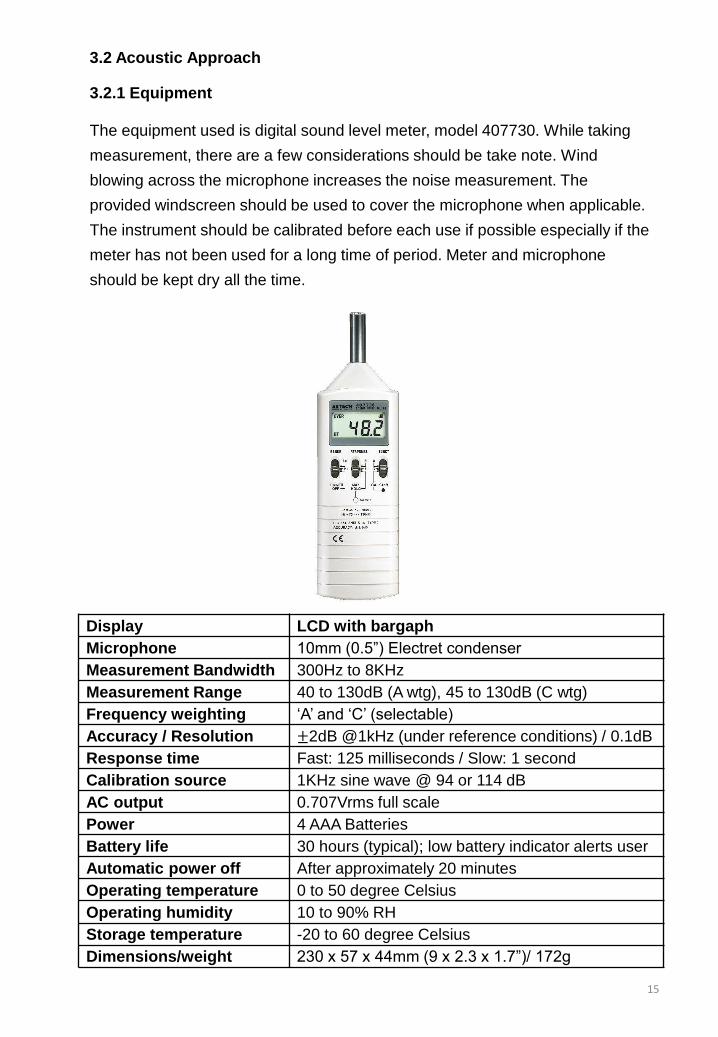
3.2.1 Equipment
The equipment used is digital sound level meter, model 407730. While taking
measurement, there are a few considerations should be take note. Wind
blowing across the microphone increases the noise measurement. The
provided windscreen should be used to cover the microphone when applicable.
The instrument should be calibrated before each use if possible especially if the
meter has not been used for a long time of period. Meter and microphone
should be kept dry all the time.
Display LCD with bargaph
Microphone 10mm (0.5”) Electret condenser
Measurement Bandwidth 300Hz to 8KHz
Measurement Range 40 to 130dB (A wtg), 45 to 130dB (C wtg)
Frequency weighting „A‟ and „C‟ (selectable)
Accuracy / Resolution ±2dB @1kHz (under reference conditions) / 0.1dB
Response time Fast: 125 milliseconds / Slow: 1 second
Calibration source 1KHz sine wave @ 94 or 114 dB
AC output 0.707Vrms full scale
Power 4 AAA Batteries
Battery life 30 hours (typical); low battery indicator alerts user
Automatic power off After approximately 20 minutes
Operating temperature 0 to 50 degree Celsius
Operating humidity 10 to 90% RH
Storage temperature -20 to 60 degree Celsius
Dimensions/weight 230 x 57 x 44mm (9 x 2.3 x 1.7”)/ 172g
15

3.2.2 Method
1. Get ready before service started on Sunday
2. The points were marked according to the grid lines by using the laser distance
measuring tool and measuring tape due to the large size of the hall.
3. Standing on the point marked, with the sound detector hold in the position of 1.0m,
to get reading for sitting position
4. The readings were recorded on the graph paper
5. The date collected were compiled digitally
6. The same procedure was repeated for during service and after service, to
conclude the peak and non-peak moments.
7. Due to the prohibition of disrupting the Sunday service, a re-enactment was done
using the sound system of the hall after service, with the permission of the pastor.
16

4.1.1 Introduction to Site
Case Study
Building Industrial Retail Residential Road River Vegetation
Located in the quiet industrial area in SS13/3A, near to the main New Pantai
Expressway (NPE), the church Is a four storeys building, where the main hall and
cafeteria spaces are located at the ground floor.
Building is situated within its site surrounded by road, where congestion would get very
bad during peak hours. Vegetation and buildings surrounding site, would buffer noises
from road.
The church is usually opened 9am to 5pm on weekdays, Saturday 9am to 2pm,
Sunday 8am to 2pm. During mentioned hours, church is operated, thus it is important
to observe site‟s condition during those period.
Main road, towards NPE Highway
Intersection to site
Driveway to building
1
2
3
17
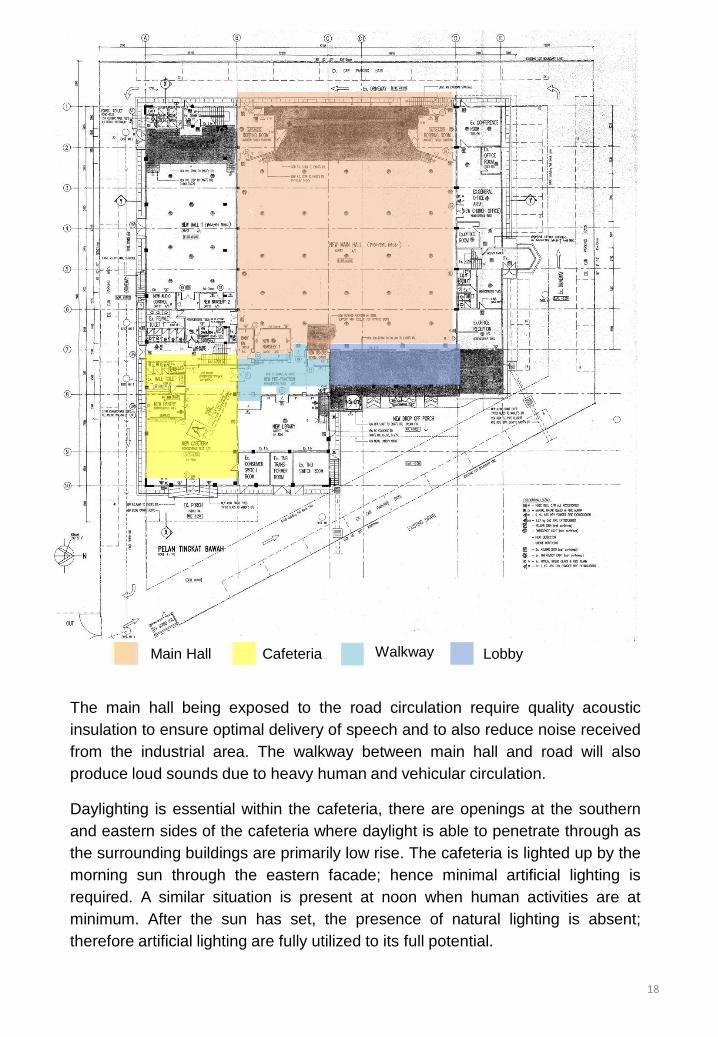
Main Hall
Cafeteria Walkway
`
Lobby
The main hall being exposed to the road circulation require quality acoustic
insulation to ensure optimal delivery of speech and to also reduce noise received
from the industrial area. The walkway between main hall and road will also
produce loud sounds due to heavy human and vehicular circulation.
Daylighting is essential within the cafeteria, there are openings at the southern
and eastern sides of the cafeteria where daylight is able to penetrate through as
the surrounding buildings are primarily low rise. The cafeteria is lighted up by the
morning sun through the eastern facade; hence minimal artificial lighting is
required. A similar situation is present at noon when human activities are at
minimum. After the sun has set, the presence of natural lighting is absent;
therefore artificial lighting are fully utilized to its full potential.
18

4.2 Material and Properties
Material Picture Location Texture Surface
Type
Colour Reflectance
Value (%)
Reinforced
Concrete
Zone B
and Zone
D
Rough Non-
Reflective
Light
Orange
50
Homogeneous
Flooring Tile
Zone B
and Zone
D
Smooth Reflective
Dark
Black
30
Ceramic
Flooring Tile
Zone C Matte
Reflective Light
Brown
60
Main hall‟s interior, facing entrance
leading to walkway.
Overall view of building‟s exterior
Main hall‟s interior, facing stage
Acoustics panel on the sides of main hall
Overall view of cafeteria
Entrance of cafeteria
Close up view of pantry
Table 4.1.1a: Material Detail 19
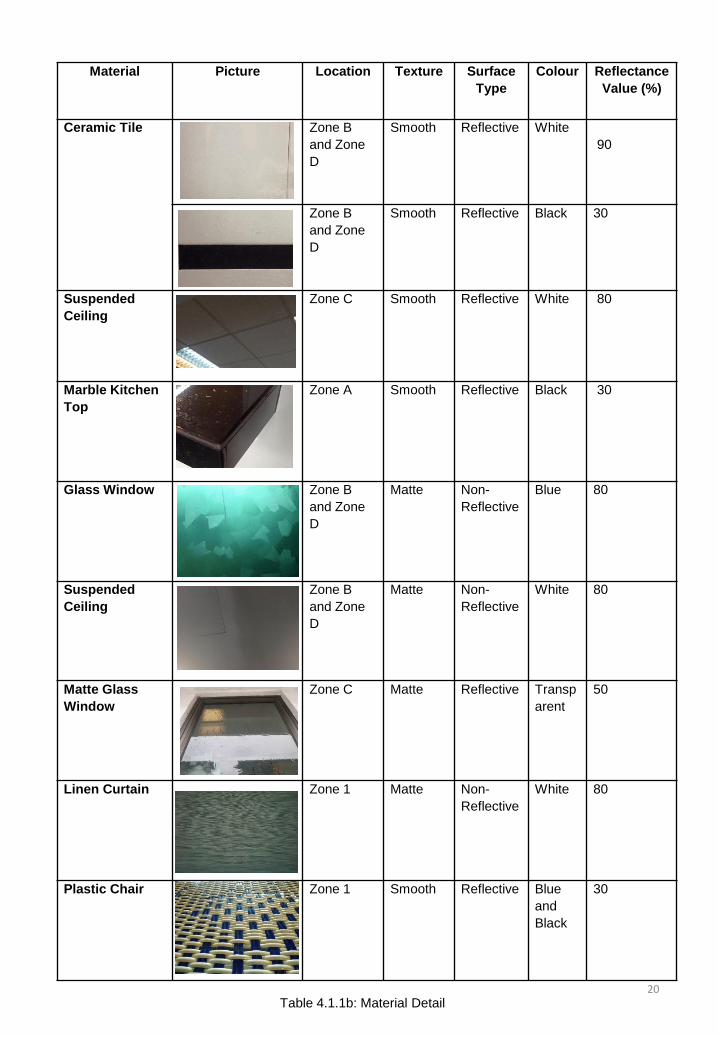
Material Picture Location Texture Surface
Type
Colour Reflectance
Value (%)
Ceramic Tile Zone B
and Zone
D
Smooth Reflective
White
90
Zone B
and Zone
D
Smooth Reflective Black 30
Suspended
Ceiling
Zone C Smooth Reflective
White 80
Marble Kitchen
Top
Zone A Smooth
Reflective Black 30
Glass Window Zone B
and Zone
D
Matte Non-
Reflective
Blue 80
Suspended
Ceiling
Zone B
and Zone
D
Matte Non-
Reflective
White 80
Matte Glass
Window
Zone C Matte Reflective
Transp
arent
50
Linen Curtain Zone 1 Matte Non-
Reflective
White 80
Plastic Chair
Zone 1 Smooth Reflective Blue
and
Black
30
Table 4.1.1b: Material Detail 20
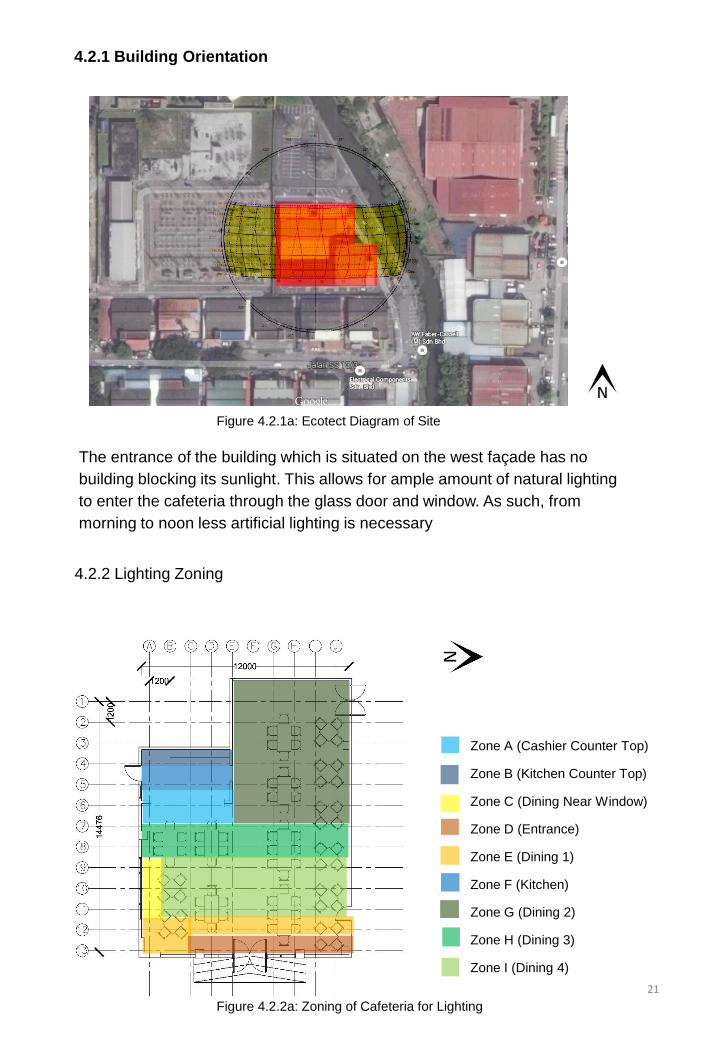
Zone A (Cashier Counter Top)
Zone B (Kitchen Counter Top)
Zone C (Dining Near Window)
Zone D (Entrance)
Zone E (Dining 1)
Zone F (Kitchen)
Zone G (Dining 2)
Zone H (Dining 3)
Zone I (Dining 4)
4.2.2 Lighting Zoning
The entrance of the building which is situated on the west façade has no
building blocking its sunlight. This allows for ample amount of natural lighting
to enter the cafeteria through the glass door and window. As such, from
morning to noon less artificial lighting is necessary
4.2.1 Building Orientation
Figure 4.2.1a: Ecotect Diagram of Site
Figure 4.2.2a: Zoning of Cafeteria for Lighting
21

Types of Lights Artificial Light Type of Light
Bulb
Compact
Fluorescent
Light Type of Fixture Linear Lighting
Type of Luminaries Bright White
Power (W) 26
Luminous Flux(lm) 1560
Number of Bulbs 52
Colour Temperature, K 3,500
Average Life Rate(Hrs) 10,000
Lumens Maintenance Excellent Beam Angle 45
CRI 82
45°
4.3 Existing Lighting
Exterior view of entrance to the cafeteria of the church Interior view of entrance to the cafeteria of the church
Exterior view of the cafeteria‟s side wall Interior view of the cafeteria‟s side wall
22
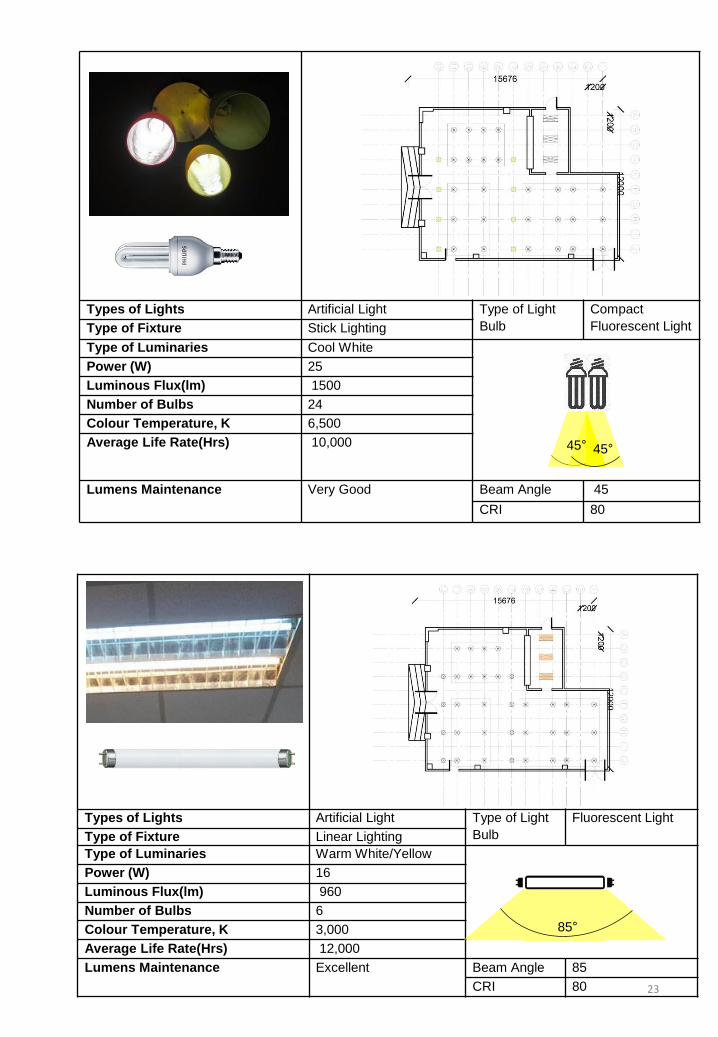
Types of Lights Artificial Light Type of Light
Bulb
Compact
Fluorescent Light Type of Fixture Stick Lighting
Type of Luminaries Cool White
Power (W) 25
Luminous Flux(lm) 1500
Number of Bulbs 24
Colour Temperature, K 6,500
Average Life Rate(Hrs) 10,000
Lumens Maintenance Very Good Beam Angle 45
CRI 80
Types of Lights Artificial Light Type of Light
Bulb
Fluorescent Light
Type of Fixture Linear Lighting
Type of Luminaries Warm White/Yellow
Power (W) 16
Luminous Flux(lm) 960
Number of Bulbs 6
Colour Temperature, K 3,000
Average Life Rate(Hrs) 12,000
Lumens Maintenance Excellent Beam Angle 85
CRI 80
85°
45° 45°
23
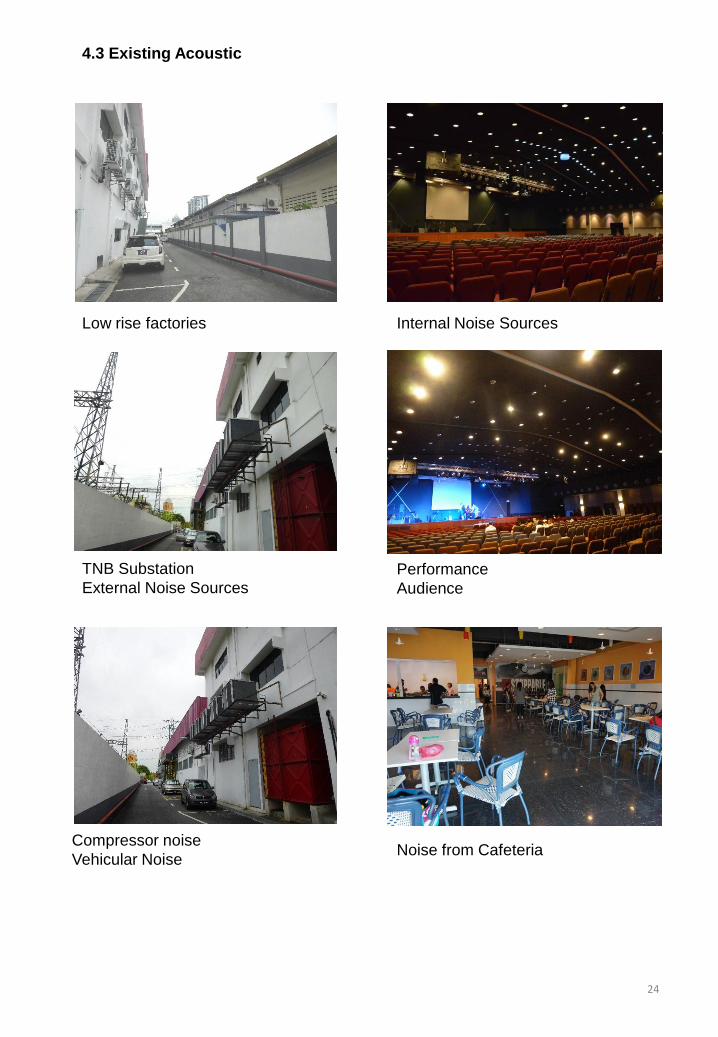
Low rise factories
TNB Substation External Noise Sources
Compressor noise
Vehicular Noise
Internal Noise Sources
Performance
Audience
Noise from Cafeteria
4.3 Existing Acoustic
24
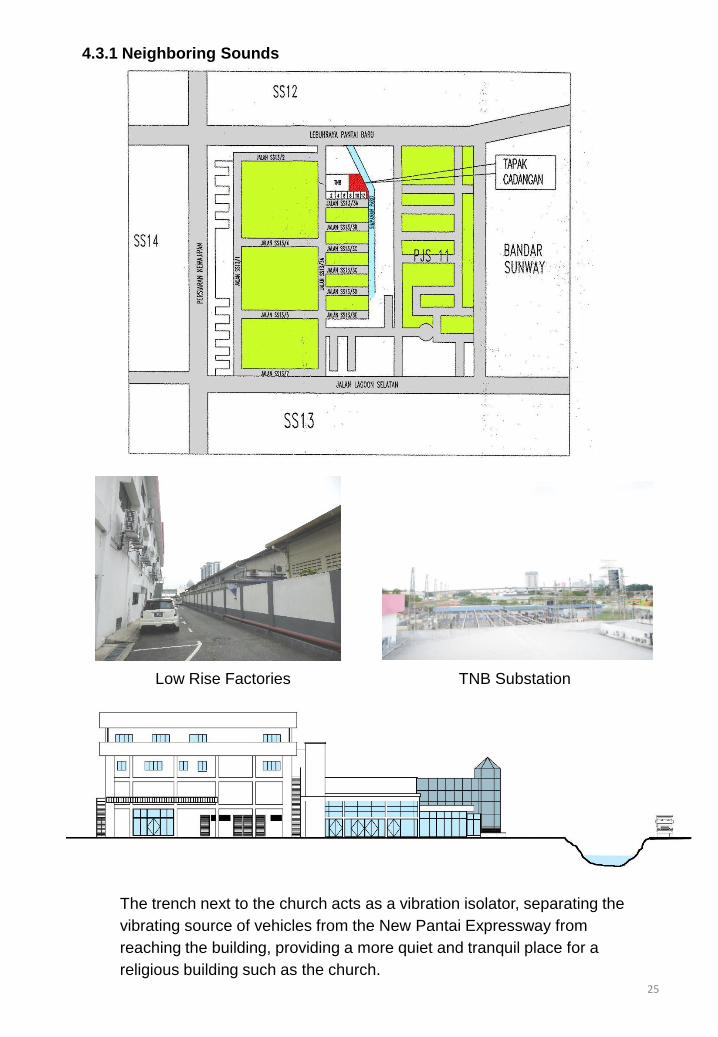
The trench next to the church acts as a vibration isolator, separating the
vibrating source of vehicles from the New Pantai Expressway from
reaching the building, providing a more quiet and tranquil place for a
religious building such as the church.
4.3.1 Neighboring Sounds
Low Rise Factories TNB Substation
25

The main hall is located in the middle of the Church, surrounded by the road
path for people to circulate around the church and adjacent to the office
area, hall 1, and lobby area.
4.3.2 External Noise Sources
26
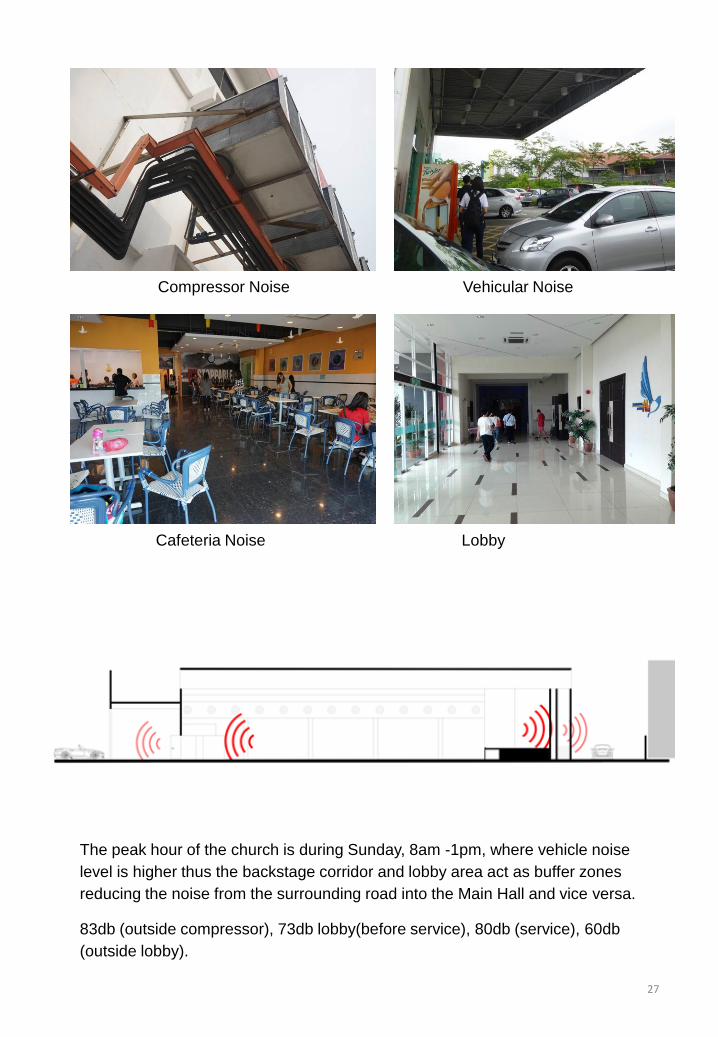
Compressor Noise Vehicular Noise
Cafeteria Noise Lobby
The peak hour of the church is during Sunday, 8am -1pm, where vehicle noise
level is higher thus the backstage corridor and lobby area act as buffer zones
reducing the noise from the surrounding road into the Main Hall and vice versa.
83db (outside compressor), 73db lobby(before service), 80db (service), 60db
(outside lobby).
27

The main source of internal noise comes from the stage where the sounds
usually originate from the speakers and musical instruments during
performance and service times. The noise made by the people attending the
events in the hall also contribute to the internal noise, through conversations,
movements and the opening and closing of the entrance doors.
Subtle noises of the air conditioning from the sides of the hall also creates
sound in the space.
4.3.3 Internal Noise Sources
28

Open and Closing of Doors
Air Conditioning System
Musical instruments
Ceiling mounted speakers
Floor Speakers Performance and Crowd
29

4.3.4 Design Intention
More openings are located connecting to the lobby which acts as a buffer zone
with minimal openings to the sides reduce the transfer of the sound out from the
hall to the adjacent spaces in the Church.
The installation of the acoustic panels on the walls, the use of the cushioned chairs,
the use of timber flooring and the use of perforated gypsum ceiling boards absorb the
sound energy from the sound sources. Yet by alternating reflective and absorptive
surface materials and creating irregularities in surfaces, the diffusion of the sound is
created. This enables a uniform distribution of sound, making the acoustical quality of
the hall not to be too dead or having too much echoes. 30

The hall is designed in portal frame to allow sound to be spread across the hall due
to the angle of the ceiling. Suspended perforated gypsum boards are installed on
the ceiling to absorb excess sound preventing too much reverberation as it will
cause difficulty in understanding the speech.
Air gap between walls of Main Hall and Hall 1 is to reduce the transmission of
sound vibration through structure borne, preventing the services from the different
halls from disturbing one another.
The 125mm thick brick wall with plastering at both sides reflects the sound to
the main hall space from the stage and cuts down the sound transferring
outside by diffracting it.
31

Morning 1.0 m
A B C D E F G H I J
1 9 10 9 9 9
2 9 11 9 9 9
3 9 10 9 9 11
4 31 38 41 47 37 11 11 9 10 12
5 32 41 41 40 38 14 14 11 9 12
6 11 17 15 17 20 11 12 10 10 9
7 7 13 16 16 15 18 9 14 12 12
8 15 20 14 18 18 26 16 12 16 10
9 60 29 18 27 20 32 25 14 16 11
10 100 40 20 26 23 27 35 29 12 9
11 69 29 20 22 20 38 34 22 12 9
12 10 18 17 29 35 70 58 19 12 9
13 9 11 10 99 125 157 91 8 9 9
Morning 1.5 m
A B C D E F G H I J
1 20 24 20 16 14
2 22 24 26 19 17
3 23 29 28 19 18
4 123 30 14 11 10 27 27 25 17 15
5 17 88 25 15 11 29 24 23 16 15
6 10 11 14 11 14 21 22 20 15 13
7 11 15 15 15 14 22 16 19 15 14
8 16 18 13 20 16 27 21 28 23 18
9 62 25 15 22 23 37 37 36 24 23
10 115 30 18 28 32 47 35 42 28 23
11 55 18 21 40 45 60 45 33 23 16
12 14 17 24 48 80 110 65 21 12 11
13 10 11 12 57 210 254 126 9 10 9
5.1 Lighting Data Record
Zone A (Cashier Counter Top)
Zone B (Kitchen Counter Top)
Zone C (Dining Near Window)
Zone D (Entrance)
Zone E (Dining 1)
Zone F (Kitchen)
Zone G (Dining 2)
Zone H (Dining 3)
Zone I (Dining 4)
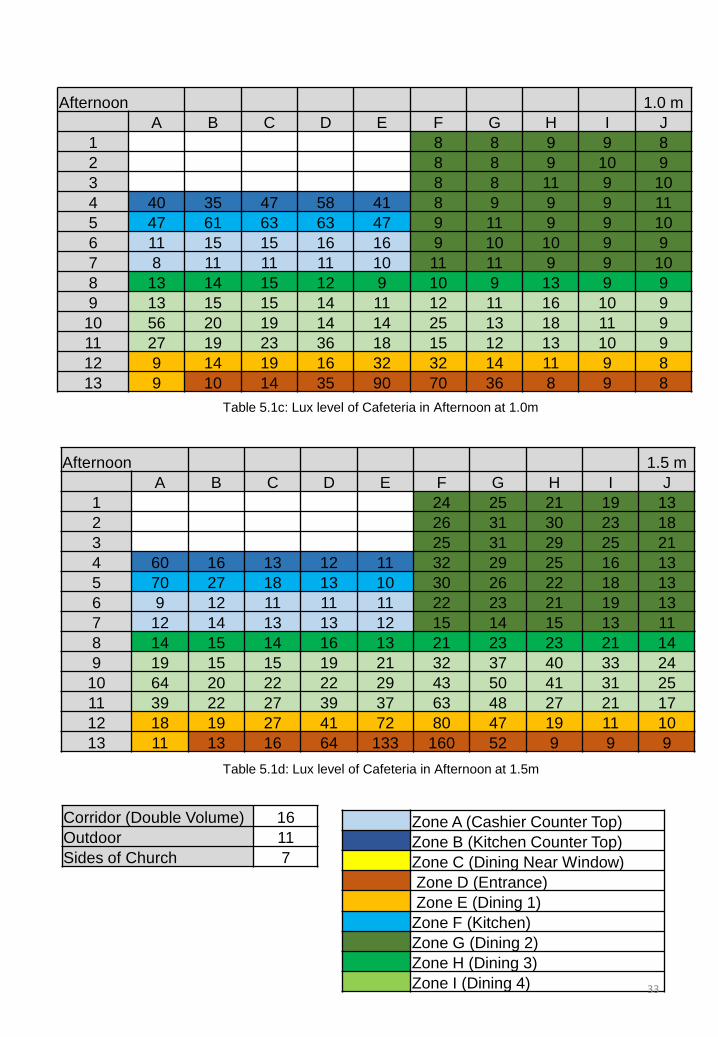
Corridor (Double Volume) 16
Outdoor 11
Sides of Church 7
Table 5.1a: Lux level of Cafeteria in Morning at 1.0m
Table 5.1b: Lux level of Cafeteria in Morning at 1.5m
32
Afternoon 1.0 m
A B C D E F G H I J
1 8 8 9 9 8
2 8 8 9 10 9
3 8 8 11 9 10
4 40 35 47 58 41 8 9 9 9 11
5 47 61 63 63 47 9 11 9 9 10
6 11 15 15 16 16 9 10 10 9 9
7 8 11 11 11 10 11 11 9 9 10
8 13 14 15 12 9 10 9 13 9 9
9 13 15 15 14 11 12 11 16 10 9
10 56 20 19 14 14 25 13 18 11 9
11 27 19 23 36 18 15 12 13 10 9
12 9 14 19 16 32 32 14 11 9 8
13 9 10 14 35 90 70 36 8 9 8
Afternoon 1.5 m
A B C D E F G H I J
1 24 25 21 19 13
2 26 31 30 23 18
3 25 31 29 25 21
4 60 16 13 12 11 32 29 25 16 13
5 70 27 18 13 10 30 26 22 18 13
6 9 12 11 11 11 22 23 21 19 13
7 12 14 13 13 12 15 14 15 13 11
8 14 15 14 16 13 21 23 23 21 14
9 19 15 15 19 21 32 37 40 33 24
10 64 20 22 22 29 43 50 41 31 25
11 39 22 27 39 37 63 48 27 21 17
12 18 19 27 41 72 80 47 19 11 10
13 11 13 16 64 133 160 52 9 9 9
Zone A (Cashier Counter Top)
Zone B (Kitchen Counter Top)
Zone C (Dining Near Window)
Zone D (Entrance)
Zone E (Dining 1)
Zone F (Kitchen)
Zone G (Dining 2)
Zone H (Dining 3)
Zone I (Dining 4)
Corridor (Double Volume) 16
Outdoor 11
Sides of Church 7
Table 5.1c: Lux level of Cafeteria in Afternoon at 1.0m
Table 5.1d: Lux level of Cafeteria in Afternoon at 1.5m
33

Night 1.0 m
A B C D E F G H I J
1 19 20 17 16 12
2 20 22 24 21 15
3 21 24 23 21 14
4 32 32 32 29 32 22 24 20 17 12
5 30 40 40 40 36 21 20 19 13 12
6 10 20 13 17 15 17 15 15 14 11
7 10 16 17 16 15 14 14 13 13 11
8 16 17 19 17 16 18 20 19 16 14
9 14 17 17 18 14 22 26 24 24 17
10 14 18 18 17 17 21 22 26 22 18
11 15 18 20 17 16 15 14 19 17 15
12 14 15 16 14 14 11 9 12 11 10
13 11 10 10 11 12 10 9 8 9 8
Night 1.5 m
A B C D E F G H I J
1 21 21 19 18 12
2 21 27 27 23 14
3 23 28 28 24 15
4 38 35 44 49 38 26 28 26 14 11
5 45 47 73 65 47 26 23 15 16 9
6 10 14 13 17 13 21 19 13 17 10
7 8 17 18 15 15 12 12 11 10 9
8 14 19 20 17 14 17 17 20 15 10
9 15 18 20 20 16 28 29 31 30 16
10 12 21 20 17 15 25 28 25 23 16
11 15 19 22 17 13 17 18 17 21 14
12 16 17 22 14 15 10 10 8 9 8
13 10 11 12 11 10 10 9 8 8 8
Zone A (Cashier Counter Top)
Zone B (Kitchen Counter Top)
Zone C (Dining Near Window)
Zone D (Entrance)
Zone E (Dining 1)
Zone F (Kitchen)
Zone G (Dining 2)
Zone H (Dining 3)
Zone I (Dining 4)
Corridor (Double Volume) 16
Outdoor 11
Sides of Church 7
Table 5.1f: Lux level of Cafeteria at Night at 1.5m
Table 5.1e: Lux level of Cafeteria at Night at 1.0m
34

5.1.1 Day Lighting
Zone Daylight Factors (%) Distribution
Very Bright > 6 Very large with thermal and glare problems
Bright 3 – 6 Good
Average 1 -3 Fair
Dark 0 -1 Poor
Daylight factors are used to determine the ratio of the internal light level to the
external light level. It is calculated using the following equation, as stated below.
DF: Daylight Factors
Ei: Indoor Illuminance
Eo: Outdoor Illuminance
The following tables describe the average daylight factors in a space. (MS 1525)
5.1.2 Daylight Factor Calculation
1. Zone A (Cashier Counter Top)
1.0m (Sitting
Level)
1.5m (Standing
Level)
Average Lux Reading During
Morning
15 13
Average Lux Reading During
Afternoon
12 12
Average Lux Reading During
Night
15 14
Date and Time
Recording Level Outdoor (Standing Level) Indoor (Standing Level)
Lux Meter Reading 32000 12
Calculations: Daylight Factor = (E in/ E ext) x 100%
= (16/32000) x 100%
= 0.04% 35
1.0m (Sitting
Level)
1.5m (Standing
Level)
Average Lux Reading During Morning 39 38
Average Lux Reading During
Afternoon
44 22
Average Lux Reading During Night 31 40.8
Date and Time
Recording Level Outdoor (Standing Level) Indoor (Standing Level)
Lux Meter Reading 32000 22
Calculations: Daylight Factor = (E in/ E ext) x 100%
= (22/32000) x 100%
= 0.07%
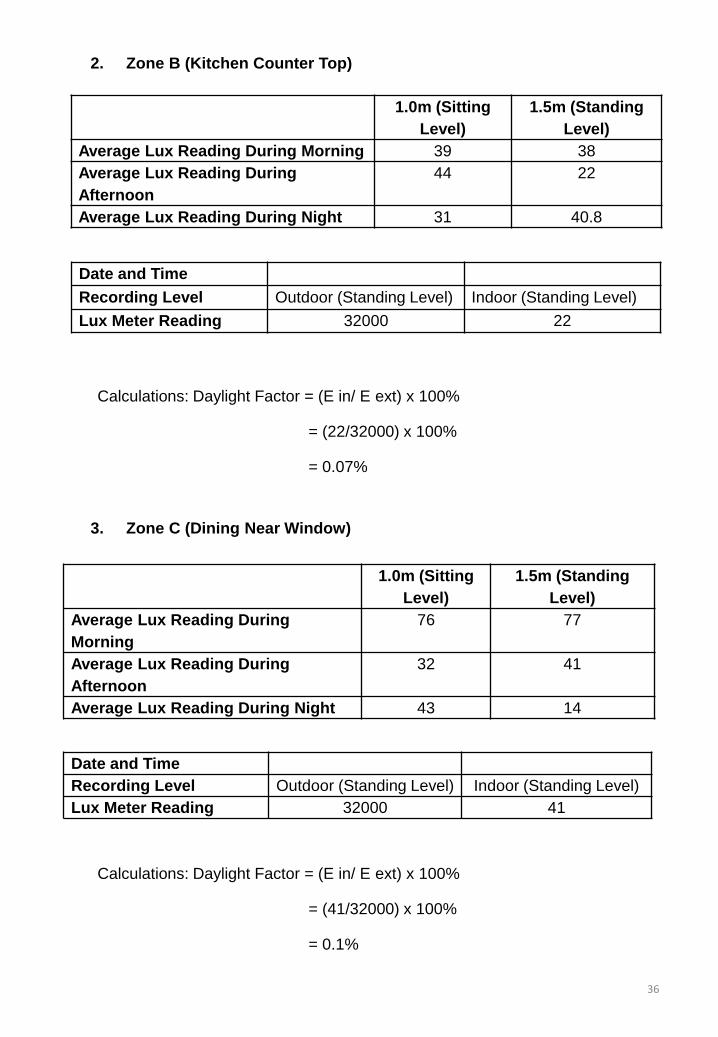
2. Zone B (Kitchen Counter Top)
1.0m (Sitting
Level)
1.5m (Standing
Level)
Average Lux Reading During
Morning
76 77
Average Lux Reading During
Afternoon
32 41
Average Lux Reading During Night 43 14
Date and Time
Recording Level Outdoor (Standing Level) Indoor (Standing Level)
Lux Meter Reading 32000 41
3. Zone C (Dining Near Window)
Calculations: Daylight Factor = (E in/ E ext) x 100%
= (41/32000) x 100%
= 0.1%
36
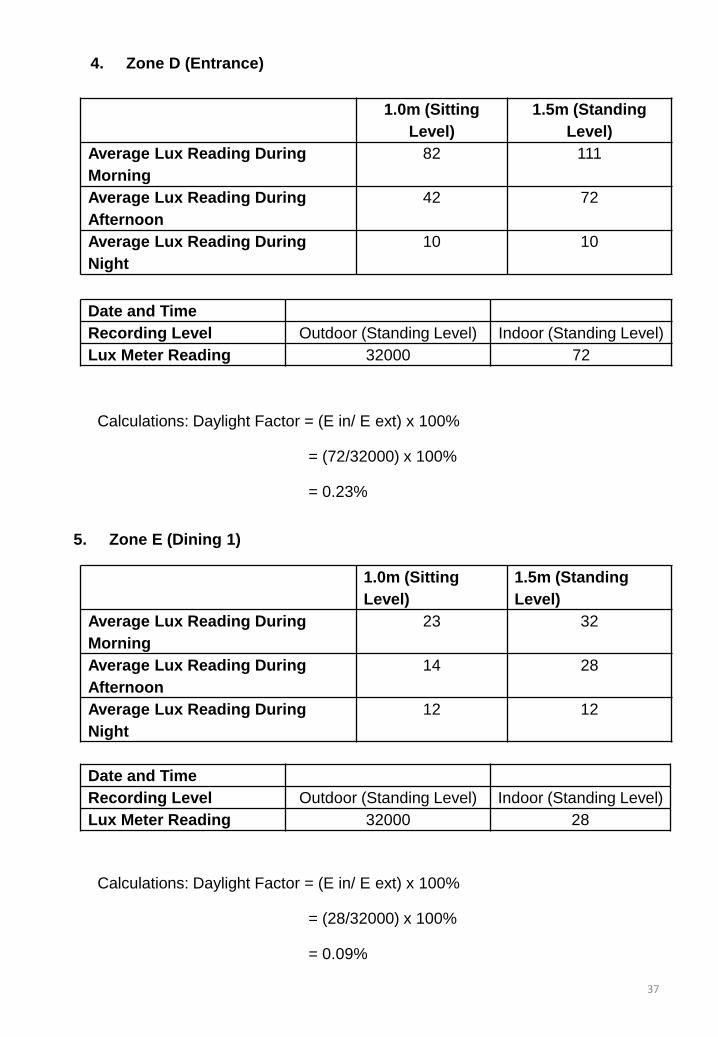
4. Zone D (Entrance)
1.0m (Sitting
Level)
1.5m (Standing
Level)
Average Lux Reading During
Morning
82 111
Average Lux Reading During
Afternoon
42 72
Average Lux Reading During
Night
10 10
Date and Time
Recording Level Outdoor (Standing Level) Indoor (Standing Level)
Lux Meter Reading 32000 72
Calculations: Daylight Factor = (E in/ E ext) x 100%
= (72/32000) x 100%
= 0.23%
5. Zone E (Dining 1)
1.0m (Sitting
Level)
1.5m (Standing
Level)
Average Lux Reading During
Morning
23 32
Average Lux Reading During
Afternoon
14 28
Average Lux Reading During
Night
12 12
Date and Time
Recording Level Outdoor (Standing Level) Indoor (Standing Level)
Lux Meter Reading 32000 28
Calculations: Daylight Factor = (E in/ E ext) x 100%
= (28/32000) x 100%
= 0.09%
37
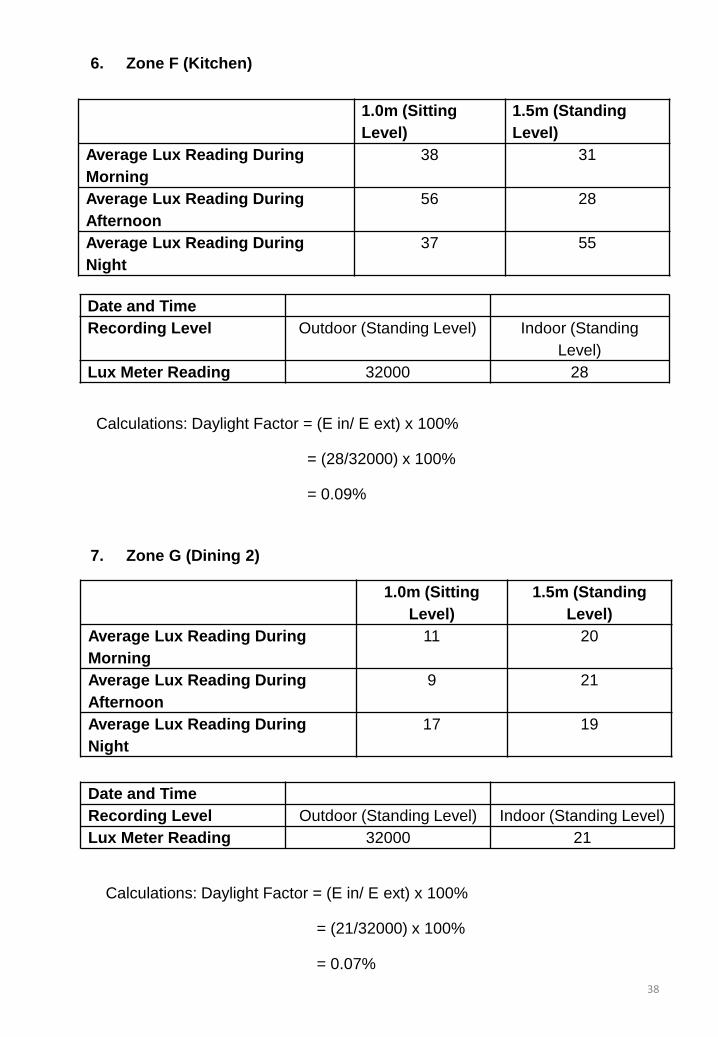
1.0m (Sitting
Level)
1.5m (Standing
Level)
Average Lux Reading During
Morning
38 31
Average Lux Reading During
Afternoon
56 28
Average Lux Reading During
Night
37 55
Date and Time
Recording Level Outdoor (Standing Level) Indoor (Standing
Level)
Lux Meter Reading 32000 28
6. Zone F (Kitchen)
Calculations: Daylight Factor = (E in/ E ext) x 100%
= (28/32000) x 100%
= 0.09%
1.0m (Sitting
Level)
1.5m (Standing
Level)
Average Lux Reading During
Morning
11 20
Average Lux Reading During
Afternoon
9 21
Average Lux Reading During
Night
17 19
Date and Time
Recording Level Outdoor (Standing Level) Indoor (Standing Level)
Lux Meter Reading 32000 21
7. Zone G (Dining 2)
Calculations: Daylight Factor = (E in/ E ext) x 100%
= (21/32000) x 100%
= 0.07%
38

1.0m (Sitting
Level)
1.5m (Standing
Level)
Average Lux Reading During
Morning
17 20
Average Lux Reading During
Afternoon
11 17
Average Lux Reading During
Night
17 16
8. Zone H (Dining 3)
Date and Time
Recording Level Outdoor (Standing Level) Indoor (Standing Level)
Lux Meter Reading 32000 17
Calculations: Daylight Factor = (E in/ E ext) x 100%
= (17/32000) x 100%
= 0.05%
1.0m (Sitting
Level)
1.5m (Standing
Level)
Average Lux Reading During
Morning
22 31
Average Lux Reading During
Afternoon
15 30
Average Lux Reading During
Night
18 21
9. Zone I (Dining 4)
Date and Time
Recording Level Outdoor (Standing Level) Indoor (Standing Level)
Lux Meter Reading 32000 30
Calculations: Daylight Factor = (E in/ E ext) x 100%
= (30/32000) x 100%
= 0.09%
39
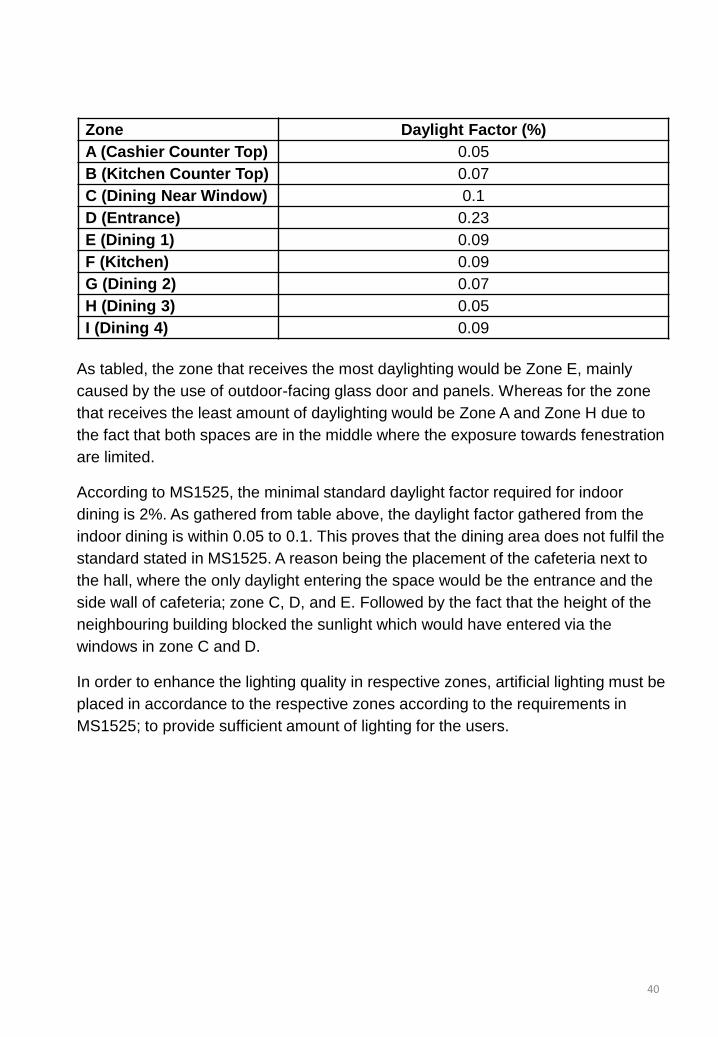
Zone Daylight Factor (%)
A (Cashier Counter Top) 0.05
B (Kitchen Counter Top) 0.07
C (Dining Near Window) 0.1
D (Entrance) 0.23
E (Dining 1) 0.09
F (Kitchen) 0.09
G (Dining 2) 0.07
H (Dining 3) 0.05
I (Dining 4) 0.09
As tabled, the zone that receives the most daylighting would be Zone E, mainly
caused by the use of outdoor-facing glass door and panels. Whereas for the zone
that receives the least amount of daylighting would be Zone A and Zone H due to
the fact that both spaces are in the middle where the exposure towards fenestration
are limited.
According to MS1525, the minimal standard daylight factor required for indoor
dining is 2%. As gathered from table above, the daylight factor gathered from the
indoor dining is within 0.05 to 0.1. This proves that the dining area does not fulfil the
standard stated in MS1525. A reason being the placement of the cafeteria next to
the hall, where the only daylight entering the space would be the entrance and the
side wall of cafeteria; zone C, D, and E. Followed by the fact that the height of the
neighbouring building blocked the sunlight which would have entered via the
windows in zone C and D.
In order to enhance the lighting quality in respective zones, artificial lighting must be
placed in accordance to the respective zones according to the requirements in
MS1525; to provide sufficient amount of lighting for the users.
40

5.1.3 Lumen Method
Lumen Method, also known as Light Flux Method, is used to determine the
number of lamps that should be installed for a given area or room.
By using the given formula below do the calculations.:
E x A
F x UF x MF N =
where,
N = Number Of Lamps Required
E = Illuminance Level Required (lux)
A = Area at Working Plane Height (m²)
F = Average Luminous Flux from Each Lamp (lm)
UF = Utilisation Factor, an Allowance for the Light Distribution of the
Luminaire and the Room Surfaces
MF = Maintenance Factor, an Allowance for Reduced Light Output because of
Deterioration and Dirt
As stated in MS 1525: 2007, the recommended average illuminances are:
Application Illuminance (Lux)
Entrance And Exit 100
Restaurant, Canteen, Cafeteria 200
Kitchen 200
Referring to the table below „Reflection Factors of Ceilings and Walls,‟ to obtain the
utilization factor.
Colour Reflectance
White, off-white, light shades of grey,
brown, blue
75% - 90%
Medium green, yellow, brown, grey 30% - 60%
Dark grey, medium blue 10% - 20%
Dark blue, green, wood panelling 5% - 10%
41

1. Zone A (Cashier Counter Top)
Activity Cashier, Display of Food
Dimension L = 6, W = 2.4
Area (m²) 14.4
Type of lighting fixture Fluorescent Lighting
Nos. Of lighting fixture 6
Standard illuminance (lm) 960
Height of ceiling (m) 4.1
Height of luminaire (m) 3.0
Height of work level (m) 1.35
Vertical distance from work place
to luminaire
1.65
Room index (RI)
RI =
Utilization factor (UF)
(Based on utilization factor table)
0.35
Maintenance factor (MF) 0.8
Illuminance level
L x W
(L + W) x H
E x A
F x UF x MF N =
= 1.04
= 200 x 14.4
960 x 0.35 x 0.8
= 11
42

2. Zone B (Kitchen Counter Top)
Activity Kitchen
Dimension L = 5.108, W = 1.424
Area (m²) 7.274
Type of lighting fixture Fluorescent Lighting
Nos. Of lighting fixture 6
Standard illuminance (lm) 960
Height of ceiling (m) 4.1
Height of luminaire (m) 3.0
Height of work level (m) 0.8
Vertical distance from work place
to luminaire
2.2
Room index (RI)
RI =
Utilization factor (UF)
(Based on utilization factor table)
0.26
Maintenance factor (MF) 0.8
Illuminance level
L x W
(L + W) x H
E x A
F x UF x MF N =
= 0.56
= 200 x 7.274
960 x 0.26 x 0.8
= 8
43

3. Zone C (Dining Near Window)
Activity Dining
Dimension L = 1.2, W = 4.6
Area (m²) 4.32
Type of lighting fixture Compact Fluorescent Lighting
Nos. Of lighting fixture 3
Standard illuminance (lm) 1560
Height of ceiling (m) 4.1
Height of luminaire (m) 3.0
Height of work level (m) 1.0
Vertical distance from work place
to luminaire
2.2
Room index (RI)
RI =
Utilization factor (UF)
(Based on utilization factor table)
0.26
Maintenance factor (MF) 0.8
Illuminance level
L x W
(L + W) x H
E x A
F x UF x MF N =
= 0.33
= 200 x 4.32
1560 x 0.26 x 0.8
= 3
44

4. Zone D (Entrance)
Activity Entrance
Dimension L = 9.6, W = 1.2
Area (m²) 11.52
Type of lighting fixture Compact Fluorescent Lighting
Nos. Of lighting fixture 12
Standard illuminance (lm) 1500
Height of ceiling (m) 4.1
Height of luminaire (m) 3.4
Height of work level (m) 0.8
Vertical distance from work place
to luminaire
2.6
Room index (RI)
RI =
Utilization factor (UF)
(Based on utilization factor table)
0.26
Maintenance factor (MF) 0.8
Illuminance level
L x W
(L + W) x H
E x A
F x UF x MF N =
= 0.41
= 100 x 11.52
1500 x 0.26 x 0.8
= 4
45

5. Zone E (Dining 1)
Activity Dining
Dimension L = 12, W = 1.2 + L = 2.4, W = 1.2
Area (m²) 17.28
Type of lighting fixture Compact Fluorescent Lighting
Nos. Of lighting fixture 12
Standard illuminance (lm) 1500
Height of ceiling (m) 4.1
Height of luminaire (m) 3.4
Height of work level (m) 0.8
Vertical distance from work place
to luminaire
2.6
Room index (RI)
RI =
Utilization factor (UF)
(Based on utilization factor table)
0.26
Maintenance factor (MF) 0.8
Illuminance level
L x W
(L + W) x H
E x A
F x UF x MF N =
= 0.4
= 200 x 17.28
1560 x 0.26 x 0.8
= 11
46

6. Zone F (Kitchen)
Activity Kitchen
Dimension L = 5.108, W = 1.2
Area (m²) 6.13
Type of lighting fixture Fluorescent Lighting
Nos. Of lighting fixture 6
Standard illuminance (lm) 960
Height of ceiling (m) 4.1
Height of luminaire (m) 3.0
Height of work level (m) 0.8
Vertical distance from work place
to luminaire
2.2
Room index (RI)
RI =
Utilization factor (UF)
(Based on utilization factor table)
0.26
Maintenance factor (MF) 0.8
Illuminance level
L x W
(L + W) x H
E x A
F x UF x MF N =
= 0.45
= 200 x 6.13
960 x 0.26 x 0.8
= 7
47
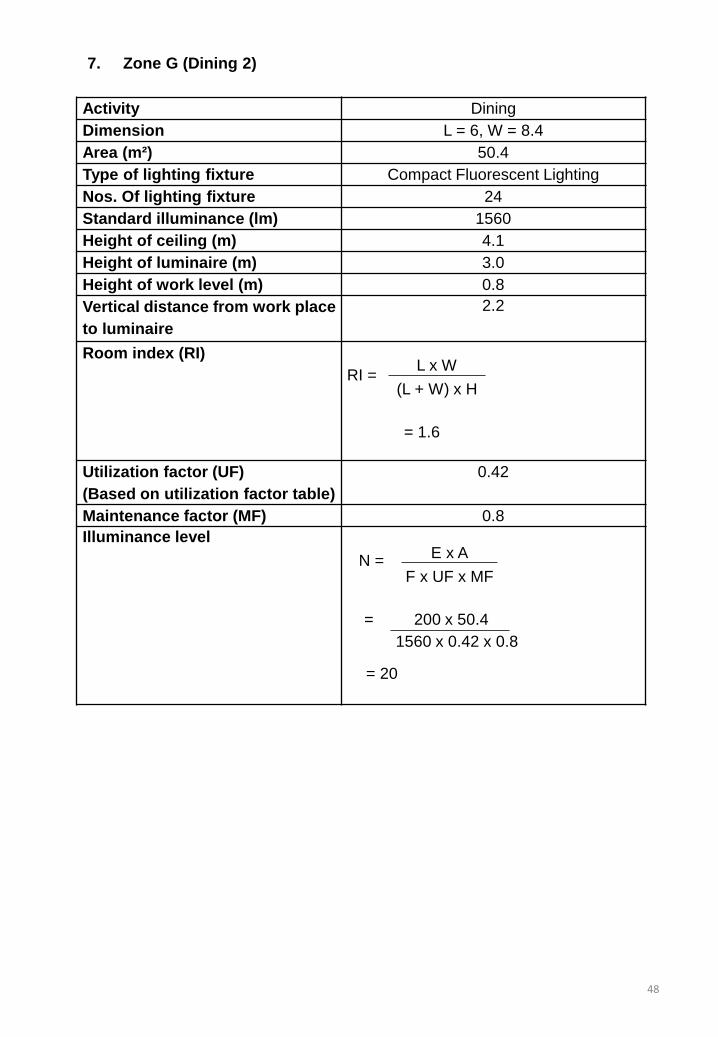
7. Zone G (Dining 2)
Activity Dining
Dimension L = 6, W = 8.4
Area (m²) 50.4
Type of lighting fixture Compact Fluorescent Lighting
Nos. Of lighting fixture 24
Standard illuminance (lm) 1560
Height of ceiling (m) 4.1
Height of luminaire (m) 3.0
Height of work level (m) 0.8
Vertical distance from work place
to luminaire
2.2
Room index (RI)
RI =
Utilization factor (UF)
(Based on utilization factor table)
0.42
Maintenance factor (MF) 0.8
Illuminance level
L x W
(L + W) x H
E x A
F x UF x MF N =
= 1.6
= 200 x 50.4
1560 x 0.42 x 0.8
= 20
48

8. Zone H (Dining 3)
Activity Dining
Dimension L = 12, W = 1.2
Area (m²) 14.4
Type of lighting fixture Compact Fluorescent Lighting
Nos. Of lighting fixture 12
Standard illuminance (lm) 1500
Height of ceiling (m) 4.1
Height of luminaire (m) 3.4
Height of work level (m) 0.8
Vertical distance from work place
to luminaire
2.6
Room index (RI)
RI =
Utilization factor (UF)
(Based on utilization factor table)
0.26
Maintenance factor (MF) 0.8
Illuminance level
L x W
(L + W) x H
E x A
F x UF x MF N =
= 0.42
= 200 x 14.4
1500 x 0.26 x 0.8
= 10
49

9. Zone I (Dining 4)
Activity Dining
Dimension L = 10.8, W = 3.6
Area (m²) 38.88
Type of lighting fixture Compact Fluorescent Lighting
Nos. Of lighting fixture 18
Standard illuminance (lm) 1560
Height of ceiling (m) 4.1
Height of luminaire (m) 3.0
Height of work level (m) 0.8
Vertical distance from work place
to luminaire
2.2
Room index (RI)
RI =
Utilization factor (UF)
(Based on utilization factor table)
0.39
Maintenance factor (MF) 0.8
Illuminance level
L x W
(L + W) x H
E x A
F x UF x MF N =
= 1.23
= 200 x 38.88
1560 x 0.39 x 0.8
= 16
50

9. Zone I (Dining 4)
Activity Dining
Dimension L = 10.8, W = 3.6
Area (m²) 38.88
Type of lighting fixture Compact Fluorescent Lighting
Nos. Of lighting fixture 18
Standard illuminance (lm) 1560
Height of ceiling (m) 4.1
Height of luminaire (m) 3.0
Height of work level (m) 0.8
Vertical distance from work place
to luminaire
2.2
Room index (RI)
RI =
Utilization factor (UF)
(Based on utilization factor table)
0.39
Maintenance factor (MF) 0.8
Illuminance level
L x W
(L + W) x H
E x A
F x UF x MF N =
= 1.23
= 200 x 38.88
1560 x 0.39 x 0.8
= 16
51

Zone Existing (Nos. of
Fixtures)
Calculated (Required nos. of
Fixtures)
A 6 11
B 6 8
C 3 3
D 12 4
E 10 11
F 6 7
G 24 20
H 12 10
I 18 16
From the table, certain zones of the cafeteria do not meet the MS1525 requirement
for the number of lights. Specifically zone A and B, the pantry area have minimal
lights allocated there due to circulation there limited only to cooks and requires less
lighting for activities. Zone E which being less illuminated compared to other zones
is mainly caused be a design of the floor layout that relies on natural lighting to
brighten that zone since the building was designed to accommodate most users
during the morning to afternoon rather than in the night.
Zone E however has an excess number of lights located at the entrance. The main
cause here being the interior design that clutters the lights together. In order to
enhance the lighting quality in respective zones, the number of artificial lighting
must be allocated accordingly as stated by requirements in MS1525; to provide
sufficient amount of lighting for the occurring activity.
52

The analysis diagram show a higher percentage of daylight entering the space from
the west-facing entrance of the cafeteria using mostly glass. The sides however are
also able to receive a moderate amount of light from the window opening although is
partially obstructed by neighbouring buildings. The rear of the cafeteria has no
openings that allow the passage of natural lighting and hence is purely reliant on
artificial lighting.
5.1.4 Lux Contour Diagram
Table 5.1.4a: Daylight Analysis on Plan of Cafeteria
Table 5.1.4b: Axonometric Layout Daylight Analysis
53

5.1.5 Lux Reading Analysis
1. Zone A: Cashier Counter Top
Highest lux meter reading: 20 (E6 at sitting level) (Morning)
Lowest lux meter reading: 7 (A7 at sitting level) (Morning)
The lux meter reading at E6 is higher at the sitting level because of
the artificial lighting above. Depending on daylight alone to light up the
interior is not sufficient so additional artificial lighting is added.
2. Zone B: Kitchen Counter Top
Highest lux meter reading: 123 (A4 at standing level) (Morning)
Lowest lux meter reading: 10 (E4 standing level) (Morning)
The lighting within the kitchen is kept averagely low however can be quite
bright at the corner facing the door as natural lighting can enter the space
when the door is left ajar.
54

3. Zone C: Dining Near Window
Highest lux meter reading: 115 (A10 at standing level) (Morning)
Lowest lux meter reading: 12 (A10 standing level) (Night)
The sitting area at A10 near the left window receives a decent amount of natural
lighting during the day is however lower than other zones receiving direct lighting
due to the glass window that reflects a certain amount of light for the exterior.
During the night however the zone is fully reliant on artificial lighting and hence
has a lower lux level since it‟s located at the side.
4. Zone D: Entrance Top
Highest lux meter reading: 254 (F13 at standing level) (Morning)
Lowest lux meter reading: 8 (H13, I13, J13 at sitting and standing level)
(Morning, Afternoon, Night)
This day of the time, the lux meter shows a higher reading at F13 because
the entrance is facing the east side where the sun is shining from. The
standing level has a higher reading because it is nearer to the light source.
At H13, the lux meter reading is the lowest because it is away from the light
source and there is lack of artificial lighting near the corner of the cafeteria. 55

5. Zone E: Dining 1
Highest lux meter reading: 110 (F12 at standing level) (Morning)
Lowest lux meter reading: 8 (J13, H13 at sitting and standing level)
(Afternoon, Night)
Zone E located adjacent to zone C although being at the corner may receive a
moderate amount of light from nearby windows from zone C and D. It does
however receive a notably low quantity of light during night when no natural
lighting is present as only a scarce number of lights are present to illuminate this
zone.
6. Zone F: Kitchen
Highest lux meter reading: 88 (B5 at standing level) (Morning)
Lowest lux meter reading: 10 (E5 at standing level) (Afternoon)
Similar to zone A and B, the kitchen although being more dim than the rest
of the cafeteria does receive light from the bulbs above and the lux level
may occasionally spike upwards when the door in the kitchen is open either
for ventilation or for circulation purposes.
56

7. Zone G: Dining 2
Highest lux meter reading: 32 (F4 at standing level) (Afternoon)
Lowest lux meter reading: 8 (F1, F2, F3, F4, G1, G2, G3, J1 at sitting level)
(Afternoon)
Zone G is position further from any open fenestrations and thus receives a
meagre portion of the light entering from the openings. As such, the day zone G
requires the assistance of artificial lighting and exceedingly dependant from
evening onwards.
8. Zone H: Dining 3
Highest lux meter reading: 28 (H8 at standing level) (Morning)
Lowest lux meter reading: 9 (E8, G8, I8, J8 at sitting level) (Afternoon)
Although zone H is placed between two zones with high lux levels, the zone
itself receives relatively low amount of direct light from natural lighting as it
was placed at a corner where light only passes through at an angle. Due to
its position it does not receive sufficient light from the artificial lighting above.
57

9. Zone I: Dining 4
Highest lux meter reading: 63 (F11 at standing level) (Afternoon)
Lowest lux meter reading: 9 (J9, J10, J11 at sitting level) (Morning, Afternoon)
Zone I has the most average lux level amongst all zones as it is positioned
at a moderate distance from the openings of zone C and D. It is also lighted
by several light bulbs from several zone. The lux level isn‟t excessive is it
does not receive light from any direct light source.
58
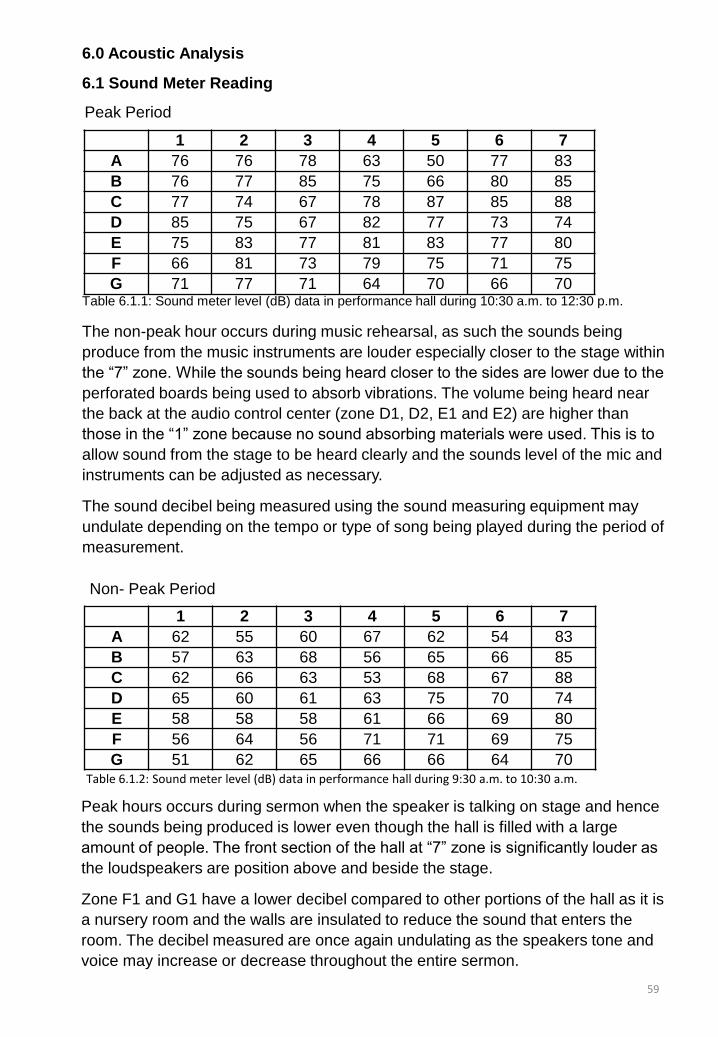
6.0 Acoustic Analysis
6.1 Sound Meter Reading
Peak Period
1 2 3 4 5 6 7
A 76 76 78 63 50 77 83
B 76 77 85 75 66 80 85
C 77 74 67 78 87 85 88
D 85 75 67 82 77 73 74
E 75 83 77 81 83 77 80
F 66 81 73 79 75 71 75
G 71 77 71 64 70 66 70 Table 6.1.1: Sound meter level (dB) data in performance hall during 10:30 a.m. to 12:30 p.m.
The non-peak hour occurs during music rehearsal, as such the sounds being
produce from the music instruments are louder especially closer to the stage within
the “7” zone. While the sounds being heard closer to the sides are lower due to the
perforated boards being used to absorb vibrations. The volume being heard near
the back at the audio control center (zone D1, D2, E1 and E2) are higher than
those in the “1” zone because no sound absorbing materials were used. This is to
allow sound from the stage to be heard clearly and the sounds level of the mic and
instruments can be adjusted as necessary.
The sound decibel being measured using the sound measuring equipment may
undulate depending on the tempo or type of song being played during the period of
measurement.
1 2 3 4 5 6 7
A 62 55 60 67 62 54 83
B 57 63 68 56 65 66 85
C 62 66 63 53 68 67 88
D 65 60 61 63 75 70 74
E 58 58 58 61 66 69 80
F 56 64 56 71 71 69 75
G 51 62 65 66 66 64 70 Table 6.1.2: Sound meter level (dB) data in performance hall during 9:30 a.m. to 10:30 a.m.
Peak hours occurs during sermon when the speaker is talking on stage and hence
the sounds being produced is lower even though the hall is filled with a large
amount of people. The front section of the hall at “7” zone is significantly louder as
the loudspeakers are position above and beside the stage.
Zone F1 and G1 have a lower decibel compared to other portions of the hall as it is
a nursery room and the walls are insulated to reduce the sound that enters the
room. The decibel measured are once again undulating as the speakers tone and
voice may increase or decrease throughout the entire sermon.
Non- Peak Period
59
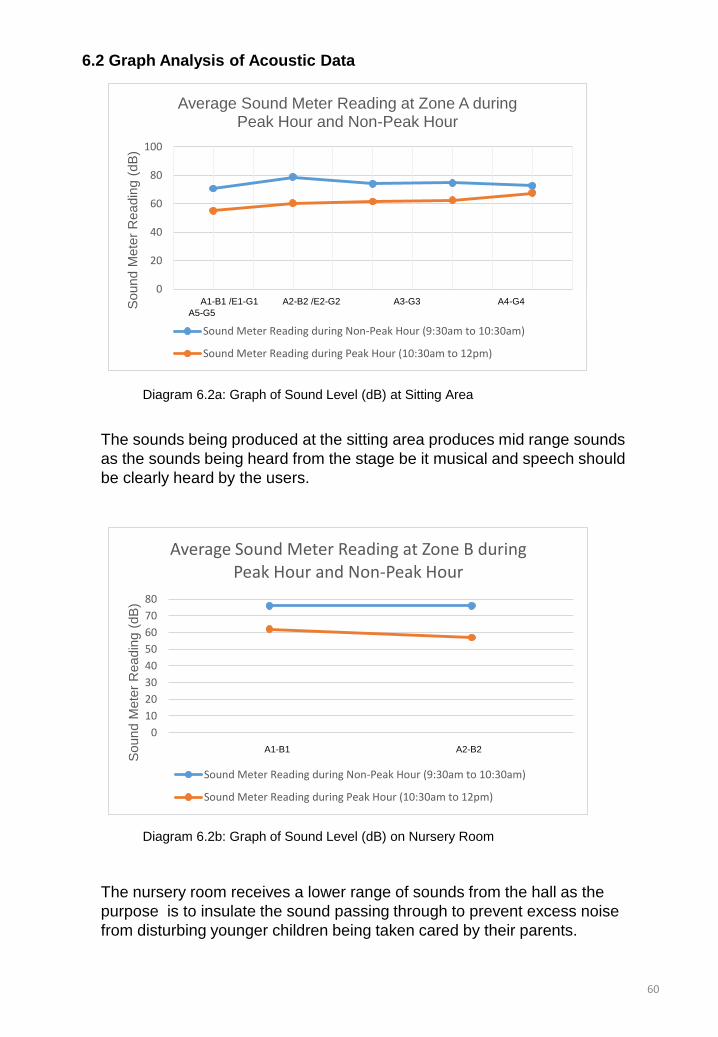
6.2 Graph Analysis of Acoustic Data
0
20
40
60
80
100
A1-G1Sound M
ete
r R
eadin
g (
dB
)
Average Sound Meter Reading at Zone A during Peak Hour and Non-Peak Hour
Sound Meter Reading during Non-Peak Hour (9:30am to 10:30am)
Sound Meter Reading during Peak Hour (10:30am to 12pm)
Diagram 6.2a: Graph of Sound Level (dB) at Sitting Area
0
10
20
30
40
50
60
70
80
A1-B1
Sound M
ete
r R
eadin
g (
dB
)
Average Sound Meter Reading at Zone B during Peak Hour and Non-Peak Hour
Sound Meter Reading during Non-Peak Hour (9:30am to 10:30am)
Sound Meter Reading during Peak Hour (10:30am to 12pm)
Diagram 6.2b: Graph of Sound Level (dB) on Nursery Room
The sounds being produced at the sitting area produces mid range sounds
as the sounds being heard from the stage be it musical and speech should
be clearly heard by the users.
The nursery room receives a lower range of sounds from the hall as the
purpose is to insulate the sound passing through to prevent excess noise
from disturbing younger children being taken cared by their parents.
A1-B1 /E1-G1 A2-B2 /E2-G2 A3-G3 A4-G4
A5-G5
A1-B1 A2-B2
60

60
65
70
75
80
85
B6-G6
Sound M
ete
r R
eadin
g (
dB
)
Average Sound Meter Reading at Zone C during Peak Hour and Non-Peak Hour
Sound Meter Reading during Non-Peak Hour (9:30am to 10:30am)
Sound Meter Reading during Peak Hour (10:30am to 12pm)
Diagram 6.2c: Graph of Sound Level (dB) at Stage
0
20
40
60
80
100
A6 and G6
Sound M
ete
r R
eadin
g (
dB
)
Average Sound Meter Reading at Zone D during Peak hour and Non-Peak Hour
Sound Meter Reading during Non-Peak Hour (9:30am to 10:30am)
Sound Meter Reading during Peak Hour (10:30am to 12pm)
Diagram 6.2d: Graph of Sound Level (dB) at Robbing Room
The stage has the loudest range among the measurements mainly since the
sounds being produced in the hall occurs directly on the stage and the
loudspeakers are position above the stage.
The robbing room located besides the stage registers mid range level sound
as well although being positioned adjacent with the stage due to perforated
boards along the walls that reduces sounds that travel through the rooms.
A6-G6 A7-B7/F7-G7
B6-F6 C7-E7
61

6.3 Acoustic Calculation and Analysis
6.3.1 Zone A – Sitting Area
i) Sound Intensity Level, (SIL)
Sound Intensity Level – Peak hour Sound Intensity Level – Non – Peak
hour
SIL = 10𝑙𝑜𝑔10𝐼𝑎
1 × 10⁻¹²
64.29
10= 𝑙𝑜𝑔10
𝐼𝑎
1 × 10⁻¹²
𝐼𝑎 = 106.429 × 1 × 10−12
= 2.69 × 10−06 Watts
SIL = 10𝑙𝑜𝑔10𝐼𝑎
1 × 10⁻¹²
74.18
10= 𝑙𝑜𝑔10
𝐼𝑎
1 × 10⁻¹²
𝐼𝑎 = 107.418 × 1 × 10−12
= 2.62 × 10−05 Watts
Sound Pressure Level – Peak hour Sound Pressure Level – Non – Peak
hour
SPL = 20𝑙𝑜𝑔10𝑃
20 × 10ˉ ⁶
64.29
20= 𝑙𝑜𝑔10
𝑃
20 × 10ˉ ⁶
𝐼𝑎 = 106.429 × 1 × 10−12
= 2.69 × 10−06 Watts
SPL = 20𝑙𝑜𝑔10𝑃
20 × 10ˉ ⁶
74.18
10= 𝑙𝑜𝑔10
𝑃
20 × 10ˉ ⁶
𝐼𝑎 = 107.418 × 1 × 10−12
= 2.62 × 10−05 Watts
ii) Sound Pressure Level, (SPL)
Figure 6.3a Sitting Area of Performing Hall
62
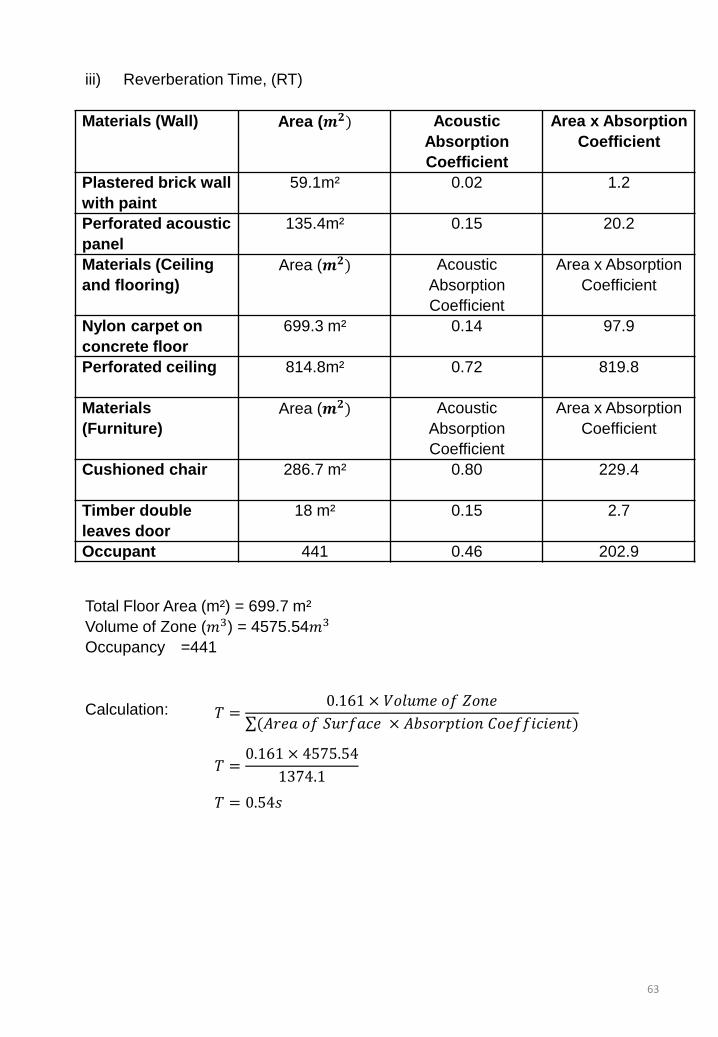
iii) Reverberation Time, (RT)
Materials (Wall) Area (𝒎𝟐) Acoustic
Absorption
Coefficient
Area x Absorption
Coefficient
Plastered brick wall
with paint
59.1m² 0.02 1.2
Perforated acoustic
panel
135.4m² 0.15 20.2
Materials (Ceiling
and flooring)
Area (𝒎𝟐) Acoustic
Absorption
Coefficient
Area x Absorption
Coefficient
Nylon carpet on
concrete floor
699.3 m² 0.14 97.9
Perforated ceiling
814.8m² 0.72 819.8
Materials
(Furniture)
Area (𝒎𝟐) Acoustic
Absorption
Coefficient
Area x Absorption
Coefficient
Cushioned chair
286.7 m² 0.80 229.4
Timber double
leaves door
18 m² 0.15 2.7
Occupant 441 0.46 202.9
Total Floor Area (m²) = 699.7 m²
Volume of Zone (𝑚3) = 4575.54𝑚3
Occupancy =441
Calculation: 𝑇 =0.161 × 𝑉𝑜𝑙𝑢𝑚𝑒 𝑜𝑓 𝑍𝑜𝑛𝑒
(𝐴𝑟𝑒𝑎 𝑜𝑓 𝑆𝑢𝑟𝑓𝑎𝑐𝑒 × 𝐴𝑏𝑠𝑜𝑟𝑝𝑡𝑖𝑜𝑛 𝐶𝑜𝑒𝑓𝑓𝑖𝑐𝑖𝑒𝑛𝑡)
𝑇 =0.161 × 4575.54
1374.1
𝑇 = 0.54𝑠
63
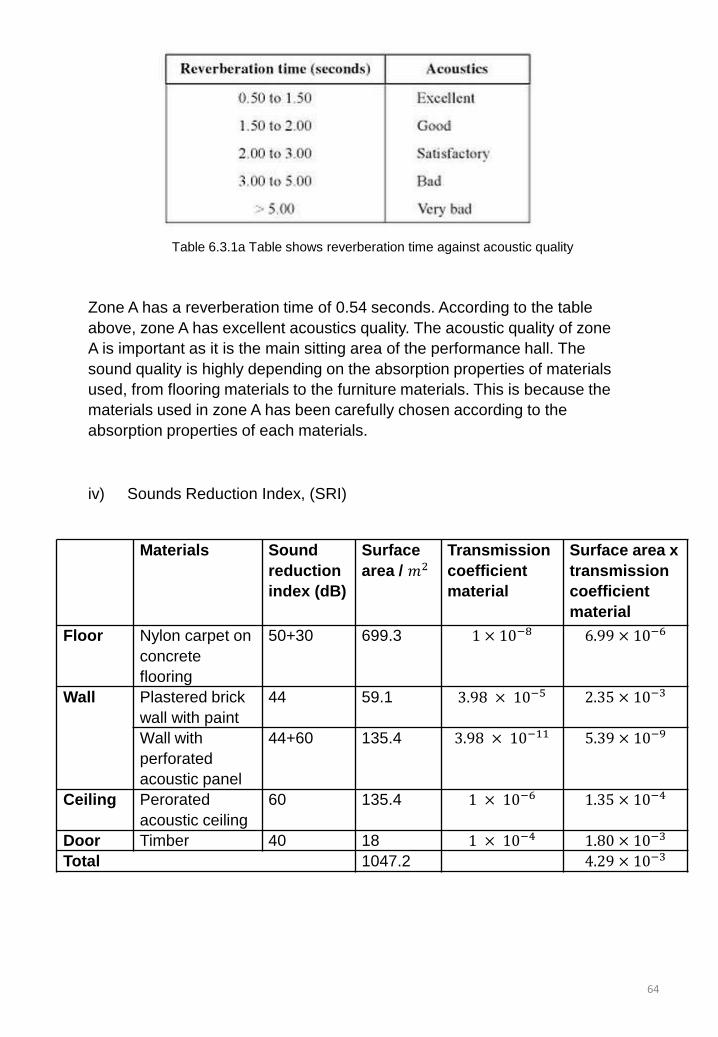
Zone A has a reverberation time of 0.54 seconds. According to the table
above, zone A has excellent acoustics quality. The acoustic quality of zone
A is important as it is the main sitting area of the performance hall. The
sound quality is highly depending on the absorption properties of materials
used, from flooring materials to the furniture materials. This is because the
materials used in zone A has been carefully chosen according to the
absorption properties of each materials.
Table 6.3.1a Table shows reverberation time against acoustic quality
iv) Sounds Reduction Index, (SRI)
Materials Sound
reduction
index (dB)
Surface
area / 𝑚2
Transmission
coefficient
material
Surface area x
transmission
coefficient
material
Floor Nylon carpet on
concrete
flooring
50+30 699.3 1 × 10⁻⁸ 6.99 × 10⁻⁶
Wall Plastered brick
wall with paint
44 59.1 3.98 × 10⁻⁵ 2.35 × 10⁻³
Wall with
perforated
acoustic panel
44+60 135.4 3.98 × 10⁻¹¹ 5.39 × 10⁻⁹
Ceiling Perorated
acoustic ceiling
60 135.4 1 × 10⁻⁶ 1.35 × 10⁻⁴
Door Timber 40 18 1 × 10⁻⁴ 1.80 × 10⁻³
Total 1047.2 4.29 × 10⁻³
64

Floor Nylon carpet
SRI = 10𝑙𝑜𝑔101
𝑇
80 = 10𝑙𝑜𝑔101
𝑇
80
10 = 𝑙𝑜𝑔10
1
𝑇
108= 1
𝑇
𝑇𝑁𝑦𝑙𝑜𝑛 𝑐𝑎𝑟𝑝𝑒𝑡 𝑜𝑛 𝑐𝑜𝑛𝑐𝑟𝑒𝑡𝑒 𝑓𝑙𝑜𝑜𝑟𝑖𝑛𝑔 = 1 × 10⁻⁸
Wall Plastered brick wall with
paint
SRI = 10𝑙𝑜𝑔101
𝑇
44 = 10𝑙𝑜𝑔101
𝑇
44
10 = 𝑙𝑜𝑔10
1
𝑇
104.4= 1
𝑇
𝑇𝑃𝑙𝑎𝑠𝑡𝑒𝑟𝑒𝑑 𝑏𝑟𝑖𝑐𝑘 𝑤𝑎𝑙𝑙 𝑤𝑖𝑡 𝑝𝑎𝑖𝑛𝑡 =
3.98 × 10⁻⁵
Wall with perforated acoustic panel
SRI = 10𝑙𝑜𝑔101
𝑇
104 = 10𝑙𝑜𝑔101
𝑇
104
10 = 𝑙𝑜𝑔10
1
𝑇
1010.4= 1
𝑇
𝑇𝑊𝑎𝑙𝑙 𝑤𝑖𝑡 𝑝𝑒𝑟𝑓𝑜𝑟𝑎𝑡𝑒𝑑 𝑎𝑐𝑜𝑢𝑠𝑡𝑖𝑐 𝑝𝑎𝑛𝑒𝑙 =
3.98 × 10⁻¹¹
Ceiling Perforated acoustic panel
SRI = 10𝑙𝑜𝑔101
𝑇
60 = 10𝑙𝑜𝑔101
𝑇
60
10 = 𝑙𝑜𝑔10
1
𝑇
106= 1
𝑇
𝑇𝑃𝑒𝑟𝑓𝑜𝑟𝑎𝑡𝑒𝑑 𝑎𝑐𝑜𝑢𝑠𝑡𝑖𝑐 𝑝𝑎𝑛𝑒𝑙 = 1 × 10⁻⁶
Door Timber
SRI = 10𝑙𝑜𝑔101
𝑇
40 = 10𝑙𝑜𝑔101
𝑇
40
10 = 𝑙𝑜𝑔10
1
𝑇
104= 1
𝑇
𝑇𝑃𝑒𝑟𝑓𝑜𝑟𝑎𝑡𝑒𝑑 𝑎𝑐𝑜𝑢𝑠𝑡𝑖𝑐 𝑝𝑎𝑛𝑒𝑙 = 1 × 10⁻⁴
65

𝑇𝑜𝑣𝑒𝑟𝑎𝑙𝑙 = ( 𝑠𝑢𝑟𝑓𝑎𝑐𝑒 𝑎𝑟𝑒𝑎 𝑥 𝑡𝑟𝑎𝑛𝑠𝑚𝑖𝑠𝑠𝑖𝑜𝑛 𝑐𝑜𝑒𝑓𝑓𝑖𝑐𝑖𝑒𝑛𝑡 𝑚𝑎𝑡𝑒𝑟𝑖𝑎𝑙𝑠)
𝑠𝑢𝑟𝑓𝑎𝑐𝑒 𝑎𝑟𝑒𝑎
𝑇𝑜𝑣𝑒𝑟𝑎𝑙𝑙 = 4.29 × 10⁻³
1047.2
𝑇𝑜𝑣𝑒𝑟𝑎𝑙𝑙 = 4.10 × 10⁻⁶
∴ 𝑆𝑅𝐼𝑂𝑣𝑒𝑟𝑎𝑙𝑙 = 10𝑙𝑜𝑔101
𝑇
= 10𝑙𝑜𝑔101
4.10×10−6
= 53.87dB
At Zone A, the average reading during peak hour is 62.29dB and the average
reading during non-peak hour is 74.18dB. The reading of non-peak hour is during
rehearsal while peak hour is after the rehearsal. According to the data collected,
the average reading of during peak hour is lower than non-peak hour. The factors
that affect the readings are the talking voice between occupants and sound of
instruments. During peak hour, the occupants are required to remain their voice
lower and keep quiet as the performance are going on. During non-peak hour, the
staffs are directing the performers on stage using from the back of Zone A,
causes the average reading higher compare to peak hour.
66

6.3.2 Zone B – Nursery and Baby Room
Figure 6.3b New Nursery 1 and Baby Room in Performing Hall
i) Sound Intensity Level, (SIL)
ii) Sound Pressure Level, (SPL)
Sound Pressure Level – Peak hour Sound Pressure Level – Non – Peak
hour
SPL = 20𝑙𝑜𝑔10𝑃
20 × 10ˉ ⁶
64.29
20= 𝑙𝑜𝑔10
𝑃
20 × 10ˉ ⁶
𝐼𝑎 = 106.429 × 1 × 10−12
= 2.69 × 10−06 Watts
SPL = 20𝑙𝑜𝑔10𝑃
20 × 10ˉ ⁶
74.18
10= 𝑙𝑜𝑔10
𝑃
20 × 10ˉ ⁶
𝐼𝑎 = 107.418 × 1 × 10−12
= 2.62 × 10−05 Watts
Sound Intensity Level – Peak hour Sound Intensity Level – Non – Peak
hour
SPL = 10𝑙𝑜𝑔10𝐼𝑎
1 × 10⁻¹²
76
10= 𝑙𝑜𝑔10
𝐼𝑎1 × 10⁻¹²
𝐼𝑎 = 107.6 × 1 × 10−12
= 3.98 × 10−05 Watts
SPL = 10𝑙𝑜𝑔10𝐼𝑎
1 × 10⁻¹²
59.5
10= 𝑙𝑜𝑔10
𝐼𝑎1 × 10⁻¹²
𝐼𝑎 = 105.95 × 1 × 10−12
= 8.91 × 10−07 Watts
67

iii) Reverberation Time, (RT)
Total Floor Area (m²) = 28.4 m²
Volume of Zone (𝑚3) = 85 𝑚3 Occupancy = 5
Calculation: 𝑇 =0.161 × 𝑉𝑜𝑙𝑢𝑚𝑒 𝑜𝑓 𝑍𝑜𝑛𝑒
(𝐴𝑟𝑒𝑎 𝑜𝑓 𝑆𝑢𝑟𝑓𝑎𝑐𝑒 × 𝐴𝑏𝑠𝑜𝑟𝑝𝑡𝑖𝑜𝑛 𝐶𝑜𝑒𝑓𝑓𝑖𝑐𝑖𝑒𝑛𝑡)
𝑇 =0.161 × 85
20.2
𝑇 = 0.68𝑠
Materials (Wall) Area (𝒎𝟐) Acoustic
Absorption
Coefficient
Area x Absorption
Coefficient
Plastered brick
wall with paint
36.4 m² 0.02 0.7
Solid gypsum
board with half
glazed timber
40.0 m² 0.17 6.8
Materials (Ceiling
and flooring)
Area (𝒎𝟐) Acoustic Absorption
Coefficient
Area x Absorption
Coefficient
Plywood timber
flooring
28.4 m² 0.10 2.8
Gypsum board
ceiling
28.4 m² 0.10 2.8
Materials (Door
and Furniture)
Area (𝒎𝟐) Acoustic Absorption
Coefficient
Area x Absorption
Coefficient
Cushioned chair 19.5 m² 0.22 4.3
Wood hollowcore
door
3.6 m² 0.15 0.5
Occupants 5 0.46 2.3
Total sound absorption 20.2
68
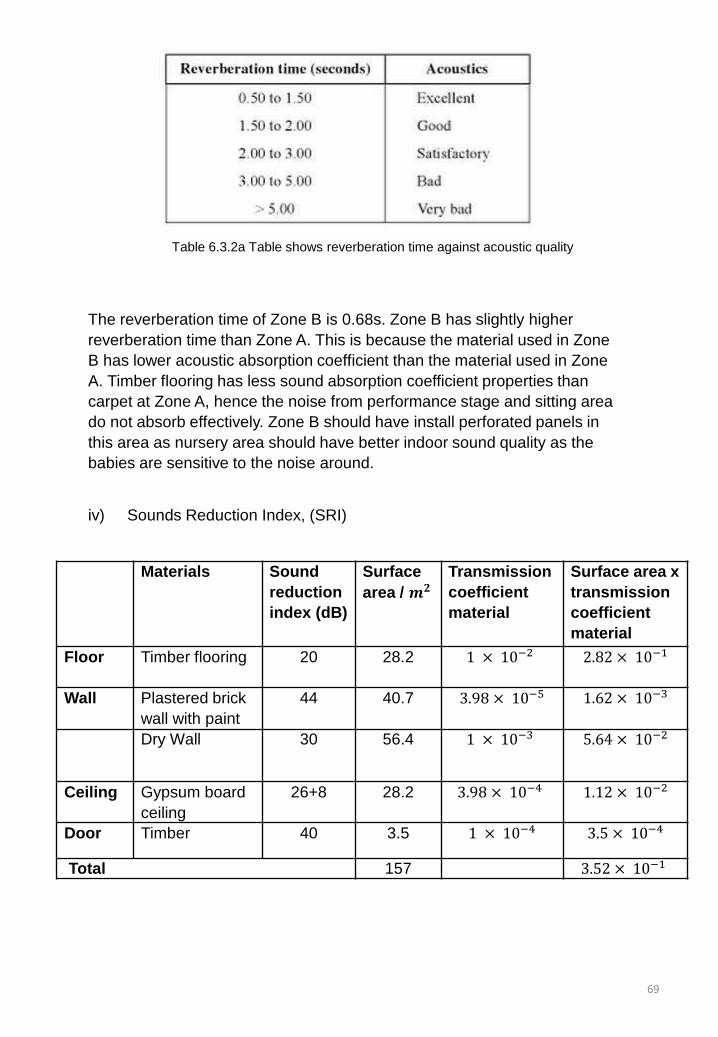
The reverberation time of Zone B is 0.68s. Zone B has slightly higher
reverberation time than Zone A. This is because the material used in Zone
B has lower acoustic absorption coefficient than the material used in Zone
A. Timber flooring has less sound absorption coefficient properties than
carpet at Zone A, hence the noise from performance stage and sitting area
do not absorb effectively. Zone B should have install perforated panels in
this area as nursery area should have better indoor sound quality as the
babies are sensitive to the noise around.
iv) Sounds Reduction Index, (SRI)
Materials Sound
reduction
index (dB)
Surface
area / 𝒎𝟐
Transmission
coefficient
material
Surface area x
transmission
coefficient
material
Floor Timber flooring 20 28.2 1 × 10⁻² 2.82 × 10⁻¹
Wall Plastered brick
wall with paint
44 40.7 3.98 × 10⁻⁵
1.62 × 10⁻³
Dry Wall 30 56.4 1 × 10⁻³ 5.64 × 10⁻²
Ceiling Gypsum board
ceiling
26+8 28.2 3.98 × 10⁻⁴ 1.12 × 10⁻²
Door Timber 40 3.5 1 × 10⁻⁴ 3.5 × 10⁻⁴
Total 157 3.52 × 10⁻¹
Table 6.3.2a Table shows reverberation time against acoustic quality
69
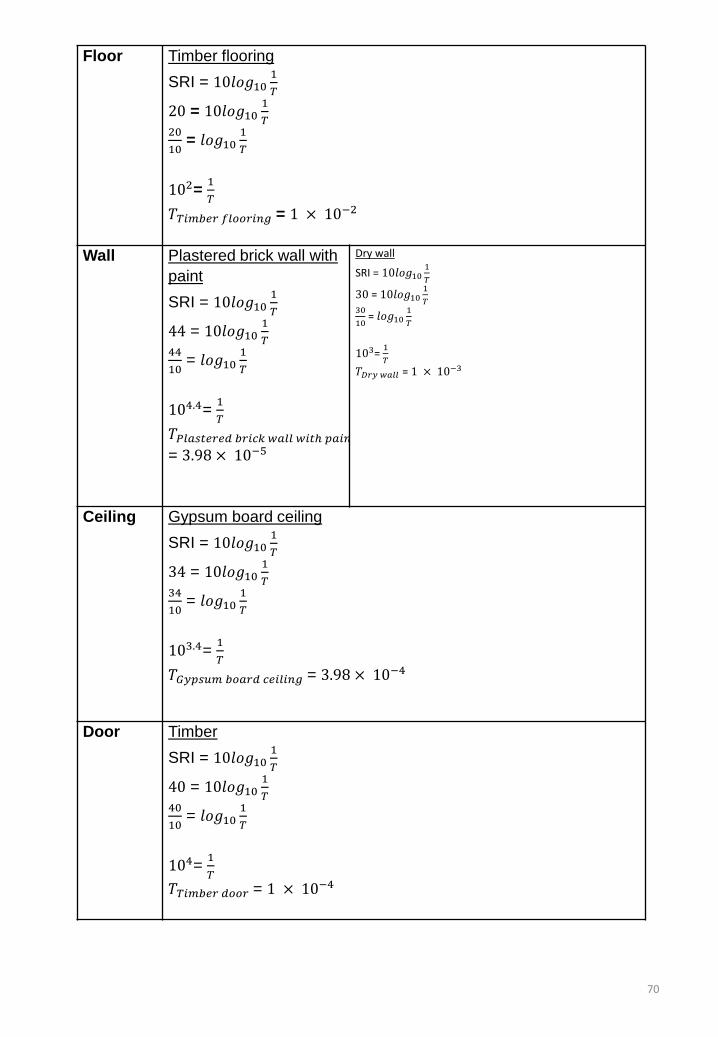
Floor Timber flooring
SRI = 10𝑙𝑜𝑔101
𝑇
20 = 10𝑙𝑜𝑔101
𝑇
20
10 = 𝑙𝑜𝑔10
1
𝑇
102= 1
𝑇
𝑇𝑇𝑖𝑚𝑏𝑒𝑟 𝑓𝑙𝑜𝑜𝑟𝑖𝑛𝑔 = 1 × 10⁻²
Wall Plastered brick wall with
paint
SRI = 10𝑙𝑜𝑔101
𝑇
44 = 10𝑙𝑜𝑔101
𝑇
44
10 = 𝑙𝑜𝑔10
1
𝑇
104.4= 1
𝑇
𝑇𝑃𝑙𝑎𝑠𝑡𝑒𝑟𝑒𝑑 𝑏𝑟𝑖𝑐𝑘 𝑤𝑎𝑙𝑙 𝑤𝑖𝑡 𝑝𝑎𝑖𝑛𝑡= 3.98 × 10⁻⁵
Dry wall
SRI = 10𝑙𝑜𝑔101
𝑇
30 = 10𝑙𝑜𝑔101
𝑇
30
10 = 𝑙𝑜𝑔10
1
𝑇
103= 1
𝑇
𝑇𝐷𝑟𝑦 𝑤𝑎𝑙𝑙 = 1 × 10⁻³
Ceiling Gypsum board ceiling
SRI = 10𝑙𝑜𝑔101
𝑇
34 = 10𝑙𝑜𝑔101
𝑇
34
10 = 𝑙𝑜𝑔10
1
𝑇
103.4= 1
𝑇
𝑇𝐺𝑦𝑝𝑠𝑢𝑚 𝑏𝑜𝑎𝑟𝑑 𝑐𝑒𝑖𝑙𝑖𝑛𝑔 = 3.98 × 10⁻⁴
Door Timber
SRI = 10𝑙𝑜𝑔101
𝑇
40 = 10𝑙𝑜𝑔101
𝑇
40
10 = 𝑙𝑜𝑔10
1
𝑇
104= 1
𝑇
𝑇𝑇𝑖𝑚𝑏𝑒𝑟 𝑑𝑜𝑜𝑟 = 1 × 10⁻⁴
70
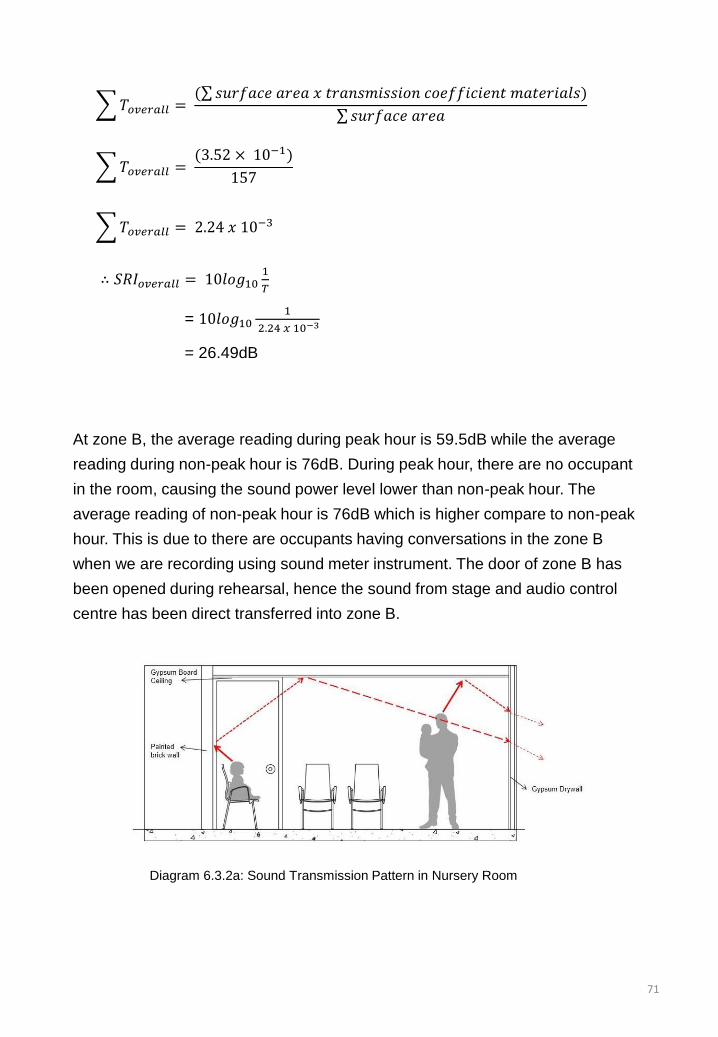
𝑇𝑜𝑣𝑒𝑟𝑎𝑙𝑙 = ( 𝑠𝑢𝑟𝑓𝑎𝑐𝑒 𝑎𝑟𝑒𝑎 𝑥 𝑡𝑟𝑎𝑛𝑠𝑚𝑖𝑠𝑠𝑖𝑜𝑛 𝑐𝑜𝑒𝑓𝑓𝑖𝑐𝑖𝑒𝑛𝑡 𝑚𝑎𝑡𝑒𝑟𝑖𝑎𝑙𝑠)
𝑠𝑢𝑟𝑓𝑎𝑐𝑒 𝑎𝑟𝑒𝑎
𝑇𝑜𝑣𝑒𝑟𝑎𝑙𝑙 = (3.52 × 10⁻¹)
157
𝑇𝑜𝑣𝑒𝑟𝑎𝑙𝑙 = 2.24 𝑥 10−3
∴ 𝑆𝑅𝐼𝑜𝑣𝑒𝑟𝑎𝑙𝑙 = 10𝑙𝑜𝑔101
𝑇
= 10𝑙𝑜𝑔101
2.24 𝑥 10−3
= 26.49dB
At zone B, the average reading during peak hour is 59.5dB while the average
reading during non-peak hour is 76dB. During peak hour, there are no occupant
in the room, causing the sound power level lower than non-peak hour. The
average reading of non-peak hour is 76dB which is higher compare to non-peak
hour. This is due to there are occupants having conversations in the zone B
when we are recording using sound meter instrument. The door of zone B has
been opened during rehearsal, hence the sound from stage and audio control
centre has been direct transferred into zone B.
Diagram 6.3.2a: Sound Transmission Pattern in Nursery Room
71
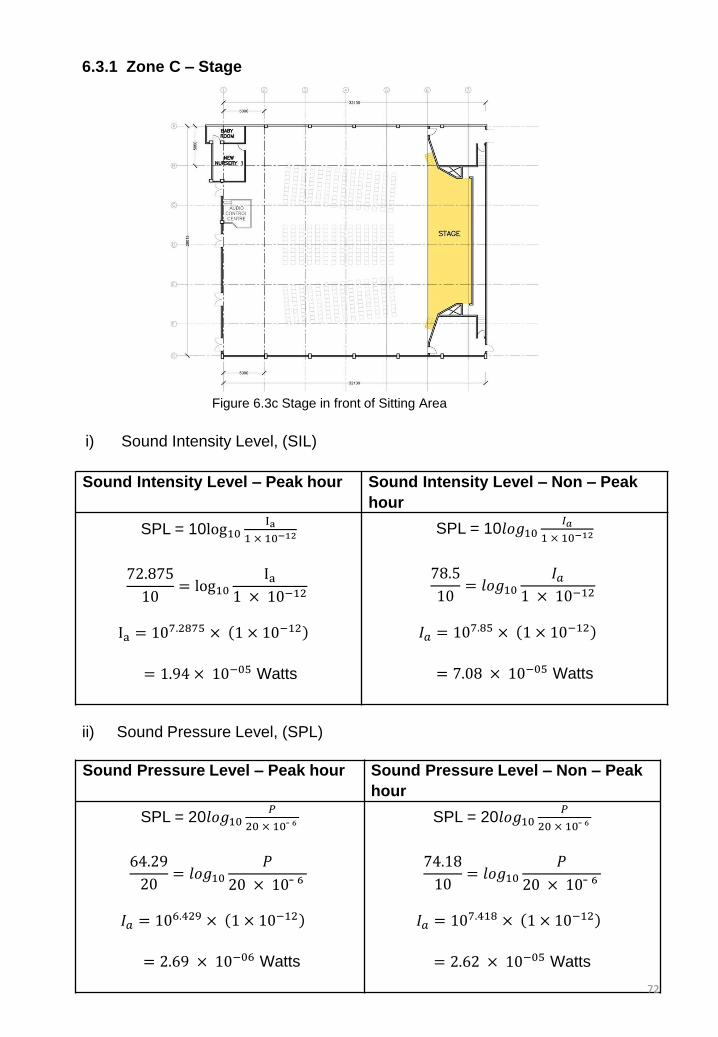
6.3.1 Zone C – Stage
i) Sound Intensity Level, (SIL)
ii) Sound Pressure Level, (SPL)
Figure 6.3c Stage in front of Sitting Area
Sound Intensity Level – Peak hour Sound Intensity Level – Non – Peak
hour
SPL = 10log10Ia
1 × 10⁻¹²
72.875
10= log10
Ia1 × 10−12
Ia = 107.2875 × 1 × 10−12
= 1.94 × 10−05 Watts
SPL = 10𝑙𝑜𝑔10𝐼𝑎
1 × 10⁻¹²
78.5
10= 𝑙𝑜𝑔10
𝐼𝑎1 × 10⁻¹²
𝐼𝑎 = 107.85 × 1 × 10−12
= 7.08 × 10−05 Watts
Sound Pressure Level – Peak hour Sound Pressure Level – Non – Peak
hour
SPL = 20𝑙𝑜𝑔10𝑃
20 × 10ˉ ⁶
64.29
20= 𝑙𝑜𝑔10
𝑃
20 × 10ˉ ⁶
𝐼𝑎 = 106.429 × 1 × 10−12
= 2.69 × 10−06 Watts
SPL = 20𝑙𝑜𝑔10𝑃
20 × 10ˉ ⁶
74.18
10= 𝑙𝑜𝑔10
𝑃
20 × 10ˉ ⁶
𝐼𝑎 = 107.418 × 1 × 10−12
= 2.62 × 10−05 Watts
72
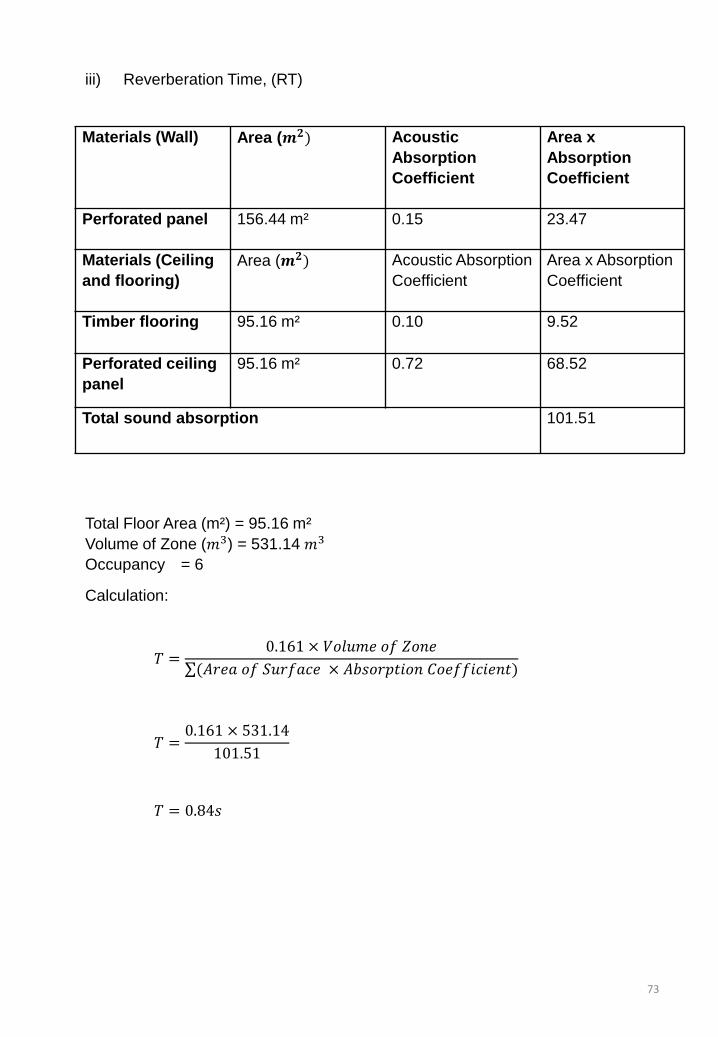
iii) Reverberation Time, (RT)
Materials (Wall) Area (𝒎𝟐) Acoustic
Absorption
Coefficient
Area x
Absorption
Coefficient
Perforated panel
156.44 m² 0.15 23.47
Materials (Ceiling
and flooring)
Area (𝒎𝟐) Acoustic Absorption
Coefficient
Area x Absorption
Coefficient
Timber flooring 95.16 m² 0.10 9.52
Perforated ceiling
panel
95.16 m² 0.72 68.52
Total sound absorption 101.51
Total Floor Area (m²) = 95.16 m²
Volume of Zone (𝑚3) = 531.14 𝑚3
Occupancy = 6
Calculation:
𝑇 =0.161 × 𝑉𝑜𝑙𝑢𝑚𝑒 𝑜𝑓 𝑍𝑜𝑛𝑒
(𝐴𝑟𝑒𝑎 𝑜𝑓 𝑆𝑢𝑟𝑓𝑎𝑐𝑒 × 𝐴𝑏𝑠𝑜𝑟𝑝𝑡𝑖𝑜𝑛 𝐶𝑜𝑒𝑓𝑓𝑖𝑐𝑖𝑒𝑛𝑡)
𝑇 =0.161 × 531.14
101.51
𝑇 = 0.84𝑠
73
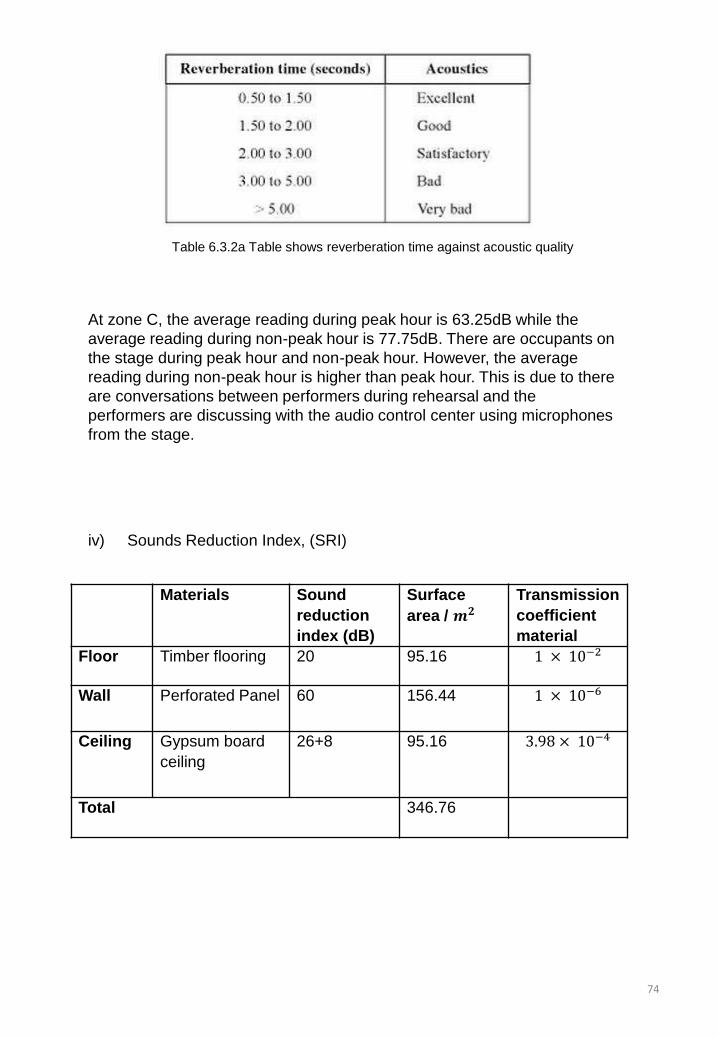
At zone C, the average reading during peak hour is 63.25dB while the
average reading during non-peak hour is 77.75dB. There are occupants on
the stage during peak hour and non-peak hour. However, the average
reading during non-peak hour is higher than peak hour. This is due to there
are conversations between performers during rehearsal and the
performers are discussing with the audio control center using microphones
from the stage.
iv) Sounds Reduction Index, (SRI)
Table 6.3.2a Table shows reverberation time against acoustic quality
Materials Sound
reduction
index (dB)
Surface
area / 𝒎𝟐
Transmission
coefficient
material
Floor Timber flooring 20 95.16 1 × 10⁻²
Wall Perforated Panel 60 156.44 1 × 10⁻⁶
Ceiling Gypsum board
ceiling
26+8 95.16 3.98 × 10⁻⁴
Total 346.76
74

Floor Timber flooring
SRI = 10𝑙𝑜𝑔101
𝑇
20 = 10𝑙𝑜𝑔101
𝑇
20
10 = 𝑙𝑜𝑔10
1
𝑇
102= 1
𝑇
𝑇𝑇𝑖𝑚𝑏𝑒𝑟 𝑓𝑙𝑜𝑜𝑟𝑖𝑛𝑔 = 1 × 10⁻²
Wall Perforated panel
SRI = 10𝑙𝑜𝑔101
𝑇
60 = 10𝑙𝑜𝑔101
𝑇
60
10 = 𝑙𝑜𝑔10
1
𝑇
106= 1
𝑇
𝑇𝑃𝑒𝑟𝑓𝑜𝑟𝑎𝑡𝑒𝑑 𝑎𝑐𝑜𝑢𝑠𝑡𝑖𝑐 𝑝𝑎𝑛𝑒𝑙 = 1 × 10⁻⁶
Ceiling Gypsum board ceiling
SRI = 10𝑙𝑜𝑔101
𝑇
34 = 10𝑙𝑜𝑔101
𝑇
34
10 = 𝑙𝑜𝑔10
1
𝑇
103.4= 1
𝑇
𝑇𝐺𝑦𝑝𝑠𝑢𝑚 𝑏𝑜𝑎𝑟𝑑 𝑐𝑒𝑖𝑙𝑖𝑛𝑔 = 3.98 ×
10−4
𝑇𝑜𝑣𝑒𝑟𝑎𝑙𝑙 = ( 𝑠𝑢𝑟𝑓𝑎𝑐𝑒 𝑎𝑟𝑒𝑎 𝑥 𝑡𝑟𝑎𝑛𝑠𝑚𝑖𝑠𝑠𝑖𝑜𝑛 𝑐𝑜𝑒𝑓𝑓𝑖𝑐𝑖𝑒𝑛𝑡 𝑚𝑎𝑡𝑒𝑟𝑖𝑎𝑙𝑠)
𝑠𝑢𝑟𝑓𝑎𝑐𝑒 𝑎𝑟𝑒𝑎
𝑇𝑜𝑣𝑒𝑟𝑎𝑙𝑙 = (9.9 × 10⁻¹)
346.76
𝑇𝑜𝑣𝑒𝑟𝑎𝑙𝑙 = 2.86 × 10⁻³
∴ 𝑆𝑅𝐼𝑜𝑣𝑒𝑟𝑎𝑙𝑙 = 10𝑙𝑜𝑔101
𝑇
= 10𝑙𝑜𝑔101
2.86× 10−3
= 25.44
75
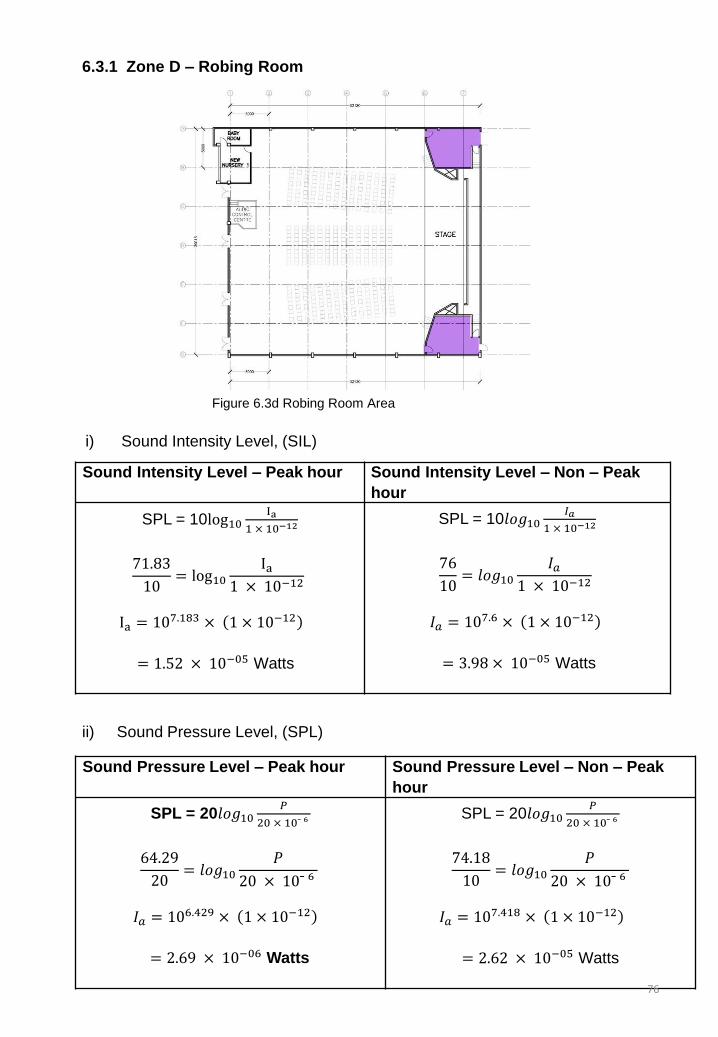
6.3.1 Zone D – Robing Room
i) Sound Intensity Level, (SIL)
ii) Sound Pressure Level, (SPL)
Figure 6.3d Robing Room Area
Sound Intensity Level – Peak hour Sound Intensity Level – Non – Peak
hour
SPL = 10log10Ia
1 × 10⁻¹²
71.83
10= log10
Ia1 × 10−12
Ia = 107.183 × 1 × 10−12
= 1.52 × 10−05 Watts
SPL = 10𝑙𝑜𝑔10𝐼𝑎
1 × 10⁻¹²
76
10= 𝑙𝑜𝑔10
𝐼𝑎1 × 10⁻¹²
𝐼𝑎 = 107.6 × 1 × 10−12
= 3.98 × 10−05 Watts
Sound Pressure Level – Peak hour Sound Pressure Level – Non – Peak
hour
SPL = 20𝑙𝑜𝑔10𝑃
20 × 10ˉ ⁶
64.29
20= 𝑙𝑜𝑔10
𝑃
20 × 10ˉ ⁶
𝐼𝑎 = 106.429 × 1 × 10−12
= 2.69 × 10−06 Watts
SPL = 20𝑙𝑜𝑔10𝑃
20 × 10ˉ ⁶
74.18
10= 𝑙𝑜𝑔10
𝑃
20 × 10ˉ ⁶
𝐼𝑎 = 107.418 × 1 × 10−12
= 2.62 × 10−05 Watts
76
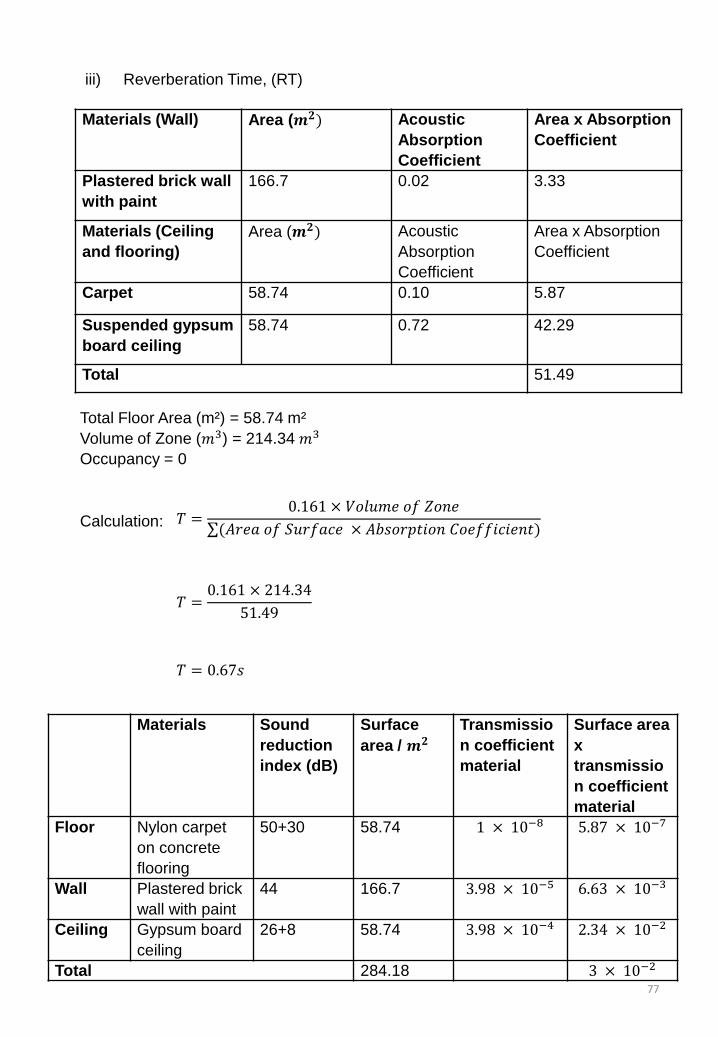
iii) Reverberation Time, (RT)
Total Floor Area (m²) = 58.74 m²
Volume of Zone (𝑚3) = 214.34 𝑚3
Occupancy = 0
Calculation: 𝑇 =0.161 × 𝑉𝑜𝑙𝑢𝑚𝑒 𝑜𝑓 𝑍𝑜𝑛𝑒
(𝐴𝑟𝑒𝑎 𝑜𝑓 𝑆𝑢𝑟𝑓𝑎𝑐𝑒 × 𝐴𝑏𝑠𝑜𝑟𝑝𝑡𝑖𝑜𝑛 𝐶𝑜𝑒𝑓𝑓𝑖𝑐𝑖𝑒𝑛𝑡)
𝑇 =0.161 × 214.34
51.49
𝑇 = 0.67𝑠
Materials (Wall) Area (𝒎𝟐) Acoustic
Absorption
Coefficient
Area x Absorption
Coefficient
Plastered brick wall
with paint
166.7 0.02 3.33
Materials (Ceiling
and flooring)
Area (𝒎𝟐) Acoustic
Absorption
Coefficient
Area x Absorption
Coefficient
Carpet 58.74 0.10 5.87
Suspended gypsum
board ceiling
58.74 0.72 42.29
Total 51.49
Materials Sound
reduction
index (dB)
Surface
area / 𝒎𝟐
Transmissio
n coefficient
material
Surface area
x
transmissio
n coefficient
material
Floor Nylon carpet
on concrete
flooring
50+30 58.74 1 × 10⁻⁸ 5.87 × 10⁻⁷
Wall Plastered brick
wall with paint
44 166.7 3.98 × 10⁻⁵ 6.63 × 10⁻³
Ceiling Gypsum board
ceiling
26+8 58.74 3.98 × 10⁻⁴ 2.34 × 10⁻²
Total 284.18 3 × 10⁻² 77

𝑇𝑜𝑣𝑒𝑟𝑎𝑙𝑙 = ( 𝑠𝑢𝑟𝑓𝑎𝑐𝑒 𝑎𝑟𝑒𝑎 𝑥 𝑡𝑟𝑎𝑛𝑠𝑚𝑖𝑠𝑠𝑖𝑜𝑛 𝑐𝑜𝑒𝑓𝑓𝑖𝑐𝑖𝑒𝑛𝑡 𝑚𝑎𝑡𝑒𝑟𝑖𝑎𝑙𝑠)
𝑠𝑢𝑟𝑓𝑎𝑐𝑒 𝑎𝑟𝑒𝑎
𝑇𝑜𝑣𝑒𝑟𝑎𝑙𝑙 = (3 × 10⁻²)
284.18
𝑇𝑜𝑣𝑒𝑟𝑎𝑙𝑙 = 1.06 𝑥 10−5
∴ 𝑆𝑅𝐼𝑜𝑣𝑒𝑟𝑎𝑙𝑙 = 10𝑙𝑜𝑔101
𝑇
= 10𝑙𝑜𝑔101
1.06 𝑥 10−5
= 49.75dB
Floor Timber flooring
SRI = 10𝑙𝑜𝑔101
𝑇
20 = 10𝑙𝑜𝑔101
𝑇
20
10 = 𝑙𝑜𝑔10
1
𝑇
102= 1
𝑇
𝑇𝑇𝑖𝑚𝑏𝑒𝑟 𝑓𝑙𝑜𝑜𝑟𝑖𝑛𝑔 = 1 × 10⁻²
Wall Perforated panel
SRI = 10𝑙𝑜𝑔101
𝑇
60 = 10𝑙𝑜𝑔101
𝑇
60
10 = 𝑙𝑜𝑔10
1
𝑇
106= 1
𝑇
𝑇𝑃𝑒𝑟𝑓𝑜𝑟𝑎𝑡𝑒𝑑 𝑎𝑐𝑜𝑢𝑠𝑡𝑖𝑐 𝑝𝑎𝑛𝑒𝑙 = 1 × 10⁻⁶
Ceiling Gypsum board ceiling
SRI = 10𝑙𝑜𝑔101
𝑇
34 = 10𝑙𝑜𝑔101
𝑇
34
10 = 𝑙𝑜𝑔10
1
𝑇
103.4= 1
𝑇
𝑇𝐺𝑦𝑝𝑠𝑢𝑚 𝑏𝑜𝑎𝑟𝑑 𝑐𝑒𝑖𝑙𝑖𝑛𝑔 = 3.98 × 10⁻⁴
78
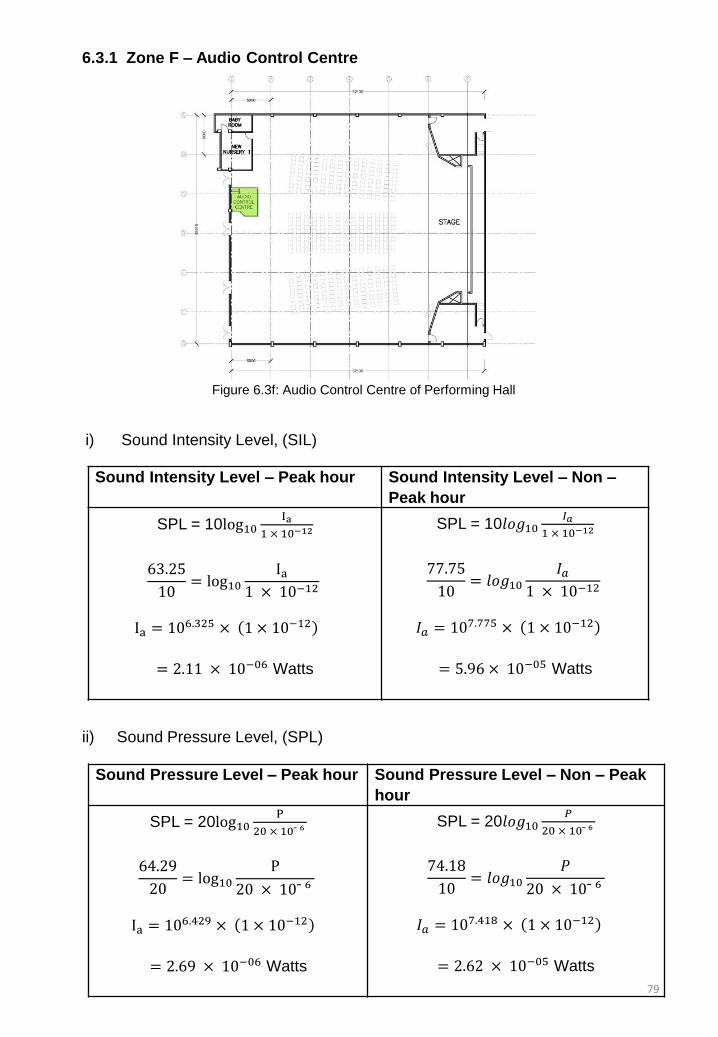
6.3.1 Zone F – Audio Control Centre
i) Sound Intensity Level, (SIL)
ii) Sound Pressure Level, (SPL)
Figure 6.3f: Audio Control Centre of Performing Hall
Sound Intensity Level – Peak hour Sound Intensity Level – Non –
Peak hour
SPL = 10log10Ia
1 × 10⁻¹²
63.25
10= log10
Ia1 × 10−12
Ia = 106.325 × 1 × 10−12
= 2.11 × 10−06 Watts
SPL = 10𝑙𝑜𝑔10𝐼𝑎
1 × 10⁻¹²
77.75
10= 𝑙𝑜𝑔10
𝐼𝑎1 × 10⁻¹²
𝐼𝑎 = 107.775 × 1 × 10−12
= 5.96 × 10−05 Watts
Sound Pressure Level – Peak hour Sound Pressure Level – Non – Peak
hour
SPL = 20log10P
20 × 10ˉ ⁶
64.29
20= log10
P
20 × 10ˉ ⁶
Ia = 106.429 × 1 × 10−12
= 2.69 × 10−06 Watts
SPL = 20𝑙𝑜𝑔10𝑃
20 × 10ˉ ⁶
74.18
10= 𝑙𝑜𝑔10
𝑃
20 × 10ˉ ⁶
𝐼𝑎 = 107.418 × 1 × 10−12
= 2.62 × 10−05 Watts
79

6.4 Acoustic Ray
Speaker on one side of the stage
The sound from the speaker at the side of the stage is being reflected towards
the seating area.
80

The reverberation waves are reflected from the sides of the hall hence acoustic
panels are placed on the walls of all sides to attenuate the intensity of
reverberations in the hall.
Front elevation: The sound waves are reflected from the ceiling towards the
sitting area.
Side elevation: The sound waves travel across the hall and reflect from the walls
and ceiling.
81

6.4 Acoustic Contour
Figure 6.4a: Acoustic Contour of Non-peak Hour
Figure 6.4b: Acoustic Contour of Peak Hour
82

7.0 Conclusion
Through the documentation and analysis of both the lighting of the cafeteria
and the acoustic properties of the main hall, we were able to make a deduction
on the quality and efficiency of this aspects.
The cafeteria acts as the main entry circulation path aside from the lobby as it
is more prominent in terms of location and its potential to perpetuate numerous
human activities. As such, the lighting within the cafeteria plays a significant
role to ensure the comfortability and perceptibility of users. From the research,
we can deduce that the multiple fenestrations along the edges of the cafeteria
provides the space with substantial amount of natural lighting where as artificial
lighting is only partially needed to light up spaces where light is unable to reach.
From evening onwards however, the space becomes dependent on artificial
lights positioned in the cafeteria which is not sufficient and thus may appear
very dim.
From our observation of the main hall, the materials used were chosen
specifically to create a harmonic acoustical environment. Perforated wooden
panels are attached to the side walls and perforated panels on the ceiling as
well, this system fashions a space that reduces echo while allowing sounds
from the stage to be heard clearly by the audience. All the zones within the
main hall meet and even surpasses the standard needed for a good acoustic
environment.
83
7.1 Reference
• Aiacny.org,. (2008). The Leading Edge. Retrieved 15 May 2015, from http://www.aiacny.org/newsletters/2008/April/aiacny4.htm
• ArchDaily,. (2013). Origo Coffee Shop / Lama Arhitectura. Retrieved 15 May 2015, from http://www.archdaily.com/370493/origo-coffee-shop-lama-arhitectura/
• Cavanaugh, W., & Wilkes, J. (1999). Architectural acoustics. New York: Wiley.
• Customaudiodesigns.co.uk,. (2015). Office Acoustics - Noise Control for Offices. Retrieved 15 May 2015, from http://www.customaudiodesigns.co.uk/office-acoustics.htm
• EXTECH INSTRUMENTS,. (2014). Digital Sound Level Meter. Retrieved 15 May 2015, from http://www.extech.com/instruments/resources/manuals/407730_UM.pdf
• Kayelaby.npl.co.uk,. (2015). Building acoustics 2.4.4. Retrieved 15 May 2015, from http://www.kayelaby.npl.co.uk/general_physics/2_4/2_4_4.html
• Engineeringtoolbox.com,. (2015). Illuminance - Recommended Light Levels. Retrieved 15 May 2015, from http://www.engineeringtoolbox.com/light-level-rooms-d_708.html
• Pioneer Lighting,. (2015). Room Illumination Level. Retrieved 15 May 2015, from http://www.pioneerlighting.com/new/pdfs/IESLuxLevel.pdf
• Steelconstruction.info,. (2015). Acoustics regulations. Retrieved 15 May 2015, from http://www.steelconstruction.info/Acoustics_regulations
84