bsc performance ebook
DESCRIPTION
BSC performance ebookTRANSCRIPT

Does a Balanced Scorecard Management Cockpit Increase Strategy
Implementation Performance?
Findings of a series of experiments using a system dynamics based micro-world
Jürgen Strohhecker, Frankfurt School of Finance and Management
Please direct correspondence to:
Jürgen Strohhecker
Frankfurt School of Finance and Management
Sonnemannstraße 9-11
60314 Frankfurt am Main
Phone: +49 69 154008-110
Fax: +49 69 154008-728
July 2007

2
Does a Balanced Scorecard Management Cockpit Increase Strategy
Implementation Performance?
Abstract
In various articles and books, Kaplan and Norton maintain that use of a Balanced
Scorecard (BSC) will increase an organization's ability to execute its strategy and
therefore ultimately improve its performance. They substantiate their hypothesis with
numerous cases for which they report “breakthrough performance”. Nonetheless,
published empirical evidence for the BSC’s positive impact on performance is sparse.
This article aims to contribute to the empirical research on the BSC’s performance
impact describing a laboratory experiment. Using a computer-based feedback-rich
micro-world, the subjects were placed in a top manager position. Their task was to
implement a given strategy as best as they could, which meant to translate strategy into
operational decisions over a period of 10 years. The experiment group was equipped
with a BSC management cockpit that was carefully tailored to the strategy, while the
control group had to rely on traditional reports as information source.
The experiment data are used to test the hypothesis that subjects provided with the BSC
cockpit perform better than the control group. Statistical analysis shows that this
hypothesis could not be rejected. The BSC cockpit indeed had a positive impact on
performance. Some possible explanations for this finding are discussed and issues for
further research are outlined.
Key Words: Balanced Scorecard; Performance Measurement; Empirical Research;
Laboratory Experiment

3
Does a Balanced Scorecard Management Cockpit Increase Strategy
Implementation Performance?
1 Introduction
Kaplan and Norton’s balanced scorecard (BSC) is, without a doubt, one of the major
improvements in management and controlling tools (Atkinson et al., 1997, p. 94; Ittner
& Larcker, 1998a, p. 205). In their 1992 article, Kaplan and Norton introduced the BSC
mainly as a balanced performance measurement system with a comprehensible number
of indicators allocated to four perspectives.1 The importance of a company’s overall
vision and strategy for the development process of a BSC was seen, yet the implications
for the strategic management process were not worked out. Subsequent books and
articles – (Kaplan & Norton, 1996a; 1996b; 2001; 2004a; 2004b) – have placed
increasing emphasis on the connection between measurement and strategy and have
extended the BSC to a strategic management system with an important role in strategy
implementation.
In their various articles and books (Kaplan & Norton, 1992; 1996a; 1996b; 2001; 2004a;
2004b), the authors maintain that use of a BSC will ultimately improve an organization's
performance. Whether this is indeed the case, is – according to Ittner and Larcker
(1998b, p. 223) – the “primary research question arising from the use of non-financial
measures and the balanced scorecard”. While Kaplan and Norton do not provide a
1 Kaplan and Norton (1996b) recommend between 4 and 7 measures per perspective and between 16 and
25 measures for the whole scorecard. The four perspectives are as follows: financial perspective, customer
perspective, internal process perspective, and learning and growth perspective.

4
systematic overview over the various causal effects of a BSC, Strohhecker (2004)
suggests a detailed cause-and-effect hypothesis system on BSC’s impact on
performance, which is graphically shown in Figure 1.
Single Loop Learning
Information Quality
Performance
Information
Delivery Lead-time
Information
Overload
Information
Accuracy
Information
Accesibility
Information
Representation
Information
Relevance
Double Loop Learning
Strategy
Evaluation and
Control
Strategy
Formulation
Vision Dissemination
Vision Translation
into Goals
Vision Translation
into Strategy
+
-
+
+
+
+
+
++
Usage of
BSC
-
-
-+
+
+
+
+
+
+
Figure 1: Hypotheses System on BSC’s Impact on Performance
This study contributes to the existing literature by putting an aggregated selection of the
causal hypotheses shown in Figure 1 to an empirical scientific test. Specifically, the
hypothesis under investigation is as follows:

5
H1: If the management of an organization uses a BSC as management and controlling
cockpit, the organization's performance will increase.
This is a direct consequence of the mechanics expressed by the following hypotheses H2
to H5.
H2: If the management of an organization uses a BSC as management and controlling
cockpit, information overload is decreased.
H3: If the management of an organization uses a BSC as management and controlling
cockpit, information representation is improved.
H4: If the management of an organization uses a BSC as management and controlling
cockpit, information relevance is increased.
H5: If the management of an organization uses a BSC as management and controlling
cockpit, vision translation into goals is rectified.
Kaplan and Norton substantiate their central hypothesis that introducing a BSC
improves an organization’s performance citing numerous cases for which they report
“breakthrough performance” (e. g. Kaplan & Norton, 2001, pp. 60–62). Nonetheless,
their empirical evidence of the BSC’s positive impact on performance is anecdotal.
Over the years they describe a fair amount of cases indeed; however, they do not
perform a rigorous, systematic, scientific analysis of their material.
Other research might have addressed this crucial issue. In the following section, a
thorough review of English and German literature therefore examines whether scientific
empiric research on the BSC’s performance impact exists at all. Section three outlines

6
the research method and design of the laboratory experiment used in this study to test
H1. The results of the statistical analysis of the experiment data are presented in section
four. Limitations of the research are discussed in section five, and the paper concludes
with some remarks on managerial implications and directions of further research.
2 Empirical evidence of the Balanced Scorecard’s performance impact
Kaplan and Norton’s first Harvard Business Review article published in 1992 has
triggered an avalanche of projects and publications. Since then, dozens of books about
the BSC have been published, and hundreds of articles have been written. The
overwhelming majority falls either in the category “normative description of the BSC
concept” or in the category “applications/case studies”. Most of these third-party
publications adapt the approach of Kaplan and Norton and focus on methodological
principles, normative arguments, guidelines, and anecdotal success stories.
Compared to the substantial number of BSC-related publications, articles and books
about empirical research are sparse.
Hoque and James (2000) examine the relationship between organization size, product
life cycle stage, market position, BSC usage and organizational performance. Based on
a survey of 66 Australian manufacturing companies, their paper encouragingly suggests
that adoption of a BSC is associated with improved performance. Moreover, the authors
find that this relationship does not depend significantly on organization size, product life
cycle, or market position. Support for H1 seems to be provided.

7
However, the measurement concept for the two variables “organizational performance”
and “balanced scorecard usage” is contestable. On the one hand, Hoque and James rely
heavily on subjective assessment; on the other hand, the 20-item scale used to measure
BSC usage does not appear to be a perfect approach, as the authors admit themselves
(Hoque & James, 2000, p. 12). The scale includes 20 common performance measures,
such as operating income, number of customer complaints, manufacturing lead time and
number of new patents. For each measure, respondents could indicate on a fully
anchored, five-point Lickert scale the extent to which the measure was used in their
organization. Thus, Hoque and James assume that a standard BSC with 20 measures
exists, which fits all companies. However, this contradicts Kaplan and Norton’s (1996a,
pp. 147–151) original concept which recommends individualized BSCs tailored to the
organization's strategy.
Like BSC usage, organizational performance also had to be assessed subjectively.
Respondents were asked to indicate their organization’s performance compared to their
competitors along five dimensions on a scale from 1 (= below average) to 5 (= above
average). The five dimensions included return on investment, margin on sales, capacity
utilization, customer satisfaction, and product quality. Hoque and James report a
satisfactory internal reliability of organizational performance and BSC usage. However,
the external validity of the measurement concept is questionable (Bortz & Döring, 2002,
pp. 326–329; Sterman, 1989, pp. 321–339) due to biases and perception delays by the
respondents completing the questionnaire. The method provides only indirect and highly
subjective information. Therefore, the method is suitable for revealing the user’s
subjective evaluations, which is clearly interesting in itself. However, the method is not

8
suited to making objective information about the real situation available. While difficult
to conduct, collection of real data is preferable, particularly when measuring
organizational performance.
Maiga and Jacobs (2003) investigate the interaction effect of activity based costing and
BSC on manufacturing unit performance. While the authors use the same 20-item scale
as Hoque and James (2000) to measure BSC usage, they rely on three dimensions for
measuring organizational performance: product quality, customer satisfaction and
margin on sales. The authors test their bivariate model using 83 completed
questionnaires. However, Pearson correlations were remarkable high (0.49, 0.50, 0.50)
and statistically significant only for the BSC learning and growth perspective measures
and the three performance measures. The critical remarks concerning the Hoque and
James’ study also apply to the work of Maiga and Jacob, whose findings show at best
partial and very weak support for H1.
Buckmaster (2002) addresses the research question whether positive relationships exist
between non-accounting based and accounting based performance indicators. Twenty
large Australian manufacturing and service corporations were surveyed to obtain annual
results over five years (1991 to 1995 inclusive). Eighteen corporations responded. The
author could identify three patterns of results. For nine firms, non-accounting based
indicators improved consistently, parallel with accounting based indicators. The
relationship was negative for three “non aligned” corporations, and for the remaining 6
“not coherent” firms, no consistent relationship could be observed. No further statistical
analysis could be performed due to the small data sample.
9
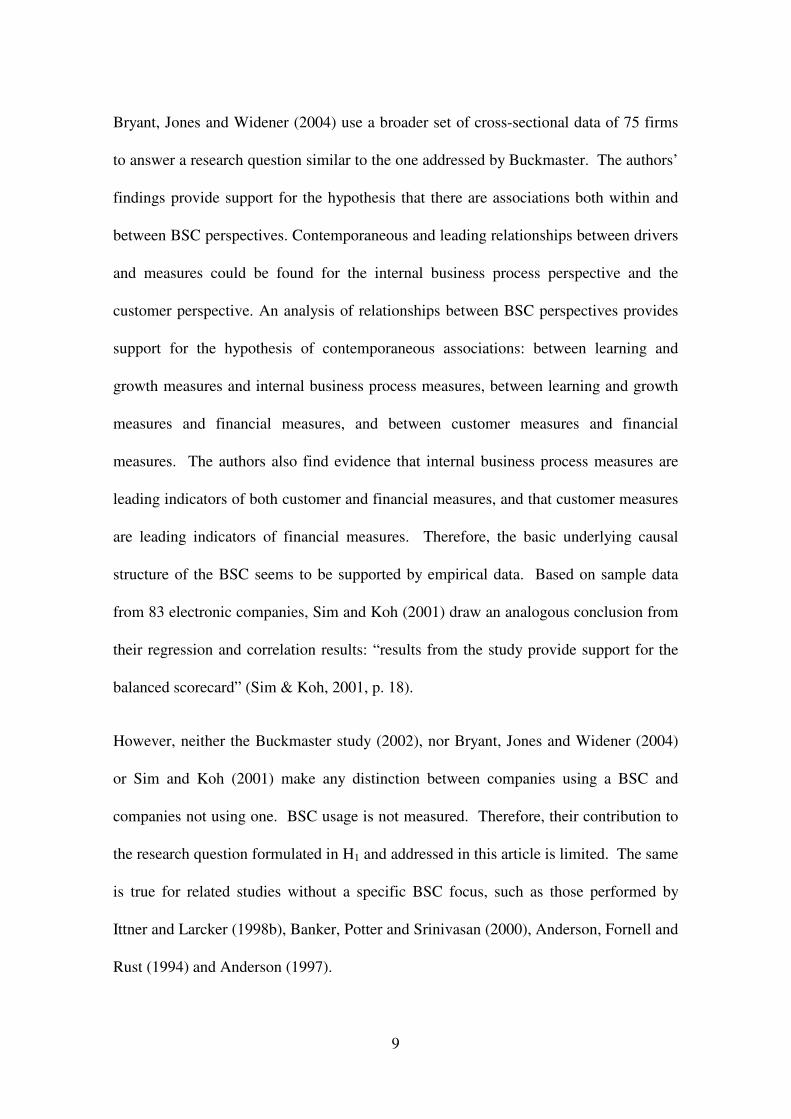
Bryant, Jones and Widener (2004) use a broader set of cross-sectional data of 75 firms
to answer a research question similar to the one addressed by Buckmaster. The authors’
findings provide support for the hypothesis that there are associations both within and
between BSC perspectives. Contemporaneous and leading relationships between drivers
and measures could be found for the internal business process perspective and the
customer perspective. An analysis of relationships between BSC perspectives provides
support for the hypothesis of contemporaneous associations: between learning and
growth measures and internal business process measures, between learning and growth
measures and financial measures, and between customer measures and financial
measures. The authors also find evidence that internal business process measures are
leading indicators of both customer and financial measures, and that customer measures
are leading indicators of financial measures. Therefore, the basic underlying causal
structure of the BSC seems to be supported by empirical data. Based on sample data
from 83 electronic companies, Sim and Koh (2001) draw an analogous conclusion from
their regression and correlation results: “results from the study provide support for the
balanced scorecard” (Sim & Koh, 2001, p. 18).
However, neither the Buckmaster study (2002), nor Bryant, Jones and Widener (2004)
or Sim and Koh (2001) make any distinction between companies using a BSC and
companies not using one. BSC usage is not measured. Therefore, their contribution to
the research question formulated in H1 and addressed in this article is limited. The same
is true for related studies without a specific BSC focus, such as those performed by
Ittner and Larcker (1998b), Banker, Potter and Srinivasan (2000), Anderson, Fornell and
Rust (1994) and Anderson (1997).

10
Lipe and Salterio (2000) initiated another direction of empirical research related to the
BSC but with a different research focus. Their study examines how BSCs, which
include some measures common to multiple units and other measures that are unique to
a particular unit, affect superiors’ evaluations of that unit’s performance. The test
shows that only the common measures affect superiors’ evaluations. However, if
managers pay insufficient attention to leading financial and non-financial measures,
there is great danger that their decision-making remains unaffected, putting the costly
adoption of the BSC into question. Follow-up research on this issue was published by
Roberts, Albright and Hibbets (2004) and confirms the findings of Lipe and Salterio.
In his 1999-study, Rigby (2001) asked 11,824 North American executives about use and
non-use of 25 management tools in their organizations and about their satisfaction with
these tools. Based on 214 completed questionnaires, the BSC attained an average of
3.85 on a scale of 1 (dissatisfied) to 5 (extremely satisfied). This score is only slightly
above the overall average of 3.76, but ranked eighth of the 25 tools. Rigby’s study
suffers not only from the extremely low response rate of 1.8 % but, like the Hoque and
James (2000) study, from highly subjective and indirectly provided information.
Several studies were carried out in Germany to gather data about users' experience with
applying the BSC concept. In the first study, PriceWaterhouseCoopers (2001) surveyed
the top 200 companies in Germany. 129 firms responded. 59 indicated using a BSC.
Three among the 40 questions asked for an assessment of the BSC’s utility. One of
these questions addressed the financial impact directly: “Have the financial results
improved due to the implementation of a balanced scorecard?” Interestingly, 65 % of
the respondents did not answer this question; only 10 % of the firms answered ‘Yes’,

11
while 25 % said “No, the balanced scorecard has not improved financial performance”.
The shortcomings of the gathered data concerning the BSC’s performance impact are
the same as in the studies of Rigby (2001) and Hoque and James (2000). Additionally,
the PWC study provides no information about the person who completed the
questionnaire. Since Gilles (2002), Speckbacher, Bischof and Pfeiffer (2001) and
Horvath & Partners Management Consultants (2004) used comparable survey designs,
their results have to be interpreted with similar care.
The research most closely related to this study was performed by Davis and Albright
(2004). Their purpose was to “investigate the effectiveness of the Balanced Scorecard
(BSC) in improving financial performance”. The authors used a quasi-experimental
research design. Based on longitudinal data, they analyzed, within the same banking
organization, whether bank branches using the BSC outperformed branches not using a
BSC on key financial measures. The findings support Kaplan and Norton’s claim that
the BSC increases performance and therefore support hypothesis H1. Davis and
Albright find that the performance of bank branches using a BSC improved significantly
subsequent to its implementation, while the performance of the control group branches
did not improve.
The quasi-experimental design with a control group in a field setting is unique to the
existing empirical research on the BSC. Although the highest degree of control is
obtained with true experiments, the quasi-experimental design is superior to the survey
field research, which was applied in the empirical studies discussed above (Graziano
and Raulin, (2004, p. 294). Davis and Albright’s study is the one that provides the
strongest support for the widely claimed positive performance impact of the BSC.

12
Nevertheless, there are a number of limitations (Davis & Albright, 2004, pp. 150–151).
The sample size of only 9 branches is very small. Because the performance data time
series encompassed only two years – one year before the BSC implementation and one
year thereafter – sustainability of the performance improvement could not be
investigated. The authors were not able to rule out the Hawthorne effect, i.e. the
phenomenon that subjects improve their performance simply because of the attention
they are given during the study. Finally, it is not granted that the findings can be
generalized beyond the banking industry.
As Ittner and Larcker (1998a, p. 223) suggest, despite a considerable amount of
empirical research efforts during the last years, the primary research question arising
from the use of non-financial measures and the BSC is still not conclusively answered:
Does the use of the BSC produce a net economic benefit or not? The literature review
has shown that this question has not yet been clearly answered. This study contributes
to the existing literature by addressing an important part of the research question based
on true laboratory experiments. It investigates, if a BSC management and controlling
cockpit has a positive impact on performance. A methodological approach similar to the
one of Lipe and Salterio (2000) and Roberts, Albright and Hibbets (2004) is used;
however, the causal relationship between BSC usage and performance is examined
directly. Section 3 describes the research design applied in the study in more detail.
3 The research design
Although research methodology literature (e.g. Bortz & Döring, 2002, p. 61) ranks
experimental field studies first in internal and external validity, there are several

13
obstacles that prevent the application of this research method for testing the BSC’s
theory. Since field studies involve experiments in natural settings, complexity is the
most severe issue (Graziano & Raulin, 2004, p. 124). In order to isolate the causal
relationships between an organization's usage of a BSC and its performance, other
factors also impacting performance have to be controlled. However, organizations face
a complex network of cause-and-effect relationships affecting their performance. It is
very difficult – if not impossible – to keep track of all those possibly disruptive factors.
True BSC field experiments would either be extremely costly or irreproducible. In
contrast to most other studies discussed in section 2, which use the field approach or
quasi-experimental field studies, this study used an experimental laboratory method as
research design. More precisely, a randomized, posttest-only, control-group design – as
displayed in Figure 2 – was implemented (Trochim, 2001).
Randomly AssignedGroup A
(experimental)
Treatment =BSC Management
CockpitPosttest
Randomly AssignedGroup A
(experimental)
Treatment =BSC Management
CockpitPosttest
Randomly AssignedGroup B(control)
No Treatment =Traditional Report
Management CockpitPosttest
Randomly AssignedGroup B(control)
No Treatment =Traditional Report
Management CockpitPosttest
Compare
Figure 2: Randomized, posttest-only, control-group design
In combination with the randomization, the laboratory allows to gain control over nearly
all disruptive factors that might influence the dependent variable and results therefore in
a very high internal validity (Bortz & Döring, 2002, p. 60). External validity of a
laboratory design might be questionable, as the artificiality of the laboratory might
prevent the results from being honestly generalized. However, external validity can be

14
improved by designing the experiment carefully and as realistically as possible. For this
study a computer-based, feedback-rich micro-world was chosen as laboratory. The
experiment setting placed the participants in a realistic top manager position, equipped
with all the power they needed to execute a potentially successful strategy.
In the actual business environment, the users of a BSC are members of an organization.
The individuals with “strategic” power and able to implement a strategy in an
organization are the top managers. They receive and process the information provided
by a scorecard; based on this information, they decide on measures and provide
direction. To be realistic, participants in the experiment therefore had to act as top
managers. They were given a virtual 10-year contract for the position as managing
director of a recently founded mortgage brokerage business called eHypo. In their role
as top manager of the business unit, their main task was to successfully implement
eHypo’s ambitious growth strategy. eHypo’s business concept, the long-term strategic
targets and the means of intervention were set by the capital owners. This information
and the business environment were described in detail in a 8-page case-study. The
participants' first task was to carefully read the essay and absorb as much information as
possible.
They were to learn that eHypo’s strategic goal was to grow sales revenue from 1 Million
€ to 160 Million € within a ten year time-frame, while maintaining profitability
throughout the period. Return on sales (ROS) was to be greater or equal to 20 % per
annum, and eHypo’s market share in the mortgage brockerage business should grow to
20 to 25 %. The essay included the eHypo strategy paper that discussed 12 strategic
issues, which were regarded as important for successfully implementing the growth

15
strategy. It also contained Figure 3 showing causal links between the 12 strategic issues,
providing the reader with something close to a strategy map (Kaplan & Norton, 2004a).
Customer
satisfaction
Outstanding
profitability
Brand awareness
Price levelMarketingOperational
excellenceService quality
Employee know
how
Business concept
& technologyStaff recruitment
Multiplication of
enterprise value
Growth of sales
revenues
Figure 3: eHypo’s strategy map
At the heart the growth strategy described in the essay laid the accumulation of eHypo’s
key resources staff, technology, employee know how and brand awareness. This growth
process should be initiated and maintained without jeopardizing service quality and
customer satisfaction for avoiding the trap of the growth and underinvestment archetype
(Senge, 1990). eHypo was described to prefer a differentiation strategy over a cost
leadership strategy. High service quality guaranteed by well trained employees and up-
to-date technology should provide the possibility of escaping sole price competition.
Logically consistent, for the price strategy the sustainment of a medium to high price
level – compared to competitive mortgage brokers – was set.
To be even more precise, each of the twelve strategic issues was operationalized by one
to three measures. Those measures were considered to be appropriate for quantifying the

16
success of strategy implementation. Additionally, for all measures internally consistent
long-term goals, which also had been attuned to eHypo’s strategic 10-year objectives,
were given.
The eHypo case-study was handed out to the participants one week before the
experiment. It was the only input given in advance. The experiment was conducted as a
computer aided simulation experiment, following similar research conducted by Dörner
et al. (1994), Ackerman, Kanfer and Goff (1995), Wittmann, Süss and Oberauer (1995)
or Größler (2000). A simulator specifically developed for the eHypo case was used. By
design, the case study description and the strategy map reflected the causal relationships
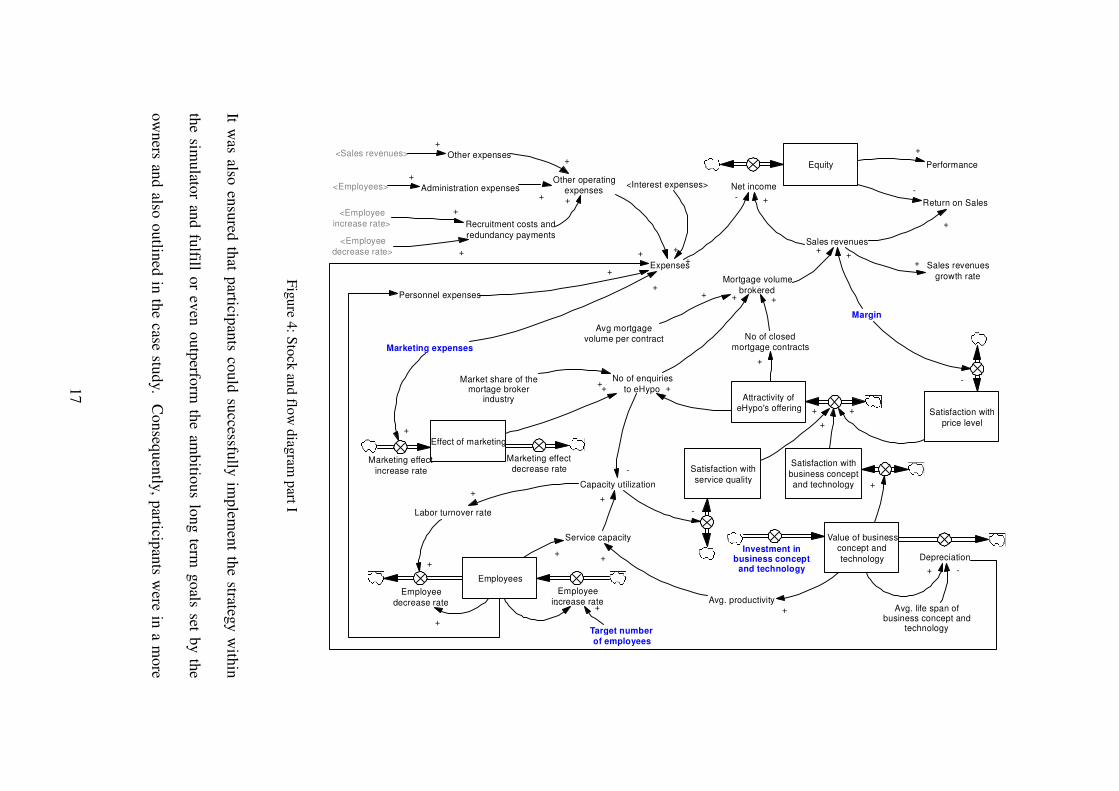
modeled in the micro-world. Figure 4 and Figure 5 provide a somewhat aggregated
picture of the stock and flow structure of the eHypo simulator’s system dynamics
market and business model.
17
Equity
Net income
Sales revenues
Expenses
+-Return on Sales
+
-
Sales revenues
growth rate
+
Performance
+
Margin
+
Mortgage volume
brokered
+
Attractivity ofeHypo's offering
-
Satisfaction with
business conceptand technology
Avg mortgagevolume per contract
+
Capacity utilization
No of enquiries
to eHypo
Service capacity
-
+
Satisfaction with
service quality
Satisfaction with
price level
-
+
+
+
Value of businessconcept and
technology DepreciationInvestment in
business conceptand technology
+
Effect of marketing
Marketing effect
increase rate
Marketing effectdecrease rate
Marketing expenses
+
+
Employees
Target numberof employees
Employeeincrease rate
Employee
decrease rate+-
Labor turnover rate
+
+
Avg. productivity
++
+
+
No of closedmortgage contracts
+
+
+
+
Market share of themortage broker
industry
+
Personnel expenses
Other operatingexpenses
+
+
+
Avg. life span ofbusiness concept and
technology
-+
+
<Employees>
<Employee
increase rate>
<Employee
decrease rate>
Administration expenses
Other expenses
Recruitment costs and
redundancy payments
+
+
+
+
+ +
<Sales revenues>+
<Interest expenses>
+
Fig
ure 4
: Sto
ck an
d flo
w d
iagram
part I
It was also
ensu
red th
at particip
ants co
uld
successfu
lly im
plem
ent th
e strategy w
ithin
the sim
ulato
r and
fulfill o
r even
ou
tperfo
rm th
e amb
itiou
s lon
g term
go
als set by th
e
ow
ners an
d also
ou
tlined
in th
e case stud
y. C
on
sequ
ently
, particip
ants w
ere in a m
ore
18
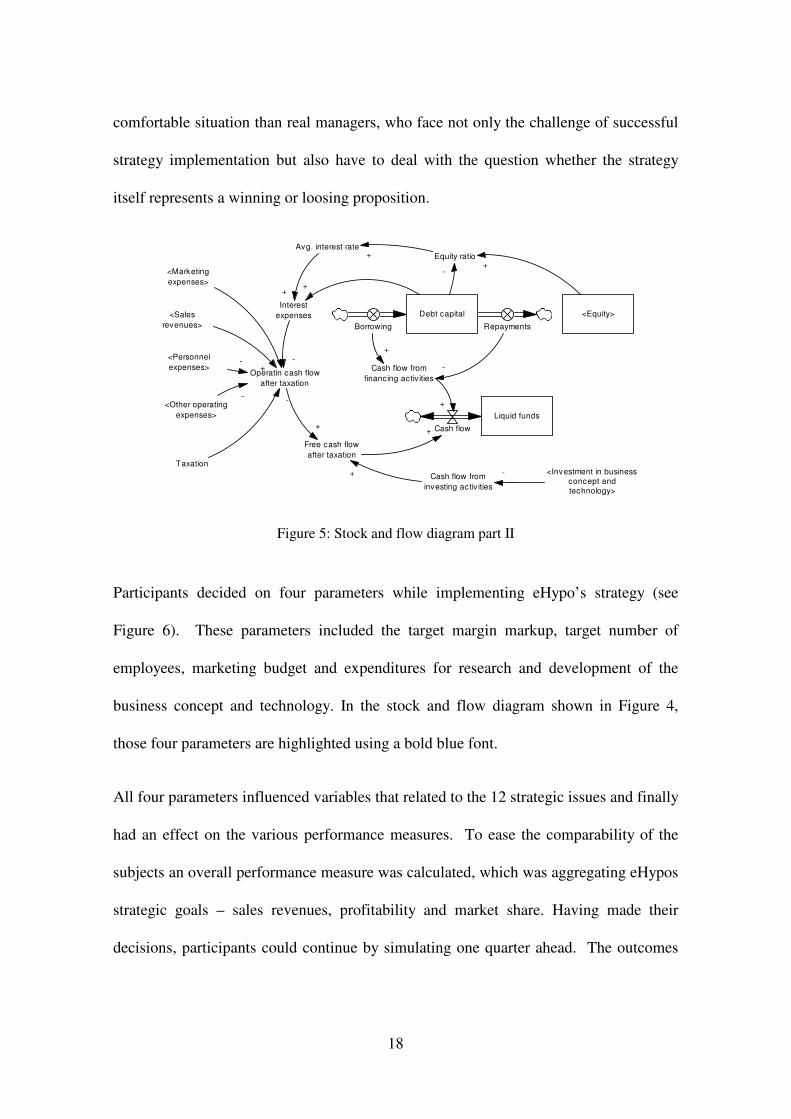
comfortable situation than real managers, who face not only the challenge of successful
strategy implementation but also have to deal with the question whether the strategy
itself represents a winning or loosing proposition.
Debt capital
Borrowing Repayments
Liquid funds
Cash flow
Operatin cash flow
after taxation
Cash flow from
investing activ ities
Free cash flow
after taxation
+
Cash flow from
financing activ ities
+
+
+
-
<Personnel
expenses>
<Other operating
expenses>
Interest
expenses
Taxation
--
- -
<Sales
revenues>
+
Avg. interest rate
++
<Investment in business
concept and
technology>
-
<Equity>
Equity ratio+
-
+
+
<Marketing
expenses>
Figure 5: Stock and flow diagram part II
Participants decided on four parameters while implementing eHypo’s strategy (see
Figure 6). These parameters included the target margin markup, target number of
employees, marketing budget and expenditures for research and development of the
business concept and technology. In the stock and flow diagram shown in Figure 4,
those four parameters are highlighted using a bold blue font.
All four parameters influenced variables that related to the 12 strategic issues and finally
had an effect on the various performance measures. To ease the comparability of the
subjects an overall performance measure was calculated, which was aggregating eHypos
strategic goals – sales revenues, profitability and market share. Having made their
decisions, participants could continue by simulating one quarter ahead. The outcomes
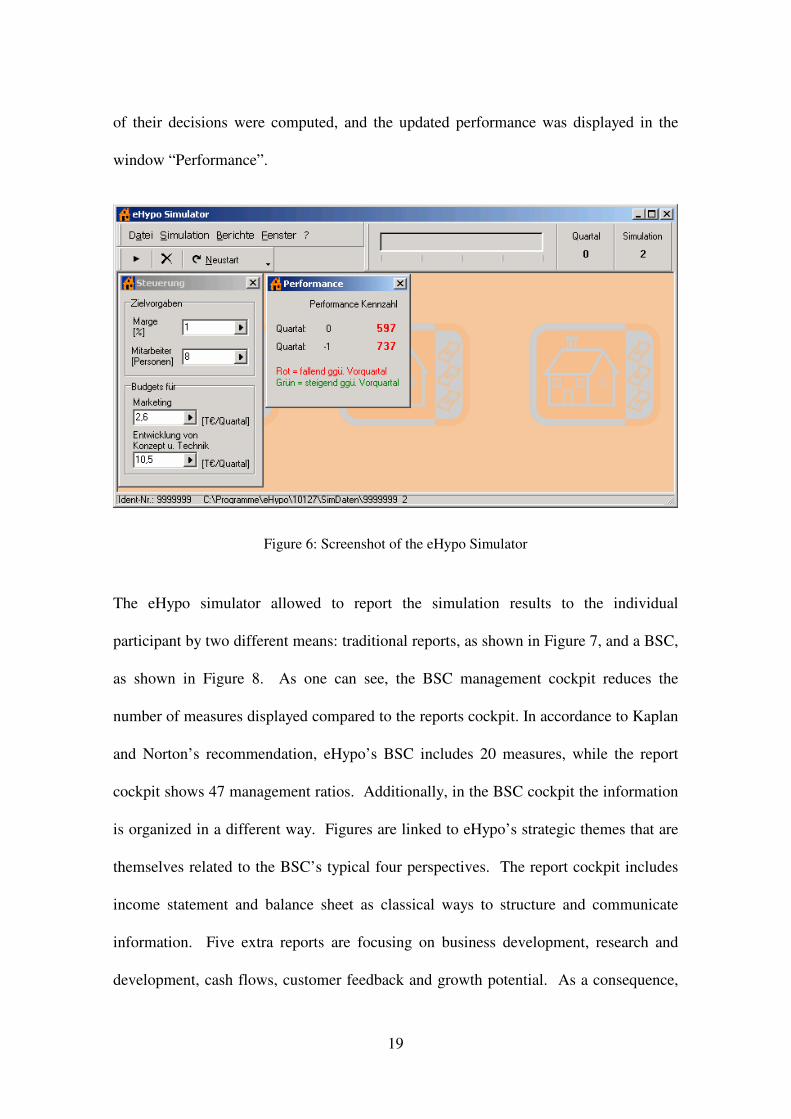
19
of their decisions were computed, and the updated performance was displayed in the
window “Performance”.
Figure 6: Screenshot of the eHypo Simulator
The eHypo simulator allowed to report the simulation results to the individual
participant by two different means: traditional reports, as shown in Figure 7, and a BSC,
as shown in Figure 8. As one can see, the BSC management cockpit reduces the
number of measures displayed compared to the reports cockpit. In accordance to Kaplan
and Norton’s recommendation, eHypo’s BSC includes 20 measures, while the report
cockpit shows 47 management ratios. Additionally, in the BSC cockpit the information
is organized in a different way. Figures are linked to eHypo’s strategic themes that are
themselves related to the BSC’s typical four perspectives. The report cockpit includes
income statement and balance sheet as classical ways to structure and communicate
information. Five extra reports are focusing on business development, research and
development, cash flows, customer feedback and growth potential. As a consequence,
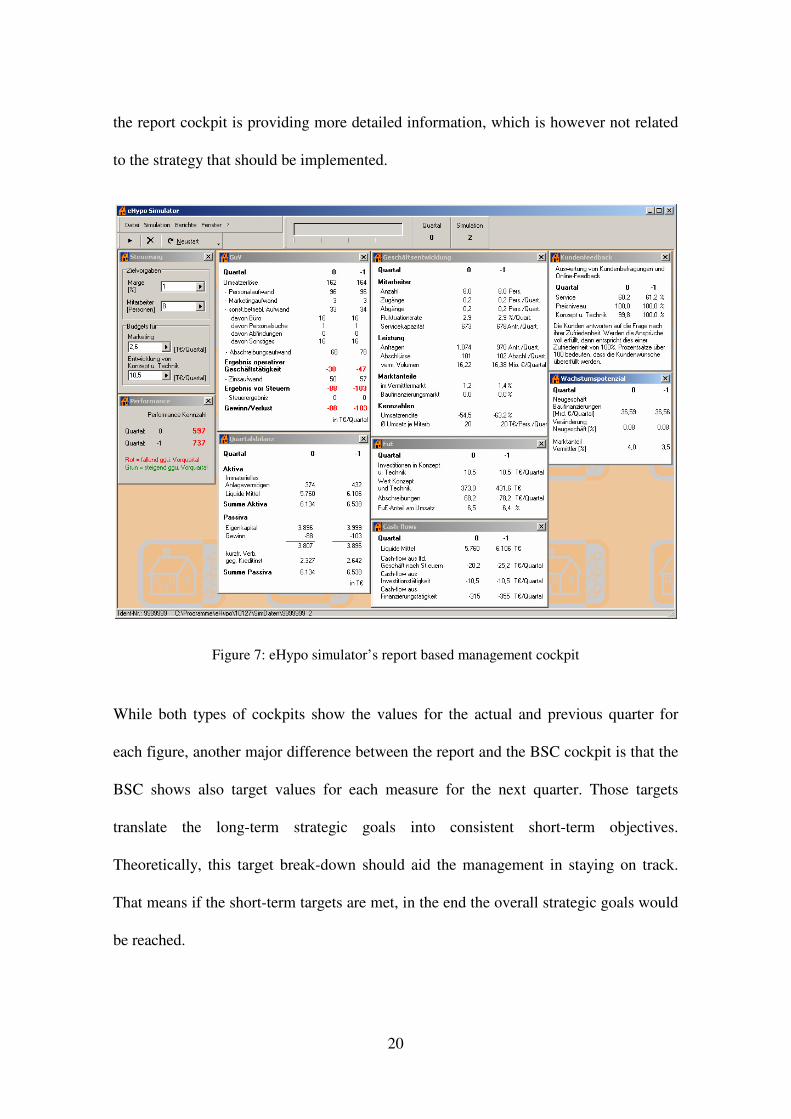
20
the report cockpit is providing more detailed information, which is however not related
to the strategy that should be implemented.
Figure 7: eHypo simulator’s report based management cockpit
While both types of cockpits show the values for the actual and previous quarter for
each figure, another major difference between the report and the BSC cockpit is that the
BSC shows also target values for each measure for the next quarter. Those targets
translate the long-term strategic goals into consistent short-term objectives.
Theoretically, this target break-down should aid the management in staying on track.
That means if the short-term targets are met, in the end the overall strategic goals would
be reached.

21
Figure 8: eHypo simulator’s BSC management cockpit
In the experimental laboratory, participants were divided by chance into two groups: the
program group had only access to the BSC report and did not have the traditional form
available; the control group was equipped with simulators that only showed the
traditional reports. Thus, this research setting operationalized H1 as follows:
H11: Participants in the laboratory experiment using a BSC as management and
controlling cockpit will perform better than participants using traditional reports
as management and controlling cockpit.
This operationalization permitted investigation of only a set of means how the BSC can
influence organizational performance. Other benefits of the BSC stated by Kaplan and

22
Norton (1996b, p. 73), such as performance improvement through better strategy
alignment, were deliberately excluded by the chosen research design.
Participants in both groups were given the same time frame: 90 minutes for doing their
best in implementing eHypo’s strategy, namely to maximize the aggregated performance
measure. In case of failure, which meant having a performance of less than zero, they
would virtually be laid off. The simulation was stopped. However, participants were
allowed to restart the simulation up to six times. This seemed to be a reasonable high
number of simulations to avoid failures, which were solely or mainly attributable to
faulty operation of the simulator software. On the other hand, the maximum of six
simulations narrowed the risk that the video game syndrome would distort the data
ascertainment. The number of simulation runs and the duration of each simulation were
recorded together with all other results in the simulation data file. Upon completion of
the time span, the data files with the simulation results were collected so that the
relevant data could be extracted.
Between November 2005 and January 2007 a total of ten experiments were performed,
each involving 13 to 29 participants. They were conducted with students in their final
semester in the Bachelor of Business Administration program and with students in the
second semester in the Bachelor of Science program at Frankfurt School of Finance &
Management. All experiments were integrated in the course “Controlling”. The last but
one lecture was for the experiment. Since top managers, responsible for strategy
implementation using the BSC, typically have attended university, Bortz and Döring's
(2002) reservations about students as subjects are not applicable for the purpose of this
study.

23
As the true experimental design requires, participants were assigned to the experiment
group and the control group by chance. As this was done some time before the
experiments and as not all students did show up due to illness or other excuses, the
allocation of the subjects to the treatment and control groups were not perfectly equal
(see Table 1). In the end, 119 students were assigned a BSC and 126 participants used
reports.
Date of
Experiment Treatment
No. of
subjects Sum
2005-11-29 Reports 12
BSC 12 24
2005-12-08 Reports 12
BSC 16 28
2005-12-09 Reports 11
BSC 13 24
2006-01-05 Reports 10
BSC 11 21
2006-06-13 Reports 17
BSC 11 28
2006-06-14 Reports 17
BSC 12 29
2006-06-22 Reports 16
BSC 13 29
2006-06-26 Reports 16
BSC 12 28
2006-12-18 Reports 10
BSC 11 21
2007-01-05 Reports 5BSC 8 13
Total 245
Table 1: Number and allocation of participants
To incentivize the participants a small impact of the simulation performance on the
course grade was established. The top third of the students in both the treatment and the
control group for example could achieve three performance points; the medium third
was assigned two performance points and the remaining third was given one point.
With a total of 60 performance points for the course, the simulation experiment counted

24
for up to 5 % of the total points. Besides this, the students were told that they would
benefit in their preparations for the written exam from the experience gained through the
simulation exercise.
Although the simulator software was password protected and allowed access to the user
interface on the experiment day only to minimize the risk of uncontrolled learning,
information exchange between participants of different experiments could not
completely be prohibited. To exclude distortions caused by such information diffusion
from the analysis, the performance measure was standardized. Therefore, the
standardization procedure was applied to each of the ten experiments separately.
4 Results from the laboratory experiments
The subjects' performance in the simulation experiment was measured on an interval
scale with a single figure (SimP), which aggregates eHypos key performance indicators
sales revenue, return on sales and market share. Since the subjects had the possibility to
perform up to six simulations, only the best run out of those six ones was chosen.
Cancelled simulations and runs that ended with a layoff were valued zero.
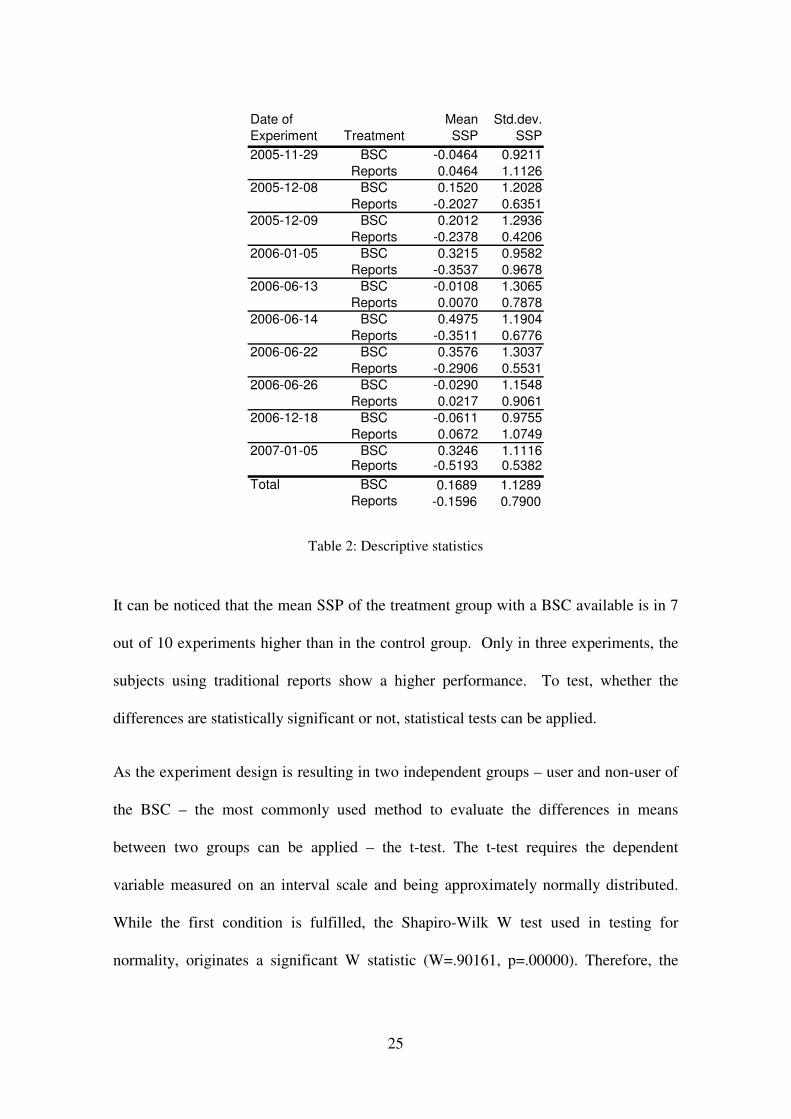
Standardization of SimP resulted in the standardized simulation performance measure
(SSP), whose mean value and standard deviation is provided in Table 2 on an
experiment-by-experiment basis.
25
Date of
Experiment Treatment
Mean
SSP
Std.dev.
SSP
2005-11-29 BSC -0.0464 0.9211
Reports 0.0464 1.1126
2005-12-08 BSC 0.1520 1.2028
Reports -0.2027 0.6351
2005-12-09 BSC 0.2012 1.2936
Reports -0.2378 0.4206
2006-01-05 BSC 0.3215 0.9582
Reports -0.3537 0.9678
2006-06-13 BSC -0.0108 1.3065
Reports 0.0070 0.7878
2006-06-14 BSC 0.4975 1.1904
Reports -0.3511 0.6776
2006-06-22 BSC 0.3576 1.3037
Reports -0.2906 0.5531
2006-06-26 BSC -0.0290 1.1548
Reports 0.0217 0.9061
2006-12-18 BSC -0.0611 0.9755
Reports 0.0672 1.0749
2007-01-05 BSC 0.3246 1.1116Reports -0.5193 0.5382
Total BSC 0.1689 1.1289Reports -0.1596 0.7900
Table 2: Descriptive statistics
It can be noticed that the mean SSP of the treatment group with a BSC available is in 7
out of 10 experiments higher than in the control group. Only in three experiments, the
subjects using traditional reports show a higher performance. To test, whether the
differences are statistically significant or not, statistical tests can be applied.
As the experiment design is resulting in two independent groups – user and non-user of
the BSC – the most commonly used method to evaluate the differences in means
between two groups can be applied – the t-test. The t-test requires the dependent
variable measured on an interval scale and being approximately normally distributed.
While the first condition is fulfilled, the Shapiro-Wilk W test used in testing for
normality, originates a significant W statistic (W=.90161, p=.00000). Therefore, the

26
hypothesis that the distribution is normal should be rejected. Research has shown,
though, that the t-test is fairly "robust" to violations of its assumptions (see Bortz, 1999
for a summary). Nevertheless, the t-test statistics shown in Figure 9 have to be
interpreted with care.
BSC Reports-0.4
-0.3
-0.2
-0.1
0.0
0.1
0.2
0.3
0.4
0.5
SS
P
t-value: 2.650752
df: 243
p: 0.008559
F-ratio
variances: 2.041656
p variances: 0.000097
Conf. intervals (95.00%)
Figure 9: Plot of mean values and t-test results
Based on the t-test, the hypothesis that there is no difference between the standardized
performance of the BSC users and the report users is clearly rejected. Both the
differences in the mean values and the variances are highly significant. As a
consequence, one can assume that H11, which postulates a superior performance of BSC
users compared to non-users, is strengthened.
Additionally, two nonparametric tests were performed – the Kolmogorov-Smirnov two-
sample test and the Mann-Whitney U test. Those two tests do not rely on the assumption
that SSP is normally distributed. The Kolmogorov-Smirnov two-sample test is a test of
the significant difference between the cumulative distributions two data samples. A p-
level of smaller than 0.025 indicates that the difference between BSC users and non-
users in simulation performance in this study is significant. As another nonparametric
alternative to the t-test, the Mann-Whitney U test is computed based on rank sums rather

27
than means. With rank sums of 15549 for the BSC group and 14586 for the reports
group, a U-value of 6585, a Z of 1.644974 and a p-level of 0.099976, the test indicates a
difference only on the less satisfactory, but still acceptable 0.1 level.
5 Limitations
There are several limitations to this study. First, participants had no expert knowledge
of the mortgage brokerage industry, and they had practical experience with the BSC
only by chance. However, since the BSC concept was presented and discussed in class
before the experiments, subjects were familiar with the theory. Second, participants
did not face the same incentives as managers usually responsible for implementing the
business strategy. Third, the informal information channels that exist in real companies
were deliberately excluded from the experiment design. Forth, compared to reality, the
complexity of the strategy implementation task was reduced, while time pressure was
much increased. Fifth, although the number of participants involved in the study was
sufficient for the application of most of the statistical analysis and exceeded the number
of subjects in similar designs (e.g. Lipe and Salterio, 2000, p. 290), the sample could be
larger. Sixth, some of the assumptions of the t-test method were violated – for example,
the prerequisite of normal distributed values for the dependent variable SSP was not
fulfilled. A possible reason for this could be the sample size.
6 Conclusions
Testing BSC’s built-in theory about its impact on organizational performance is of high
theoretical and practical interest. Testing this hypotheses system with a true field

28
experiment is, however, for various reasons impossible. Field studies or quasi-field
experiments are one resort. However, to obtain reliable results one has to expend
significant efforts on the research design and its implementation. Still, the problem
remains that not all the possible factors influencing performance can be controlled.
Therefore, this study made use of a true laboratory experiment. The experiment could
be given high external validity due to a realistic case study, a computer simulated micro-
world and a carefully designed research process. Internal validity can be ensured by the
random assignment of subjects to the treatment group and control group.
Statistical analysis of the experiment data indicates that the impact of using a BSC
management and controlling cockpit on performance is positive indeed. Mean
performance differences between the treatment group equipped with the BSC and the
control group relying on reports are statistically significant both when using the
parametric t-test and when applying the nonparametric Kolmogorov-Smirnov two-
sample test and the Mann-Whitney U test
The findings in this study underpin anecdotal BSC success stories, which are widely
reported in publications (e.g. Kaplan and Norton, (2001, pp. 60–62). They are also in
line with the conclusions drawn by Davis and Albright (2004, pp. 150–152), who
investigated the same research question but used a quasi-experiment as research
method. However, the findings of the laboratory experiments are in contradiction to the
results of the studies by Lipe and Salterio (2000) and Roberts, Albright and Hibbets
(2004). These question the BSC’s usefulness.

29
Since this study did not test the whole range of ways in which the BSC can impact
organizational performance, it would be unwise to jump to the conclusion that the BSC
is always helpful. There might be other causal effects, which could neutralize ore even
reverse the positive findings of this study. On the other hand it is not unlikely that the
other ways the BSC can influence organizational performance, which were not
investigated in this study, would even amplify the BSC’s positive impact. For example,
it is very plausible that a well designed BSC has a strong and positive effect on strategy
communication throughout an organization or facilitates strategy evaluation, thus
resulting in improved performance.
7 References
Ackerman, P. Lawrence, Kanfer, R., & Goff, M. (1995). Cognitive and Non-Cognitive
Determinants and Consequences of Complex Skill Acquisition. Journal of
Experimental Psychology: Applied, Vol. 1, 270–304
Anderson, E. W., Fornell, C., & Lehmann, D. R. (1994). Customer Satisfaction, Market
Share, and Profitability Findings From Sweden. Journal of Marketing, Vol. 58(No.
3), 53–67
Anderson, E. W., Fornell, C., & Rust, R. T. (1997). Customer Satisfaction, Productivity,
and Profitability: Differences Between Goods and Services. Marketing Science, Vol.
16, 129–147
Atkinson, A. C., Balakrishnan, R., Booth, P., Cote, J. M., Groot, T., & Malmi, T., et al.
(1997). New Directions in Management Accounting Research. Journal of
Management Accounting Research, Vol. 9, 79–108
Banker, R., Potter, G., & Srinivasan, D. (2000). An Empirical Investigation of an
Incentive that Includes Nonfinancial Performance Measures. The Accounting Review,
Vol. 75, 65–92
Bortz, J. (1999). Statistik für Sozialwissenschaftler: Mit 247 Tabellen (5th ed). Berlin et
al.: Springer.
Bortz, J., & Döring, N. (2002). Forschungsmethoden und Evaluation: Für Human- und
Sozialwissenschaftler ; mit 70 Tabellen (3., überarb. Aufl.). Berlin et al.: Springer.
Bryant, L., Jones, D. A., & Widener, S. K. (2004). Managing Value Creation within the
Firm: An Examination of Multiple Performance Measures. Journal of Management
Accounting Research, 16, 107–131
Buckmaster, N. (2002). The Performance Measurement Panacea. Accounting Forum,
Vol. 24, 264–278

30
Davis, S., & Albright, T. L. (2004). An Investigation of the Effect of Balanced
Scorecard Implementation on Financial Performance. Management Accounting
Research, Vol. 15, 145–153
Dörner, D., Kreuzig, H. W., Reither, F., & Stäudel, T. (Eds.). (1994). Lohhausen: vom
Umgang mit Unbestimmtheit und Komplexität (1983 Reprint). Bern et al.: Huber.
Gilles, M. (2002). Balanced Scorecard als Konzept zur strategischen Steuerung von
Unternehmen. Frankfurt am Main et al.: Lang.
Graziano, A. M., & Raulin, M. L. (2004). Research Methods: A Process of Inquiry (5th
ed.). Boston, Mass.: Allyn and Bacon.
Größler, A. (2000). Entwicklungsprozeß und Evaluation von Unternehmenssimulatoren
für lernende Unternehmen. Frankfurt am Main et al.: Lang.
Hoque, Z., & James, W. (2000). Linking Balanced Scorecard Measures to Size and
Market Factors: Impact on Organizational Performance. Journal of Management
Accounting Research, Vol. 12, 1–17
Horvath & Partners Management Consultants. (2004). 100 x Balanced Scorecard:
Ergebnisbericht. Stuttgart.
Ittner, C. D., & Larcker, D. F. (1998b). Are Nonfinancial Measures Leading Indicators
of Financial Performance?: An Analysis of Customer Satisfaction. Journal of
Accounting Research, Vol. 36(Supplement), 1–36
Ittner, C. D., & Larcker, D. F. (1998a). Innovations in Performance Measurement:
Trends and Research Implications. Journal of Management Accounting Research,
Vol. 10, 205–239
Kaplan, R. S., & Norton, D. P. (1992). The Balanced Scorecard – Measures that Drive
Performance. Harvard Business Review, Vol. 70, 71–79
Kaplan, R. S., & Norton, D. P. (1996a). The Balanced Scorecard: Translating Strategy
into Action. Boston, Mass.: Harvard Business School Press.
Kaplan, R. S., & Norton, D. P. (1996b). Using the Balanced Scorecard as a Strategic
Management System. Harvard Business Review, Vol. 74, 75–85
Kaplan, R. S., & Norton, D. P. (2001). The Strategy-focused Organization: How
Balanced Scorecard Companies Thrive in the New Business Environment. Boston,
Mass.: Harvard Business School Press.
Kaplan, R. S., & Norton, D. P. (2004b). How Strategy Maps Frame an Organization's
Objectives. Financial Executive, 20, 40–46
Kaplan, R. S., & Norton, D. P. (2004a). Strategy Maps: Converting Intangible Assets
into Tangible Outcomes. Boston, Mass.: Harvard Business School Press.
Lipe, M. G., & Salterio, S. E. (2000). The Balanced Scorecard: Judgmental Effects of
Common and Unique Performance Measures. Accounting Review, Vol. 75, 283–299
Maiga, A. S., & Jacobs, F. A. (2003). Balanced Scorecard, Activity-Based Costing and
Company Performance: An Empirical Analysis. Journal of Managerial Issues, Vol.
15, 283–302
PWC Deutsche Revision. (2001). Die Balanced Scorecard im Praxistest: Wie zufrieden
sind die Anwender? Frankfurt am Main.

31
Rigby, D. (2001). Management Tools and Techniques: A Survey. California
Management Review, Vol. 43, 139–160
Roberts, M. L., Albright, T. L., & Hibbets, A. R. (2004). Debiasing Balanced Scorecard
Evaluations. Behavioral Research in Accounting, Vol. 16, 75–89
Senge, P. M. (1990). The Fifth Discipline: The Art and Practice of the Learning
Organization. New York: Currency Doubleday.
Sim, K. L., & Koh, H. C. (2001). Balanced Scorecard: A Rising Trend in Strategic
Performance Measurement. Measuring Business Excellence, Vol. 5, 18–28
Speckbacher, G., Bischof, J., & Pfeiffer, T. (2001). A Descriptive Analysis on the
Implementation of Balanced Scorecards in German-speaking Countries. Management
Accounting Research, Vol. 14, 361–389
Sterman, J. D. (1989). Modeling Managerial Behavior: Misperceptions of Feedback in a
Dynamic Decision Making Experiment. Management Science, 35(3), 321–339
Strohhecker, J. (2004). Simulation Based Experiments for Testing the Balanced
Scorecard’s Built-in Performance Improvement Theory. In System Dynamics Society
(Ed.), Proceedings of the 22th International Conference of the System Dynamics
Society. Oxford.
Trochim, W. M. K. (2001). Research Methods Knowledge Base (2nd ed.). Cincinnati:
Atomic Dog.
Wittmann, W., Süss, H.-M., Oberauer, K., Schulze, R., & Wilhelm, O. (1995). Der
Zusammenhang von Arbeitsgedächniskapazität und Konstrukten der
Intelligenzstrukturforschung: Berichte des Lehrstuhls Psychologie II. Universität
Mannheim.