^^bs^ m - irc · pdf file^^bs^ m w®tt ^hmmtmm m^^m finnconsult ... rws rural water supply...
TRANSCRIPT
• / " • •
824 NAQM94
A.**" NAMIBIA
Ministry of Agriculture Waterand Rural Development
Directorate of Rural WaterSupply (DRWS)
THE REPUBLIC OF FINLAND
Ministry for Foreign Affairs
Finnish International DevelopmentAgency (FINNIDA)
WATER SUPPLY AND SANITATION PROJECT IN OHANGWENA REGION1
^^BS^ Mw®tt ^hmmtmm m^^m
FINNCONSULTProject No: 28103701-6
1b*wsdevpl.n94
ft.
Page
TABLE OF CONTENTS i
ABBREVIATIONS iii
1 BACKGROUND INFORMATION 11.1 Physical Characteristics 11.2 Socio-Economic Development 21.3 Assessment of Planning Situation 62 WATER RESOURCES 62.1 Surface Water Resources 62.2 Shallow Water Resources 72.3 Deep Ground water Resources 7
3 EXISTING WATER SUPPLY SITUATION 83.1 Bulk Water Supply System 83.2 Rural Point Water Supply System 93.1.1 Unprotected Water Points 93.1.2 Protected Water Points 93.3 Water Supply Coverage in the Planning area 93.3.1 Pipe Water Supply Coverage 93.3.2 Point Water Supply Coverage 10
4 WATER DEMAND 10
5 WATER SUPPLY OPTIONS 115.1 Water Resource Options 115.2 Technology Options 125.2.1 Bulk Water Supply 125.2.2 Rural Pipe Water Supply 135.2.3 Point Water Supply with Hand Pump 135.2.4 Point Water Supply With Windlass 135.2.5 Roof Catchment 145.2.6 Dam 145.2.7 Other Methods 145.3 Costs 145.4 Technology Choice 15
6 PLANNING CRITERIAS 166.1 General 166.2 Planning Horizon 166.3 Consumer to be Served 176.4 Service Level 176.5 Water Quality 176.6 Selection of Technology 176.7 Social and Cultural Aspects 176.8 Institutional Aspects 186.9 Financial Aspects 186.10 Priority Criterias 186.11 Environmental Aspects ; 18
PLANNING GUIDELINES 19
8 DEVELOPMENT PLAN8.1 General8.2 Institution Building and Human Resources Development8.3 Development Programme8.4 Financing of the Development Plan
9 CONCLUSIONS AND RECOMMENDATIONS
PICTURES
Picture 1Picture 2Picture 3Picture 4Picture 5Picture 6
TABLES
Table 1Table 2Table 3Table 4Table 5Table 6
ANNEXES
Annex 1Annex 2
Administrative boundariesSimplified population densitySchematic lay-put of the Herringbone systemWater resource optionsTechnology optionsEffect of the tariff the unit price of water
School data, 1993Livestock norms and dataPresent and future water demand, Scenario 1Present and future water demand, Scenario 2Unit costs of the water supply developmentThe cost breakdown of the total costs ofthe proposed development programme
1919202122
22
248111216
35101115
21
2/2 Population forecast 1993 - 20055/5 Water supply coverage, Water demand calculations and Implementationprogrammes for 1993' 1995 as well as Development options I and II
o.
iii
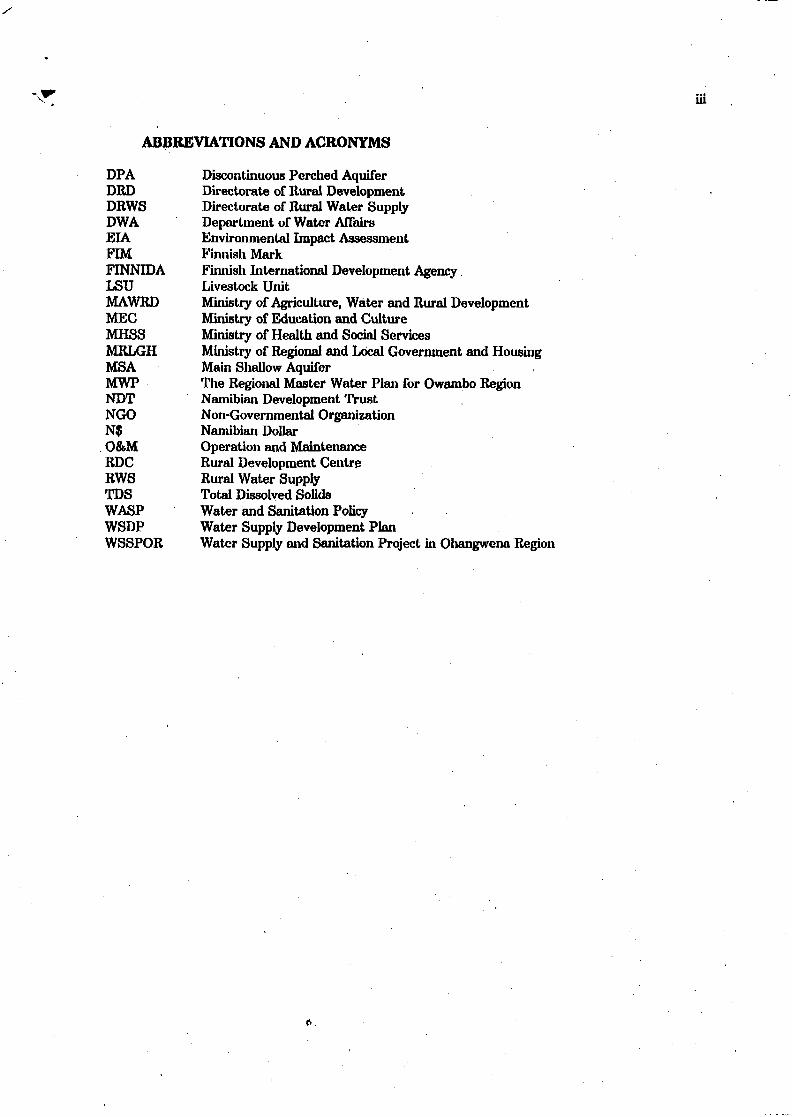
ABBREVIATIONS AND ACRONYMS
DPA Discontinuous Perched AquiferDRD Directorate of Rural DevelopmentDRWS Directorate of Rural Water SupplyDWA Department of Water AffairsEIA Environmental Impact AssessmentFIM Finnish MarkFINNIDA Finnish International Development Agency.LSU Livestock UnitMAWRD Ministry of Agriculture, Water and Rural DevelopmentMEC Ministry of Education and CultureMHSS Ministry of Health and Social ServicesMRLGH Ministry of Regional and Local Government and HousingMSA Main Shallow AquiferMWP The Regional Master Water Plan for Owambo RegionNDT Namibian Development TrustNGO Non-Governmental OrganizationN$ Namibian DollarO&M Operation and MaintenanceRDC Rural Development CentreRWS Rural Water SupplyTDS Total Dissolved SolidsWASP Water and Sanitation PolicyWSDP Water Supply Development PlanWSSPOR Water Supply and Sanitation Project in Ohangwena Region
1 BACKGROUND INFORMATION
1.1 Physical Characteristics
Ohangwena Region lies in the north-central part of former Owambo, which is situated in themost northern part of Namibia. The topography of the region is characterized by an extremelyflat plain, which forms part of the larger Etosha Depression, and gradually slopes as a shallowtrough from north to south towards the Etosha Pan. The common parent material of thealluvial plain in the region is a remarkably uniform, relatively unweathered, medium-texturedsand. It can generally be stated that grey sands cover the whole of the eastern area, while redand brown sands are characteristic in the gentle relief of the western area of Owanibo.Twothirds of the Project Area is covered with aeolian sands. Solonetz soils occur in the remainingtliird as a broad north - south striking strip in the central part of the area. The MixedWoodland areas, associated with aeolian sands, are located in the whole area. Vaalboom andwild seringa are the main species. The grass cover is moderate, but in the eastern area thegrass tends to be less palatable than elsewhere. To a large extent this area has been denudedof vegetation, except for fruit trees, due to the use of timber for palisades andfirewood.overgrazing and the clearing of land for cultivation.The grass cover is moderate,consisting of various perennial and annual grasses.
The main feature of the drainage system is the Cuvelai Delta in central Owambo,The seasonalflood in the Cuvelai, the efundja, does not always cross the Namibian border and only veryrarely reaches the Etosha Pan. Owambo experiences seasonal rainfall in the summer monthsbetween October and April. More than 70% of the rainfall occurs between January and March.The planning area receives the range of 440 mm to 510 mm for rainfall, and 2725 mm forevaporation.
October and November are the hottest months, with the average daily maximum temperaturein October being 35.5°. Winter days are mild, but cold at night, average dairy minimumtemperature being 6°. Strong winds are rare, but may occur before and during thunderstorms.
The successive layers of sand sandy clay sandstones and conglomerates of Kalahari Group areup to 500 m thick and the planning area is underlain by this sediment. Only 2 of the majorgroundwater areas occur within the area, namely the Brine lake and Eastern areas. Potablegroundwater reserves are hosted by deep aquifers in the eastern area and as shallow aquifersin the brine lake area. The underground Brine Lake occurs in the centrally located CuvelaiBasin. The groundwater of the deeper, regional aquifer was found to be unsuitable forconsumption due to very high concentrations of total dissolved solids. The concentrations mayvary between 3,000 mg/1 and 33,000 mg/1.
It is estimated that on average 83% of the total rainfall evaporates shortly after precipitation,while 17% is available as surface run off, of which 1% recharges groundwater resources and14% is lost through evapotranspiration. Since the eastern areas of the Project Area are coveredby loose Kalahari sands and with hardly any surface run off channels, infiltration should begood.

1.2 Socio-Economic Development
Administratively Ohangwena Region is divided into 10 constituencies. The Planning area andthe administrative boundaries are shown in Picture 1. The unit around which the social andeconomic life is organised is the egumbo (household or homestead). An egumbo is headed bya mwene gwegumbo (household head) who can be a male or a female. The average householdsize varies between seven and eight people. Each egumbo is surrounded by cultivated land. Agroup of egumbos - in some cases more than fifty - form an umukunda.
Picture 1: Administrative boundaries
\ ' Hoot i ^ t-p--sg-r^pn-*"*-" y \ ij\/__ ^_ j5fSt ) I \ £ * s t / ' * Eenlmna North \:..Enrfrf. Bndola \ |0nd°J»e\oHANGWENA / /
«__#. •» JT=O^ \ •I 5outA V 7 />
A N G O L A
North I Ondobe North
OHsouth K
^ ' in Tarred Rodv.
I ' y — . sub-ConfltiLu«iiey
OSHIKOT^)Ondangw9 f
Historically the Ohangwena Region had a strong hierarchical system so a chief/king and seniorand junior omalengas (headmen) who were concerned with community matters. The 1992Regional elections which put into place a Regional Governor and Councillors representing thevarious Constituencies in the region was fought along party political lines. The Regional Councilis in charge of the day-to-day administration and development of the region but it is notsupposed to replace the system of chiefs and headmen. It is clear that the importance of thechief and the headmen as non-party political figures has been recognised but their future rolesand positions are still not clearly defined.Women of the Region are responsible for householdchores and child care. In this area the high incidence of absent males puts an additional burdenon them in terms of decision making and labour. The 1994 study of NDT indicates that femaleheaded households remain economically worse off than male headed households.Communitygroupings in Ohangwena are mainly related to church activities and participation in women'sgroup activities is very low.
In Ohangwena, like in other rural communities, only a small percentage of the populationattend school beyond standard 6 (grade 8). The figure quoted for Ohangwena is 20%. Thismeans that even traditional leaders and heads of household are often under-educated and semior illiterate.The health situation in the Ohangwena region is characterized by problems occurring due tointer alia low standards of living, lack of education, unavailability of health information, andthe shortage of primary health care services and facilities. Malnutrition in the area is above

the national average, with over 30 % of pre-school children suffering from moderate or severeundernutrition.Some of the major local health problems, such as malaria, diarrhoea, dysentery, and othercommunicable diseases, are closer/ related to water and sanitation issues, and their occurrencefollows a distinct seasonal cycle. The incidence of diarrhoea, for example, increases with salinityand contamination of water sources, especially towards the end of the dry season, whereas thenumber of malaria cases rises in the late part of the wet season.
The precise standing of communal land in terms of ownership and land rights, and the complexrole of tribal leaders in the allocation of land have not yet been clearly defined. At present theright to use arable land is obtained through the head of the household making a payment tothe headman or chief. When the head of household dies there is no automatic right ofinheritance, and continued occupation normally depends on future payment.
The tarred trunk road Bl to Angola runs through the Planning area. Oshikango - Engela isone of the fastest growing points in the Region and it has already become an important servicecentre with a shopping area and a market. Small public service vehicles (taxis) play a majorrole in the public transportation system. There is still a big need for the rehabilitation of lowerquality access roads in the rural areas.
Semi-urban areas are supplied with electricity and the rural electricity supply network isdeveloping rapidly in the Project area. However, the present use of electricity is very low e.g.for cooking 0.3 % and for lighting 1.0 % omy. There is a post office in Ohangwena. A postalagency provides services at Omungwelume. Manual telephone exchanges will be replaced bya new digital multiple radio system during 1994. The television provides services within aradius of 60 km around Oshakati.
There are 135 primary and secondary schools in the Planning area. The number of schools,teachers and students according to the constituencies are shown in the Table 1.
Table 1. School data, 1993
EenhanaEndolaEngelaOndobeOngengaOhangwenaOshikanao
TOTAL
Number of schools25202522161116
135
Number of teachers125170253162179157172
1218
Number of studens61198861110228475724974898835
58050
In the Planning area two new hospitals (at Engela and at Eenhana) are under construction,and one health centre.(at Odibo) are being upgraded. In addition 18 health clinics will providedaily services to the people who are living in the Planning area. The urban population growthrates range from about 23.00 % in Oshakati - Ondangwa nexus to about 7 % in semi-urbancentres in the Planning area. The distribution of the population in the Planning area showsthat 113 000 of the total population live in rural areas while 11 700 persons live in semi-urbanlocalities.
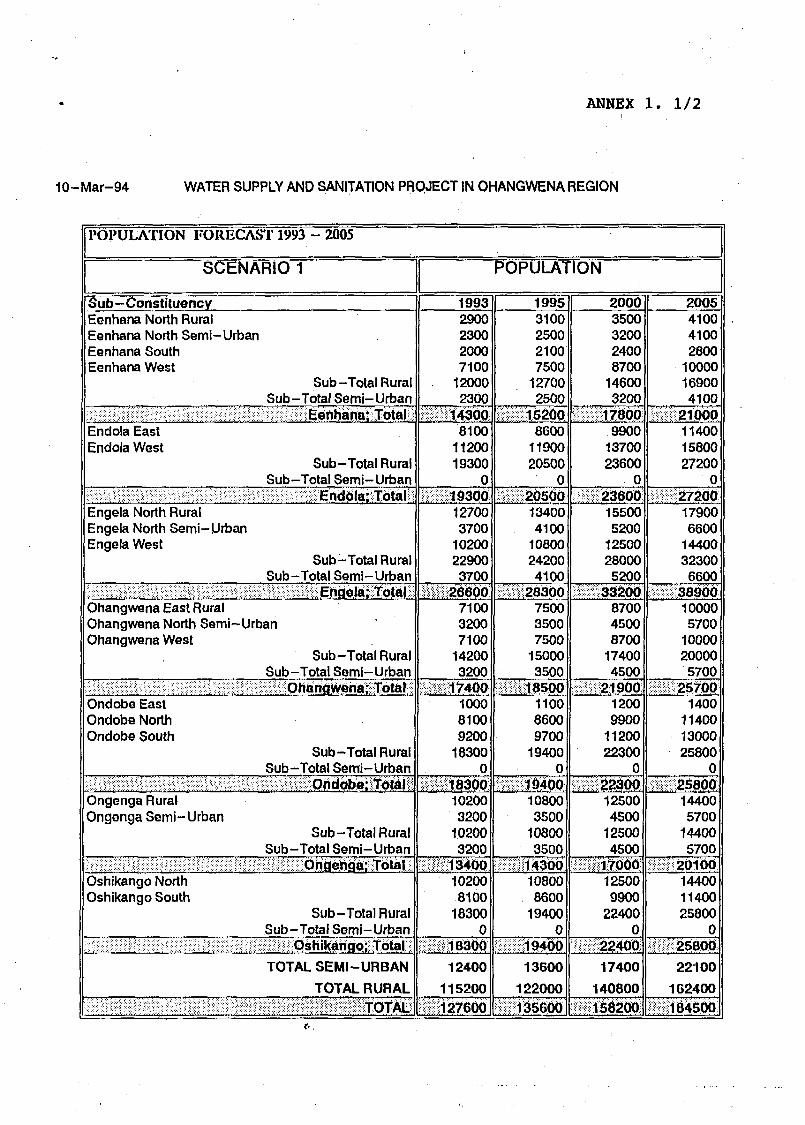
For the population forecast the constituencies are divided into the sub-constituencies in orderto have more accurate population forecasts. In Picture 1. administrative boundaries and sub-constituencies are shown. Population estimates for the Planning area at the end of 1993 appearin Annex 1.
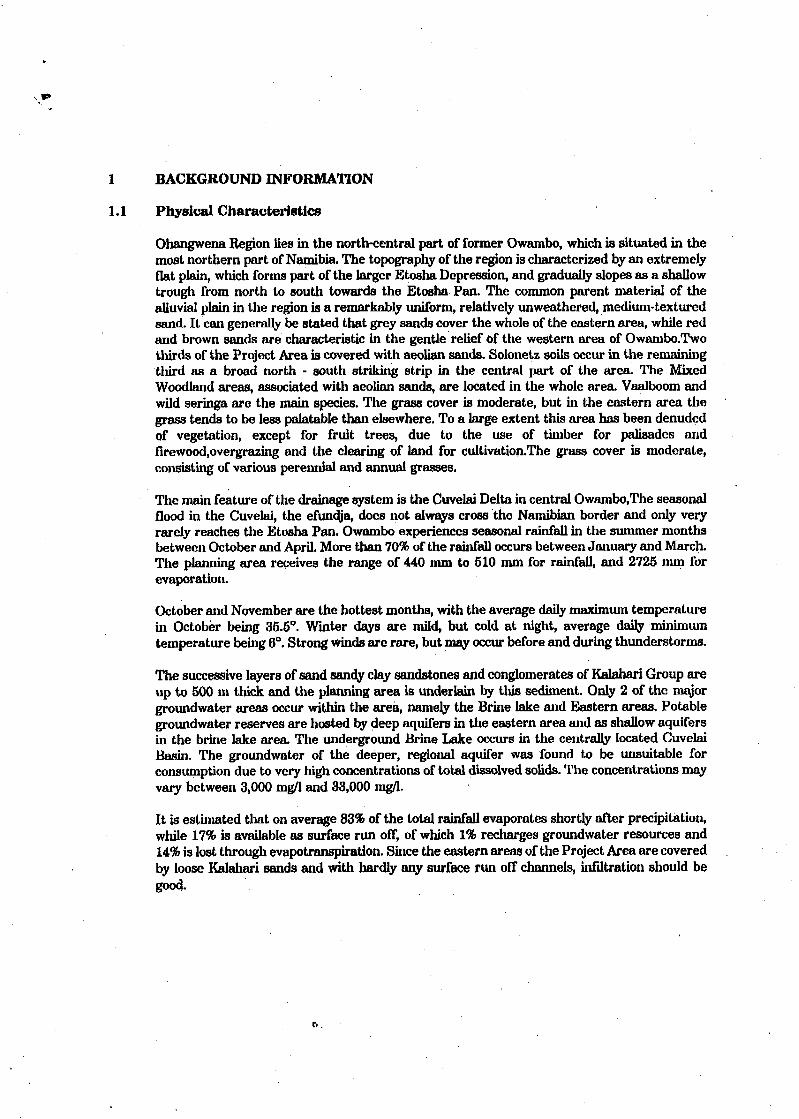
On both sides of the Ondangwa - Oshikango road the population density is nearly 100 peopleper km2. The population distribution is influenced by road access, the siting and density ofserviced dwelling plots and the position of water points. The average population density is 50persons per km2 in the Western part of the Planning area. A simplified population density mapis shown in Picture 2.
Picture 2: Simplified population density
A N G O L A
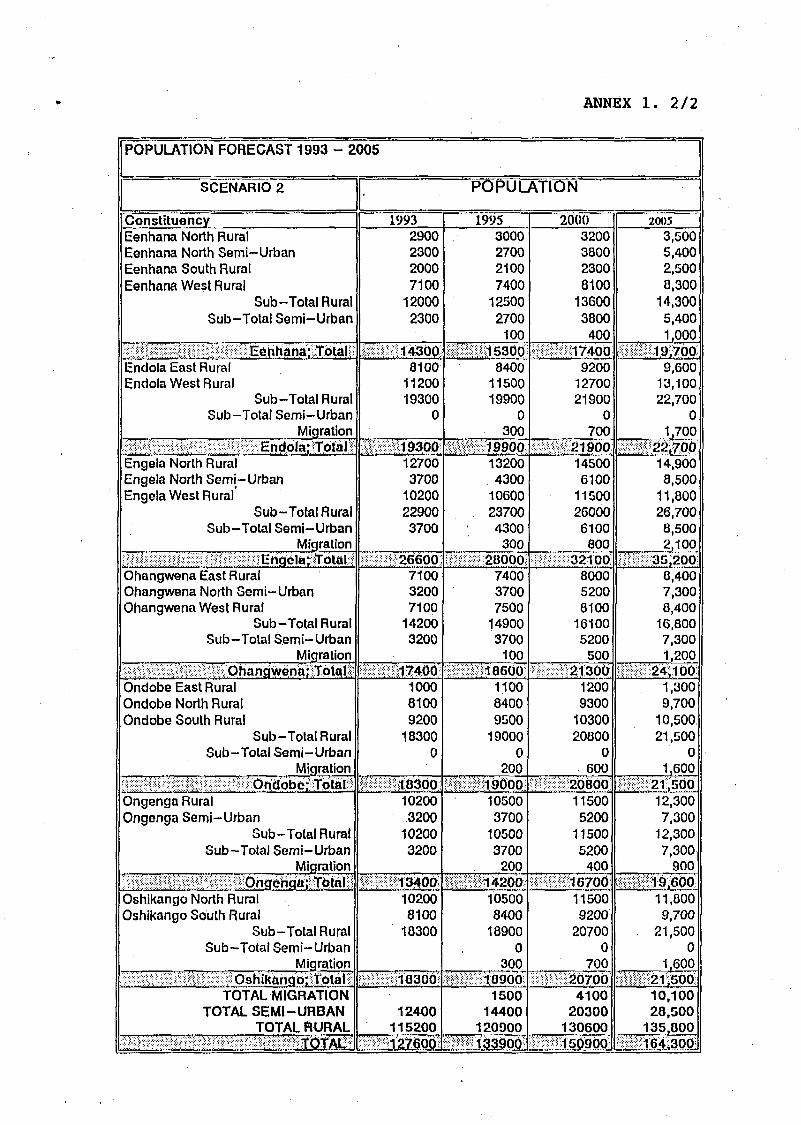
Two scenarios have been built using the following assumption:
Assumption:The average growth rate is 3.03 % during the planning horizon of 12 years in theProject Area.
Scenario 1:The rural population increase between 1993 -2005 is 2.84 % per annum and it isexpected that urbanized people in the Project area will increase by 5 % per annum.
Scenario 2:The annual growth rate in the rural areas between 1993 - 2000 is 2.2 % per annumand it decreases in 2000 to about 1.5 % per annum in 2005. It is expected that thesemi-urban population growth between 1993 - 2000 is 7.1 % per annum and between2000 - 2005, 9 % per annum. The migration from the Project area will be 22 % perannum between1995-2005.
Results of the forecasts according to the above assumptions appear in Annex 1.
The traditional economy of the Ohangwena Region is based upon three main activities: rain-fedagriculture, livestock farming supported by migratory seasonal grazing, and silvi-culture.'Livestock production is integrated with crop production. The agricultural calendar hasimplications with regard to the availability of labour for digging water pipeline trenches, as wellas for payment of user charges and maintenance of rural water supply systems.
The production of crops consists primary of millet, sorghum, beans, pumpkins and melons. Thestaple food crop and main agricultural activity in the Ohangwena Region is the cultivation ofpearl millet, better known as mahangu. Agriculture, supplemented by income from migrantlabour and pensions, forms the basis of the economy of the Ohangwena region.
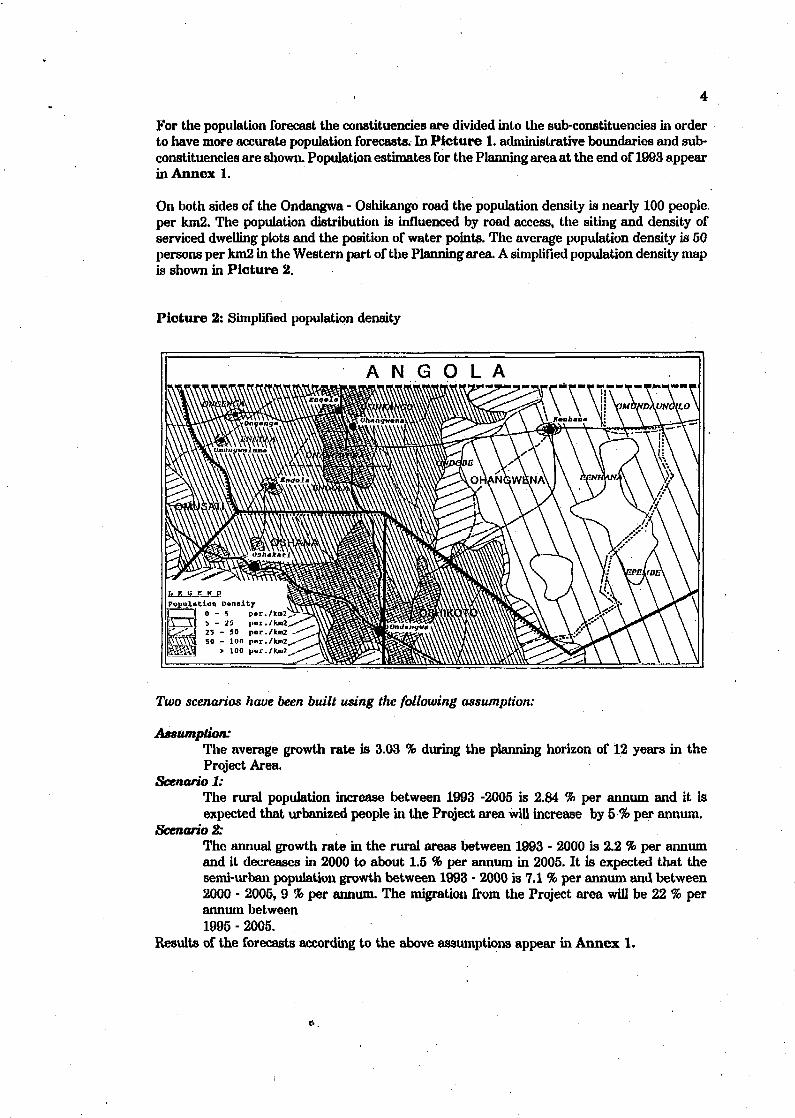
Cattle farming is one of the most important activities in the Ohangwena region. The livestockcomponent of agriculture consists of cattle, goats, sheep and donkeys. In the absence of arural banking system, the cattle herd is the family's stock of wealth and source of milk, meat,traction and manure. The average herd size is 7.6 head of cattle and 5.5 goats. A family ownson average 9.5 head of livestock. The bulls and donkeys are used for ploughing but very fewfarms use them for drawing and transport of water. In Table 2 the estimated number of stockas well as the stock according to carrying capacity in the Project area is shown.
Table 2: Livestock norms and data
Constituency
EndolaEnqelaOndobeOnqenaaOhangwenaOshikanqoTOTAL
Livest. LSU unit/1 Oha16600370042007400230018002900
36900
Livest. LSU unit/15ha11000240028004900150012001900
25700
Livest. estimation 199322000
55006000
11000350025004000
"55000
The productive cattle yield is less than 5% per annum whilst it could theoretically attain 10%.The reason for this can be found in the fact that the management of cattle herds has nocommercial aim.
There are some excavated dams and storage dams developed for fish farming in the Projectarea. However, due to the high evaporation in the area fish farming is seasonal.
The Eastern part of the Project area is a forest. It is used for grazing and also for fuel andbuilding purposes. The sale of wood is more and more prevalent along the roads due to thehigh demand for fire wood in the Region. These practices have led to nearly total deforestationof the Central and Western part of the Project area.
ft.

6
There are some reliable quantitative data available on family incomes. The comparable figurefor 1992 varies from a low N$ 1 104 to a high of about N$ 3 000 per annum. Wageemployment and remittances are now the most significant sources of family income. Incomevariation between households is more closely correlated to the access with which young peopleget urban employment and maintain their home linkages rather than to differences inagricultural productivity.
1.3 Assessment of the Planning Situation
The Regional Master Water Plan for Owambo Region (MWP), published in March, 1990, is thelatest document which will provide latest information for water supply development in thefuture.This plan will not give detailed and permanent solution for water supply in theentire Project area. Also the environmental impact of the solutions has not beenclearly addressed in the MWP.The Planning Report on the Proposed Oshakati - Omakango Regional State Scheme gives thedetailed data from s.c. Herringbone System and recommendations for it's developing.
2 WATER RESOURCES
2.1 Surface Water Resources
The Master Water Plan ( 1990 ) made proposals for meeting the estimated water demandthrough the establishment of the following water supply infrastructure:
* Extension of the then existing system of canals and pipelines to feed waterfrom the Caleque Dam in Angola into the interior of Owambo.
* Continued construction of storage dams which could be fed with water fromlocal run-off or from the proposed water supply network.
* Drilling of additional boreholes in the eastern and western farming areas.* The construction of wells and cisterns to serve rural schools and clinics.* The development of irrigation schemes.
The priorities determined by the Master Water Plan were to develop local watersources first, and then to import water from the Kunene River. This principle stillapplies today.
The study area has no perennial rivers within it, and the only sources for surface water wouldbe the seasonal flooding of the local drainage, or man-made storage facilities. The potentialsupply of water from the Kunene is large and water is imported into the area via surfacecanals and pipelines.
The oshana system covers one third of the Ohangwena Water and Sanitation Project Area.There is little information on ephemeral surface water and no reliable measurements areavailable. In 37% of the seasons, no flow occurred in the oshana at Oshakati. Due to theephemeral nature and irregular occurrence of the Efundja, as well as the large variation in anddistribution of local rainfall, the water in this oshana can not be considered as a reliable long-term water source for Owambo. Because the oshana system is an inland drainage system, withless rain than evaporation, there is a tendency for the salt content of the soil and water toincrease. It can be seen that the perennial water of the Kunene will in future continue to bean important factor in urban and peri-urban development in central Owambo. Surfacecatchments in the area are minimal.

Some secondary catchment occurs in the borrow pits which have accompanied roaddevelopment programs of recent years, but the total contribution to surface water resourcesis minimal. The low-relief topography mitigates against the establishment of any primarycatchment areas.
2.2 Shallow Water Resources
Two shallow aquifers have been identified in the western part of the Project Area:
• Main Shallow Aquifer (MSA)* Discontinuous Perched Aquifer (DPA)
The MSA is currently developed by "ndungus" (deep hand-dug wells) and is the major sourceof drinking water. Ndungu depths can vary between 10 and 30 m, and, if lined, are done sowith bricks, concrete rings or timber. Whereas the omafima are normally shallow enough toallow for manual extraction of the water, the ndungus often have simple hand pumps installed.
The DPA is an ephemeral or seasonal water source, located mainly in the oshanas, at depthsof less than 16 m. During the dry season water levels drop considerably and commonlyomafima dry out completely for a number of months. The depth of the potable water bodyseldom exceeds 40 centimetres. The preponderance of ndungus is in the central to central-eastportion of the Planning area. Over most of the area, the water table is found at about sevenmeters below ground level. The ndungus can be considered as permanent water sources,unreliable only during very dry periods.
A rough calculation can be made for omafima in the western third of the area. Assuming thatoshana surfaces account for 10% of the total surface area, and assuming that waterintersection over the total area is the maximum encountered of 40 centimetres, the totalvolume of water recharging the system, and therefore theoretically abstractable for any oneseason would be of the order of 9,600,000 m3 In the case of ndungu reserves, assuming a totalsurface area, east of the 0,3 m intersection contour line, of 576,000,000 m2, and a meanpenetrated depth of 0.5 m, a rough calculation of stored reserves would be of the order of288,000,000 m3. However, how long this would be sustainable would depend on recharge, forwhich there is no information.
2.3 Deep Ground Water Resources
The Deep Aquifer occurs below a depth of 60 m, is commonly saline and becomes more salinewith depth. Most of the Ohangwena area is underlain by this aquifer. This salinity has beeninterpreted as connate waters dating back to the time of formation of the palaeo-lake Etosha,Significantly, the Deep Aquifer appears geographically related to the 130 m topographiccontour, which has been interpreted as representing the maximum palaeo-lake shoreline(Rust,1984). Above this contour the quality of groundwater from the deep aquifer increasesprogressively.
Most of the Study Area, except for the far eastern parts, lies below this topographic contour,indicating that there is very little chance of encountering fresh groundwater in this area.Boreholes in the eastern area, that is to the east of the Brine Lake Area, have generally been85% successful, with yields in the order of 2 to 5 m3/h at depths of 70 to 90 m. The water ispotable and the concentration of total dissolved solids in the water is about 500 mg/1.

3 EXISTING WATER SUPPLY INFRASTRUCTURE
3.1 Bulk Water Supply System
The bulk water supply network in the Central North Namibia is the largest water supplysystem in the country. It presently consists of 29 pump stations, 950 km of pipelines, 92 kmof canals and 9 purification plants. Ondangwa-Oshikango main pipeline comprises a major bulkwater supply artery running from Ondangwa in the south to Oshikango in the north. Anumber of pipeline branch off from this pipeline and it is popularly known as the HerringboneScheme. The total length of the existing pipeline is around 200 km. A new pipe line (48 km)from Oraafo to Eenhana is under construction and also Omakango - Onambutu pipe line isunder upgrading. The layout of this scheme is shown in Picture 3. The project area is shownby the dotted line.
Picture 3. The schematic lay-out of the Herringbone system
STOCX(3107001
OUDUICWA
EWCtU Aj'10001
_ Q / p \ (70000)
0WUKUTUII73OO)
—•——- ', Planning area-
Symbol
D-A—O>—- o - •*•
Capacity ofComponent and Units
( ) n»3/a
( ) m3
( ) m3/a
( ) m3/h
( ) n.3
Description
Consumer
Pumped storage dam
Pipeline
Pumping station
Clear waterreservoir

3.2 Rural Point Water Supply System
3.1.1 Unprotected Water sources
NduneusCommunities who are living between oshanas have dug so called ndungus in the sand bed fortheir own water supply. Generally ndungus are found in the areas where fig, palm and marulatrees exist. The top part of the ndungus are consolidated by wooden logs and they are about15 -20 ra deep.OmafimasDuring the dry winter months communities are used to dig omafimas in Oshana beds, whenall other surface water resources are getting dry. These wells have a very low yield and theycan provide water from one to three families only. It is estimated that there are approximately1800 ndungus and omafimas in the Planning area.DamsThere are 8 dams in the Planning area and mainly they have been constructed in the earlysixties. Most of them have silted up and are not in operation.
3.1.2 Protected Water Points
WellsThere were about 300 protected wells constructed by different institutions, NGO's andorganizations in the Planning area by the end of December 1993. By the end of 1993, theWSSPOR had constructed 36 hand dug/borehole wells estimated to serve 1000 rural people.The depth of the wells ranges between 5 m and 18 m and they are equipped with hand pumpor windlass. Water quality is generally good. Communities have contributed to the constructionof water points and they are responsible for their maintenance.BoreholesAt present about 30 boreholes have been drilled in search of drinking water in the Projectarea, and onty three of these have reasonable yield and water quality. Most of them have beenabandoned because of the saline ground water.Roof Catchments and Water Tanks in the SchoolsThere are some 25 roof catchment systems built for the schools in the Project area. The sizeof water tanks ranges from 10 m3 to 45 m3. These water storage services are very limited and
dependent on rain fall.
3.3 Water Supply Coverage in the Planning Area
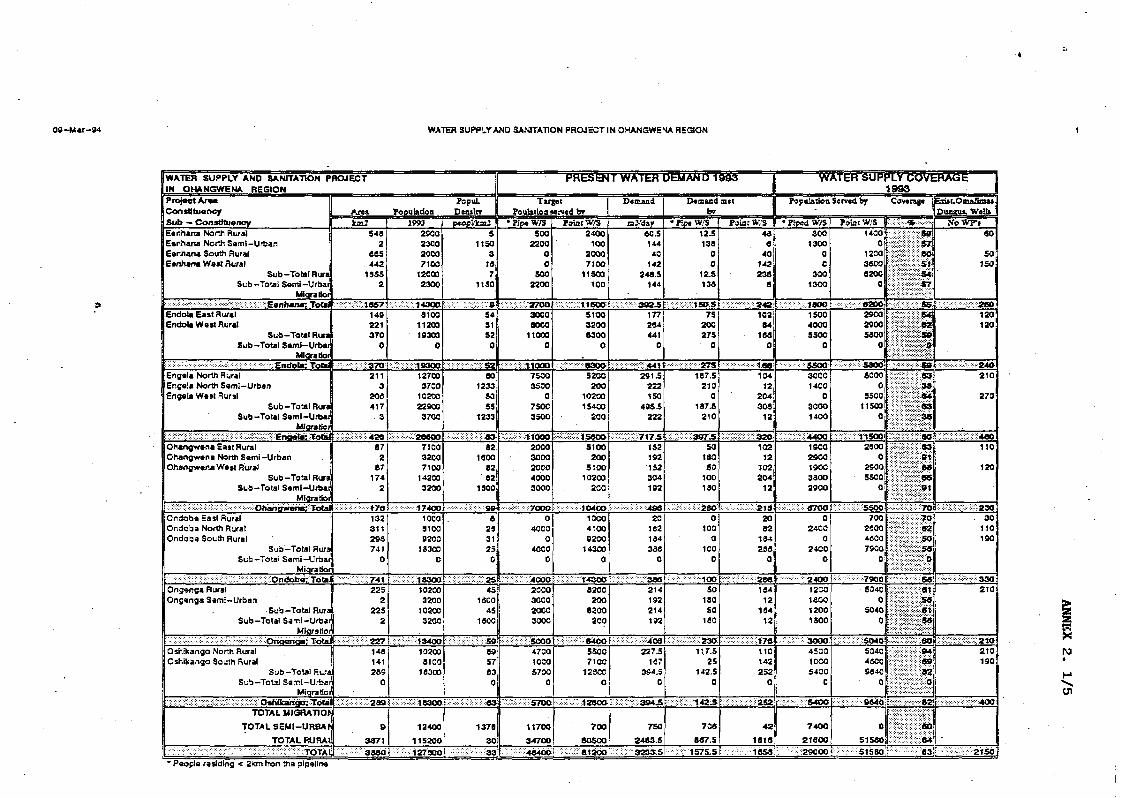
3.3.1 Pipe Water Supply CoverageTo determine the rural water supply coverage it is assumed that the population and itslivestock along a 2 km way on either side of the pipeline (a total of 4 km) will get their waterfrom the pipeline. The present water demand and water supply coverage calculations arepresented in Annex 2. Accordingly the existing water supply network and theoretical watersupply coverage is presented in Annex 3.
It ia estimated that about 37 % of the total population in the planning area are within the pipewater supply service. The pipe water supply coverage has been cross checked with the capacityand operational data provided by the DWA.
ft.

10
3.3.2 Point Water Supply Coverage
Some 2150 water points ( Ndungus and Omafimas ) were identified in the planning area. Itis estimated that 41 % of the total population in the planning area are somehow within thepoint water supply service. If water quality is taken into consideration the number of peopleserved by water which fulfils quality standards is much lower.
WATER DEMAND
The unit water demand has been adopted from the re-evaluation of water demand norms forplanning purposes, published by DWA in April 1992.
Consumer served by Piped Water SupplyCommunity stand pipetjSemi - Urban area stand pipsClinic out - patientClinic as a wholeClinic per bedHospitalSchoollivestock
Unit25 1 /60 1 /30 1 /1000 1300 1 /
day /day /op. // cl.bed /
personpersonday/ dayday
Consumer served byPoint Water SupplyCommunityLivestock
500 1 / bed / day15 1 / pup./ day45 1 / LSI) / day
20 1 / day / personmax 45 1 / day / LSU, if water available
In order to assess the future water demand in the planning area it is assumed that theincrease of water consumption will correspond to the expected increase of the population.Irrigation, forestry and fish farming are not taken into consideration when calculating thewater demand. The domestic water use is the first priority and thereafter comes livestock. Thepresent and future water demand are shown calculated based on the following assumptions asshown in Tables 3 and 4. A break-down of domestic water demand is shown in Annex 3
Assumptions* 1 LSU/10 ha residing less than 2.5 km from the pipeline* growth rate of students 4 %* health facility demand based on growth rate of population* the commerce and industry not included. To be assessed case by case
Scenario 1:* average growth rate* growth rate in rural area* growth rate in semi-urban
3.03%2.84%5.10%
Table 3. Present and future water demand, Scenario 1
CONSUMERSemi-UrbanRural populationLivestockHealth servicesSchoolsGRAND TOTAL |
19937502460450*220870
4770
WATER DEMAND19958202750600250930
5350
M3 / DAY20001040321080030011006450
200513304060101035012508000
11
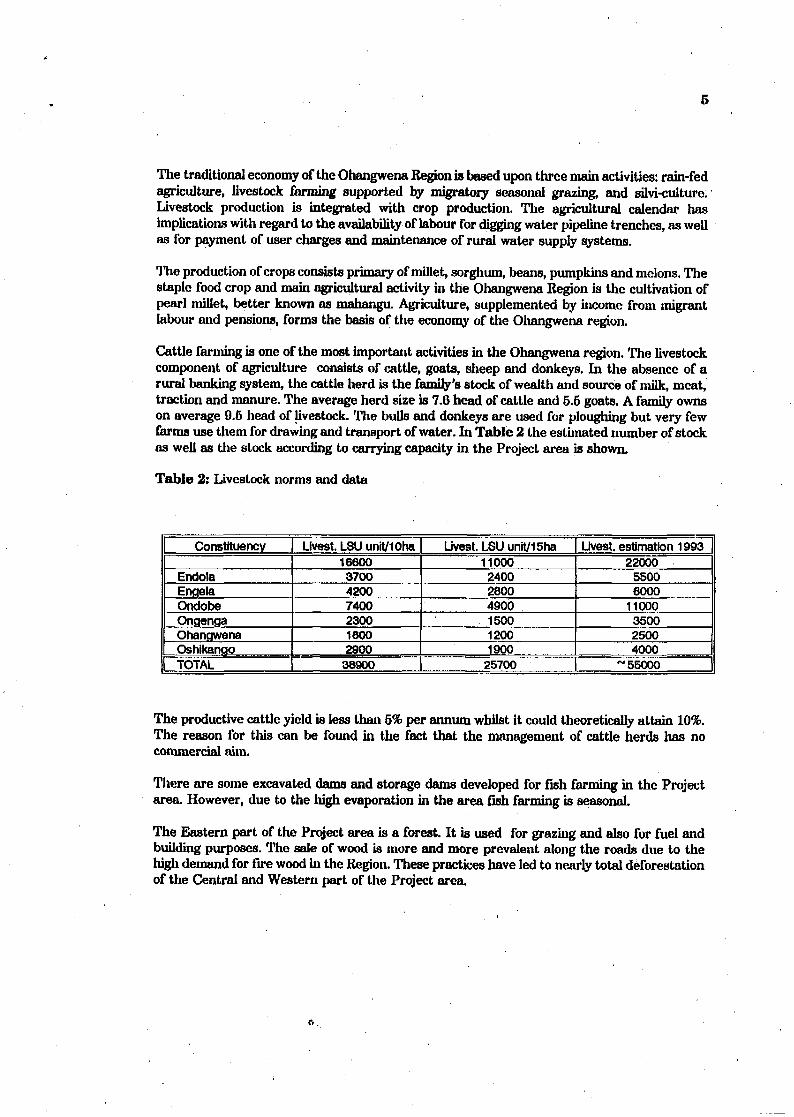
Scenario 2• average growth rate (1994 - 2000 ) rural 2.2 %* average growth rate ( 2000 - 2005 ) rural 1.5 %• average growth rate (1994 - 2005 ) s-urban 7.1 %* migration growth rate (1995 • 2005 ) rural 22.0 %
Table 4. Present and future water demand, Scenario 2
CONSUMERSemi-UrbanRural populationLivestockHealth servicesSchoolsQRAND TOTAL
19937002480450*220870
4770* Livestock served by pipewater supply
19958702650600250920
I 5300
200012202930700300
jpoo6150
2005171032308003501060
I 7150
The growth rate of number of students has been estimated at 4% during the planning period.The future water demand for the health facilities has been estimated on the basis of theexisting water demand, using an annual growth rate equal to that of the population. The waterrequirement of commerce and industry are unknown, and therefore the rate has to be assessedcase by case and not taken into the development plan at this stages.
5. WATER SUPPLY OPTIONS
5.1 Water Resource Options
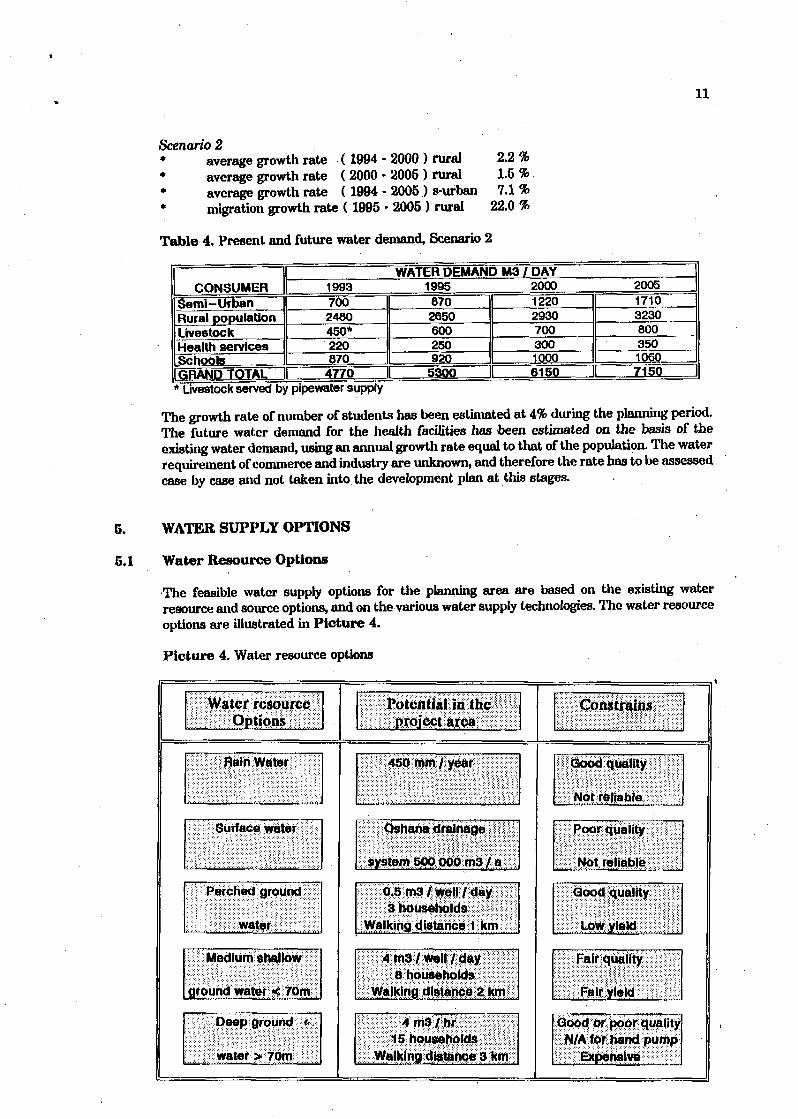
The feasible water supply options for the planning area are based on the existing waterresource and source options, and on the various water supply technologies. The water resourceoptions are illustrated in Picture 4.
Picture 4. Water resource options
||i|lllll::iilpiibM;lllil
Rainwater
: Surface water
Perched ground;
water
Medium shallow
ground water < 7 0 m
: Deep ground «.:
water > 70m
;•;'; :;;i:rjrpicct:?a.lrca;r:::l;:-;'"
450 mm/year
: Oshana drainage j I ;
system 500 000 rr>3 / a
0.5 m 3 / w e l l / d a y- :; 3 households :>;
Walking distance 1 km
•••/: 4 rn3 / well / day ;•8 households : >:
walking distance 2 knn
; : ' . ; . 4 m 9 / : h r : :•,;••; .;.,;;;••"
:"• -.' .-;-.;i5 households VlD--1
Walking^jlstance 3 km
Good quality
Not reliable
Poor quality
Not reliable ;
Good quality
Low yield
Fair quality
Fair yield
Good or poor qualityN/A for hand pump
Expensive
12
5.2 Technology Options
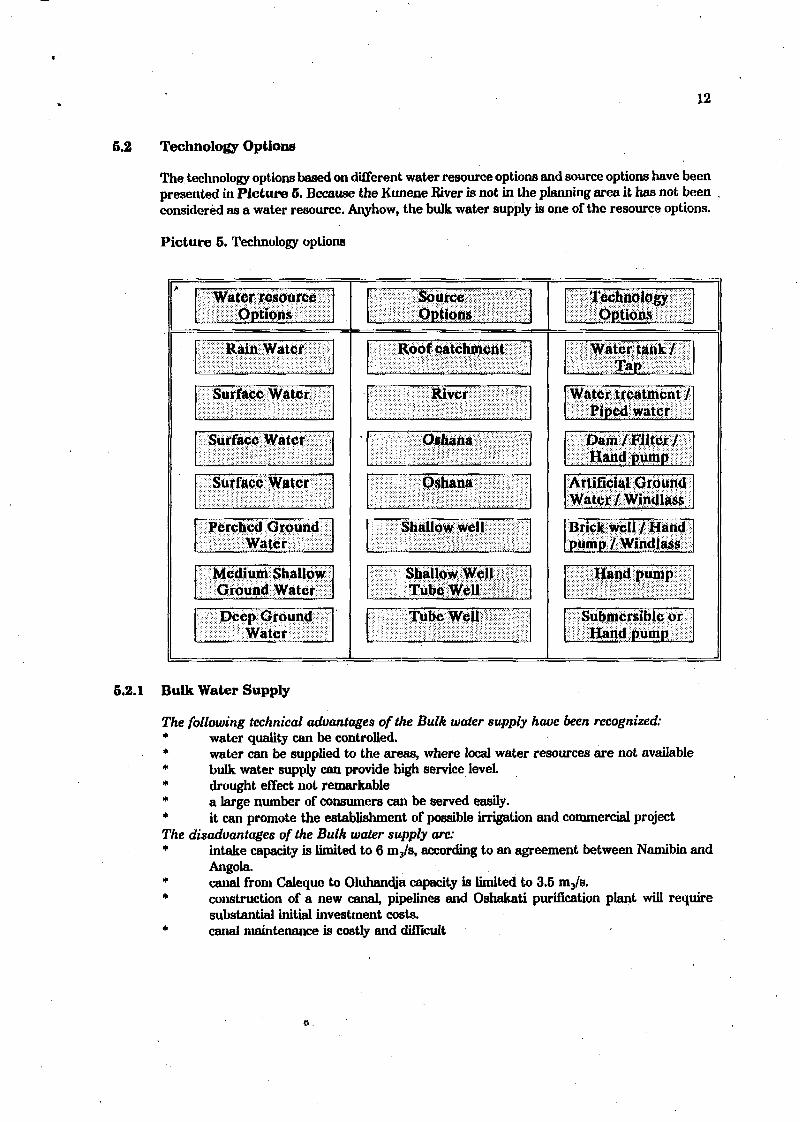
The technology options based on different water resource options and source options have beenpresented in Picture 5. Because the Kunene River is not in the planning area it has not beenconsidered as a water resource. Anyhow, the bulk water supply is one of the resource options.
Picture 5. Technology options
Water resourceOptions :
RainWater
Surface Water
Surface Water
Surface Water
Perched GroundWater
Medium ShallowGround Water
Deep GroundWater
• ;;?- . ; : : S b u r c e ; : - t f : : l i i : i ; i • • • • : "•;.; ••*.'• - O p t i o n s ;•• i"1':: ;:"-::;.•
Roof catchment• • • " " • : • ' ; • . . . ' V
•• R i v e r .:.-.,; -••-•
Oshana •;•;
Qshana {
Shallow well
Shallow WellTube Wea ! - :
Tube Well %
; ; TechnologyOptions
Water tank/'•'. ^ : ; ; ; T a p / : > • ' • •
Water treatment /Piped; water
Dam/Filter/Hand pump
Artificial GroundWater /Windlass
Brick well / Handpump / Windlass
Hand pump:
Submersible orHand pump
5.2.1 Bulk Water Supply
The following technical advantages of the Bulk water supply have been recognized:* water quality can be controlled.* water can be supplied to the areas, where local water resources are not available* bulk water supply can provide high service level.* drought effect not remarkable* a large number of consumers can be served easily.* it can promote the establishment of possible irrigation and commercial projectThe disadvantages of the Bulk water supply are:* intake capacity is limited to 6 mj/s, according to an agreement between Namibia and
Angola.* canal from Caleque to Oluhandja capacity is limited to 3.5 m3/s.* construction of a new canal, pipelines and Oshakati purification plant will require
substantial initial investment costs.* canal maintenance is costly and difficult

13
5.2.2 Rural Pipe Water Supply
The following technical advantages of the Rural Pipe Water Supply have been recognized:* water quality can be controlled.* water can be supplied to the areas, where local water resources are not available* can serve the population also during the dry period* livestock water demand can be metThe disadvantages of the Bulk Water supply are:* illegal connections.* expensive development and O & M costs 3.5 m3/a.* water shortages are common* revenue collection difficult
6.2.3 Point Water Supply with Hand Pump
In the planning area the average shallow well depth is about 15 m and the depth of well usingMSA about 20 • 50 m. The depth of the deep ground water tube wells is more than 100 m.
The hand pump well has the following advantages:* water is relatively safe and protected* hand dug well can be constructed using local skills and materials* the operation of the hand pump requires no external power* local technicians can maintain hand pumpsthe disadvantages of the hand pump well are:* contamination risk exists during the rainy season* hand pump wells are reliable only in the areas where good ground water is available
at shallow depths throughout the year* can not be used in deep tube wells, where ground water level is deeper than 100 m.* corrosion high due to the salinity* deep tube well pump repair require skilled manpower, special tools and it is expensive
5.2.4 Point Water Supply with Windlass
The WSSPOR has developed a well constructed at site and equipped with a bucket liftingsystem.
The advantages of the well with windlass are as follows:* well can be constructed with minium external support using local materials and
transport* community is fully involved in all stages of well construction* the windlass water point is easy to operate and maintain by the community* it provides good protection for water contamination
The well with windlass has the following disadvantages:* the capacity of the shallow well using perched ground water is limited and can only
serve an average of 3 household* there is a contamination risk during the rainy season* wells might dry up during the dry season

14
5.2.5 Roof catchment
The advantages of roof catchment are as follows:* low-cost technology can be used* it will improve water supply situation in the schools which are without any reliable
water supply system* high community contribution* local contractors are able to construct the systems* storage capacity for tanker serviceThe roof catchment has the following disadvantages:* not reliable because of low and occasional rainfall* water quality control difficult
5.2.6. Dam
The dams are used mainly for livestock watering. During the last two years the RDC and theDevelopment Brigade have constructed or rehabilitated some of the dams, also for domesticconsumption.The advantages of the dam are:* excavations for road construction can easily be developed for livestock watering with
minimum investment* cheapest and easiest way to water the livestock in the oshana area, if normal rains
occurThe disadvantages of dam are:* only 40 % of the dam capacity can be utilized for water supply due to the high
evaporation* not a reliable water source due to low and occasional rainfall* water is not suitable for domestic consumption without treatment* increases risk of malaria
5.2.7 Other Methods
The methods and technologies which can be successfully used in special conditions in theplanning area are:* Artificial ground water / improved ground water recharge* Desalination* Solar systems
5.3 Cost
The households and livestock are considered as main beneficiaries of the planned water supplysystems. The cost comparisons have been made by estimating the total development costs,operation and maintenance costs and community participation costs. The costs have beencalculated based on 1994 prices. Technical assistance has not been taken into account.The development costs include: materials, skilled labour, transport, community contributionand overhead.
The cost analysis has been calculated as follows:Pipe water supply ,* investment costs calculated with 10 % interest for 20 years using current price level* renewal costs not includedPoint water supply* boreholes, 10 % interest for 15 years* shallow well 10 % interest for 12 years
15
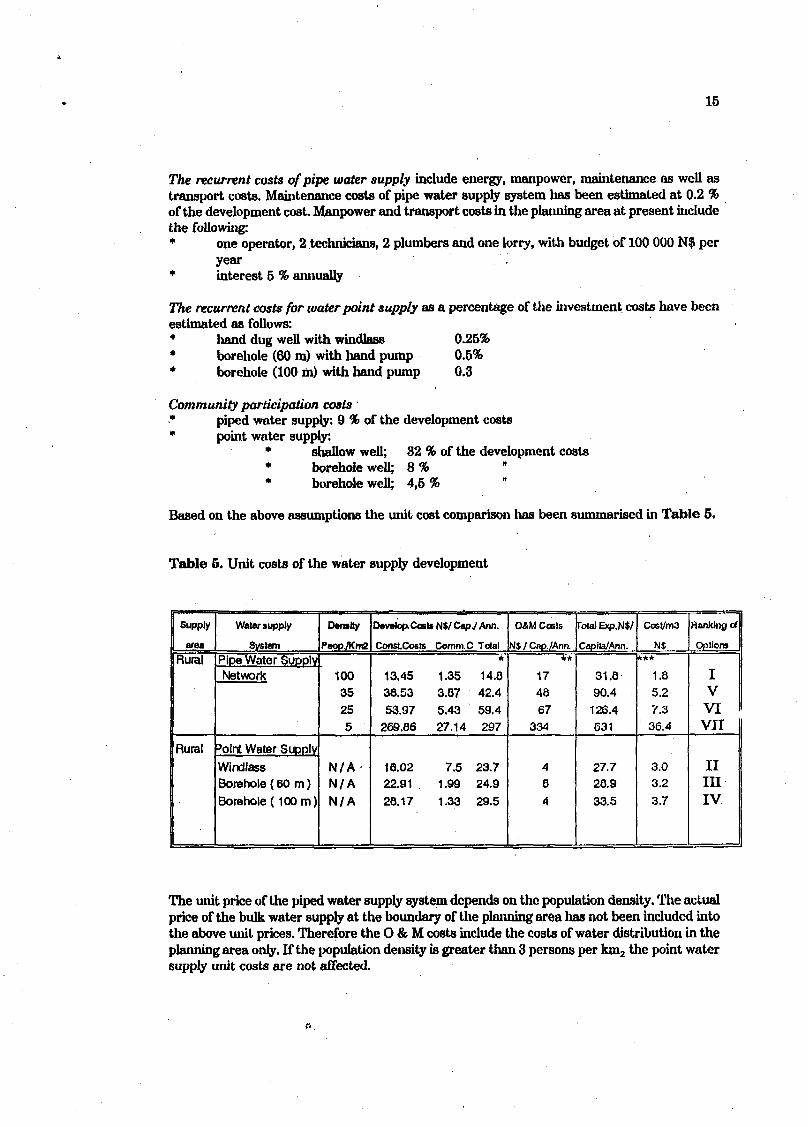
The recurrent costs of pipe water supply include energy, manpower, maintenance as well astransport costs. Maintenance costs of pipe water supply system has been estimated at 0.2 %of the development cost. Manpower and transport costs in the planning area at present includethe following:* one operator, 2 technicians, 2 plumbers and one lorry, with budget of 100 000 N$ per
year* interest 5 % annually
The recurrent costs for water point supply as a percentage of the investment costs have beenestimated as follows:* hand dug well with windlass 0.25%* borehole (60 m) with hand pump 0.5%* borehole (100 m) with hand pump 0.3
Community participation costs* piped water supply: 9 % of the development costs* point water supply:
• shallow well; 32 % of the development costs• borehole well; 8% "* borehole well; 4,5%
Based on the above assumptions the unit cost comparison has been summarised in Table 5.
Table 5. Unit costs of the water supply development
Supply
area
Rural
Rural
Water supply
System
Pipe Water SupplyNetwork
'oint Water Supply
WindlassBorehole (60 m)Borehole (100m)
Density
PeopTKnG
10035255
N/A'N/AN/A
Develop.Cost* Nil Cap./ Ann.
Const.Costs Comm.C Total*
13.45 1.35 14.838.53 3.87 42.453.97 5.43 59.4
269.86 27.14 297
16.02 7.5 23.722.91 1.99 24.928.17 1.33 29.5
O&M Costs
N$ / Cnp./Ann.* *
174867
334
484
rotal Exp.N*/
Capita/Ann.
31.890.4
126.4631
27.728.933.5
Cost/m3
N$* * *
1.85.27.336.4
3.03.23.7
Ranking of
Options
IVVIVII
IIinIV
The unit price of the piped water supply system depends on the population density. The actualprice of the bulk water supply at the boundary of the planning area has not been included intothe above unit prices. Therefore the O & M costs include the costs of water distribution in theplanning area only. If the population density is greater than 3 persons per km2 the point watersupply unit costs are not affected.

16
5.5 Technology Choice
The water production per day has been estimated for the proposed technologies (Picture 4).The unit costs per m3 do not give accurate comparison of the different technologies due tovarying service levels. The ranking of the options, as shown in the Table 5, has been proposedbased on the unit price /m3 and capita cost together. In the semi-urban areas where thepopulation density is above 100 persons/ km3 the piped water supply lias been given thehighest rank considering that the O & M is fully paid by the consumers. If the price of thewater at the planning area boundary is added to the O & M costs the expansion of the pipedwater supply network is becoming questionable. The Picture 6 illustrates the effect of the twodifferent tariff rates to the actual price of the water.
Picture 6. Effect of the tariff to the unit price of water
N$/m330 Average pop, density in the area
0 10 20 30 40 50 60Correlation between population density andunit price of water with different variationsof tariff • pipe water supply
^ _ _ _ ——• - point water SUDDIV
70 80 90 100Population density; per / km2
6. PLANNING CIUTEIUAS
6.1 General
The Water Supply Development Plan for Western Part of Ohangwena Region has beendeveloped based on the existing plans and existing water supply situation as well as existingwater resources for the future improvement of water supply situation in the area. For thispurpose the following criterias as presented below have been considered. The plan will followthe principles of the Master Water Plan for the Owambo Region when applicable.
6.2 Planning Horizon
The plan covers the period 1994 - 2005 with a greater detailed descriptio of the first six yearsperiod of 1994 - 2000.

17
6.3 Consumers to be Served
The plan focuses on domestic and livestock consumption. Also the institutional consumptionis taken into consideration. The possible irrigation, commerce and industry are not covered.The target of the plan is to serve all of the population of the Project area by the year 2005,i.e.100 % water supply coverage.
6.4 Service Level
The service level is the following:The rural areas* one shallow well per 3 households with a walking distance of 1 km* one shallow tube well per 8 households with a walking distance of 2 km* one deep borehole per 15 households with a walking distance of 3 km* 25 1 per capita per day* water source: communal water tap or water well* consumed water has to be paid when provided by the DWAThe semi-urban areas* 60 1 per capita per day* water supplied through the public stand pipes or private house connections* consumed water has to be paid according to the tariffs
6.5 Water Quality
The plan is based on the assumption that all water for domestic use will qualify for humanconsumption and will therefore conform with DWA water quality standards.
6.6 Selection of Technology
The selection of the technology for the rural water supply system is proposed to be based onthe following aspects:
* systems should be reliable and easy to operate and maintain* use of locally manufactured materials and equipment* in power supply, electricity has priority over diesel or solar* beneficiaries participation in both development and O & M favoured
6.7 Social and Culture Aspects
Special attention should be given to the following factors:
Taboos, beliefs and customsWater is a resource over which women have traditionally had control. As main users andmanagers, they should be involved right from the start of the project. Cultural constrainswhich affect women's participation in water project should be studied carefully and campaignsto be launched to support women's effort in development
Local organizations and leadershipThe project will facilitate setting up community level structures in collaboration with theRegional Council and individual counsellors and shall ensure that these structures andcommittees have multi-sectoral functions in order to develop an integrated grass-rootsdevelopment capacity.

18
Utilization of local contractors and materialsThe commitment of a community to any development effort will depend on the utilization ofboth the human and material resources available. Apart from the aspect of commitment,construction of water supplies will be much cheaper if local construction capacity is used forbuilding, this would reduce the overall costs.In order to improve the efficiency, and to decrease the dependency on the public sector theinvolvement and participation of the private sector will be supported. Private companies and/orartisans could assume a strong role in water supply development, maintenance, supplying ofbuilding materials, handpumps, spare parts and transportation. In the development of localwater supply construction capacity the condition is that the costs of materials and services shallbe on the affordable level to the communities.
6.8 Institutional Aspects
As a part of the institutional integration process the implementation of the activities shall bedone in close cooperation with partner institutions. This will apply specifically in communitysensitization and mobilization, hygiene education and sanitation promotion areas in whichMHSS and MRLGH are involved. Other important actors are MAWKD and NGOs active inthe area.
6.9 Financial Aspects
In order to achieve sustainable and affordable water supply development, the followingprinciples are recommended:
* Cost shearing is the key target. Water tariffs shall be introduced to allbeneficiaries and they should be informed of the development costs of theirwater supplies.
* In the rural areas the water tariffs shall cover the full operation andmaintenance costs. In future the share of the present and future investmentcosts shall also be included.
* In the semi-urban areas the aim is full cost recovery of individual houseconnections: the water tariffs cover both development and O & M costs.
* Water tariff should encourage water conservation and reduce wastage.* Community or users group management of the water supply systems implies
that the consumers own their water supply systems, and take responsibilityfor managing it.
* Construction capacity development is to be encouraged in order to reduce thecosts of the construction and keep the development cost at affordable levelsfor community to continue the use of these services without external support.
6.10 Priority Criterias
The unserved rural population should be given the first priority. Also all schools and clinics inthe rural area should the high priority in design and construction of water supply systems.
6.11 Environmental Aspects
This water supply development plan draft has been prepared without considering theenvironmental aspects and possible impacts. Therefore the EIA study has to be carried outbefore completion of this plan and the possible effects of the study results have to beincorporated into the plan.
ft.
19
7. PLANNING GUIDELINES
The following guidelines for the selection of development programmes are proposed:* The existing bulk water supply network should be maintained and extended where
appropriate, feasible and affordable. Expensive rural pipe water network should beavoided in the areas of population density less than 100 people/km2. The water for thestock farming areas should be supplied from possible groundwater or surface watersources.
* Groundwater sources should be utilized in those areas where the water is potable orsuitable for stock watering. It is therefore necessary to embark upon thoroughgeohydrological investigations in order to establish the true nature of thehydrogeological environment in the planning area, especially with reference to theoccurrence of a possible perched fresh water table which could be utilized by ruralcommunities through digging of wells and installation of windlass or hand pumps.
* The provision of assistance to the rural communities in establishing safe drinkingwater supplies from wells and boreholes should be a major priority for improvinghealth and welfare.
* Support should only be granted to communities which accept to make a definedcounter performance. The size, type and timing of this counter performance willdepend on the communities and on the water project characteristics.
* The importance of environmental assessments in proposing adequate managementstrategies is recognized whenever new water projects are designed and implemented.This should receive proper attention during all phases of water project developmentin Namibia.
8. DEVELOPMENT PLAN
8.1 General
The network modelling has been created based on the concepts being developed by DWA. Theextension of the Omafo-Eenhana rural piped water supply network is the only project beingdesigned at this moment.
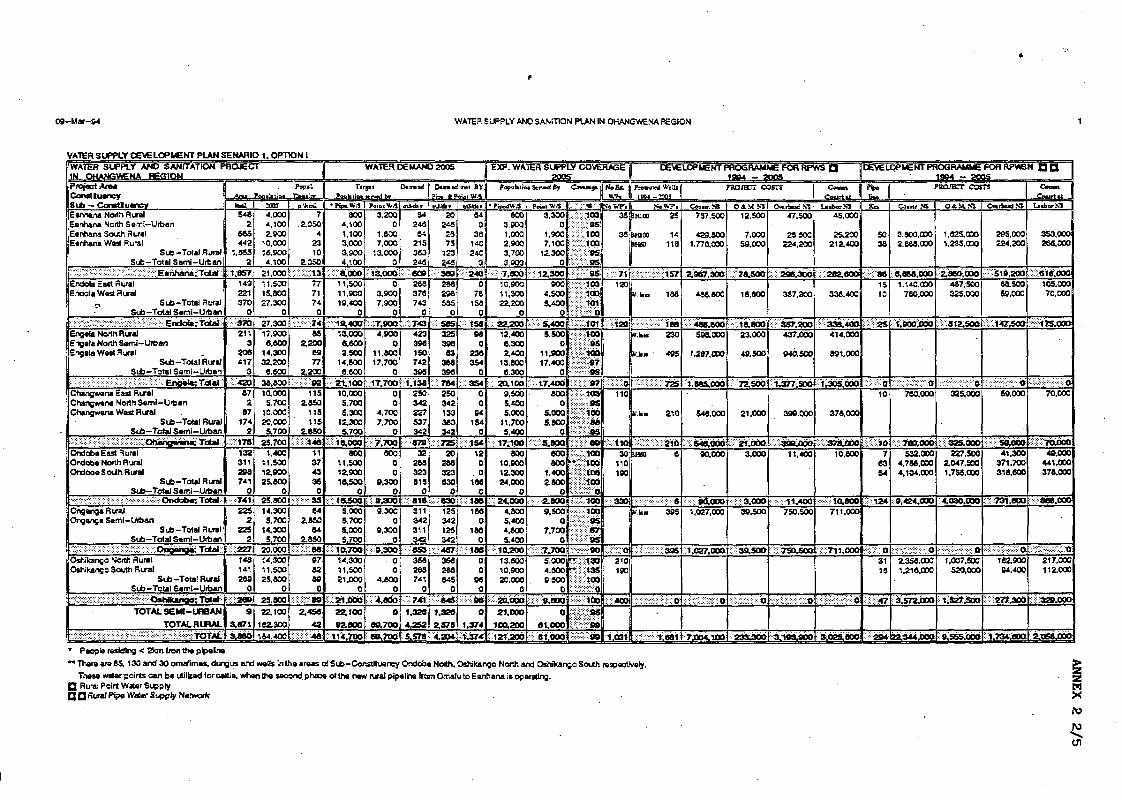
The following have been presented in Annex 3:* Existing water supply situation for 1993* Implementation programme for 1993 - 1995* Proposed implementation programme for 1995 • 2000* Proposed implementation programme for 1995 • 2005
The development costs have been calculated according to the two scenarios for each option andthe total costs are as follows:
* Scenario 1/ Option I: N$ 39 million* Scenario 2/ Option I: N$ 35 million* Scenario 17 Option II: N$ 32 million* Scenario 2/ Option II: N$ 28 million
The results clearly indicate that the population figures and its density are directly correlatingwith the development costs of water supplies. The detailed information is presented in Annex2.

20
The time schedule for the implementation of option I (1994 - 2000) is probably unrealistic andwill not be executed in the proposed scale due to other major financial needs for bulk watersupply improvement in the Cuvelai Region. The migration from rural areas to the urbancentres has been increasing and therefore it is assumed that scenario II is more realistic.
Scenario II and the development option II is proposed for the development plan based on theabove facts and the technical and economical calculations. According to the guidelines for theprogramme selection it is proposed that local water resources and local construction capacityshall be exploited to the maximum extent in order to minimize costs and to achieve high localcommitment in the management of the water supplies.
In the four semi-urban areas (Ohangwena, Engela-Oshikango, Eenhana and Omungwelume)the water supply coverage can presumably be improved upon by upgrading the existing pipedwater supply network. In the rural areas new systems are required if coverage is to besubstantially increased. These new systems are required to supply the dispersed ruralpopulation, which presently depends on unprotected facilities shared with livestock. Newsystems are also required for the isolated institutions in rural areas such as schools and climes.
The existing and proposed new pipeline network system, representing 74 % of the expectedwater supply coverage in 2005, will require 80 % of total expenditures during the planningperiod. The percentages required for point water supply system are 28 % and 20 %respectively.
It is expected that the communities will increasingly require water supplies with higher servicelevel. However, when revenue collection will be based on full cost recovery the demand forthe piped water supply will considerably decrease, while,the demand for point water supplywill increase.
8.2 Institution Building and Human Resources Development
At the beginning of 1993 the responsibility for rural water supply was transferred from theDirectorate of Rural Development (Department of Agriculture) to the Directorate of RuralWater Supply (Department of Water Affairs). At present the Directorate of Rural WaterSupply is responsible for planning, implementation and operation and maintenance of the ruralwater supply network.
The organogram of the DRWS has been approved by the Cabinet and Public ServiceCommission, but due to the lack of financial resources the actual start-up of full fieldoperations will require a period of 3 - 4 years. The new establishment will actually have littleinfluence in Ohangwena Region. Maybe only 2-3 water extension officers will be appointed forthe Ohangwena Region in order to facilitate and control the development of community basedrural water supplies. There are no further plans for office or other facilities in the region.Therefore the implementation and operation and maintenance of community based rural watersupplies will greatly depend on the activity and participation of the communities themselvesas well of the local NGOs and donors.
The WSSPOR, MRLGH, MHSS and some local NGOs are actively involved in communitydevelopment work in the Ohangwena Region. There are plans to establish an intersectoraldevelopment committee network in the Region. The participation of traditional leaders, churchrepresentatives, political party representatives and different women groups should not beneglected when development or implementation plans are discussed or executed in the area.

21
8.3 Development Programme
According to the selected alternative, the total population of the planning area in the end of2005 will be about 164 000, of which 28 000 people will live in the semi-urban centres. Theaverage population density of the rural area is estimated at 35 persons per km2.The overall objective of the programme is to provide 100 % water supply coverage by the endof the year 2005. This will mainly be realized through a pipe water supply network supplyingwater for 128 000 people, which means constructing further 200 kilometres of pipelines. Partof the supply will be realized through point water supply that is to cover approximately 35 000people in the most remote areas. This will require construction of 1150 water points.
Livestock (10 ha/LSU) and its need of water supply has been taken into account in the pipedwater supply system. In estimating the number of required point water supplies the livestockwas not included. During the dry season the livestock use the same water source with thehumans. In some cases animals are moved to the other grazing areas in the east of theplanning area. If livestock were to be taken into account the number of required point watersupplies would have to be tripled.
The total development costs of the new pipelines will be around 18.8 million N$, of which thecommunity will contribute 1.5 million N$ (8 %). Cumulative operation and maintenance costsby the end of the planning period will be about 17 million N$. It can also be expected thatrenewal of the already existing pipelines will need an investment of 11 million N$ during theplanning period. The development costs of the point water supplies will be approximately 9million N$, with a community contribution of 1.7 million N$ (19 %) during 1994-2005.The summary of the cost breakdown is presented in Table 8.
Table 6. The cost breakdown of the total costs of the proposed development programme
SupplyArea
Rural pipe W/SRural point W/STotal
1994-2005Constr. N$16,110,0005,370,000
21.480.000
Overhead N$1,250,0001,940,000
3.190.000
Comm.Contr.1,480,0001,690,000
3.170.000
Total N$18,840,0009,000,000
27.840.000
Renewal Costs of Water Supply and equipmentItem
Main pipe lineRural poin W/SEquipmentsTotal
1994-2005Constr. N$
9,000,000500,000
1,000,00010.500.000
Overhead N$1,500,000
200,000
1.700.000
Comm.Contr.
200,000
200.000
Total N$10,500,000
900,0001,000,000
12.400.000
SupplyArea
Rural pipe W/SRural point W/STotal
1994O&MN$1,000,000
20,0001.020.000
2005O&MN$1,800,000
200,0002.000.000
Total O&M 1994-2005Total O & M N $
17,000,0001,200,000
18,200.000
f..
22
It has been estimated that the average lifetime of a pipeline is 30 years, and that of the handdug well with a windlass is 12 years. The lifetime of a borehole lifetime is estimated to be 15years. Based on these assumptions, the new pipe lines will not require renewal during theplanning period. Renewal of the existing pipelines will require approximately 11 million N$.However, the old wells constructed during 1980 's by different organizations need to bereconstructed. The annual input for the renewal should be approximately 1 million N$, aspresented in Table 6.
In the beginning of the planning period the piped water supply network operation andmaintenance shall cost around 1 million N$ per year. This amount doubles when approachingthe year 2005. The total expenditures of the implementation and O & M during 1994-2005 forthe proposed development programme are N$ 58 million, and N$ 4,8 million annually.
8.4. Financing of the Development Programme
The current planned input from the Government of France by the end of 1995 is 9 million N$.That amount is supposed to cover the costs of the main pipe line between Omafo and Eenhana(3 million N$), as well as the extension of rural water supply along it, Phase I (6 million N$).Omakango • Onambutu pipe line will be financed by the Government of Namibia, with theirplanned input of 1,5 million N$.According to the Agreement between the Governments of Namibia and Finland, theGovernment of Finland will contribute 11,7 million N$ (1 N$ = 1,7 FIM) for the improvedrural point water supply and sanitation, by the end of 1996.The average annual financing required for the implementation of the programme is about N$3,3 million.
It is also proposed that the possible subsidy is limited to the following:* materials and equipment not available in the local market* payment of building instructors* payment of supervision, overall administration and other overheads* technical assistance
9. CONCLUSIONS AND RECOMMENDATIONS
* The extension of the piped water supply network should be done only if:community's contribution, participation and full cost recovery issecuredraw water and treated water resource capacity can meet the demandall alternative water resources are already fully utilized
* Comprehensive study on the discontinuous perched aquifer to be carried out in orderto define the reliable shallow water potential in the area
* The support for human resources development in the new directorate of rural watersupply and in the communities should be encouraged and increased through advisorysupport
* More resources for the development and promotion of an appropriate and feasiblebilling and revenue collection system for rural piped water supplies to be given
* The self-reliance system for the water point repair and maintenance is to be developedand established
ANNEX 1 . 1/2
10-Mar-94 WATER SUPPLY AND SANITATION PROJECT IN OHANGWENA REGION
POPULATION FORECAST 1993 - 2005
SCENARIO 1
Sub-Consti tuencyEenhana North RuralEenhana North Semi-UrbanEenhana SouthEenhana West
Sub-Total RuralSub-Total Semi-Urban
; : .•:•• Eenhana: TotalEndola EastEndola West
Sub-Total RuralSub-Total Semi-Urban
Engela North RuralEngela North Semi-UrbanEngela West
Sub-Total RuralSub-Total Semi-Urban
m l;M||||||i^Ohangwena East RuralOhangwena North Semi-UrbanOhangwena West
Sub-Total RuralSub-Total Semi-Urban
Ondobe EastOndobe NorthOndobe South
Sub-Total RuralSub-Total Semi-Urban
Ongenga RuralOngenga Semi-Urban
Sub-Total RuralSub-Total Semi-Urban
Oshikango NorthOshikango South
Sub-Total RuralSub-Total Semi-Urban
TOTAL SEMI-URBAN
TOTAL RURAL:&:*!'5;;;i8;^
I19932900230020007100
120002300
^143008100
1120019300
0!i!i!9300;
127003700
10200229003700
1111:26600:710032007100
142003200
&iiiii:74tio;100081009200
183000
i!!ii8300;102003200
102003200
lflii.3400:102008100
183000
i!!!:t83O012400
115200
i§127600!
POPULATION
19953100250021007500
127002500
••!.•:£•;:;, 1 5 2 0 0 :8 6 0 0
1190020500
0iii!205bo
134004100
10800242004100
11111:28300750035007500
150003500
1111*8500:110086009700
194000
iiiiii9:4Oo:108003500
108003500
::|1I|1.:4300108008600
194000
lliltl9400:13600
122000
iii3S60b:
20003500320024008700
146003200
iiiMOo9900
1370023600
01111123600:
155005200
12500280005200
1111133200:870045008700
174004500
iiii2i9oo;12009900
1120022300
0.111:1122300:
125004500
125004500
liiilooo1
125009900
224000
•:!l l !22400
17400
140800
!i!i:5S20O:
2005410041002800
10000169004100
!Ill2t000:114001580027200
0i!i::272oo:
179006600
14400323006600
:il:l!38900100005700
10000200005700
ii§:2S7:oo:1400
114001300025800
0l!l!25800:
144005700
144005700
Il!!2Oi:0Q:144001140025800
01111125800:
22100
162400
lli;84600:ft.
ANNEX 1. 2 / 2
POPULATION FORECAST 1993 - 2005
SCENARIO 2
ConstituencyEenhana North RuralEenhana North Semi-UrbanEenhana South RuralEenhana West Rural
Sub-Total RuralSub-Total Semi-Urban
liil^lPiiiiiKIEOJlitt^iajjjTibltall;Endola East RuralEndola West Rural
Sub-Total RuralSub-Total Semi-Urban
Migration
Engela North RuralEngela North Semi-UrbanEngela West Rural
Sub-Total RuralSub-Total Semi-Urban
Migrationliiiiilillliiili||iIiitEri^elaiirdtal.5|Ohangwena East RuralOhangwena North Semi-UrbanOhangwena West Rural
Sub-Total RuralSub-Total Semi-Urban
Migration«$?$$lt^Ondobe East RuralOndobe North RuralOndobe South Rural
Sub-Total RuralSub-Tolal Semi-Urban
Migrationllittflllllli:^Ongenga RuralOngenga Semi-Urban
Sub-Total RuralSub-Total Semi-Urban
Migration:^i^^^:B^:fllWOhg^nfla:^:^i&iuiiii.|Oshikango North RuralOshikango South Rural
Sub-Total RuralSub-Total Semi-Urban
Migration^Illll^JilillliillOshikanqbis^btal'l
TOTAL MIGRATIONTOTAL SEMI-URBAN
TOTAL RURAL
-
mm
lit
mm
illl!
pill
PIP
$11
19932900230020007100
120002300
::;:::fi4300:8100
1120019300
0
1119300:127003700
10200229003700
^1266001710032007100
142003200
::!i:;T7400i::100081009200
183000
pj|:8300-;102003200
102003200
ili:34bb;102008100
18300
118300
12400115200"1216001
POPULATION
19953000270021007400
125002700
100iiiIii:5300:
84001150019900
0300
:i§iiiii99oo:132004300
10600237004300
300
ilillSSBOOb;740037007500
149003700
100
l i l ipfi 8600::110084009500
190000
200;||lllli:9bOb::
105003700
105003700
200|||f Iff 14200;
105008400
189000
300iliiti;8900:;
150014400
120900•i*1 :3390b i :
IPs
i i i
ifiilf
w§
I P
i l l
20003200380023008100
136003800
40011117400::
92001270021900
0700
1:121:900:145006100
11500260006100
800f§t:321.O0
800052008100
161005200
500ii2i3bb;
12009300
1030020800
0600
11120800115005200
115005200
400§!i:6700:
115009200
207000
700
1120700;4100
20300130600
^50900
2005
3,5005,4002,5008,300
14,3005,4001,000
:!i!!119;70O:9,600
13,10022,700
01,700
||;;;;:||;;;22;700'14,9008,500
11,80026,7008,5002,100
!fi!fl35;200;8,4007,3008,400
16,8007,3001,200
;|||||I24;100-1,3009,700
10,50021,500
01.600
12,3007,300
12,3007,300
900
11111119^600:11,8009,700
21,5000
1,600i!l!|21*500:
10,10028,500
135.800lillT64!300:
09-Mar-94 WATER SUPPLY AND SANITATION PROJECT IN 0HAN2WENA REGION
WATCH SU^PLT AND SANIIA11OH FHUJfcC IIN OHANGWENA REGION
PrajoctAreaConstttusncySub — ConstltuamcyEanharta North RuralEanhana North Sami-UrbanEanhana South RuralEanhana Wast Rural
Sub-Total RuraSub—Total Semi-Ur bar
Migrator•::xxxi-x-x-xxX xxx-:->x x x: :x::x£ajhhana"* ToCai
EndoOa East RuralEndola W ast Rural
Sub-Total RuraSub-Total Sami-Urbar
MlaraHorxx^-xixKxxpwxixxxxxxx x ._- EnoVjtB;: ToCa!
Engala North RuralEngala North Saml-UrbanEngata Wast Rural
Sub-Total RuraSub-Total Seml-Urbar
Mlaratio.zxzitei -:-s: SixKxjfjwi-ixEnjiet*: Tote
OhangwanaEa at RuralOhangwena North Sami-UrbanOhangwanaWttt Rural
Sub-Total RuraSub-To tal Saml-Ufbai
Miaratton••-•:-•- :• •:••••--. x O h a n o w e n a ; T o t e
Ondoba East RuralOndoba North RuralOndoba South Rural
Sub-Total RuraSub-To tal Sami-Urbar
MiqraBori-:-- S* ssi m<*-m Ondctoa:; TotalOnganga RuralOnganga Sami—Urban
Sub-Total RuraSub-Total Sami-Urbar
MiqrarJor
Area
5482
835442
13552
:>x::x>v?:lrSS7
149221370
0
; •:-:•.•:*-•••;• ^70
2113
208417
3
872
87174
2
: >t7a132311293741
0
741225
2225
2
- ixxxi^xxx; xx^x=: l-xxx' ; ionaensa; TotaF xxixxXx '227Oshikanga North RuralOshikanga South Rural
Sub-Total fluraSub-To tal Sami-Urbar
Miqrattor1
". :.::::••...:.:::::•-.:. :':.;... Oshifcartga: TotflTOTAL MIGRATIOri
TOTAL SEMI-UHBAf.
TOTAL RURAL
-;x ••: :?:;•;:;: &"-r-- n i TOTAL
1481412S9
0
XX::XXx289
9
3071
• 3800
Population1993
2900230020007100
120002300
x:*X 14300:8100
1120019300
0
;•?> fxiflaOO:127003700
1020322900
3700
Sxxixxxjeooot
710032007100
142C03200
: - : 17400100081009200
13303O
.XxXXX- 1 8 3 0 0
102003200
102003200
,:Sx:™:Sl340O102038100
18S00
K;xx:™x;i830O
12400
115200
PopuLDemur
peopVkml5 i
11503
187
1150
x x:>:--;:::;5
54151
52o!
;::s::fi?5230
1233SO55
1233
821300
8282
1800
8243125
0
. : -v-.;-2&45
130045
1800
•xSKxx?xix SO
695783
0
.:™:xxX:x:xxflS
1378
30
••---: 33
PHESENT WATER DEMAND 1993
Target
Poulaiioa wrved b»•Pipe W/S
5002200
00
5002200
:x xxxf270O
30000000
itooo0
.:; SSHMOOO750035 00
07S003500
:::x;::i;xx1:t00O20003000200040003000
-:': .70000
40000
40000
4000:2000300020003000
47C010005700
0
™a:xxx570O
11700
34700::;:- 464Gd
Point W/S2400
10020007100
11500100
:x:x::-:X:xi;i800f
510032000300
0
x-.iw-mxflaoo-5200200
1020015400
200
mmaseae5100
2005100
10200200
Demand
m3/dar80.5144
40142
248.5144
• -xx 302.5-
177234441
0
x::r>™x441
291.5222150
495.5222
:x:™x:x:71?S
152192152304192
: - • 10400-t : : ' : : •• 4SO
100041009200
143000
201S2134388
0
:xxXxX:;X t4300-''•• :[[^^3S&
8200200
8200200
214192214192
Demand mettr>
• Pipe W/S I Point W/S12.5138
00
12.5138
483*
40!142238
8
:xxx^X^5Q $ : xx:->x xx>242
75 102!200275
0
:-:xxS:::Xxx::27S
187.5
2100
137.5
210
x:-:ix:x:x:3grr.s
50ISO50
100130
=-?-•• • •: 2 0 O
0too
0100
0
54
1830
-:::;::::.:iii;S.:l88104
12204!303
12
;:x™..j.x:x:;3ao
10212
102204!
12
"V :--:. 218
20S2
184aaa
0
:, ^XxX:X10Of:™x 29«50
130SO
180
:Xxx:X::v>x J ^ Q Q . tx::::: xXx-x-403; 1 xfc:Vixx23O
5S0O7100
12SC00
' XK V : .X :12BOO
700
227.5147
3S4.S0
: :Xx:x::vx:3»4J5
7S0
8OSCO 2403.5
117.525
142.50
•WSKHS142LS
708
OS7.5
'Wif ataoo'x:' 3233.5 • X-1S7S.5
13412
13412
Vx^xXx 1 7 8
110142252
0
•: X::x;XXx: 2 5 2
4218tO
xx xxx 1858
WATER SUPPLY COVERAGE
Population Served by
' Piped W/S300
130000
3001300
^x1flab150040005300
0
•: ':••'•'>• " x x - S S O O
30001400
030001400
:-:-:-•••-•••-. ^ x . ^ - ^ j p
19002 SCO190038002900
••:-•': 0 7 G 0
02400
02400
0
::x-x:-o2W0
1200180012001300
:.X;.;>::::r: 300 (J
450010G05400
0
M~« xx 5400
7400
21300: :290O0
Pain! W/S1400'
o!120033008200
0
- <. < 0200,290029005800
Ql
• : - • • 5 8 0 0 ;
50000
8500.11503!
0-
•A.' IISOOJ
280010
2900iS50Q
o'
: 55001700 i
240046007900
O1
' ' 7900!5040
05040
0
• : 5040'
5040'4 SCO9440
0
S640
a51580
stsoo1
1993Coverage
* - - " • :
• •v y.so
--ii.1S:f-:.i1.STI• • • " s • • : : • • - . s o
• : ; :> :" : ; . : • . • S t
•.•••'•'••~~£::C'--S4
. •;.• :'::•• S 7
• • : . : : •;:• - - " - . . - •
... . S5* , ; :;.••• s *
"-*-'•.•::••'••:-? m&
..'••••-.'.'?-•'-:;$•
.•-.:. Xv.xija
;< • • • • • . : x W
• • •;<• • > : 0 4
••• : * ; : - - : «
.vx1 i i - ::3»' . : • - • . - . • - . : : • . ; : • . • • , .
•-•?•••••••:•'•:"&}
:;"S;;f;:::'83
••^•'•'•'.•••-•.si
'•'•': "• - ! : : : : " 0 O
•'••:'.• ' :.:-:--::-:"'flI5
••;;•,«;-.<f«t
: . : . . . • • . . .70
•-;. :i;x - T O
fC ''x; .' S2X;x-..' .- SO
•xi:1'vS-l-ft 5 0
•"XxxV.iHO
• • - ' • s »
• • ? : - • - : ' . " • • : . "
1jSW::;.¥.!'t:: :x
: . :..••...;.•:;::;•
, . Xv.'OO
..:.. ;- .xv.94
•.."-.• ; S 4 8 9'/•• •-:-, •• 8 2
•V--r. ''< 0x •.•:••-- - - : - •
-:-:• .:•:. "02S':''- Y'xix-Wr:- ••?••?:'• ;. • e *
83
ins t. O IUJLCUIISI
piiliyjf WrrjfljNoWFi
80
50'150-
: • . • • . 2 8 0 (
120'120
. • • • . • ; .X : ;X: : :L -X:K24O
210
270
x"-: xX:ffi-x:::480
110
120
•....-•;.:•::•-:.••.•:: 2 3 0 !
30110'1901
.-- • •:=••.• 3 3 0 !
210!
Xx :-:x>:W:yx2t0-
210190:
• •::•: ••;•*:;?• AW
[ " :-"xx2tS0
01
* Paopia rasidlng < 2km Fron tha pipaiina
0 9 - M a r - M WATER SUPPLY AND SANITiON PLAN IN OKANGWENA REGION
VATER SUPPLY DEVELOPMENT PLAN SEKARIO 1. OPTION IWATER SUPPLY AND SANITATION PflOJEulIN OHANGWFMA REGIONProject AreaConst luencySub — Corst luencvEenhana North RuralEenhana North Semi—UrbanEenhana South RuralEenhana West Rural
Sub-Total RuralSub-Total Semi-Urban
- - ; - " . - ••• ... :: E e n h a n a ; T o t a l
Endola East RuralEndola West Rural
. , Sub-Total RuralSub-Total Semi-Urban
EngeSa North RuralEngela North Semi-UifeanEngela West Rural
Sub-Total RuralSub-Total Semi-Urban
: : •. •• • . • . • : . • • • • - - . • . - E n g e l a ; T o t a l :
Ohangwena East Rural
Ohangwena West RuralSub-Total Rural
Sub-Total Semi-Urban^HwHSKSKsjiBSffis^OfcamjiwertbtalvOndobe East RuralOndobe North RuralOndobe South Rural
Sub-Total RuralSub-Total Semi-Urban
••••••••• I ; , : * . ' :. :--•••• : - O l K f e b « - , . T o t a t
Ongenga RuralOngenga SerrH-Uiban
Sub-Total RuralSub-Total Semi-Urban
' : : : - • • • • • • • • • • • ; : : - . - ' 1 . O n g a f i g a ; T o t a l :
Oshikango North RuralOshikango South Rural
Sub-Total RuralSub-Total Semi-Urban
-•:•->-:;.:,-:••, .™: ,-r:,v.-' O s M u n g o : Tota l
TOTAL SEMI-URBAN
TOTAL RLRAL- * - ; • : : : . : . : •. •-•:, •: Vv •-::-•: . . : / . : > v T O T A t
Pop.1^y«c Ponalitiafl T3e£*ir*
hnl
5482
605442
1,055
yjOS t O.*BI24.0004.1002.900
10,00016,9004.100
:i.BS7- 21.000149221370
0KSWD
£113
206417
3::420
872
87174
132311£98741
0•:-;*74t
2252
£252
KK227;148141289
0s::::2ao
9
3,8713.86O
11.50015,80027.300
027.30017,9000,600
14,30032.200
6.60038,80010.000
5.70010,00020,000
5,700£5.700
1.400tt.SOO12.90025,800
025.80014.3005,700
14.3005,700
£0.00014.30011.50025.800
0
7^ 0 5 0
4£310
2,050
777174
0
•iiiff*1.485
£.200es77
2.200^ 92
115£.850
115115
2.850
113743350
t ;™:3564
2.85004
2.850WSM
978289c
25.800 |BS:S»:»9
22.100
1S2.300
184.400
2.456
42
^ SS54B
WATER DEMAND 2005 i EXP. WATER SUPPLY C O U R A G E1 20OS
Tirjti Denad I D i n i d n i BY
•PfeeWfl 1 PiumW.Sl ciW»» { o3*k<SOO
4.1001.1003,0003,9004.100
W 8.00011,50011,90019.400
01O.40O13.0000.600a.soo
14,5006. BOO
v::2i.ioo10,0005.7005.300
52.300S.700
18,000SOO
It.50012.90016,500
0
:::iev5oo5.0005,7005,0005.700
: siotfoo14,30011,50021,000
0:ifi21,00C
22,100
92,8008114,700
3,2000
1.0007,000
13.0000
13,0000
3.9007.900
0:v7.900
4,9000
11.80017.700
0
17.70000
4.7007,700
0
•VST.7OO
60000
9.3000
0.3009.300
09,300
09. SOO
00
4,8000
SASOO0
09,70069.700
54
642153 S324«
6 0 0
288376743
0•: 743
423396150742398
1,138250342£27537342
s:;:a7932
£08323618
0
20246
75123245
K3O9288
5850
S..SBS3£S39883
38639«784250342133383342
£0288323030
0(=>:-• tflAJw-: 830
311342311342
358288741
0::j!.74Ji:1,320
4,2525.578
125342125342
Bj5«jr
358288045
0::K*tS1.3282.8784,204
0410
36140240
0;;*24b
078
1580
:-::i'sa96
0230354
0354
0a
94154
0S4SS4
1200
1860
tea180
01 M
0::M86
00
960
moo0
1,374•:ii374
FopthikaSemdBr Coonje | N°E*.
• PipadWS | pM ,VIS800
3,9001.0002.9003,7003.900
:?:"7.soo10.90011,30022,200
0: 22200
12.4006.300£.400
13.8006.300
2O.10O9,5005,4005.000
11,700S.400
80010.90012.30024,000
024.000
4,8005,4004,8005.400
10,20013,60010,90020.000
0iK2d.O0O
21,000
100,200121.200
3.3000
1.9007.100
12.3000
12,300900
4.5005,400
0'•' 5 .400
5,5000
11.90017.400
0
17.400800
05.0005,800
05.80Q
800SOO
1.4002800
0: 2.800
9.500a
7.7000
• 7 .7005,0004,6009,600
0. : 9,800
0
81,00081,000
* ',103
• 95103
''. 100••'.'.'•• 9 5
:' ]" 95./:., 95
: •- .103100
. . 1 0 1" . • • • ' ' o
.101
&
••'• . 9 7
:.... toa
•:•::,' « g
: 100
'•;;.::ioo
, 100: 100
; • . • • " ' • «
• ••£$ 8 7
••<••::-'-'-as
- • : • ; . - 9 0
•*;::::.»35.••;.-.: joo
"::.--":v 0J: 100
(,WTt
35
3S
. 7 1120
12DJ
:• 0
110
••• 1 1 0
30110190
330,
.•: "• O
210190
• 4001
1,031
KVELOPMEKT P R O G R A M ! * FOR RPWS Q19O4 — 20O5
?n>»»iwdii | rsorarr COSTS
SoiTiIH100 25
mice 14SHSO I I S
. : 157
V. bn 188
" < 18Sv . b . £30
v.ko 495
725
V.ka 210
::-" mam1KB 8
• • • • • . :-. .;• 8
V.ka 395
•• - 'ffiKass
.• " • - . - - : - > • • • • o
Caaiir Nl757.500
439.8001,770,030
2.987,300
488,800
48B.BO0598.000
t.287.000
1,885,000
546,000
.- -548.0009a ooo
90,0001,027,030
::1.027.000
••• . . ' . . " • : • 0
::"- " LOSt): 7,004:100
O i « M Overbad Nl12.500
7,00059.000
S78i50b
18.800
•;S*8.soo'23.000
4S.S0O
:::72.soo
£1.000
S21.00O3.000
: 3.00039.500
30,500
••.:.:,:•-:• 0
233J0O
47.500
£0.600224,200
:•:•:•• 2 3 8 : 3 0 O
357.200
K:iSS7.2Oa'437.000
940.500
1^77.500
399.000
:::3ae,ooo-1t,400
:•- 11.400750.500
C m n
LjaborSt45.000
25.200212.400
>: 262,000
338,400
338,400414,000
891,000
1JOS.0O0
378,000
msnjxo10.800
:: . 10,800711.000
: s:7S04oofe?;s7ii ,000
•• ::i .-- : V: - o
3.10a^00t 3,025,800
DEVELOPMENT PROGRAMME FOR R P V 6 N Q Q1994 — SODS
5038
15to
SS 25
• 0
10
76354
: 124
.; •• 0
31IS
•.::''.47
294
PROJECT COSTS
Ca.«f,NJ
3.800,0302.688.000
8.088,0001,140,CO0
760,000
^,900.000
• v :•:•.•• 0
760,000
^•780.000532,000
4,708.0304,104,000
' 9,424.000
•••:• • -:
, " , <:
, 0
2.356.0301.216.0OO
3,572. OOO
i22.344.00O
OiHSJ
1.625.0301.23S.0OO
2.880,000487.500325,000
SS812.S00
•••- • : - . 0
325,000
325.000£27,500
2,047.5001.755.000
4,030,000
- ' . : - --• ••••,&
1,007.500520,000
1.S27.S00
0.555.QOO
OwriodNt
295,000224,200
wS19,2O088.50059.000
i|47J50O
- .,.-,;. . 0
59.000
41.300371,700318,600
::i.731,000
::,... •:,....:.;O
182,90094,400
. . 277.300
1.734.800
C o m
UaborMI
350.000266.000
-ss««fcoob105.00070.000
Wt 75.000
:., ,.:... . 0
70,000
•SKiTOJW)49.000
441.000378.000
K 868.000
. • : : - : •: 0
£17,000
niooo
".;.; 329,000
ZOS8J30O
* Peop la residing < 2km Iron Bw ppalna
"TheraareSS, 130 and 30 omafima*. dungus and welis Inthe areas ol Sub—Constituency Ondoba North, Oshikango North and Oshikango South respectively.These water poirts can be utilteed tor cattle, vvhen the secondphace of the new rural pipeline tram Omafu to E anil ana is operating.
d Rural Poirt Water SupplyQ Q Rural Pipe Waier S t i l l y Nerwwk

09-Mar-94 WATER SUPPLY AND SANITATION PROJECT IN OHANQWENA REGION
fATER SUPPLY DEVELOPMENT PLAN &CENAR|O 1 OPTION 11WAIbft SUPPLY ANO SANITATION W4CJECTIN OHAMAWENA BEGSOMPrejactAraaCamtt inncr
Ewhana North fluralEanhana North Sami— UrbanEinhana South RuralE«nhanaW«u Rural
Sub-Tataf RuralSub-Total Semi-Urban
EndolagMtfluraiEndola Waal Rural
Sub-Total Rural•» Sub-Total Semi-Urban
:: ymmmmmmm- Endota; total:Engalt North RuralEnoaU North Semi-UrbanEnotla W « t Rural
Sub-Total RuralSub-Total Semi-Urban
Ohancwena Eaat RuralOhangwena North Semi-UrbanOhangweria Wait Rural
Sub-Tout RuralSub-Tatal Semi-Urban
v.;:.: • •:•-.< -.;-• • '•:•: •. '••:•:.:•.. ].. O h a n g w e n a r T * * a l ' '
On dob* E u t RuralOndoba North RuralOndob* South Rural
Sub-Tota l RuralS u b - T a t a l S»m! -Urban
. ' . ---:. • ":•.•:•!••& O n d o b * : Total
Ongenga RuralOngenga Sami -Urban
Sub-Tota l RuralSub-Tota l Sami -Urban
. ' . " :' • •'• - • On fen^aVTc&r i
Oinikari 90 Nortn RuralOshikanjo South Rural
Sub-Tota l RuralBub-To ta l Saml -Urb»n
-•" . • . - • . . - - - • • OeNfcangb; Tota l
T O T A L S E M I - U R B A N
TOTAL RURAL
1 1 1 . " : > : ! - - - ' i 1 1 : 1 : 1 - • • : : : . " : i - ! ' • : '.•••:'•'•['•I:'-.' •
f o p *
2as442
1.9952
a»4,0004, tOO2,900
10,00018,900
4.100
149221370
0M W : - 3 7 0
2113
206417
3
672
87174
a
11,90015,80027,300
0:s:iaryob
17,9008,800
14,30032,200
8.800
;K;S38.*oo
10,0009,700
10,00020,000
5,700: : : ' 17SL- -25 ,706
t32311294741
0
7 4 1
2252
2252
22T
148141239
0V:'2S3
a3,971
a.sao
1.40011,90012.90029,800
0
:••;:;• 25.800
14.3009,700
14.3008700
2,0904
2310
2.0501
777174
0
892.200
9977
2.200
sisaa11S
2,890119115
2.850: -149
It374335
0•:• • •?• • 3 5
642,850
842.850
-" 20,000 [ SS
t4,3C011,50015,400
025,900
22.100
182,300
: Y184.4CC
978289
08a
2.4SS
42
: '' : 48
WATER DEMAND 2009
Tup! Dnaad
BOO4,1001,100
1002,0004.100
11.50011.90023.400
023,««13,000s.aoo2,500
15.5005. SCO
3,2000
1,8009,900
14,9000
::n.9co0
3,9003,900
03.9004,900
011, HO18,700
0
100248
73250423248
B : 80S
2983958S3
0:;:::;:>:-;>:883
448398190809398
: • s 22,1 oo |: sia^oo t»t, j»r.10,0009,7009,300
19,3009,700
00
4,7004,700
0
• z i .ooa i :4.70o800
11,50012,90025,200
0: 29.200
9,0009,7009.0C09,700
80000
SCO0
: 8009,300
09,300
0: 10,700! 9,300
14,30011,50025, aoo
0: 25.300
22.100
112.200
:0
' • • ' • • • v - . O
0
50,100
250342250500342
' 84239
288323845
0- '845
358342358342
DxualMtr
29248
293
50248
::SB29»284298559
0-:;4S5S5
32939883
388398
::-::»i7S42503421333*3342
.-•:-7»20
288323830
0
830129342125342
800
48'248!373:
o'
098
M o
1230
29541S
0
;:i:::::4.is
00
118118
0
•• . • •118
1500
150
. ":: IS233
0233
0
• ' ' TC0t 487J . 2 3 1
3S82aa845
0
•:::::-"i S4S
1.328
4,058
1 3 4 . 3 0 0 \ "• SO-.tdcif • : - i : 5-3»4
3592986*5
0
:::-:::"-S4S
1,328
2,805
: 4.131.
0000
0
1.253:-:;i,2si
EXP. WATER SUPPLY COVEftAGE200S
tvf+°—**"**&! Coarap
8003.9001,000
too1,9003.900
SfflSii,8O010.90011.30022,200
0S 22.200
12.4008.3002,400
14,7008,300
:::ss2i,ooo-9,5009.4009,000
14.5005,400
1»,9OO800
10,90012,30024,000
024.000-
4,3009,4004.8009.4CO
FsalWJS3.200
01,9009,900
15,0000
15.000900.
4,5009.400
0:S.40»
5.5000
11,90017,400
<!
17.400800
a9.0005.S00
0- S.SOtt
800800
1,4002,800
02, SOO9,500
09,500
0"1&,200i "- 8,500-
13,80010,90024,100
0
::2+,500
21,000
108,800::i27.5<»
1,5001,1002,500
02.800
0
98,500
5S.5QQ
''•:•• :;::':::::::::':I:-;::I::
1^>':
>:s:»•: :-,104
- i'jftOI•;--.::.::--.s»
• • l o t
"• : • : : - • !<»
•.JStbC
••*• : • • * • »
• • • • • • • .9»
:-..::•.«»
'w»s
.i'SSOO
.•S: J 99. : • • • • • ' t O O
::••::•:;: t »
"jam::::St0«•Sstbo-••••&?; o
•s 1OO.-:::":.::::B»
-jj'-iioo"."•'••••• : » 5
• . ; • : : • •»
".•,:.10»<• . - t o *
•: ••too-
. •«•<»
• :ioi
S . E l
2S
3540
i lOO
120
m>10
1011(3
. ;11»"
110190
300
'. -<H210ISO
:380
1.000
OeVELOPMENT PHOGBAMWE FOfl RPWSW Q1904 — 900S
Mo WTini« 29
IHLM 14IH« 150
•:!,::::.;.;:-.;t99-
*.:»• 189
:s:SiB>:t8aV*,, 225
V-kui 495
..••720
>k i , 210
: • • • : " * t o
IHM 10
- : -(0v.lui 395
. • 399
• • : . 0
:"•' • 1 . T 2 3
ntoxBcr COSTS
379,000
429.3002,400,000
•J. 204.900
491.400
;™»at,4oe585.000
1,287,000
1.472,000
948,000
-. 540,000
150,000
0
: - 150:000
1,027,000
OftUNI12,500
8.40080,000
SiQO.900
1S.90O
22,500
49,500
mtvxa
21,000
::::-;:2T.00O:5,000
0
: s.ooo39,500
-1,027;ooo |j:;s*"3s>. SOO-
0
• . • •• • 0
7.291.200
0
•:• , O
257.300
47,500
25. SCO304,000
:s;i?:37s,toa
399,100
SS3M.MO427,500
•40,500
isi.issSos
399,000
ssasftooo19,000
0
v*>19J»0750,500
::--S:750JO0
0
Q
». 273^700
C a m
35,000
21,000224,000
S>2S0,i»O
340.200
:SS940,2(»409,000
89t,000
::s^9«,ot»
373,000
:::i:::S78,eoo-14,000
0
: "•:: U.ooa711,000
7tt.O0O:
0
•, . :, 0
3.019^00
0€VELOPUNtcr PROGHAMUE FOR HPWSN Q Q1994 - 200S
g»
IS
•sas1510
« :2S
SSf'ft10
78345
its
• • • o
3116
47
2 t 2
raOJGCT C O t n I Caaa.
1.140,000
>-1i140,000
1.140,000780,000
n.goo-.ooo
780,000
932,0004,788.0003,420,000
: 8,740,000
-.. :-..(
2.354,0001,218.000
-" 3,572,506
ie.ti2.ood
487,500
v::;: 457,500-487.500325,000
i«i*12,5Q0-
325,000
4:i?»as:i9oa227,500
2,047,5001,482,500
3V737,50O
• • • • • : . . , , ; i d
1,007,500520,000
1,527.500
S. 330.000
88,900
84,50099,000
::S*14>^00-
•immmit59,000
;:::::%:59>QO0
41,300371,700289.500
•i:S78.500
•: 0
182,90094,400
• 277,3M
t. 250,800
105,000
::::109,OOOI
109,00070,000 •
:ss:i75.obo!
7o,ooo:
49,000 i441,000315,000
809.000 i
0 '
217,000 i112.000
•-329.000!
1.484,000'!
* P » p t a rasdSng < 2Hm Iron 6ia pipafln*
* * Thtra tra 95 ,130 and 3 O o m a f l m u , ^urtgut and w t l s in tfr* anas of S u b - Constituency Qndoba Nonh, Oshikan<;o Nordi and Qshtkango South raapactivaly.
Th*sa w itac po'ine& c%n b * utatz«4 for cant* . * h » n th» s 4co n d p h a c a o f l h a n a w r u r a l p'tpaloi* from Omafuia Eanhanaisopcrattng.Q Rural Point Water Supply• Q nural f*p» W»ar Surtpty Network
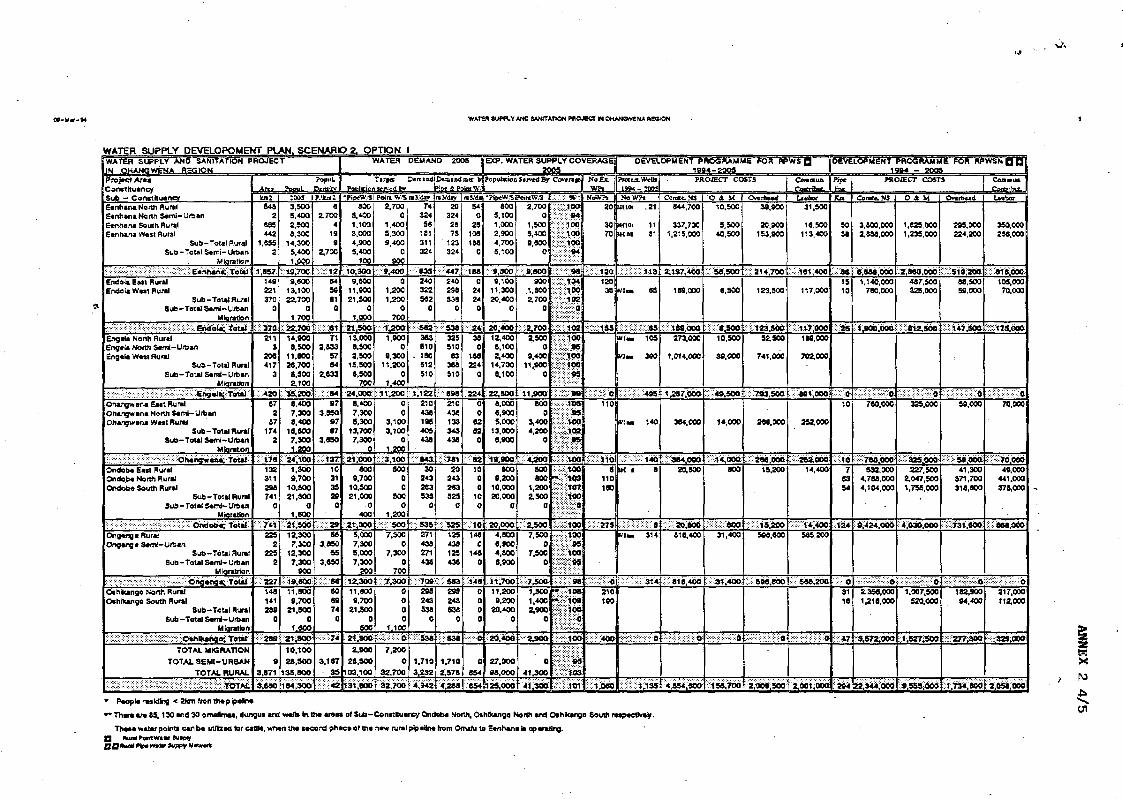
WATEH SUPPLY ANO MMrrATWN PPOjeCT M CHANGWENA BEUOM
WATER SUPPLY DEVELDPOMENT PLAN. SCENARIO Z OPTIONWATER SUPPLY ANO SANITATION PROJECTIN OKANGWE^A REGIONProject AreaConstituencySub - ConstituencyEanhana North RuralEennant North Semi- UrbanEenhana South RuralEenhma Wast Rural
Sub-Total RuralSub-Total Semi-Urban
Migration
¥ :. . •'••'.••• E e n h a n a : T o t a l
Endola East RuralEnooia W « l Rural
Sub-Total RuralSub - Total Semi- Urban
Migration
m wmmm «Bndoia;:tot»t:Engela North RuralEngeta Honti Sam'-UrsanEngela WeMflufal
Sub-Total RuralSub-Total Semi-Urban
Migration
•&*ZZ&:.vpmx£zfv8?tfMHi4w!ttii&:
Ortargwena Eut RuralOhangwana North Semi-UrbanOhangwena Weat Rural
Sub-Total RuralSub-Total Semi- Urban
Migration
^^mmmif-mm-dhinsiai toiaiOndoba East RuralOndob* North RuralOndobe South Rural
Sub-Total RuralSub - Total Semi- Urban
Migration
- . : i - " •"•:•• . • • . " Q n c t o b < T o i » i :
Ongenga RuraiOngenga S e n t - U r b a n
Sub-Tota l RuralSub-Tota l Semi-Urban
M'gratrion
:,"":" ''•::i .".-.-.-• Ongenga;:T6tai: ::
OarXcango North RuralOahikango South Rural
Sub-Tota l RuralSub-Total S e m i - Urban
Mia rat toniSESHEsSfjaa^JSHO^Bta^oiTotar
TOTAL MIGRATIONTOTAL SEMI-URBAN
TOTAL RURAL
?:•; •••:[• - y ^ - - 1 -: :•;;••' v A r - T O T A L '
k n :548
2665442
1,6552
1,657149
221370
0
SBMO-211
3206417
3
K::*20
672
87174
2
s;::i78132311298741
0
: : 7 4 t225
2225
2
s:\a27148141289
0
: 289
«3,871
3,660
PopuL
PopuL
:oo5 ip.'t™:3,5005,4002.5008,300
14,3005,4001JXX)
•13,700:
9,60013.10022.700
01.700
::22,7QQ-14,9008,500
11,60026,700
6,5002.100
*s,20b:
8.4007,3008,400
16,6007,3001.200
i 24.100:1,3009,700
10,50021,500
a1.600
ivit.ioo12,3007.300
12.3007.300
900li.SOO11,8009.700
21,5000
1.6002t;S06
10,100
28,500135,600
164,300
a2,700
419
92,700
mis64
5*81
0
SSKM71
2.6335764
2,833
;;Si:W97
3.650S787
3,850
i-s-tar103135290
iSS-S*55
3,65055
3,650
K S S W
606974
0
rwS74
3,18735
4 2
WAI t~H DEMAND 2005
Paulffior•PipeWfS
8005,4001,1003.0004.3005,400
100
10,3009.600
11,90021,500
01.000
21,50013,0008.5002.500
15,5006,500
70024.000:
S,«007,3005,300
13,7057,300
0::2i,ob6
8009,700
10,50021,000
0400
:2ii0oo5,0007,3005.0007,300
200
TlTiStefvrd bv
2,700
a1,4005.3009,400
0900
S 9,400
01,2001,200
0700
: ii^OQ
1,9000
9,30011.200
01.400
Kl 1.2000
03,1003,100
01.200
SS3.100:
50000
5000
1,200msoa
7,3000
7,3000
700
12,3001 7,30011,8009,700
21,5000
$002f.50O
2,900
26,500103,100
(31,600
0000
1.100
7,2000
32,700
32,700
Denlsd
nl'dv74
324
56191311324
:635240322582
0
582:383510
. 150612510
1,122210438195405438
30243283535
0
;:s:$35271438271438
::;:;709295243538
0
™536
1,7103,232
4;»«
Dentind mcc bipe ± Pis3fd»
20324
2875
123324
.::::447240298538
0
538
329510
63368510
e «210438133343436
*:S;Mi20
243263525
0
S:525125438125436
5S3
295243$38
0
538
1.710
2,578
4.288
mj'd.54
026
106168
0
MBS
a2424
0
H-S*38
0186224
0
2 2 4
00
62620
1000
1C0
5:101146
0146
0
140
000
a
" * : « *
0
854
654
200SPapulMioa Served B* Coven ge
•PtpcW.'S;
8005,1001,0002,9004.7005.100
! »,BOOS.100
11,30020.400
0
20.4OO
12,4006,1002,400
14.700
8.100
22,6008,000
6,9005,000
13.0006.900
1S.90O600
9.20010,00020,000
0
20.0004,8008,9004,6006.900
: tt.70011,2009.200
20,4000
;: 20.400
27.00098,000
S 25,000
2.7000
1,5005,400
9,6000
0.8O0
9001.6002,700
0
:::2.7oo2,500
09,400
11,9000
11,900800
03,4004,200
0
s::<2oo500800
1,2002.500
0
E2.5007,500
07,500
0
7.500-1,5001,4002,900
0
S'«,SOO
0
41.300
41.300
: ».-' lOO.' : 94: ioa!.-100
:;:.:-, 100• • - • - • • • «
: 94.:;... 104
: 100• • • • 1 0 2
••:: • - • - : ; : . 0
v. :--:": : : : :"/ ' .
..:,.1O2MOO
• . • • • - : - : ,«$
K-100: • : . • : • -100
:- :'':::. '-95- • - > ' - " . "
.?.; 99
-.-... 105-." h:.::aS
: 100v.s.ioa
..:•.".:-; : . « J S- . . ; ' • ••.:•'.'..'.]
• . • • ' •WO:.:-; 100•*- '-103.-:-": :1C7I .; y .100..JKfi-l'O: : : . - . • : • - -
.-.••: 100
-.:•,. 100• . • • • : : • » $
.;:•. 100
. ; - :->;: :• ;• * 5
• : : • • • • 9 8
r«;r'iofl•: :S::'1OO
". ?!'?? 0• • ' • : : - • > • • - - . -
:;'ioo
.:::j:::>:95
-•'103
• •'• i o i
/ERASE;
No El.WPx
So*Ts20!
3070
120120
35:
•'••:•;. 1 5 *
1 "?..$ 0
110
'•"•••• 1 1 - 6
5110180
• • • • - S 7 S
• • • • ' • • 0
210190
.400
i,oeo
DEVELOPMENT P HOG HAM ME FOR RPWS Q1994-2O0S
Praea.Wcllt199>4 - 7005
N0WP1
iHlf . 21
Win 115H»0 61
. 1t3
Wlm 65
••mmf;»i-vlai 105
ta 390
BSSjEfJliS!
Oia 140
:iv:;s;i4d:H 1 8
•••'•'.!•'••• 8
V I . 314
. 314
WmmSo
" * ! ••'•%.!»
PROJECT COSTS
Conn. SI644,700
337.7001,215.000
2.1*7,400
169.000
:: iss.ooo273.000
1,014,000
i,2B7;ooo
364,000
384.00020,600
20,600616,400
816,400
msm 0
4.454,800
10.500
5,50040.500
•se.soo
6.500
::;:s;:a>.5oo:
10,500
30,000
;: 49.500
14,000
K14,000800
- • : • • . • : 6 0 0
31,400
31.4OO
mmm
•H4»;7OO
Overheiit39.900
20.900153,900
s: 214.700
123,500
:::l:-t23;S06$2,500
741.000
- 7M,50O
2H.0O0
::M«,OOO15,200
^_ 15,200598,800
Camciuarjoirrtbue-tjuboc
31,500
18,500113,400
s ji61,4OO
117,000
^s:ii7.ooo169,000
702,000
891,000
252,000
:K»S,6bb14,400
:«::t«,4oo565,200
g: 598,600! :585,2ml,
m mat
2,O0«,iO0
Wmimi
2,001.000
DEVELOPMENT PROGRAMME FOR HPWSNQQ1994 - POOS
KpeIfne
E n
5038
1510
SS2S
::¥?:'*10
S!;:t6:
763$4
t:t24 :
e3116
PROJECT COSTS
CanBt.*a
3,600,0002.896.000
e.asa.ooo1,140,000
760.000
1,900.000
780,000
™:7«iy>oo:
532,0004,768.0004,104,000
9,424.000
-- :--;: ft2,356,0001.S16,000
?3t,sft;boO:
O * M
1,625,0001,235.000
2,860.000
487,500325,000
S: 612,500
"-::::::::::r;:'r:r:r::::O
325,000
wais^od:227,500
2,047,5001,755,000
4,030.000
• ;.-::-- 0
1.007,500520,000
;::i,S27i5oo
•^sssSbo
Overbeid
295,000224.200
;KSi9;200:88.50059,000
ssi*7,iK»
59,000
s5S'j».bbb:41,300
371,700318,800
:-s:73i:,«oo>
. -i':"1t182,90094,409
;K:277i30dr
^TiiVioS
CanoLUL
Utltor
350,000256.000
::::«i6.ooo:tos.00070,000
BstlSj.OOS
SSffiSSiBiJ70.000
*;:™w.o6o49.000
441.000378,000
:K: Sea,000
• \ , . 0
217,000112,000
2,ose.ooo
* People residing < 3tm tron tr* p pe«n«
• * There a n 85,130 and 30 omaftmaa, dungut and wellt ki V* a re» ot Sub-Con«nuere/ Ondoba North, OthStango North and dhkango South
Theea water point) can be utlbed for carua, wrwi the (ecord phece ol tti« new rural p? aline from Orralu to Eenhana a operating.
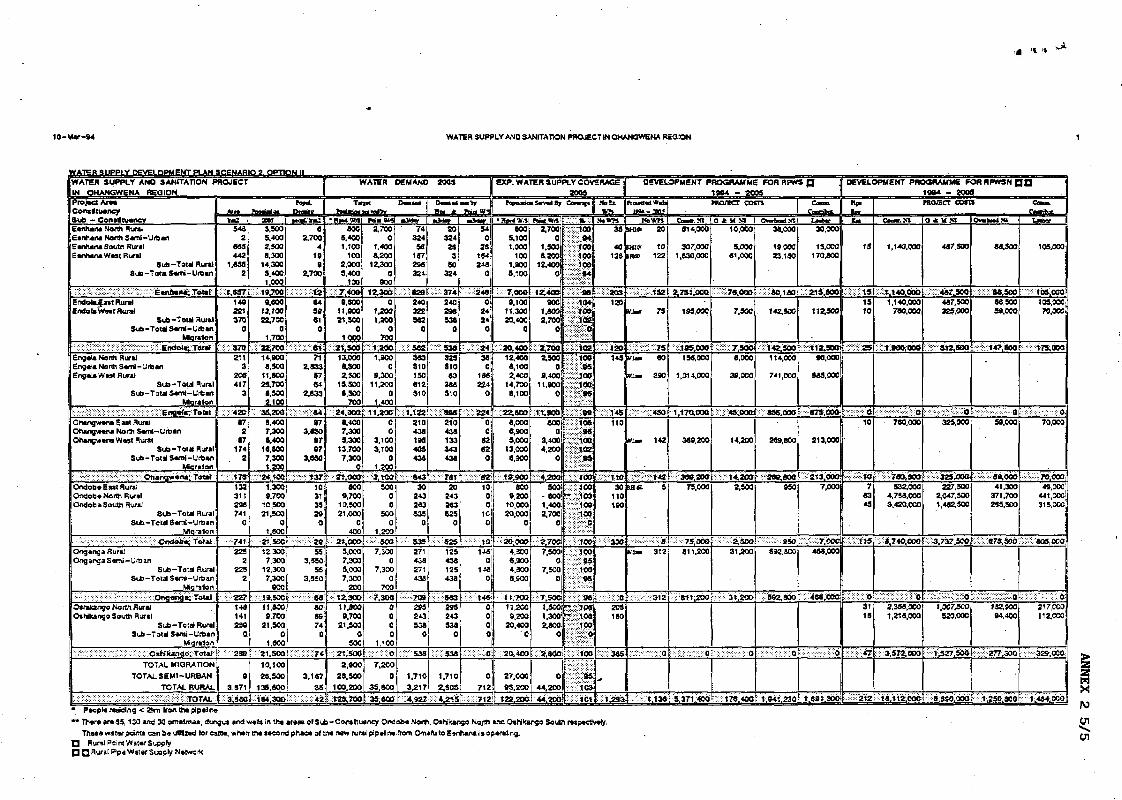
;» '* '* U
IO-Mv-94 WATER SUPPLY AMD SANITATION PROJECTW OHANGWEKA REGION
IATS-R SUPPLY DEVELOPMENT PLAN SCENARIO 9 OPTION IIWATER SUPPLY A N D SANITATION PROJECTIN OKANGWENA REGIONProject A n a
Sub - ConattaMncvE*nhana Nonh Runtiantwna Nonh S*mi-Urban
EenhanaSoutnRurali e n h a n a W « t Rural
S u b - T o m RuralSub -Total Sami- Urb an
. SJSKSBiiSSIiis^vJ; ="; E a n h M i ; Total=ndolajait RuralindolaWeat Rural
Sub-Total AuralStx) -Total Semi -U*an
Mtaraton• mfsmi'm mmimm Endoi«; TotalEngetaNortt RuralEng«l« Norti Semi - UrbaningaHWest Rural
Sub-Total RuralSub-Total SerrK-Urban
Mgrafon
isSrSfSSSSSSS^SfSSSsS'E n g i t i ; Total'"QhangwenaEaet RuralOtungwena Nor}) Samt-UrbanOhangwenaWsst Rural
Sub-Total RuralSub - Total S*ml -Urban
Mqraion
:K™S:SSSS«: - :KSSOhar^«n«:Tota t
Ondob* East RuralOndob* M o m RuralOndob a South Rural
Sub-Total Rural
Moraion
^•:^;-yss::sS:sS•:^;i•s::S:SJS5:ondo•|i»•••Tota^
Ongenga RuralOng anga Semi - Urb an
Sub-To W RuralSub-Total S*ml-Urban
Mcraion
j ; : - : y-::::i:mM ^MiiiW:: Ong«no. a; To ta l
Oshikango North RuralOthikango South Rural
Sub-Total Rural
Migraion
SSs-SKSHHi^VSJJjiS-S-fOiWJiin^oLTotat"
TOTAL MIGRATION
TOTAL S E M I - U R B A N
TOTAL RURAL
• People rasedng < 25cn rronlhepipelne
54s2
805442
1.3532
:VtttS7.149221370
0
::::::S::S70211
3208417
3
: 5:8420;87
2• 7
1742
••••; • t T s -
132311293741
':-• ;74.1
2252
2252
:S;:i:22714S1411S9
: ' ass
s3,871:3.sao
-
3,5009,4002.5008.300
14.3005.4001,000
;::i9.7009.300
13.10022,700
01.700
:S 28,70014.900
8,50011,50029,700
8,5002.100
• 39.2008,4007,3006.400
18,3007,300t.2C0
"2*,*0O1,3009,700
10.50021,500
1.900:;-:21,5S0
12,3007,300
12.3007.300
900J*jg. , 500
11,8009,700
21,500
1.300-21.500:
10,10023,500
135.300I 184; 300
a,2,700
419
92,700
•.:?:S::S>12
:
8499SI
0
KfSSs5; tri-l l
2.533S7S4
2,333
•Hsa-jiin97
3,880S797
3,350
: V::-:: f i t 3710313529
.KSSSKJ959
3,35055
3.S5O
KS :S:SSS8
ec9974
:S:-3SK7«
3.1371 35
WATER
T»
8005.4001,100
1002.0003,400
too:K:K :7,4C»
9.SO011,90021,900
01,000
ssat.soo13,0008.S002.500
15,5005.500
TOO::?24.fx»
8.4007,3005,300
13,7007,300
0: 21,000
8009,700
10.50021.000
400
: :2t.0OOs.oeo7.3005.0007,300
200
;;f12,3O011,8009,700
21,500
900:JS2t.S00
2,90028,500
100,200••(23,700
»«
OEM A M )
Ihuaf
2.7000
1.4008,200
12,3000
900
12.3000
1^00t,20O
0700
::""H(;20C1,9CO
09,300
11,2000
1.400:ii.aoo
00
3.1003,100
01.200
• :3 , ia6500
00
500
1.200
7,3000
7,3000
700
-:- 7,300000
1.100
m o7,200
0
35,900
74324
5S1J7298324
JS : i«2O
240322542
0
:maei383910150812510
4E1.122210438199405433
: 843
30243233535
:•?; - 53S271439271433
£99243533
:;:>-5>53s
1.710
3^17
* • There are 35,130 and 30 omalmas, dungus andwefein the area* olSub-Con»ftu*ncy OndobeNort
2003
2032423
350
324
:.;:W: 374240298533
0
::iVS3ft32591083
383510
•mass210433133343438
'•':':"• 7 8 1
20243233525
S::5 S2S125438129438
293243938
53S
1,7102,909
;:s:4,2«
S i0!
2315*'2*3-
Oj
: JS248
02424
0
380
1M224
0
"• S 2 *00
•2020
.•S?S2
1000
10
:S::;s::ia143
01*3
c
:.fS:-:-t4e000
SSiO
0
712
' ;:;•*•; 7ii 2
£ X P . WATER SUPPLY COVERAGE2O0S
• Ftpnl V,t300
9,100t.000
1001.9005,100
: 7,0009,100
11.30020.400
a
20.40012,4003,1002.400
14,7005,100
: 22. SCO8,0008,9005,000
13,0003.300
: .13,900SCO
9,20010.00020,000
;::j;2o\obo4.SC0S.9004.3008 3CO
I ::it.7.o»11^00
9.20020.400
• 20-, 400"
27.000! 95,200[ t2J.20O
2,70010
1,5003,200
12,400!0J
11,4009O0i
1.3002,700)
0
:: 2,70012.500
ol9,400^
11.90010
11.900800}
a3,400|4,200
0
:-H4,200500
- 3001.4002,700
S 2,7007.500
07. SCO
0
37.S00.1,5001,3002;soo
;•;;• 2,300,
44,200
44.200
, Oshtfcango No.nh and Oshikango Soutt
Th«av>atar points cana«utllzad (or raw*, when the second phac* ol th* new rural pjp»ln«frcm OmafutoE*nhanaiiop*ralr,g.
•• " %
••:•, . 1 0 0
: : ? • ' • * *
1 0 0100!
:, 100•:::'::;. 94!
'••• M
104:-;"iooi•;-:.ioa
• : • : • : : : : • • - : - .
.:-S-1ffl.100
...100!--:-- 100-"••• : . : '95
• . • ; . - ; . -
: M10s;'. gg,;
:" "•< -"(flff
"••:>:"ft5• . : - - : - ;
1 0 0
100f* X10J
:.10S
: 100100
• ••-. 9 9
•100•••i-"95
9ft
••.A . 1 0 *fT'-::108
,:::3«'
100
- - - _ " • • v
;.::,:95V 103
101
35
40123
: 203!120
, 120:145
- 145110
• • • • • 1 1 0
30110190
' ' 3 3 0 :
• • v c203130
- 38S
1.293
1 r«p«cttv*ry.
OEVELOPMENT PROGRAMME FOR RPWS Q
NgWB9Ht<K 20
tUlfr 10ma 122
sKsfiisa
Vim 75
/I— 90
BJ— 390
i:;-:>::;;4»
ivi» 142
j:sss;*4aIHA 5
iim 312
:;;;;•; .JJ12
-V^iWSSS^O
;:iCtif3»
1994 - 2005ntorscr com
Com. SI814.000
307,0001,330,000
2.75-5,000.
199,000
4199,000154,000
1,014,000
1.176,000
389,200
3SB.20O75.000
:i;s7S,ooo911.200
SiSti .EOO
10.000
5.00031,000
•::::rSi76\0QO
7.900
a.ooo
39,000
;:::?¥:4s;ooo:
14^00
33,000
19,00023,130
:S-S*0.1;80
142,500
-•S;i4S,9»114,000
741,000
• SSS.000
219,300
2,500
SiiSf 2,50031^00
' i i : " 31,266
950
::;:K:s5:95oS92.3CO
:S:592,9bO
::sss;s-Sf:o
5'. 371.400 \ 'ii 79.400' • 1:,94i 230
L«te30,000
15.0C0170,8001
21S.S00J
112,500
sstiitsooj90.000
539,000
213,000
'•"if in 3 ,0007,000
.•s-S»7,000433,000
;:: 45s,ooc
S:;:;SS5;S;:Si>
' t.89t:3bo.
DeVELOPMEMT PROGRAMME FORRPWSNQQ
Up.
Ea
15
•SJSS-13
1510
10
73349
:*S£tt5
S:S5™03119
1,140.000
t.tw.ooo1,140,000
730.000
iSSMOOiOOO
Hmmii a730,000
932,0004,734,0003,420,000
"-S 8,740,000
2,353,0001,218,000
: : ;S3 ,572 ;ODO
ii-iii.bbo
1M4 - 2009PROJHCT ODIT
487,500
; «44T^0O487.500325,000
; rS:i«2,S00
325,000
;S:K329,000,227,500
2,047,5001,432,900
• 3.737J0O-
:":i>:*:Wi:-;i:;:61,007.500
920,000
:SJ;527,5OO
::a.3so.ooa
OaUW
88,500
:::S :« ,5O088,50099.000
;-:S:::i4>,S0O
Uttor
105,000
: « 105.000109.00070,000
::SS::179,000
59,000
:*:K4>:59,00O41,300
371,700235.SC0
sssws.sdd
70,000
JSSS; 70,00049.CC0
441,00031S. CCO
;:>:::::»OS.,O0O
smmmoi -a-^-f-tt132,900
94.400
g ;:ffi277,30b
s^isb.sbo
217.CC0112.0CO
:::H;^29.oco
;:S:-t;484.bQ0x
Ul
Ul