brussels – may 24th 2014 -...
TRANSCRIPT

Brussels – May 24th 2014

Real estate as investment Own property (“direct”)
Review Market situation / Situation as of today / Future ? Disadvantages of “direct” real estate
Investment property (“indirect”) Key characteristics
Investing “directly” or “indirectly” in real estate ?
REIT
Montea

Review market situation over the past 20 years
Property in Belgium was too cheap compared to our neighbours
Historically low interest rate
Mortgage loans were more flexible:
Longer terms Lower % ownership in mortgage credit Higher % disponsable income on mortgage loan
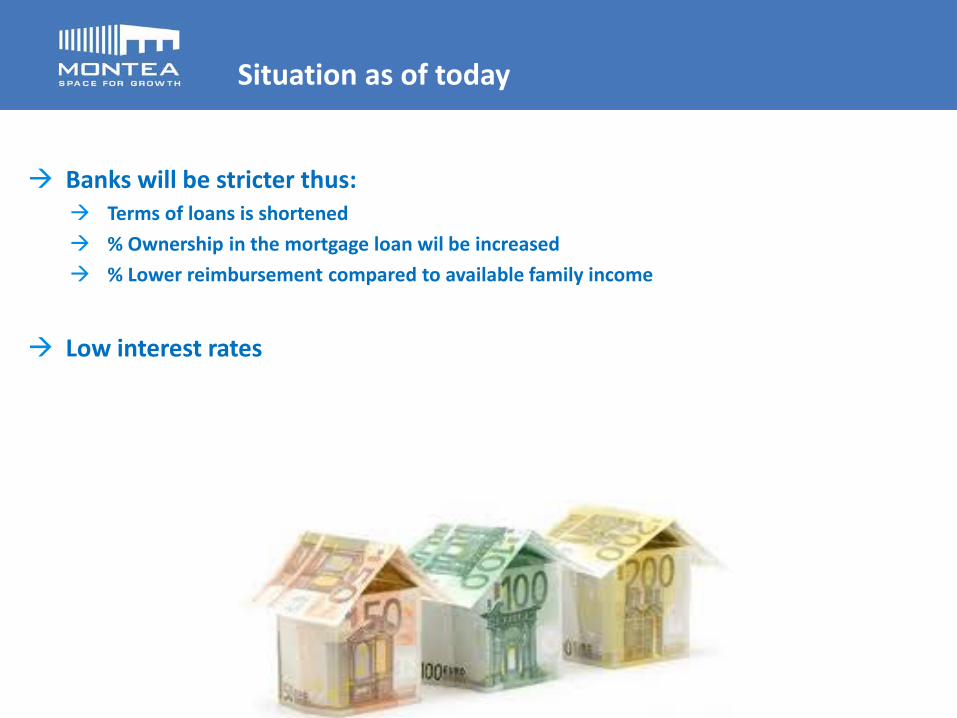
Situation as of today
Banks will be stricter thus:
Terms of loans is shortened % Ownership in the mortgage loan wil be increased % Lower reimbursement compared to available family income
Low interest rates

Future ?
⇒ Property prices will stabilize, no further significant increase or decrease
⇒ Young families will decide only later to purchase their first home and come thus back on the rental market
⇒ Rental market recovers
⇒ Retaining of residential real estate for rent is (again) more interesting
⇒ Property prices will stabilize, no further significant increase or decrease

Operational follow-up Stricter regulations Maintenance & renovation Unpaid invoices, forced house move, ...
Risk focused on one or a few properties
Heavy entry and exit costs because of high registration fees
Tax on property after 2014?
Disadvantages of “direct” real estate

Investing “indirectly” in real estate property
Investing in real estate companies Shares
Liquidity
Market risk
Possible dividend
Operational structure by specialists
Real Estate Investment Trust
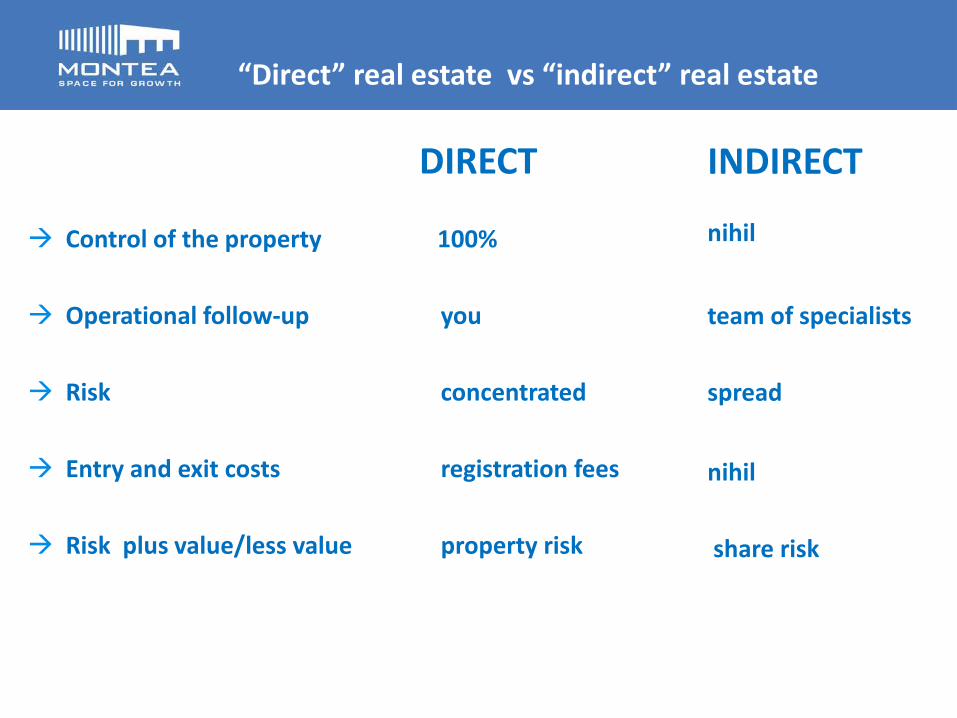
DIRECT Control of the property 100%
Operational follow-up you
Risk concentrated
Entry and exit costs registration fees
Risk plus value/less value property risk
“Direct” real estate vs “indirect” real estate
INDIRECT nihil
team of specialists spread
nihil share risk
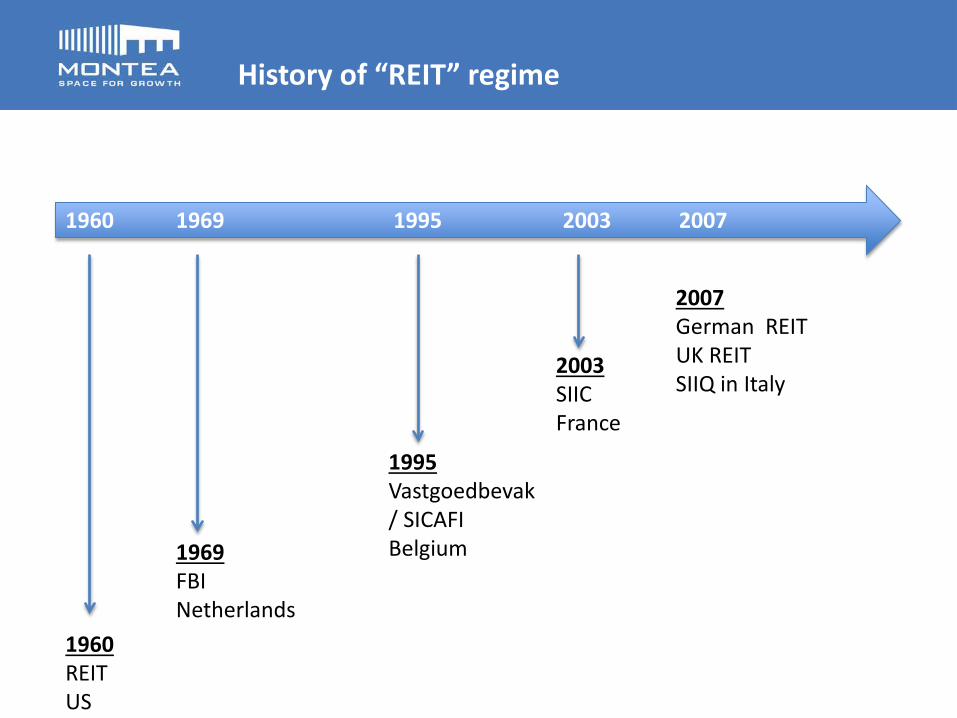
History of “REIT” regime
1960 1969 1995 2003 2007
1960 REIT US
1969 FBI Netherlands
1995 Vastgoedbevak / SICAFI Belgium
2003 SIIC France
2007 German REIT UK REIT SIIQ in Italy
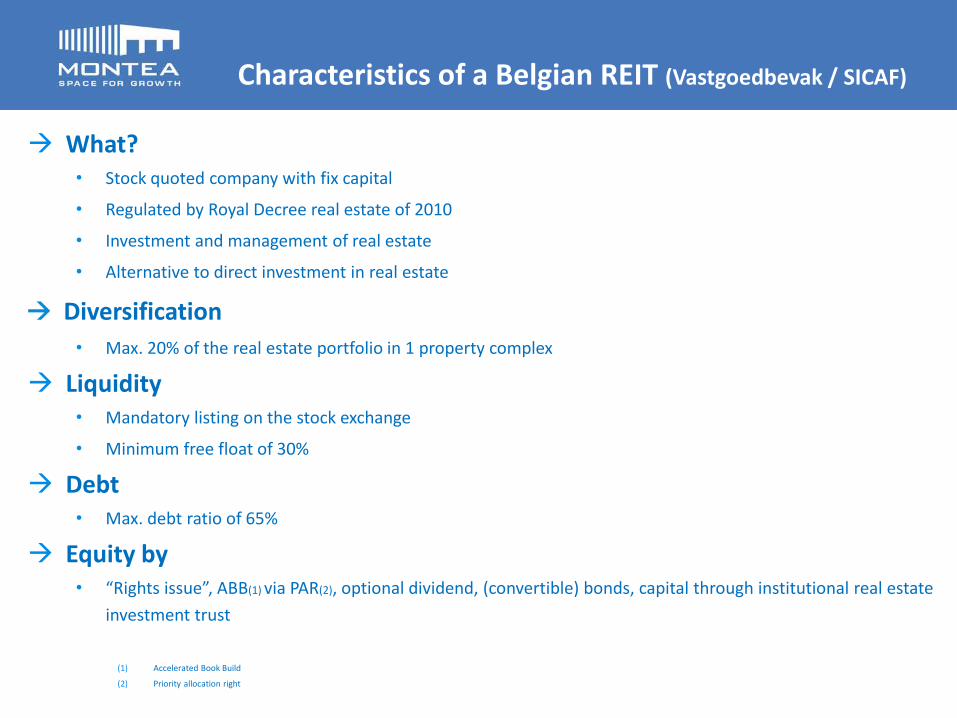
Characteristics of a Belgian REIT (Vastgoedbevak / SICAF)
What? • Stock quoted company with fix capital
• Regulated by Royal Decree real estate of 2010
• Investment and management of real estate
• Alternative to direct investment in real estate
Diversification • Max. 20% of the real estate portfolio in 1 property complex
Liquidity • Mandatory listing on the stock exchange
• Minimum free float of 30%
Debt • Max. debt ratio of 65%
Equity by • “Rights issue”, ABB(1) via PAR(2), optional dividend, (convertible) bonds, capital through institutional real estate
investment trust
(1) Accelerated Book Build
(2) Priority allocation right
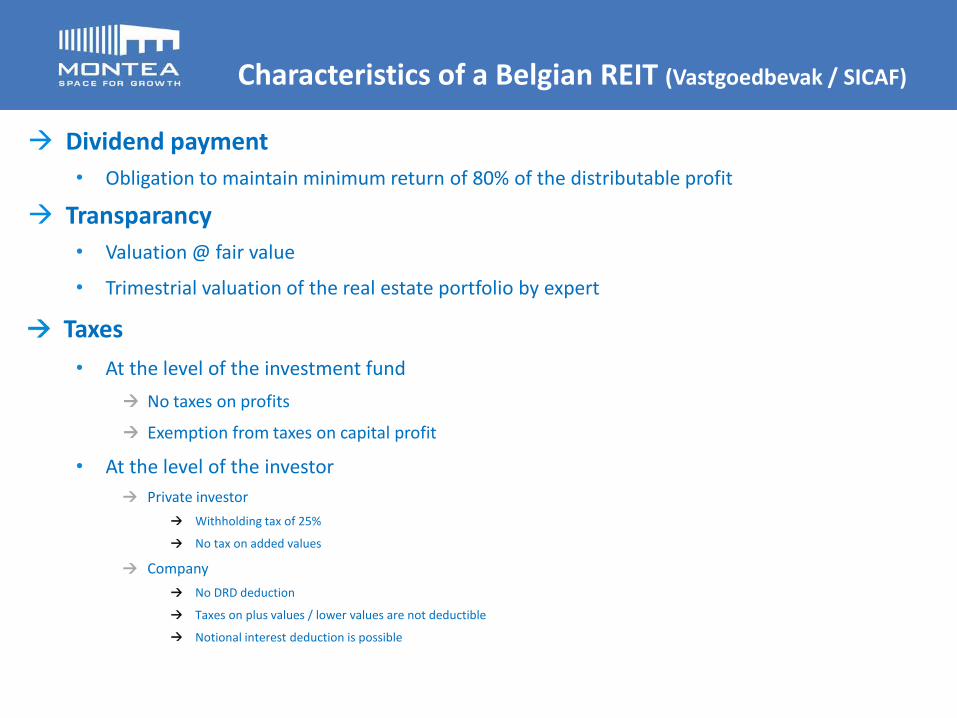
Dividend payment • Obligation to maintain minimum return of 80% of the distributable profit
Transparancy • Valuation @ fair value
• Trimestrial valuation of the real estate portfolio by expert
Taxes • At the level of the investment fund
No taxes on profits
Exemption from taxes on capital profit
• At the level of the investor Private investor
Withholding tax of 25%
No tax on added values
Company No DRD deduction
Taxes on plus values / lower values are not deductible
Notional interest deduction is possible
Characteristics of a Belgian REIT (Vastgoedbevak / SICAF)

“Total Gross Return” over 10 years
0
50
100
150
200
250
300
350
Dec-03
Apr-04
Aug-04
Dec-04
Apr-05
Aug-05
Dec-05
Apr-06
Aug-06
Dec-06
Apr-07
Aug-07
Dec-07
Apr-08
Aug-08
Dec-08
Apr-09
Aug-09
Dec-09
Apr-10
Aug-10
Dec-10
Apr-11
Aug-11
Dec-11
Apr-12
Aug-12
Dec-12
Apr-13
Aug-13
Belgian REITs Bel20 MSCI Europe EPRA European bonds
Source: Bank De Groof

13
Specialists vs Generalists
Offices in Brussels
Logistics in NL, BE and FR
Residential
Retail
Logistics & retail, offices, BE & Lux
Offices & logistics
Offices & retail
Everything & more
0
50
100
150
200
250
300
350
400
Dec-03
Apr-04
Aug-04
Dec-04
Apr-05
Aug-05
Dec-05
Apr-06
Aug-06
Dec-06
Apr-07
Aug-07
Dec-07
Apr-08
Aug-08
Dec-08
Apr-09
Aug-09
Dec-09
Apr-10
Aug-10
Dec-10
Apr-11
Aug-11
Dec-11
Apr-12
Aug-12
Dec-12
Apr-13
Aug-13
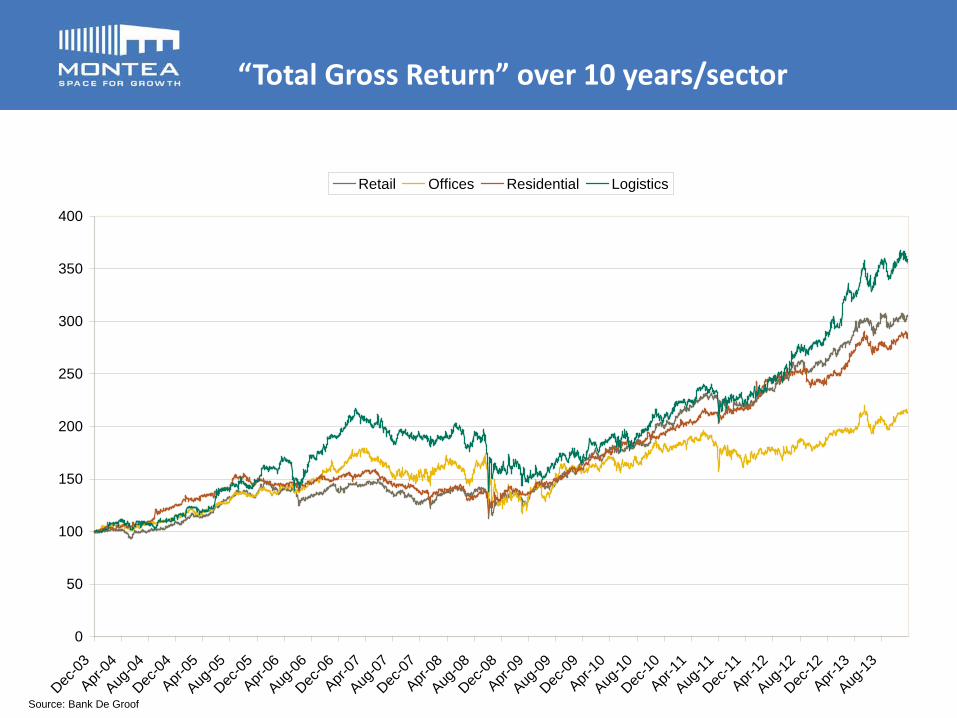
Retail Offices Residential Logistics
Source: Bank De Groof
“Total Gross Return” over 10 years/sector

Share price increased with 11,4% compared to last year (2012 increase was 15,8%)
Premium of 41%
velocity + 23% (yearly volume / avg. number of shares over period)
gross dividend yield of 6,2% / 18,5% gross return over 2013 / 9,5% over lifetime of Montea (Gross return = variance in share price + gross dividend devided by closing rate of last year)
0
20
40
60
80
100
120
140
160
180
200
Montea EPRA BEL20 MSCI Europe European bonds
Total gross return over 7 years (*)
(*) Source: Bank De Groof
Calculated on Bloomberg data as of 04/12/2013. “Gross Total Returns” include the reinvestment of gross dividend proceeds
Strong performance of Montea in stock market


Montea – Space for Growth
REIT (Sicafi - SIIC) listed on the NYSE Euronext Brussels & Paris since Oct. 2006
Development & Management of Logistic Real Estate Solutions …
… in Belgium, France and the Netherlands
FV Portfolio of 320m (*)
Market Cap. of EUR 216m (*)
(*) per 31/12/2013
17
Family De Pauw
21%
Belfius Insurance
13%
Banimmo
12% Federale Verzekering
10%
Family De Smet
4%
Free Float
39%

Warehousing • Land value has a higher share in the total
value than in other asset classes
• Life cycle of warehousing > other asset classes
• Renovation cost < than other RE asset classes
Pure player • Ambition to be best in class through
specialisation (Logistics, Real Estate & Finance)
• Ambition to be top of mind towards other market players (logistic players, brokers ...)
End investor No speculative development: therefore possible business partner for land owners and developers. Long term vision with focus on quality & sustainability (for example Blue Label)
400€/m²
45€/m²
200€/m²
Cost Logistic Development Prime Rent
Cost Land
Cost Development7,5%
2m² land for 1m² logistic development
3 key words
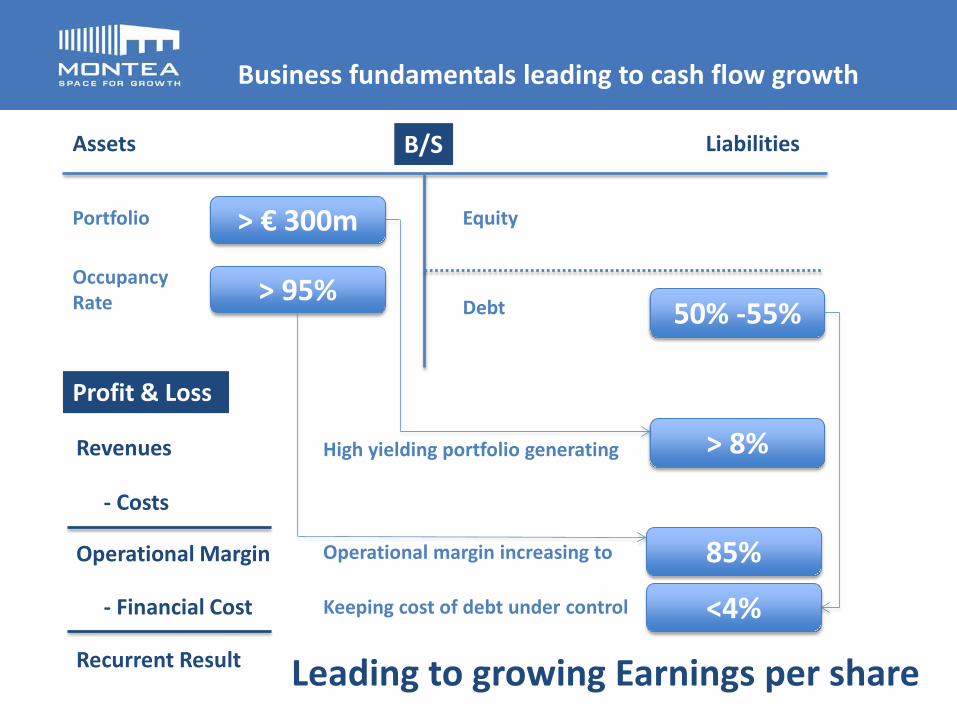
Assets Liabilities
Revenues
Occupancy Rate
Portfolio
B/S
Profit & Loss
- Costs
Operational Margin
- Financial Cost
Recurrent Result
Equity
Debt > 95%
85% Operational margin increasing to
> € 300m
> 8% High yielding portfolio generating
<4% Keeping cost of debt under control
50% -55%
Leading to growing Earnings per share
Business fundamentals leading to cash flow growth

Debt ratio of 52,8%
“Interest coverage ratio” of 3,21
Finance charge of 3,96% @ YE
Creditline138,0 79%
Leasing 5,0 3%
Bond; 29,6 18%
Composition of financial debts (€ K) EUR 172,6m
26,7
50,0
26,7 40,0
26,7
2014 2015 2016 2017 2018
Refinancing of Creditines (€ m)
Belfius 25%
ING 29%
KBC 18%
BNP Paribas Fortis 25%
Bank De Groof
3%
Composition of creditlines (%) EUR 138m
Total of EUR 160 m EUR 22m undrawn
20
Maturity of total debt of 3,2 years
Maturity of “IRS”-contracts of 5,8 years
“Hedge Ratio” of 82,2%
Solid financial structure – Debt financing

21
Highlights – Investment Activity of EUR 40,6 m
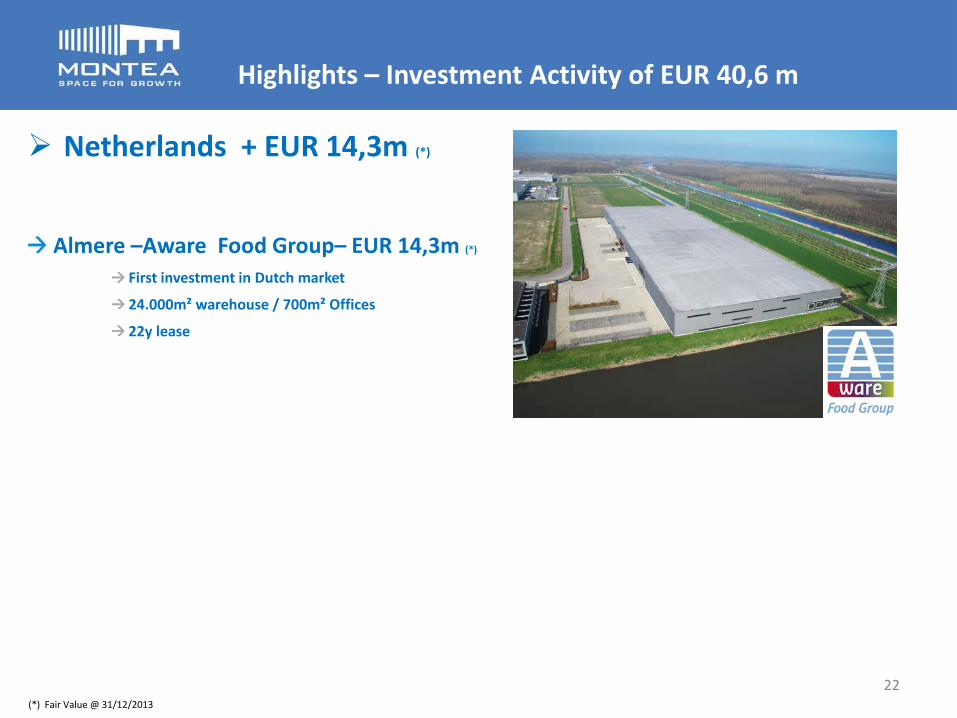
Netherlands + EUR 14,3m (*)
Almere –Aware Food Group– EUR 14,3m (*)
First investment in Dutch market
24.000m² warehouse / 700m² Offices
22y lease
22 (*) Fair Value @ 31/12/2013
Highlights – Investment Activity of EUR 40,6 m

BELGIUM Puurs, Schoonmansveld 13.252 m² Nijvel 11.000 m² Puurs, Rijksweg 12.000 m² Vorst 23.514 m²
FRANCE Savigny-le-Têmple 15.000 m² Feuquières-en-Vimeu 20.830 m² Bondoufle 3.000 m²
Portfolio -> 100.000 m² development potential on existing sites
23
Partnership agreement with MG Real Estate Development of Logistics Park MG De Hulst
Partnership in bundling commercial efforts & development cost
Reference for sustainable logistics park
Total of 40 ha
Development potential of 150.000 m² / Estimated investment volume of EUR 120 mio
Highlights – Development potential
Strong financial Results Increase of Net Rental Result with 18,7%
Operational Margin of 84,1%, in line with 2012
Financial cost < 4% - Avg. cost of 3,92%
NCR of EUR 13,5m (EUR 2,05 per share) – growth of 20% compared to last year
Reinforcement of solid financing structure Successful placement of EUR 30m bonds @ 4,107% -> diversification of financing
Reinforcement of equity through: Optional dividend: 50% of shareholders choose for the optional dividend EUR 4,1m equity increase
Contribution in kind of EUR 6,5m to finance the logistics platform rented to SAS Automotive in Gent Zeehaven
Other Change in Board of Directors 3 new directors
New branding of Montea leading to new website
24
Highlights – Financials

2,22 2,36
2,08
1,79 1,82
2,00 2,05 1,99 2,09 2,09
1,84 1,84 1,93 1,97
2007 2008 2009 2010 2011 2012 2013
Evolution of Net Current Result & Dividend
5,9%
6,8%
8,5%
7,7%
7,5%
6,8%
(1) 1,84 is the add-up of EUR 0,97 per share for the first half of 2010 (before the capital increaese) and EUR 0,87 per share for the 2nd half of 2010 (after the capital increase)
(1)
25
6,2%
+2,5% +2,1%
Distribution%
96,5% Distibution%
96,1%
Evolution of NCR and dividend (€/share)


27
Kissing is like real estate. The most important thing is

28
Kissing is like real estate. The most important thing is
Location Location
LOCATION

29
European logistics map

180 58%
118 38%
14 5%
Nr of sites: 35 Fair Value (€m): 311,94 m²: 584.694 Contractual Rent k€): 26,1 Occupancy rate (*): 94,9% Yield (**): 8,7%
Nr of sites: 1 Fair Value (€m): 14 m²: 25.848 Contractual Rent €m): 1,2 Occupancy rate (*) : 100,0% Yield (**): 7,6%
Nr of sites: 19 Fair Value (€m): 180 m²: 340.181 Contractual Rent €m): 14,1 Occupancy rate (*) : 90,9% Yield (**): 8,3%
Nr of sites: 15 Fair Value (€m): 118 m²: 218.666 Contractual Rent €m): 10,8 Occupancy rate (*) : 100,0% Yield (**): 8,6%
(*) At the end of the period based upon m²
(**) (Contractual yearly income + ERV on vacancy) devided by the investment value
Portfolio in Belgium, France & the Netherlands

31
101 124
157 152 140 145 165 180
13
54 54 92 102
118 118
14
8
8
8
101 137
211 206 232
255 291
320
okt/06 2007 2008 2009 2010 2011 2012 2013
Belgium France Netherlands Solar Panels Total
+225%
Portfolio growth with > 225% since IPO
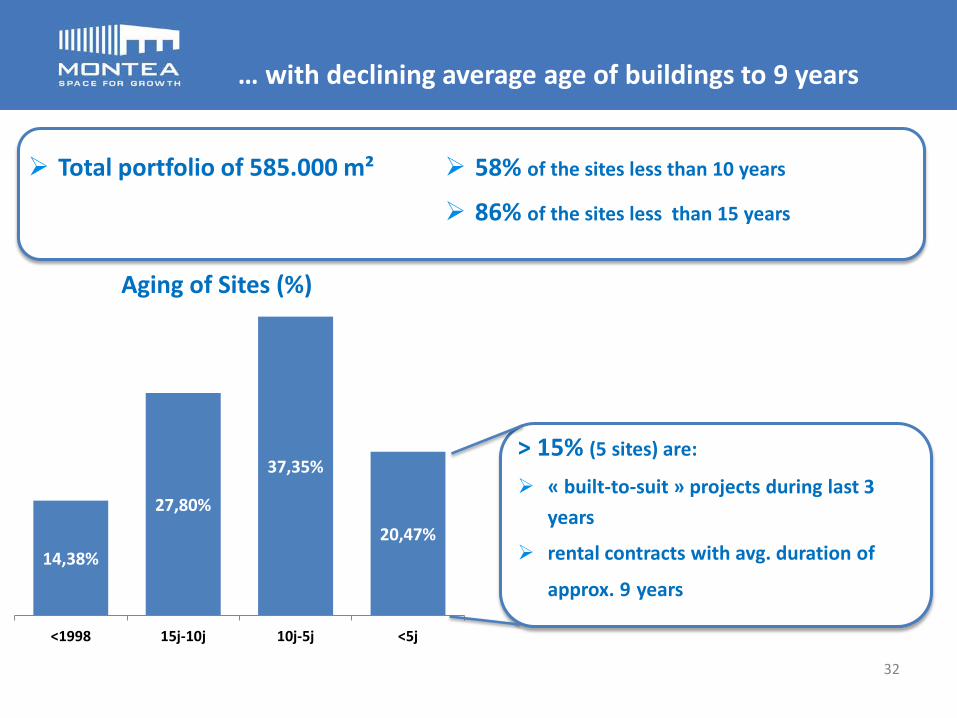
14,38%
27,80%
37,35%
20,47%
<1998 15j-10j 10j-5j <5j
Aging of Sites (%)
Total portfolio of 585.000 m²
32
> 15% (5 sites) are:
« built-to-suit » projects during last 3 years
rental contracts with avg. duration of
approx. 9 years
58% of the sites less than 10 years
86% of the sites less than 15 years
… with declining average age of buildings to 9 years

VDAB
45% 55%
End- users
Logistic Players
Break-down by type Tenant
Top 15 customer for > 70% of rental income
13,1%
12,8%
4,5%
4,3% 4,2% 3,6%
3,4%
3,2%
3,0%
3,0%
2,5%
2,5%
2,4%
2,4% 2,3%
2,2% 2,2%
88%
Semi- Industrial
Logistic
Break-down by type Site
72% > EUR 500K Yearly Rental Income
Total of 61 customers
with a high qualitative client portfolio

96,6% 95,6% 92,9%
95,1% 96,5% 96,3% 94,9%
2007 2008 2009 2010 2011 2012 2013
Long term Target: > 95,0% (1)
(1) At the end of the period based upon m²
(2) Untill first break
5,3
2013Excl. Solar panels Impact Solar Panels
Long term Target: > 6y (2)
5,7
Historical occupancy rate > 95% 28.000m² vacancy in Belgium
due to 2 sites: Herentals Nijvel
Logistics business knows by 3,6,9 contracts
Increased from 3,5 years in 2010
Mix between End users & Logistics players
34
with occupancy & maturity under control

35
101 124 157 152 140 145 165 180
236 13
54 54 92 102 118
118
119 14
41
8 8
8
7 20
101 137
211 206 232 255
291 320
423
okt/06 2007 2008 2009 2010 2011 2012 2013 2014
Belgium France Netherlands Solar Panels Ambition Total
And ambition to grow portfolio in 2014 with > 30%
36
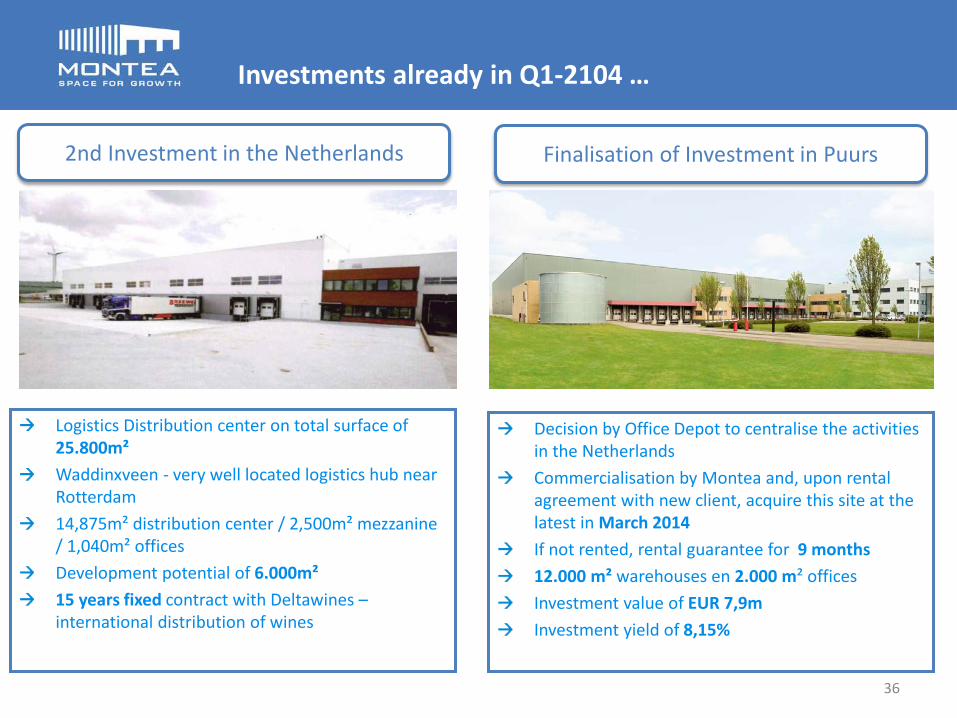
Decision by Office Depot to centralise the activities in the Netherlands Commercialisation by Montea and, upon rental agreement with new client, acquire this site at the latest in March 2014 If not rented, rental guarantee for 9 months 12.000 m² warehouses en 2.000 m² offices Investment value of EUR 7,9m Investment yield of 8,15%
Logistics Distribution center on total surface of 25.800m² Waddinxveen - very well located logistics hub near Rotterdam 14,875m² distribution center / 2,500m² mezzanine / 1,040m² offices Development potential of 6.000m² 15 years fixed contract with Deltawines – international distribution of wines
2nd Investment in the Netherlands Finalisation of Investment in Puurs
Investments already in Q1-2104 …
37
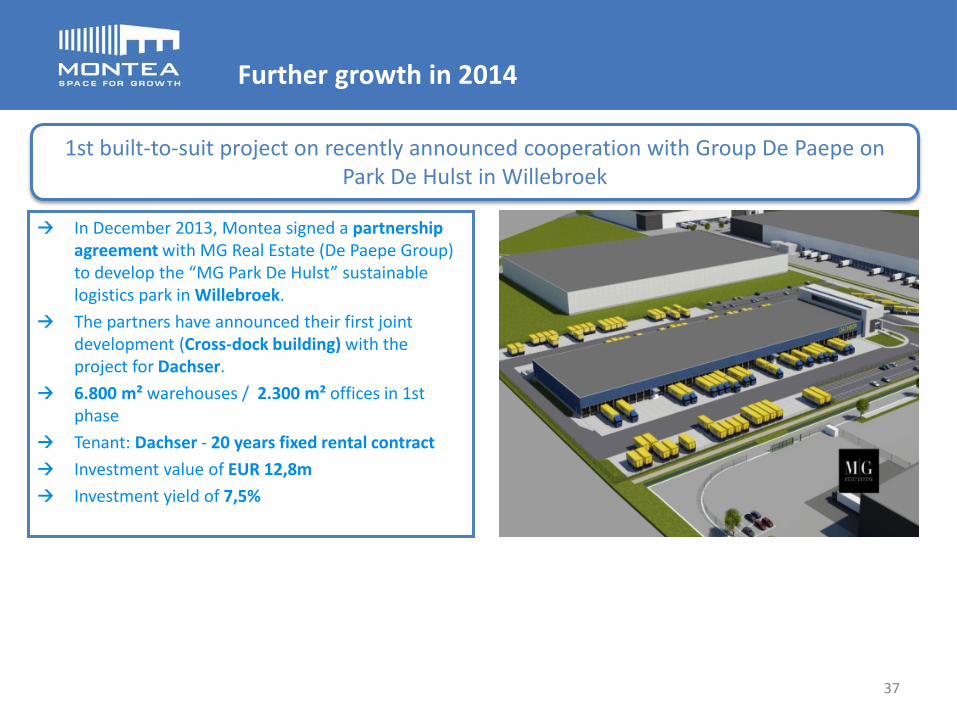
In December 2013, Montea signed a partnership agreement with MG Real Estate (De Paepe Group) to develop the “MG Park De Hulst” sustainable logistics park in Willebroek. The partners have announced their first joint development (Cross-dock building) with the project for Dachser. 6.800 m² warehouses / 2.300 m² offices in 1st phase Tenant: Dachser - 20 years fixed rental contract Investment value of EUR 12,8m Investment yield of 7,5%
1st built-to-suit project on recently announced cooperation with Group De Paepe on Park De Hulst in Willebroek
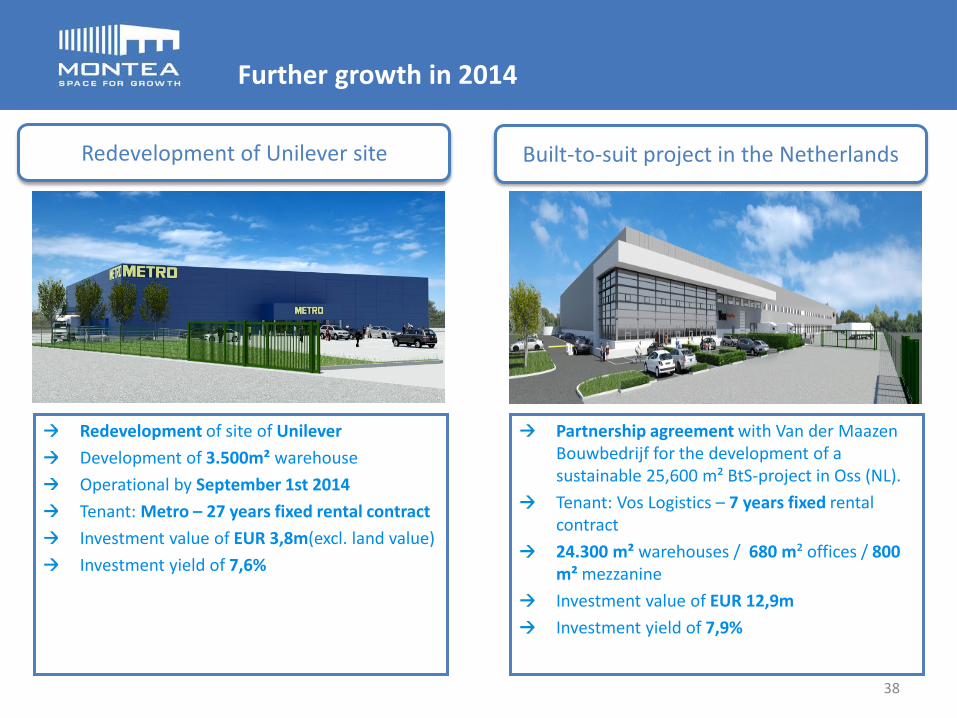
Further growth in 2014
38
Partnership agreement with Van der Maazen Bouwbedrijf for the development of a sustainable 25,600 m² BtS-project in Oss (NL). Tenant: Vos Logistics – 7 years fixed rental contract 24.300 m² warehouses / 680 m² offices / 800 m² mezzanine Investment value of EUR 12,9m Investment yield of 7,9%
Redevelopment of site of Unilever Development of 3.500m² warehouse Operational by September 1st 2014 Tenant: Metro – 27 years fixed rental contract Investment value of EUR 3,8m(excl. land value) Investment yield of 7,6%
Redevelopment of Unilever site Built-to-suit project in the Netherlands
Further growth in 2014

19/02/2014 – Announcement of Rental Agreement with Caterpillar Distribution Services Europe •9 years contract beginning @ january 1st 2015
•DHL leaving site in March 2014
•Redevelopment of site (29,500m² warehouses + 2,350m² offices + extension of 30,000m²)
•50-50 with WDP
39
Further growth in 2014 – redevelopment of Grimbergen

40
Growth in 2014
Further development of Park De Hulst Willebroek (based upon partnership agreement) BTS of 13.065m² warehouse / 1.000 offices Operational by November 1st 2014 Tenant: US based packaging multinational – 9,6/15 years contract Investment value of EUR 9,6m Investment yield of 7,5%
Further development of Park De Hulst Willebroek (based upon partnership agreement) BTS of 19.000m² warehouse / 500m² offices Operational by September 1st 2014 Tenant: Neovia – 5/10 years contract (Logistics provider of Caterpillar) Investment value of EUR 13,3m Investment yield of 8,1%
2nd built-to-suit project on De Hulst 3rd built-to-suit project on De Hulst

41
2014 2013 2012
Portfolio Fair Value (€m) > 420 m 319,3 291,6
Occupancy (based upon m²) (%) 95% 94,9 96,3
Avg. Duration (excl. IAS 39) (y) 6y 5,7 5,6
Yield (%) if 100% rented 8,35 7,94
P&L Net Rental Result (€m) 23,7 19,9
Operational Margin (%) 85,0 84,1 84,1
Financial Cost (%) <4,00 3,94 3,84
Net Current Result (€m) +14,8 13,5 11,25
Net Current result / share (€) 2,05 2,00
B/S NAV / share (excl. IAS 39) (€) 22,43 22,17
Stock rate (€) 31,65 28,40
Debt Ratio (%) 55,0 52,8 51,3
+10%
+19%
+20%
+11% +11%
+10%
+30%
Leading to an Ambition for 2014 of …

Site Mechelen
“We literally offer our clients the
“space to grow” through flexible, innovative property solutions.
Growth is the goal we share with our clients, investors and partners.”